Analysis of electrical and piezoresistive properties of mortar reinforced with carbon microfibers
Abstract
Multifunctional mortars have been developed for applications in self-sensing systems, electromagnetic shielding, cathodic protection, and other areas. To achieve this, it is necessary to incorporate conductive materials, which often reduce mechanical properties, making their use challenging. Carbon microfiber can improve the durability of cementitious composites through its physical and mechanical properties. This research aims to find a reinforced mortar composition based on the limits of the NBR 11173 standard, balancing mechanical and electrical properties, such as conductivity and impedance, using carbon microfiber ~ 4 mm length. It was produced with a mix proportion of 1:2:0.45 (cement:sand:water/cement ratio) and the addition of 0.2 to 1.2% (by cement mass) of carbon microfiber. Compared to the reference mix, the results showed an increase of 30.17% in flexural strength and 11 times in electrical conductivity with the addition of 0.6% carbon microfiber. This demonstrates the potential of this mix for further research into the application of reinforced mortars with electrical properties. Therefore, it can be concluded that the studied mix proportion has potential for the development of further research aimed at the application of mortars with electrical properties.
Keywords
Mortar; Electrical impedance; Piezoresistivity; Carbon
Resumo
Argamassas multifuncionais têm sido desenvolvidas para aplicações em sistemas de autossensoriamento, blindagem eletromagnética, proteção catódica, entre outras. Para isso, é necessário incorporar materiais condutivos, que, muitas vezes, causam a diminuição das propriedades mecânicas, tornando seu uso um desafio. A microfibra de carbono pode melhorar a durabilidade do compósito cimentício, por meio de suas propriedades físicas e mecânicas. Essa pesquisa teve por objetivo encontrar uma composição de argamassa armada baseada nos limites da norma NBR 11173, balanceando propriedades mecânicas e elétricas, como condutividade e impedância, usando microfibra de carbono com ~ 4 mm de comprimento. Foram produzidas argamassas de traço 1:2:0,45 (cimento:areia:relação água/cimento) com adição de 0,2 a 1,2% (em massa de cimento) de microfibra de carbono. Em relação ao traço de referência, os resultados mostraram aumento de 30,17% na resistência à flexão na tração e de 11 vezes na condutividade elétrica com adição de 0,6% de microfibra de carbono. Isso mostra que este traço tem potencial para o desenvolvimento de mais pesquisas que visem a aplicação de argamassas armadas com propriedades elétricas.
Palavras-chave
Argamassa; Impedância elétrica; Piezorresistividade; Carbono
1 Introduction
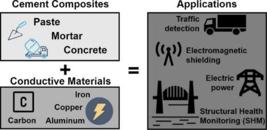
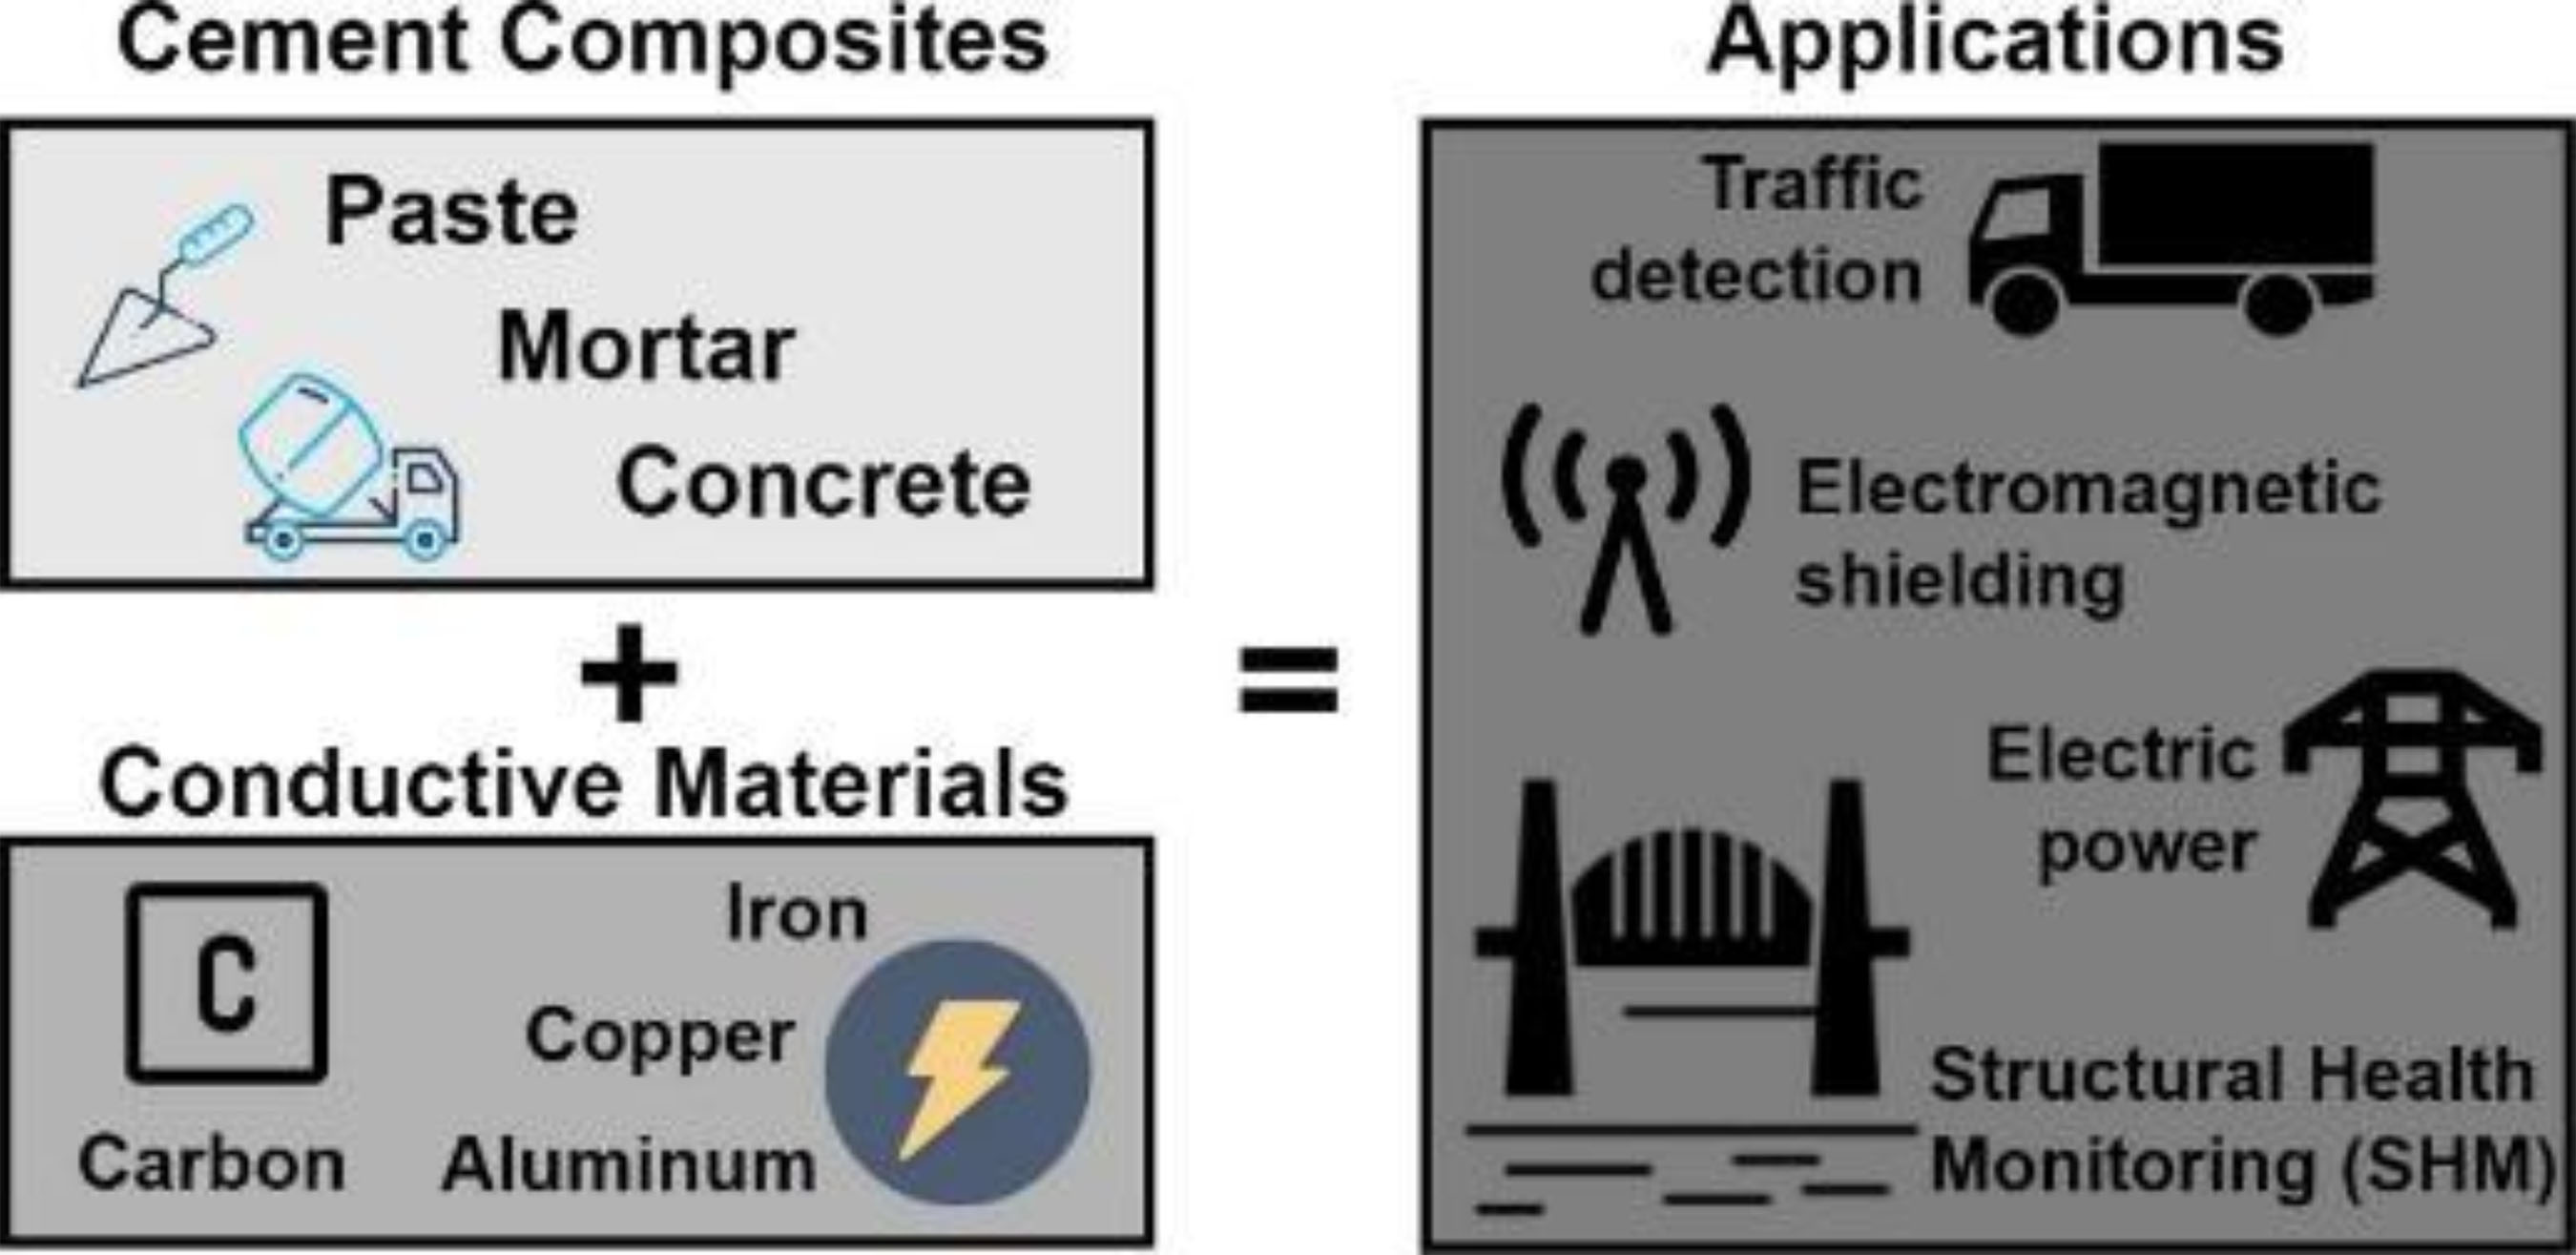
Cement composites with electrical properties are considered multifunctional, as studies of their applications involve uses such as electrical grounding, cathodic protection, ice and snow melting, electromagnetic shielding, vehicle traffic monitoring, structural health monitoring (SHM), among other functionalities, which can make them more efficient and environmentally friendly, when compared to traditional methods (Wang; Aslani, 2019), such as embedding or coupling electrical resistance strain gauges into the structure, piezoelectric strain sensors or optical sensors for evaluation and monitoring purposes (Bekzhanova; Memon; Kim, 2021). However, a conventional cement composite, whether in the form of concrete, mortar, or paste, is considered a poor conductor of electricity. Therefore, to modify its conductivity, it is necessary to incorporate electrically conductive materials (Figure 1) into its composition (Wang; Aslani, 2021).
When applied to Structural Health Monitoring (SHM), concrete with electrical properties self-monitors while acting as a structural element, providing support. This eliminates the need for specific sensors, as the new concrete is sensitive to detecting stresses and deformations resulting from the forces acting on the structure (Huo et al., 2019; Demircilioğlu et al., 2022). In addition to self-monitoring properties such as stress and strain, a cement composite with electrical properties can have sensitivity to detect variations in temperature, humidity, and pH, which, together with other variables, seeks to detect possible failures in the structure so that interventions can be carried out to prevent further damage (Birgin; D'Alessandro; Ubertini, 2023; Mo et al., 2020).
This ability of a cementitious composite, be it a paste, mortar, or concrete, to self-monitor without a specific sensor is also called self-sensing. This ability, when based on the piezoresistive effect, depends on the modification of the electrical properties of the cement composite, which is usually achieved by incorporating electrically conductive materials into the cement matrix (Segura et al., 2019; Scholle; Sinapius, 2021).
The next section presents a brief literature review on self-sensing cementitious composites with the incorporation of carbon fibers: the main object of study of this work. Although the present research does not aim to fully explore this topic, the initial results obtained are promising. They indicate insights and challenges for future research that seeks to employ carbon microfibers in structural mortars with electrical and piezoresistive properties.
2 Literature review
2.1 Electrical and piezoresistive properties of cement composites
The incorporation of various electrically conductive materials into Self-sensing Cement Composites (SSCCs) has been the subject of several studies, including the incorporation of graphite, carbon fiber, steel fiber, copper powder, and others. Carbon-based nanomaterials have gained prominence in this incorporation. However, the production costs of these materials remain high. Therefore, their production must be simplified to reduce costs and allow their use in the construction industry (Tian et al., 2019; Wang; Aslani, 2019; Frąc; Pichór, 2020).
It is not just the high cost of nanomaterials that impacts SSCC production, but also environmental factors. These factors can include variations in temperature, humidity, chlorides, and carbon dioxide to which the structures are exposed. When combined with the various types of loads affecting the structures, these factors make SSCC application even more challenging (Han et al., 2020; Das et al., 2019).
Another factor that can significantly influence the conductivity of cement composites goes beyond environmental factors and the presence of electrically conductive materials. This factor refers to the presence or absence of water encapsulated in the pores. This water can serve as a connecting element between conductive particles that may not be in direct contact, as it allows hydrated ions to move freely in the water, acting as carriers of electrical current. This phenomenon occurs for an intermittent period. However, especially during the curing process, the reduction in conductivity is significant in the first 28 days (Yoo; You; Lee, 2017; Chuang et al., 2017).
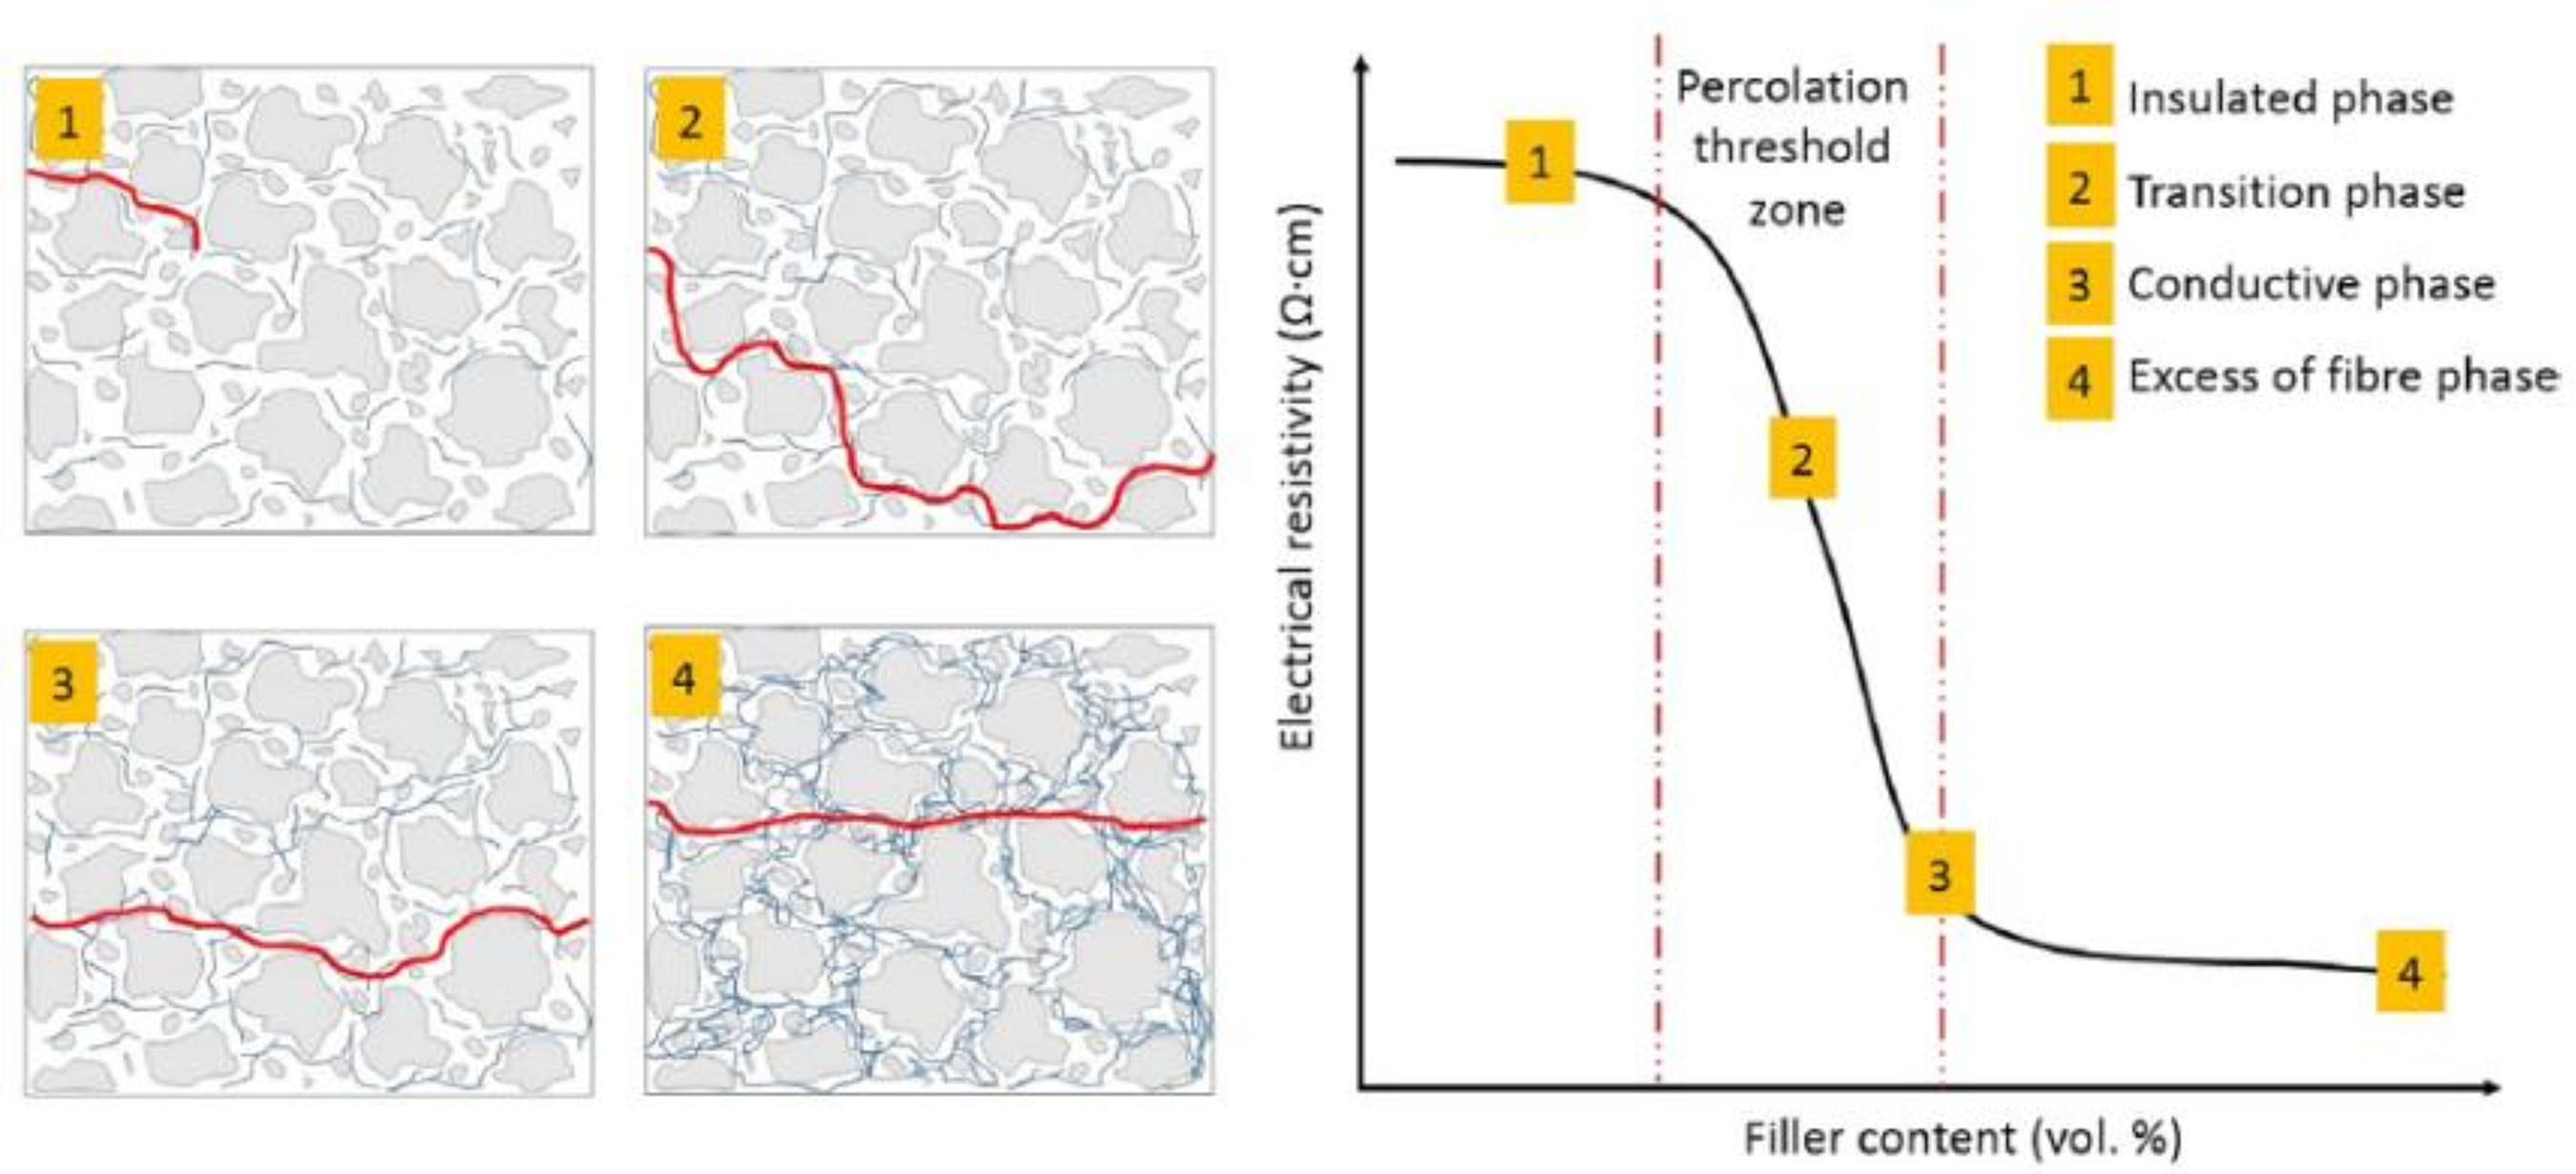
The mechanism of electrical conductivity goes beyond the presence of water and conductive materials, as it involves aspects such as the effect of the percolation threshold and quantum tunneling, which are present in the literature to explain this mechanism of electrical conductivity in cement composites (Han et al., 2020). The electrical percolation threshold can be defined as an abrupt transition zone (zone 2 in Figure 2) between the insulating phase and the phase of significant increase in electrical conductivity. In this case, there is a reduction in electrical resistivity due to the increased incorporation of electrically conductive material (Haghgoo; Ansari; Hassanzadeh-Aghdam, 2022).
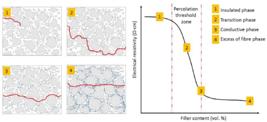
Graphical correlations of conductive paths (red) and variation in the addition of conductive material in the cement composite
Due to the random distribution of electrically conductive materials in a cement composite, these materials are often close to each other but not connected. If this proximity is extremely small, quantum tunneling may occur (Chuang et al., 2017). This effect allows an electron to jump from one conductive particle to another, even if there is no direct contact between the particles. However, this effect generates a higher electrical resistivity than if there were direct contact between the particles (García-Macías et al., 2017; Irfan et al., 2021).
Another extremely relevant factor in the electrical behavior of cement composites is the fact that they do not have purely ohmic behavior. Such composites behave similarly to dielectric materials (D’Alessandro et al., 2014; Downey et al., 2018). In this sense, the evaluation of its electrical properties can be influenced by the type of electrical current used, that is, direct current (DC) or alternating current (AC).
The use of the DC power supply method in a system for measuring the electrical properties of cement composites is considered simpler and low cost (Chuang et al., 2017) than AC power. However, the DC method has the disadvantage of the polarization effect, which negatively affects the stability of initial resistance readings. This effect occurs due to the dielectric properties of some materials, which are related to electrical resistance and capacitance (Chung, 2021a, 2021b; Chung; Xi, 2022). The movement of free ions present in the cement matrix, upon electrical excitation, causes the polarization effect. This effect produces an electric field in the opposite direction of the current flow, leading to an increase in resistivity for a certain period of time (Dehghani; Aslani, 2021a).
In the case of using AC to analyze the electrical properties of cementitious composites, electrical conductivity can be influenced by the electrical capacitance of the composite (Segura et al., 2019). With AC power, the measurement result is electrical impedance and not necessarily electrical resistance. This is due to the possibility of there being inductors and/or capacitors, which cause reactance (Sarwary et al., 2019).
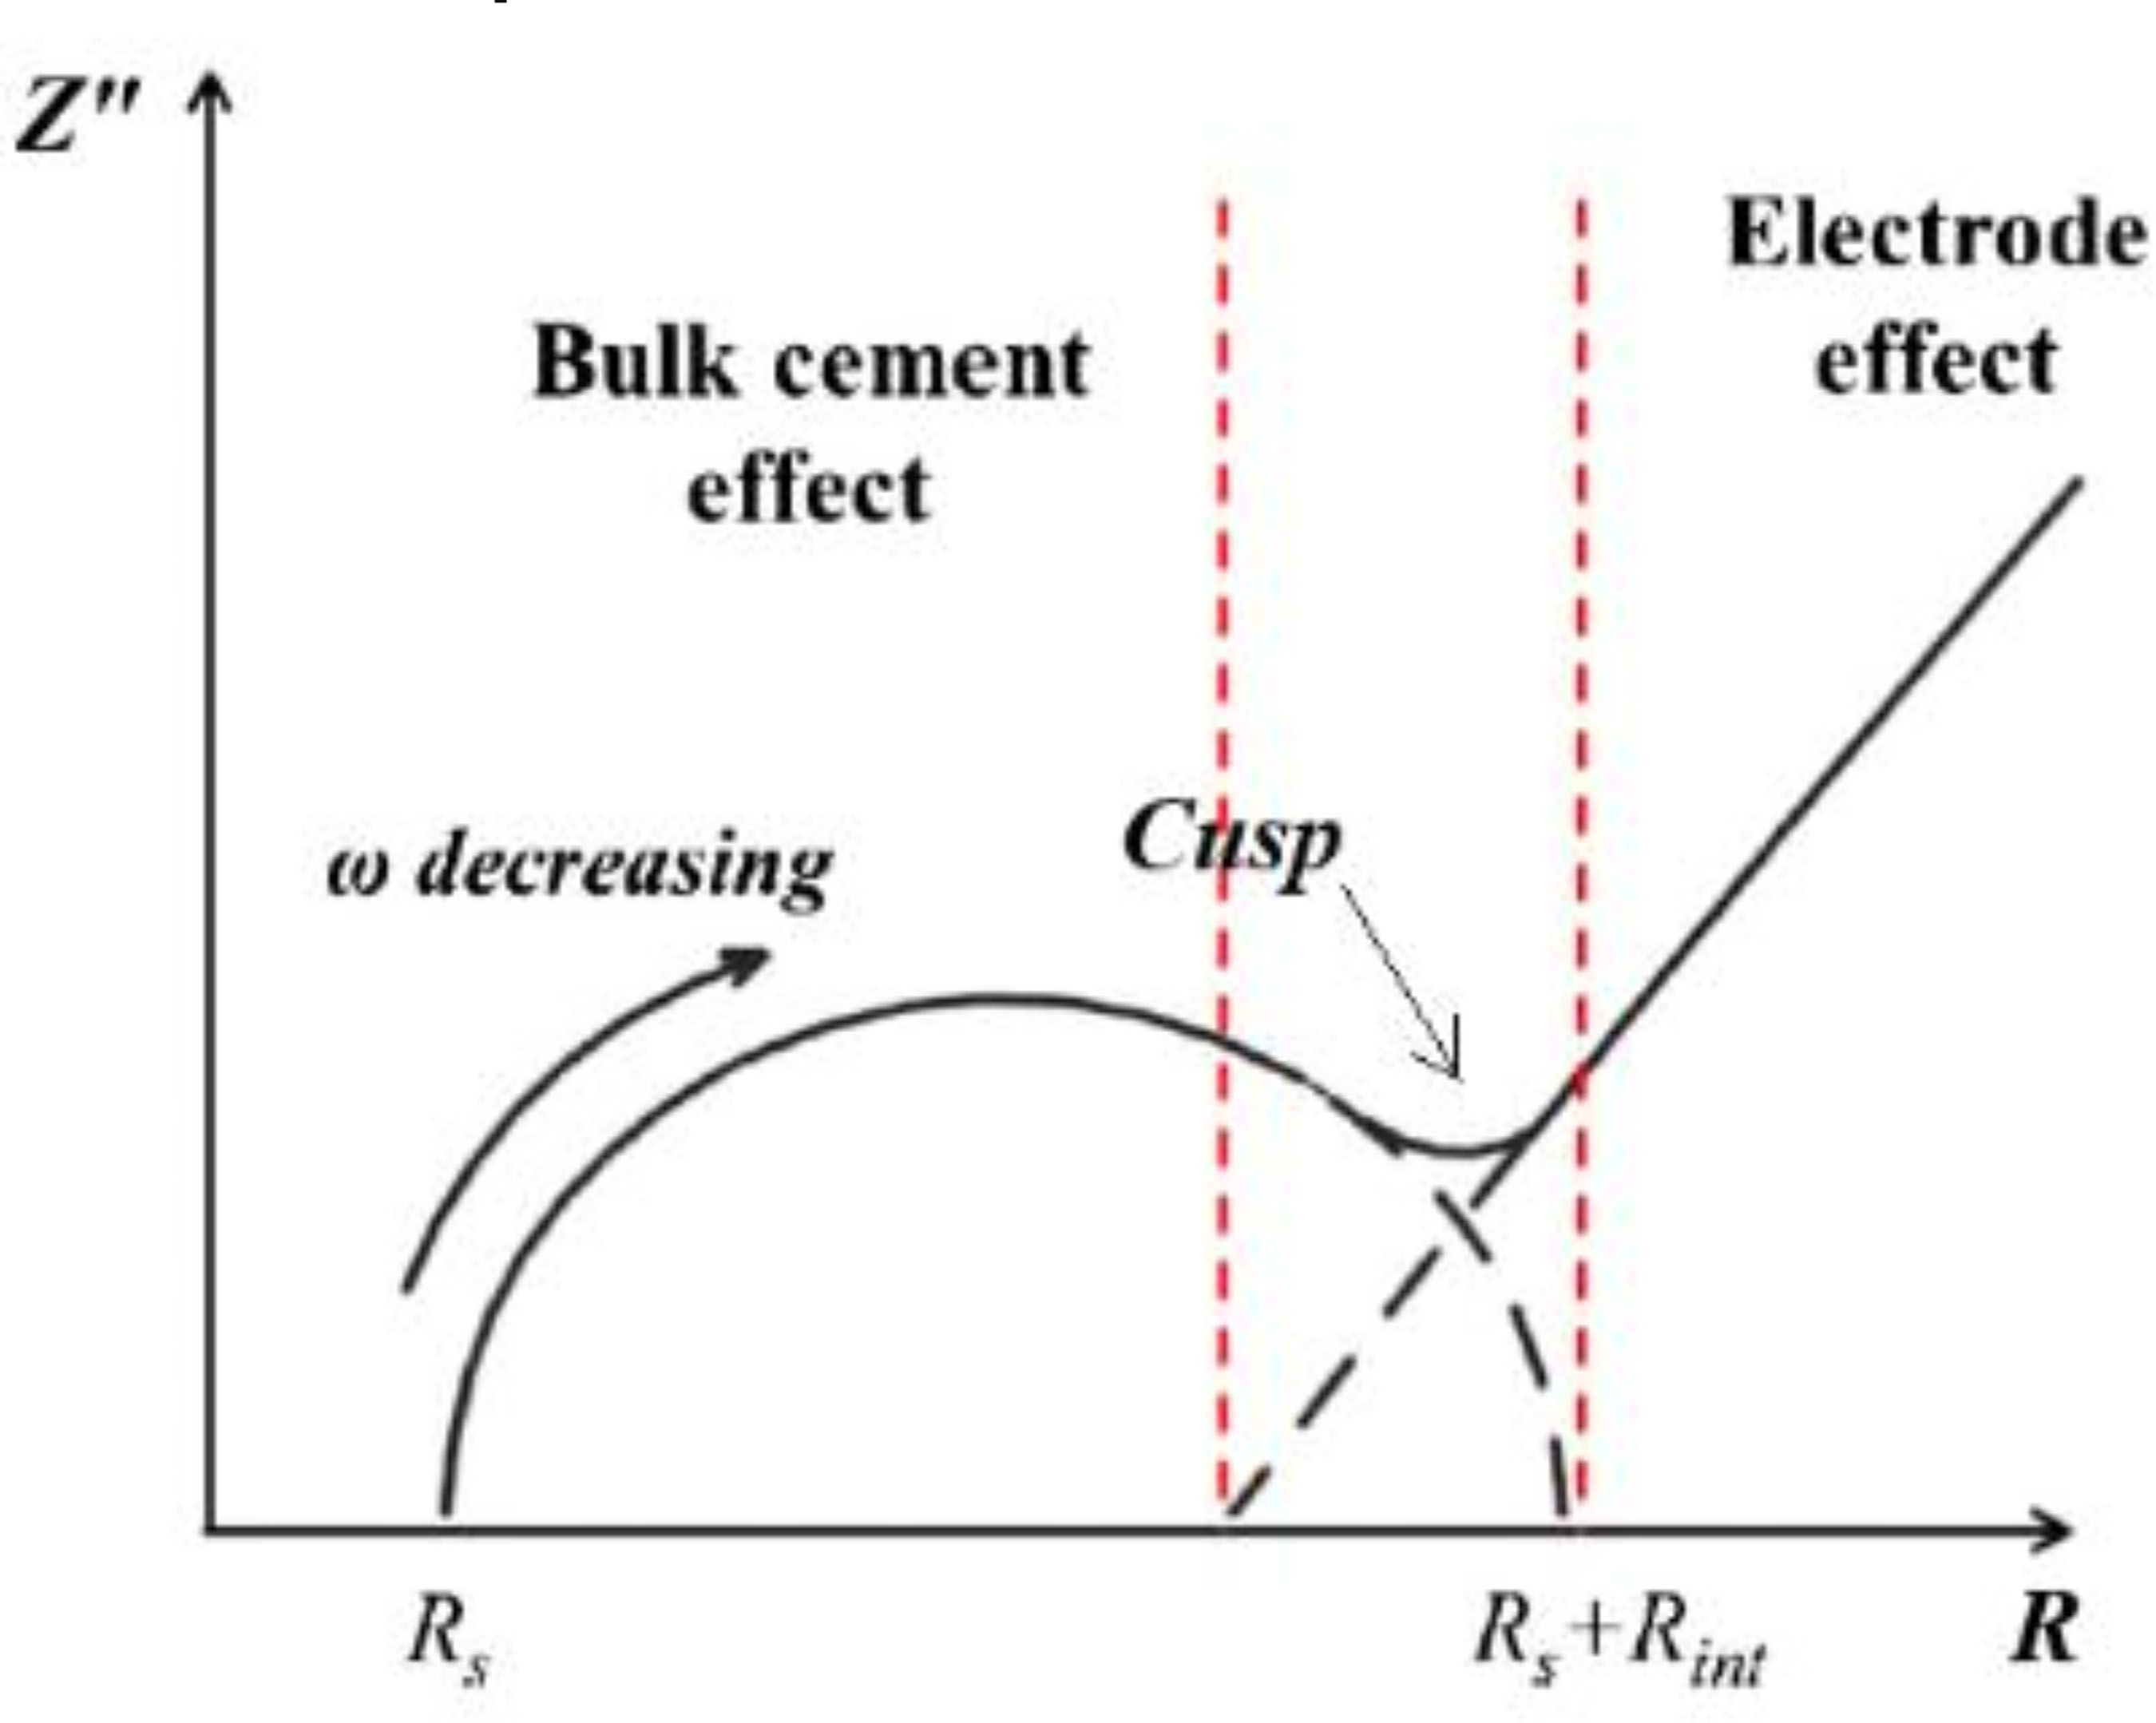
Thus, the analysis of electrical parameters of cement composites can contribute to the study of properties such as porosity, hydration, corrosion, and permeability (Ramachandran et al., 2022) and electrical conductivity. One way to analyze the electrical behavior of materials under different AC frequencies (ω) is by constructing the Nyquist diagram (Figure 3). In this diagram, the y-axis represents the imaginary impedance (Z'') and the x-axis represents the electrical resistance (R). For a cementitious composite, there is the electrical resistance of the solid and liquid (Rs) and the electrical interface resistance (Rint), which is due to the electrode.
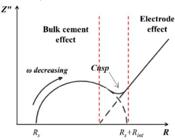
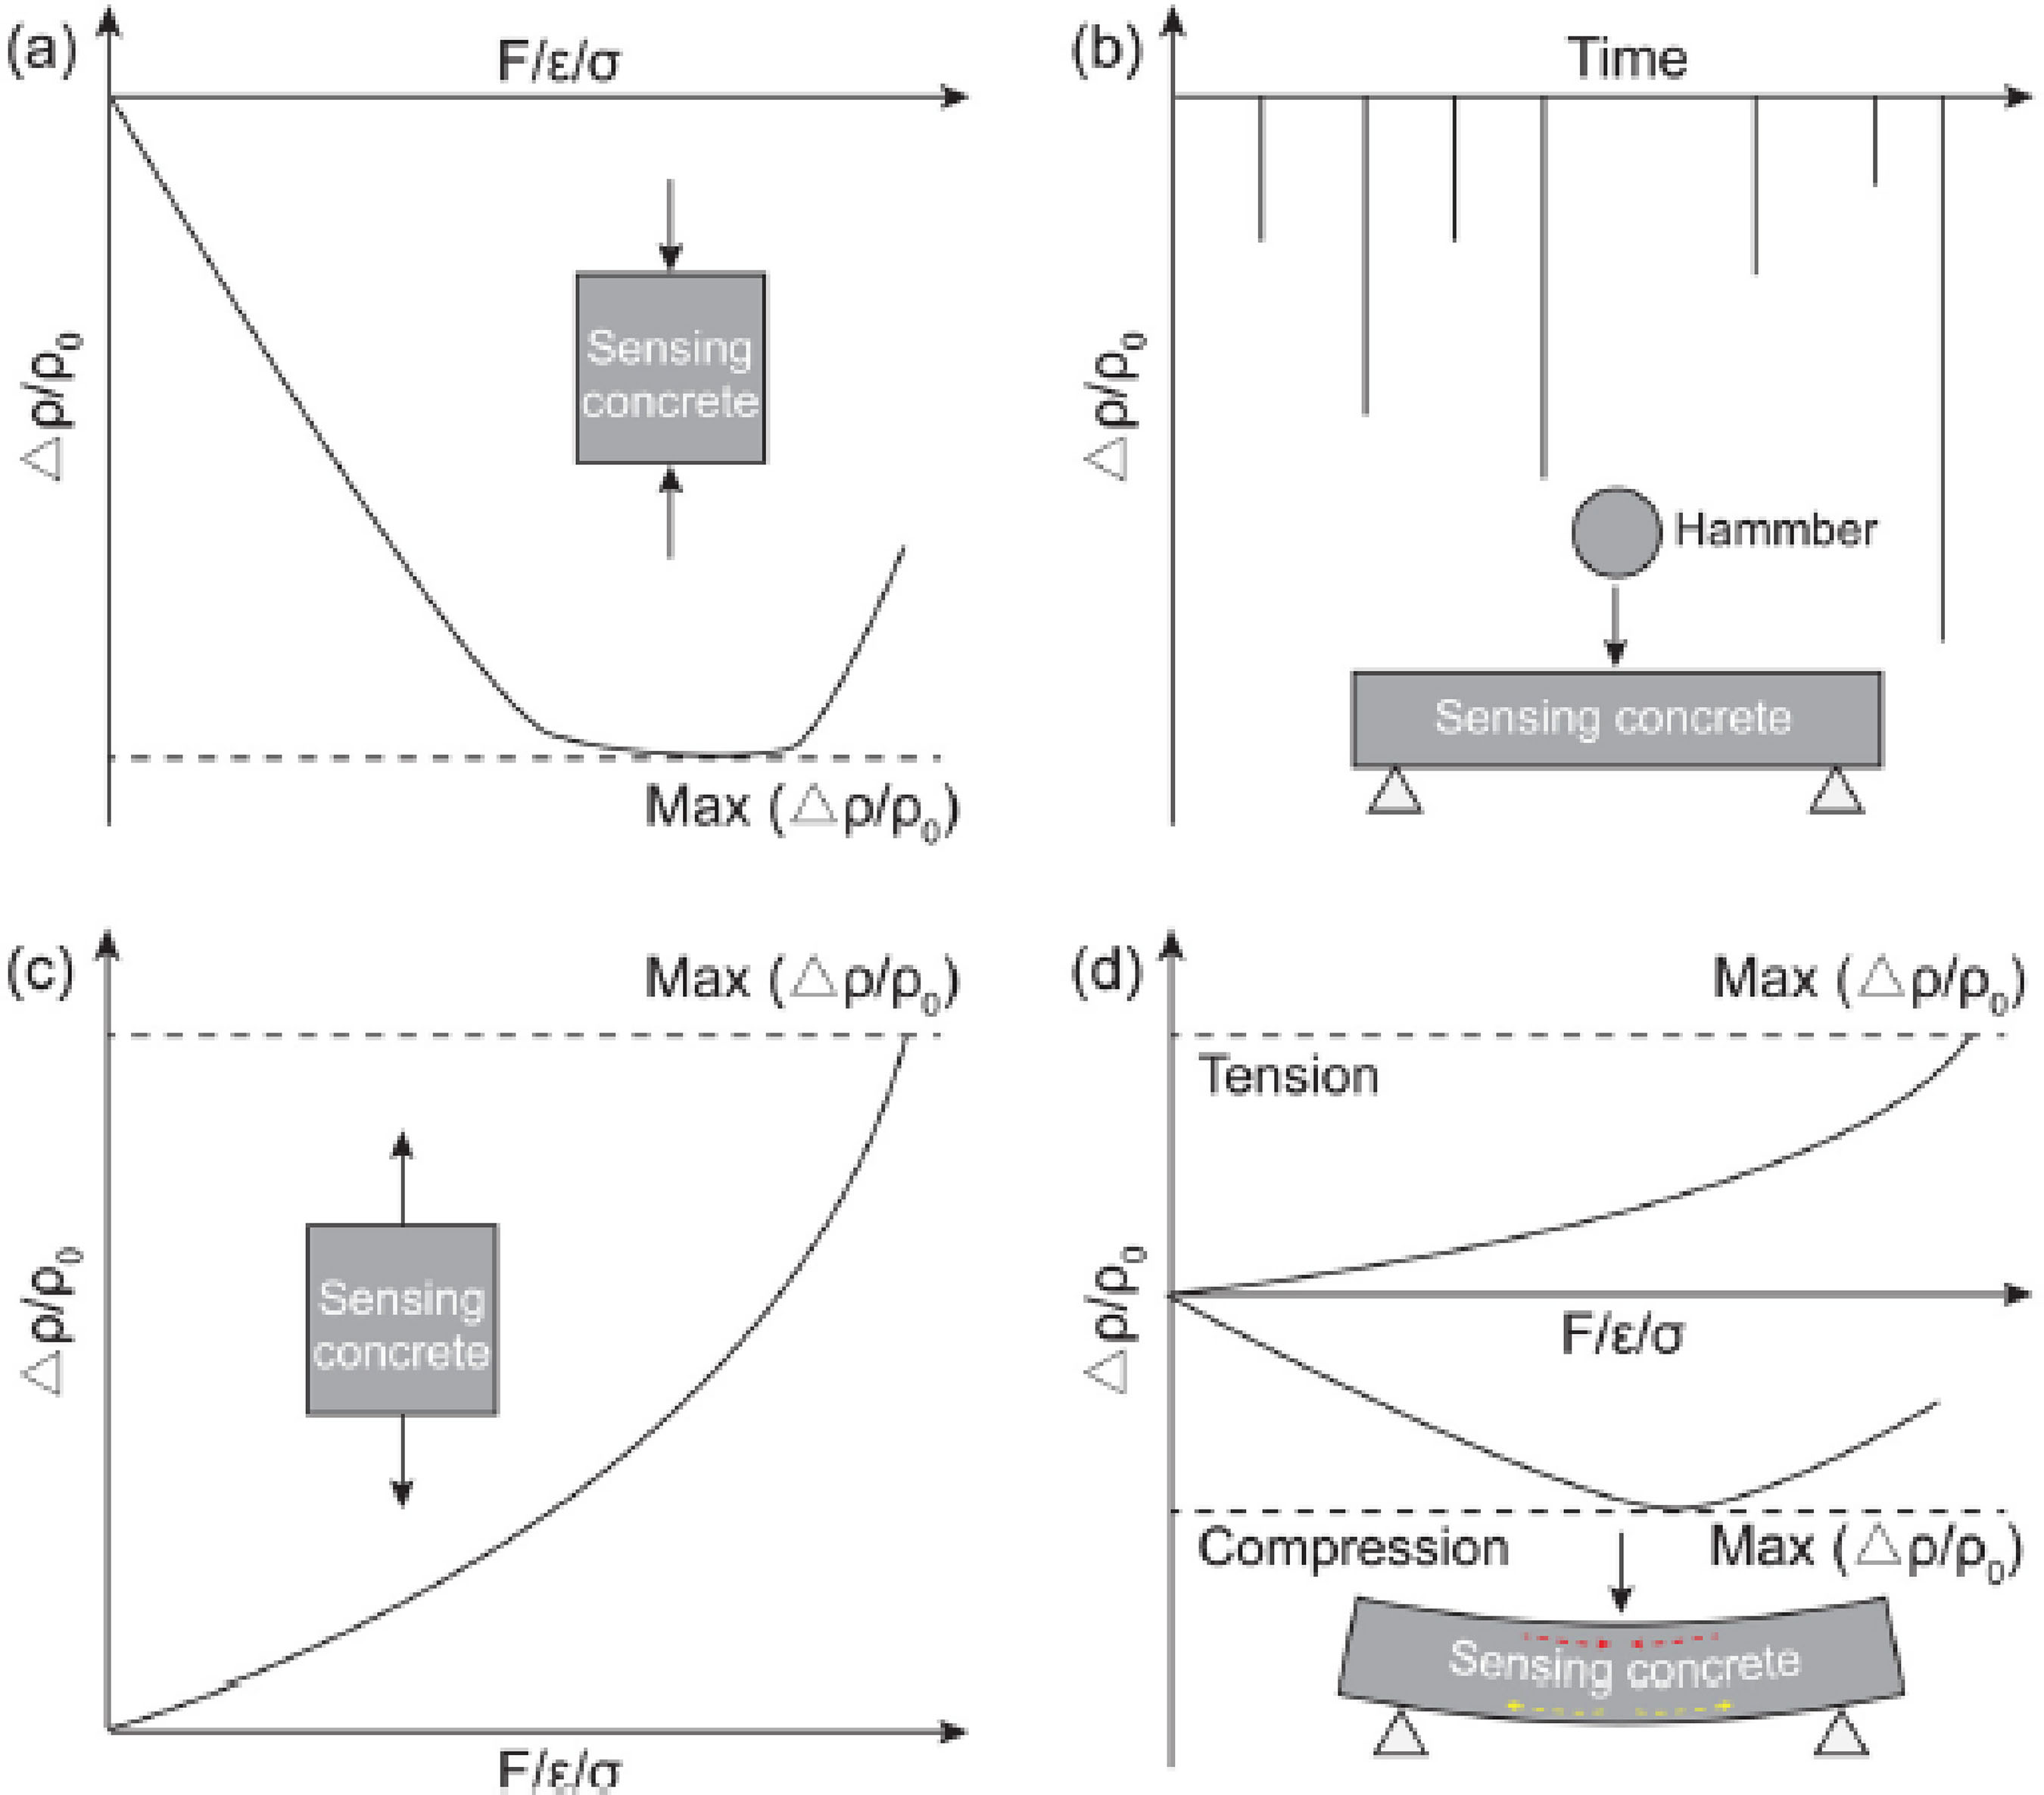
Based on results such as those obtained in the Nyquist diagram, the study of electrical properties in cement composites allows us to understand their electrical performance in order to develop new multifunctional applications, as well as correlate electrical properties with physical and mechanical parameters, aiming at indirect analyses of their characteristics. In the case of SSCCs, when subjected to different types of mechanical stresses – compression, tension, and bending – they can generate different types of responses to variations in electrical quantities, as illustrated in Figure 4 (Han; Ding; Yu, 2015).
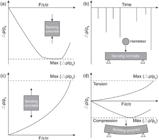
Variation of electrical resistivity (Δρ/ρ0) as a function of different types of mechanical stresses: compression (a); impact (b); tension (c); and bending (d)
The full reversibility of the electrical resistivity and specific strain variations in an SSCC occurs when it is subjected to stresses corresponding to up to 30% of its ultimate strength, that is, in its linear-elastic regime. However, when stresses occur between 30 and 75% of the ultimate strength, electrical and strain properties cease to be fully reversible due to minor damage to the matrix of the SSCC. Finally, when stresses exceed 75%, the electrical and strain variations caused by the stresses become completely irreversible (Han; Ding; Yu, 2015). The geometry of a SSCC structure or specimen is altered when stresses cause strain, which in turn also leads to changes in the electrical resistance of the conductive paths due to the piezoresistive effect. This change can cause changes in the flow of electricity, thus enabling the self-sensitivity of a cement composite to be assessed (You et al., 2017).
To create conductive pathways in this type of composite, electrically conductive materials are incorporated into the mixture. The closer these materials are to each other, the lower the electrical resistivity. This variation in the distance between the particles of the conductive materials influences the formation of conductive pathways. In other words, electrical resistivity can vary depending on changes in these distances, which can also occur due to mechanical strain of the structure (beam, column, slab, etc.) or the test specimen (Monteiro; Cachim; Costa, 2017; Wang; Aslani, 2021).
In addition to studying elementary questions about the development and behavior of SSCCs, researchers such as Wang and Aslani (2023) have combined the development and application of these composites with new technological trends, such as the production of cement sensors in 3D printers, for monitoring reinforced concrete beams. Other innovations in SSCC production involve the incorporation of conductive waste, recycled materials, or byproducts, such as fly ash, red mud, and steel slag. The use of these materials not only reduces SSCC production costs but also contributes to environmental and sustainability issues in the construction industry (Nalon et al., 2022).
Therefore, there is a strong demand for research to bring advances in the development of multifunctional cement composites, which include self-sensitive ones (Birgin; D'Alessandro; Ubertini, 2023), aiming at their large-scale use in real constructions.
2.2 Carbon fibers in cement composites with electrical properties
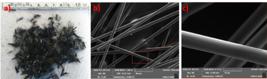
The use of certain types of carbon fibers (Figure 5) in appropriate proportions can improve the durability and mechanical properties of cement composites. Another benefit of incorporating these fibers into composites is the improvement of electrical and piezoresistive properties (Baeza et al., 2013). The use of these fibers can enable the detection of damage to the concrete structure, thus allowing real-time structural health monitoring (Cholker; Tantray, 2019).
As shown in Table 1, several studies have been conducted on the incorporation of carbon fiber into cement composites, aiming to improve their electrical and piezoresistive properties without compromising their mechanical properties. Due to their diameter, which is around 7 µm, they are classified as carbon microfibers. Their length, in general, ranges from 3 to 12 mm. Most of the studies consulted tend to use carbon fiber contents between 0.1 and 1.5% of the cement mass, with some exceptions.
Research indicates that incorporating 0.1% CF in relation to the cement mass can promote a reduction in the electrical resistivity of a mortar by more than eight times (Birgin; D'Alessandro; Ubertini, 2023). Baeza et al. (2013) have found that CF with lengths of 12 mm allowed a reduction in the electrical resistivity of the cementitious composite at lower addition contents compared to those of 3 and 6 mm. However, the improvement in mechanical strength was observed with the CF of length 3 mm. This same effect of reducing electrical resistivity in relation to fiber length was also observed by Chuang et al. (2017), Segura et al. (2019) and Yu et al. (2025).
The variation of electrical resistivity in cementitious composites with CF is also associated with other factors, such as water-cement ratio (Chuang et al., 2017), humidity conditions of the specimen (Dehghani; Aslani, 2021a; Wang; Aslani, 2021), and curing time and age of the composite (Deng et al., 2019; Donnini; Bellezze; Corinaldesi, 2018; Yu et al., 2025). An increase in the humidity can lead to a reduction in resistivity, while with increasing age of the composite, there may be an increase in resistivity.
Belli et al. (2020) investigated the use of recycled CF compared to new fibers and found that at low contents such as 0.05 and 0.1%, the use of recycled fibers presented better electrical performance, with similar compression and flexural strength. However, increased compression strength is not always achieved with the use of CF. In fact, at amounts greater than 1% of the cement mass, there can be a significant reduction in strength (Cholker; Tantray, 2019). Although less common with CF addition, the reduction in tensile strength can also occur (Zhao et al., 2024).
Another factor that greatly influences both the mechanical and electrical properties of the use of CFs in cementitious composites is associated with the proportions of the basic constituent materials, such as cement, aggregates, and water. Therefore, this research aimed to produce and analyze the electrical, piezoresistive, mechanical, and microstructural properties of cement mortar. This study differs from previous ones because it uses carbon microfiber with a length of ~4 mm, based on the dosage reference of the Brazilian standard NBR 11173 (ABNT, 1990), for reinforced mortars.
3 Experimental procedures
3.1 Materials
As a binder, High Early Strength (HES) Portland cement, produced by Holcim, with a specific mass determined at 3.06 kg/dm³, according to technical standard NBR 16605 (ABNT, 2017), was used. The choice for this type of cement was due to its high purity, as well as the fact that Carísio et al. (2021) used it to produce a cement composite with electrical properties.
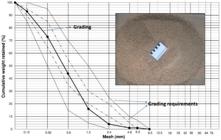
Quartz sand from the Limeira, SP, region was used as fine aggregate, after which it underwent a moisture reduction process by drying in an oven for 24 hours at 105±5 ºC. This sand was characterized according to the parameters and results in Table 2 and Figure 6.
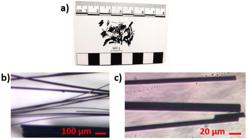
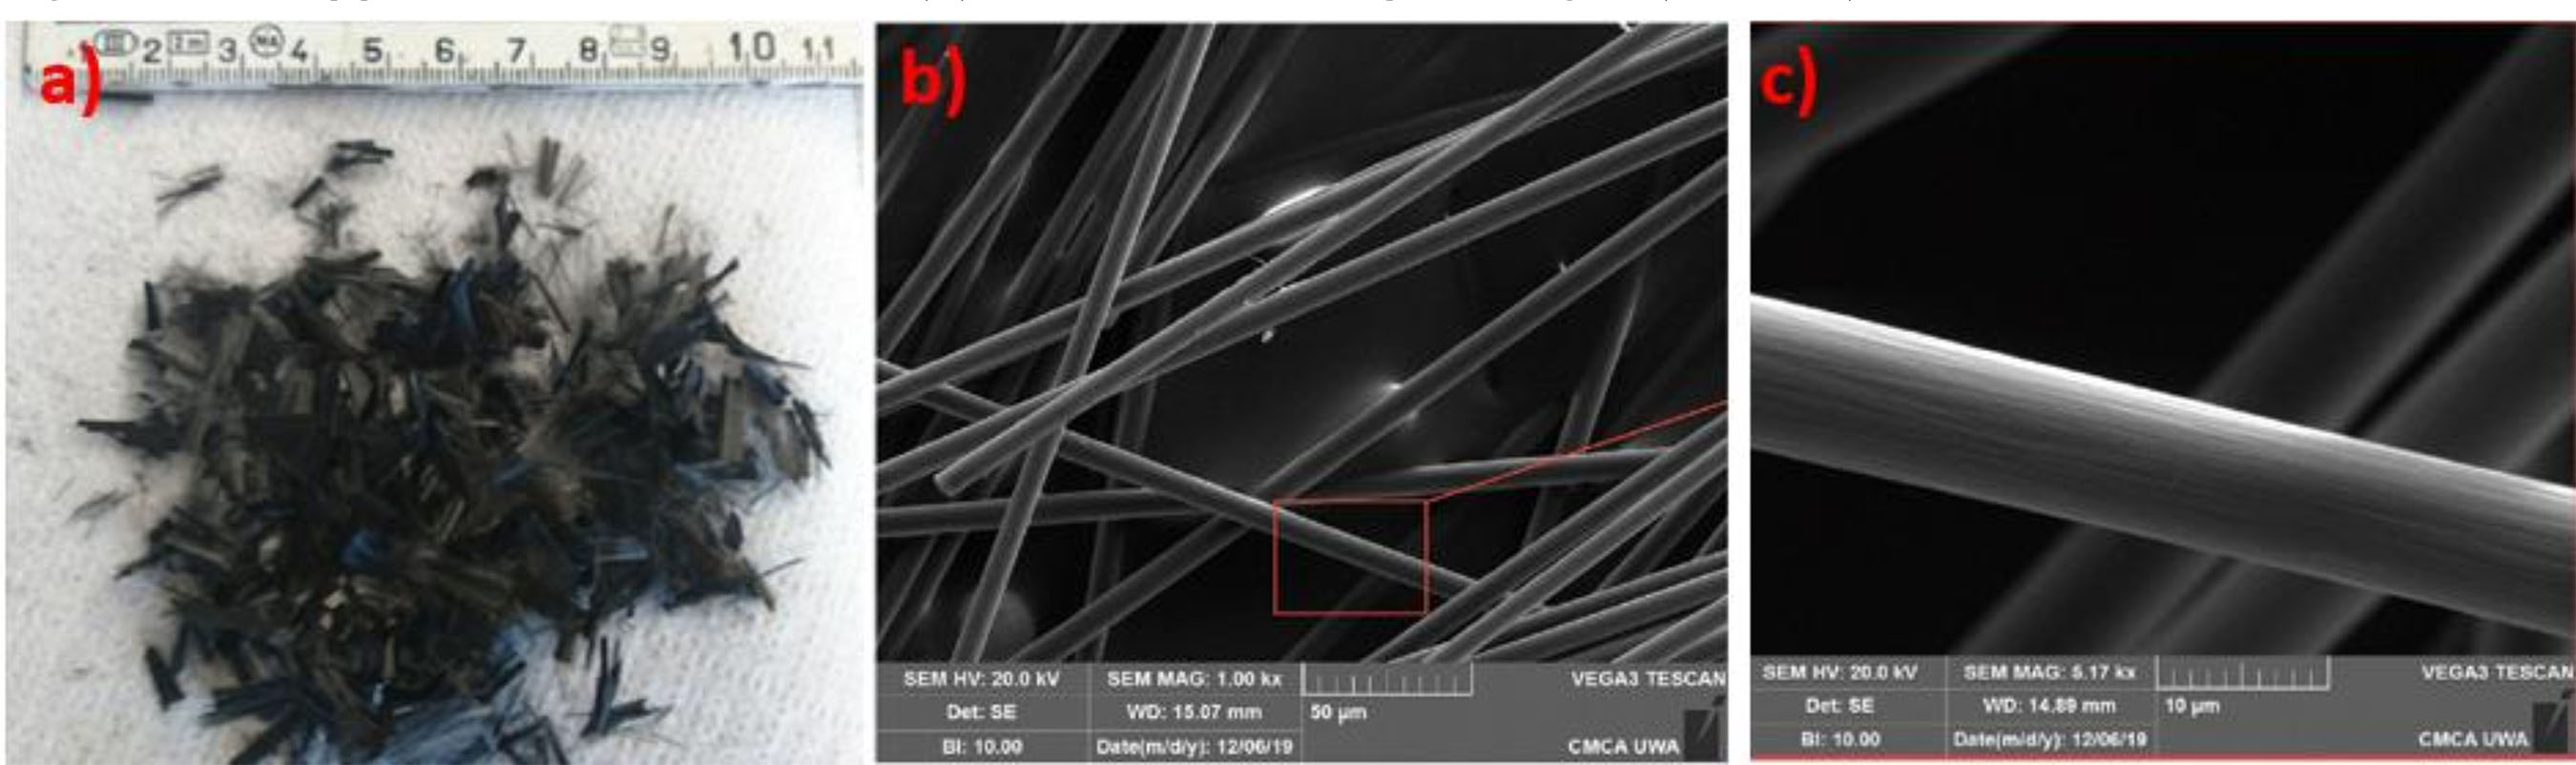
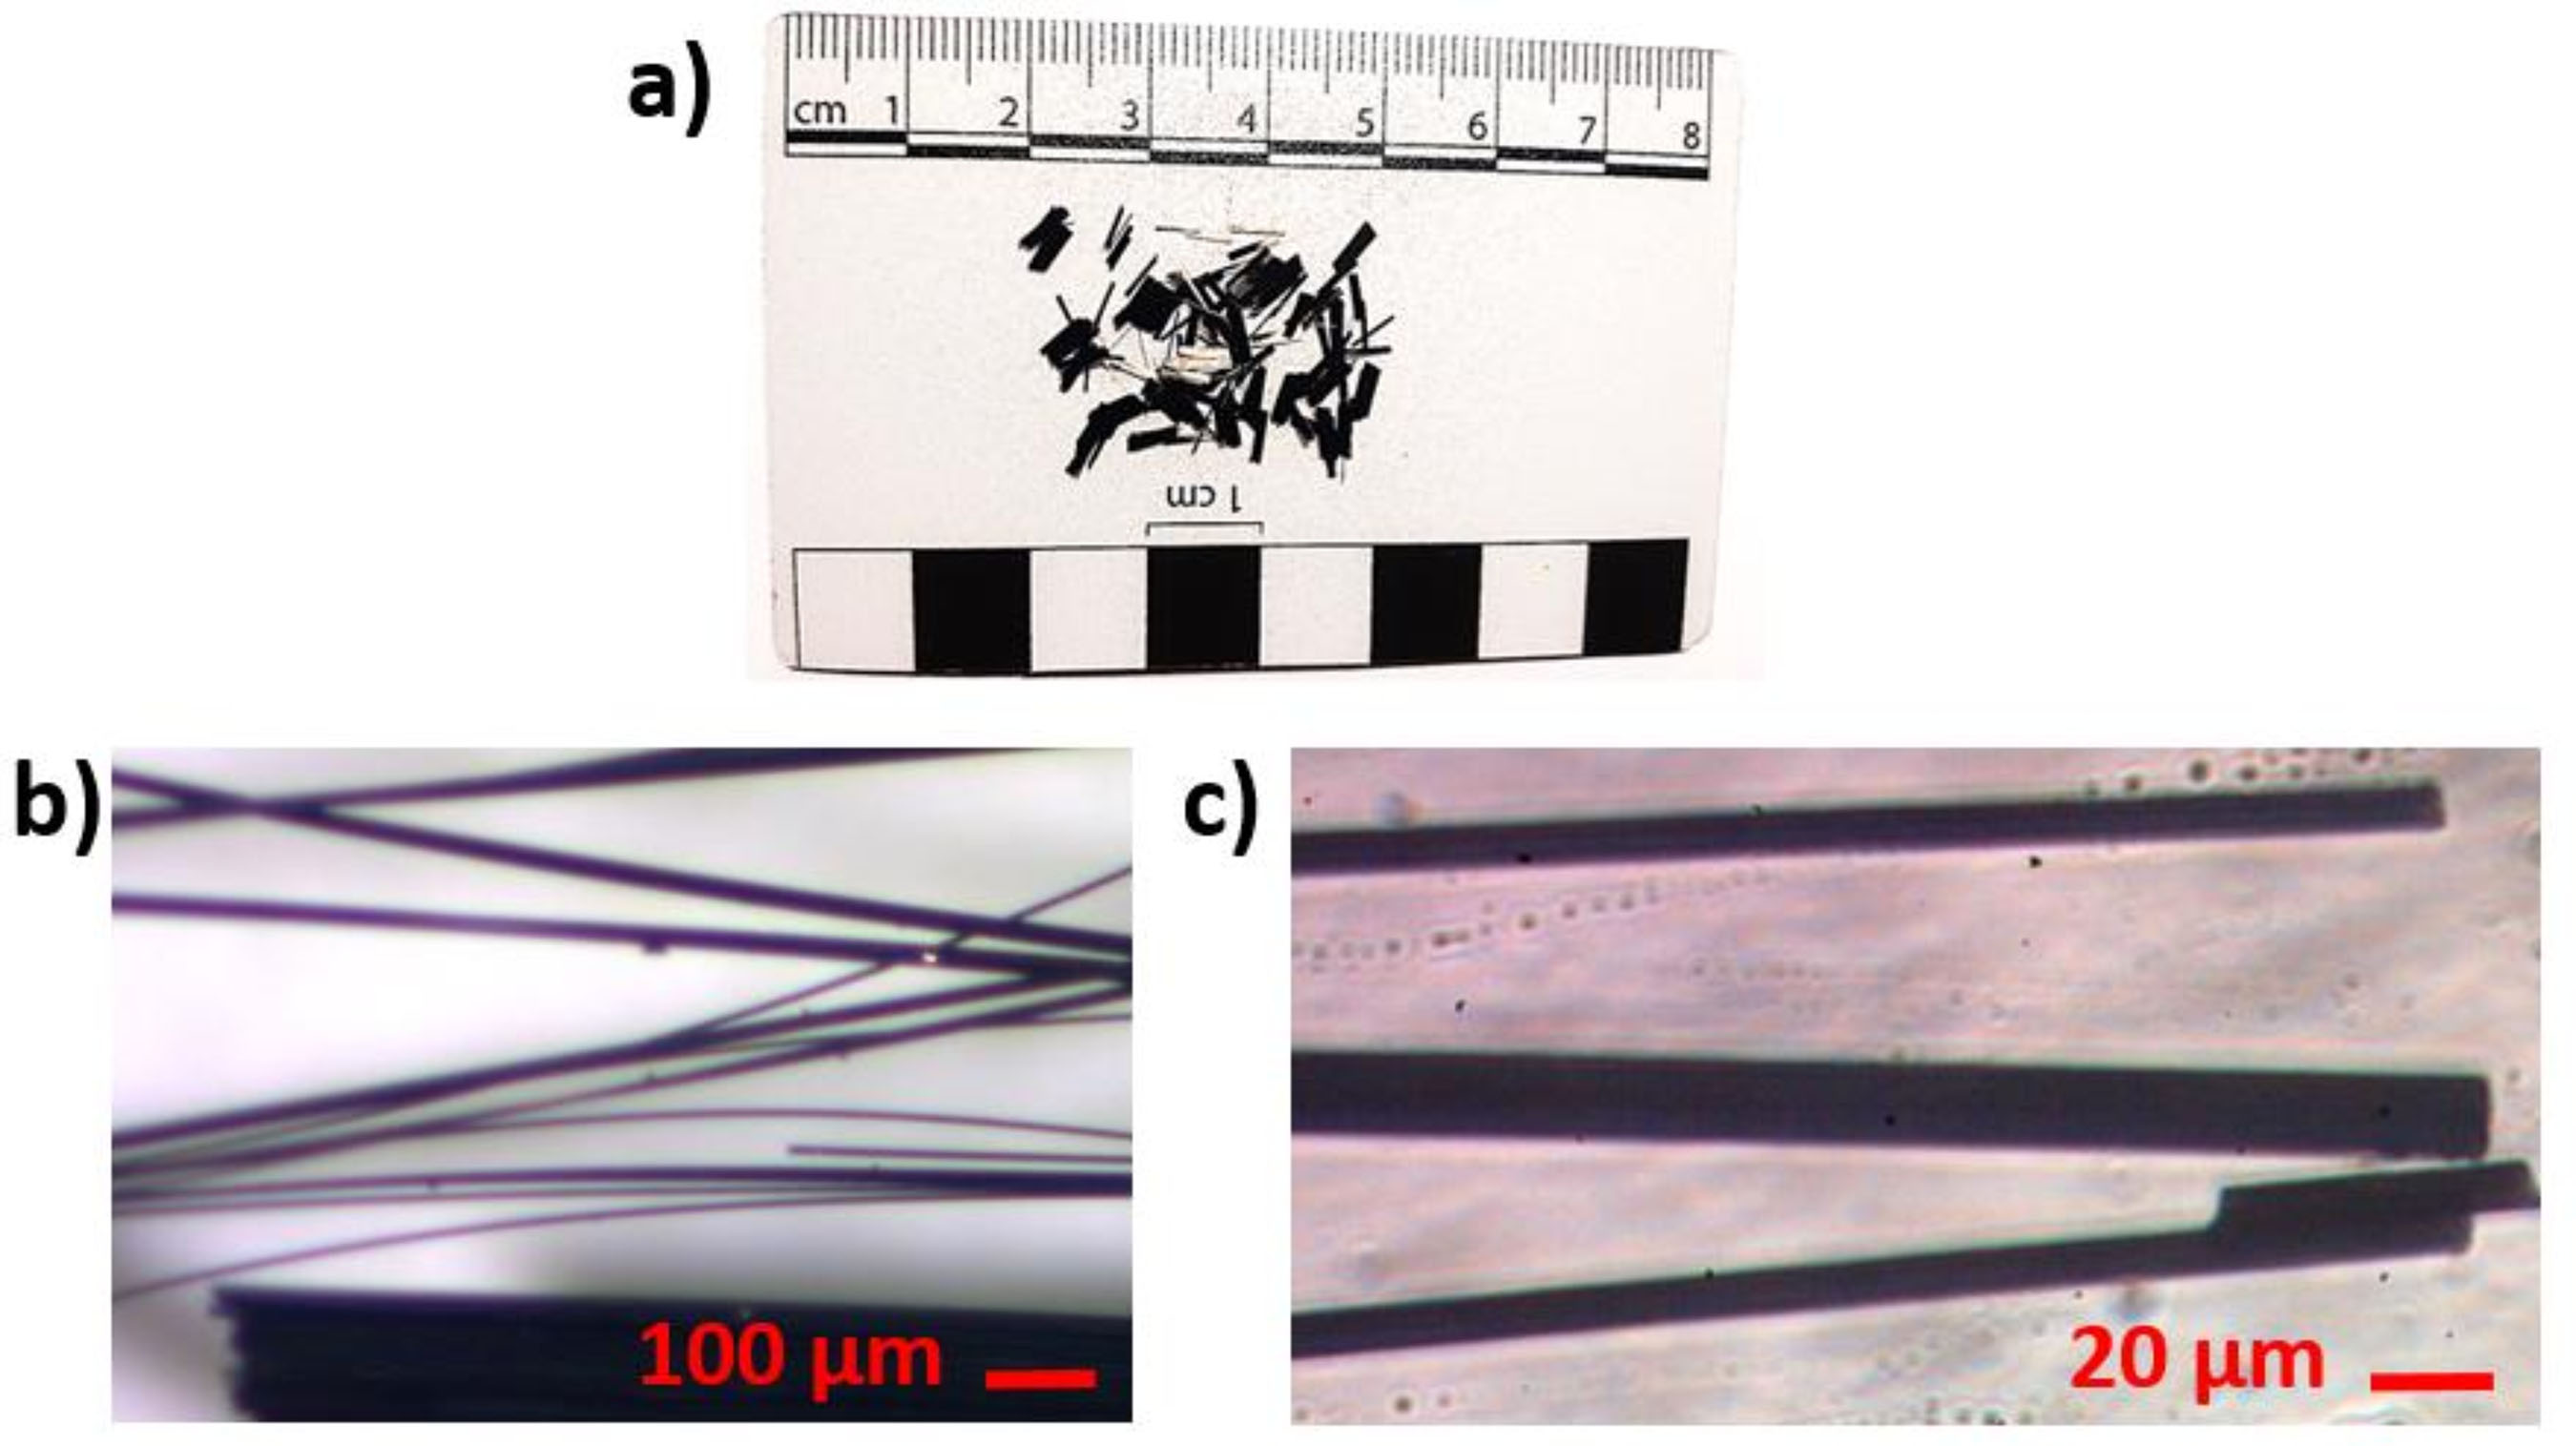
The carbon microfiber (Figure 7) used has a length of ~ 4 mm, type 12k (filaments), with a purity content of ≥ 94%, marketed by the company TEXIGLASS®. Its thickness is ~ 6–7 µm, according to images obtained through the use of the inverted microscope model Axiovert 40 CFL (brand Zeiss), with camera model Axiocam ERc-52, from the same manufacturer.
A water-reducing agent from the manufacturer MC-Bauchemie Brasil, type TechniFlow 520, was used to improve the workability of the mortar due to the incorporation of the microfibers in question.
3.2 Methods
Due to the addition of carbon microfiber, the preparation of the mortar followed the procedures of standard NBR 16541 (ABNT, 2016), with the following changes to ensure better homogeneity of the mixture:
-
anhydrous mixing of cement and sand;
-
addition of 75% water with the additive, followed by mechanical mixing for 1 minute and 30 seconds according to the standard and resting for the same amount of time; and
-
addition of 25% water with the additive, followed by the gradual addition of carbon microfiber, during mechanical mixing for another 2 minutes.
The mix proportion was based on the maximum limits established by technical standard NBR 11173 (ABNT, 1990) for reinforced mortars, that is, 1:2:0.45 (cement: sand: water/cement ratio). The addition of microfiber in proportions of 0.2, 0.4, 0.6, 0.8, 1 and 1.2% (Table 3) in relation to the cement mass was based on the values used by Baeza et al. (2013) and Wang and Aslani (2021), who researched electrical properties in cement composites with the addition of carbon microfiber. The use of the water-reducing agent was employed to improve the microfiber dispersion. The amount of agent was based on the same criterion used by researchers Donnini, Bellezze and Corinaldesi (2018), who used the same percentage as carbon microfiber.
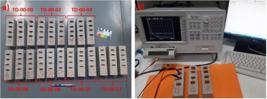
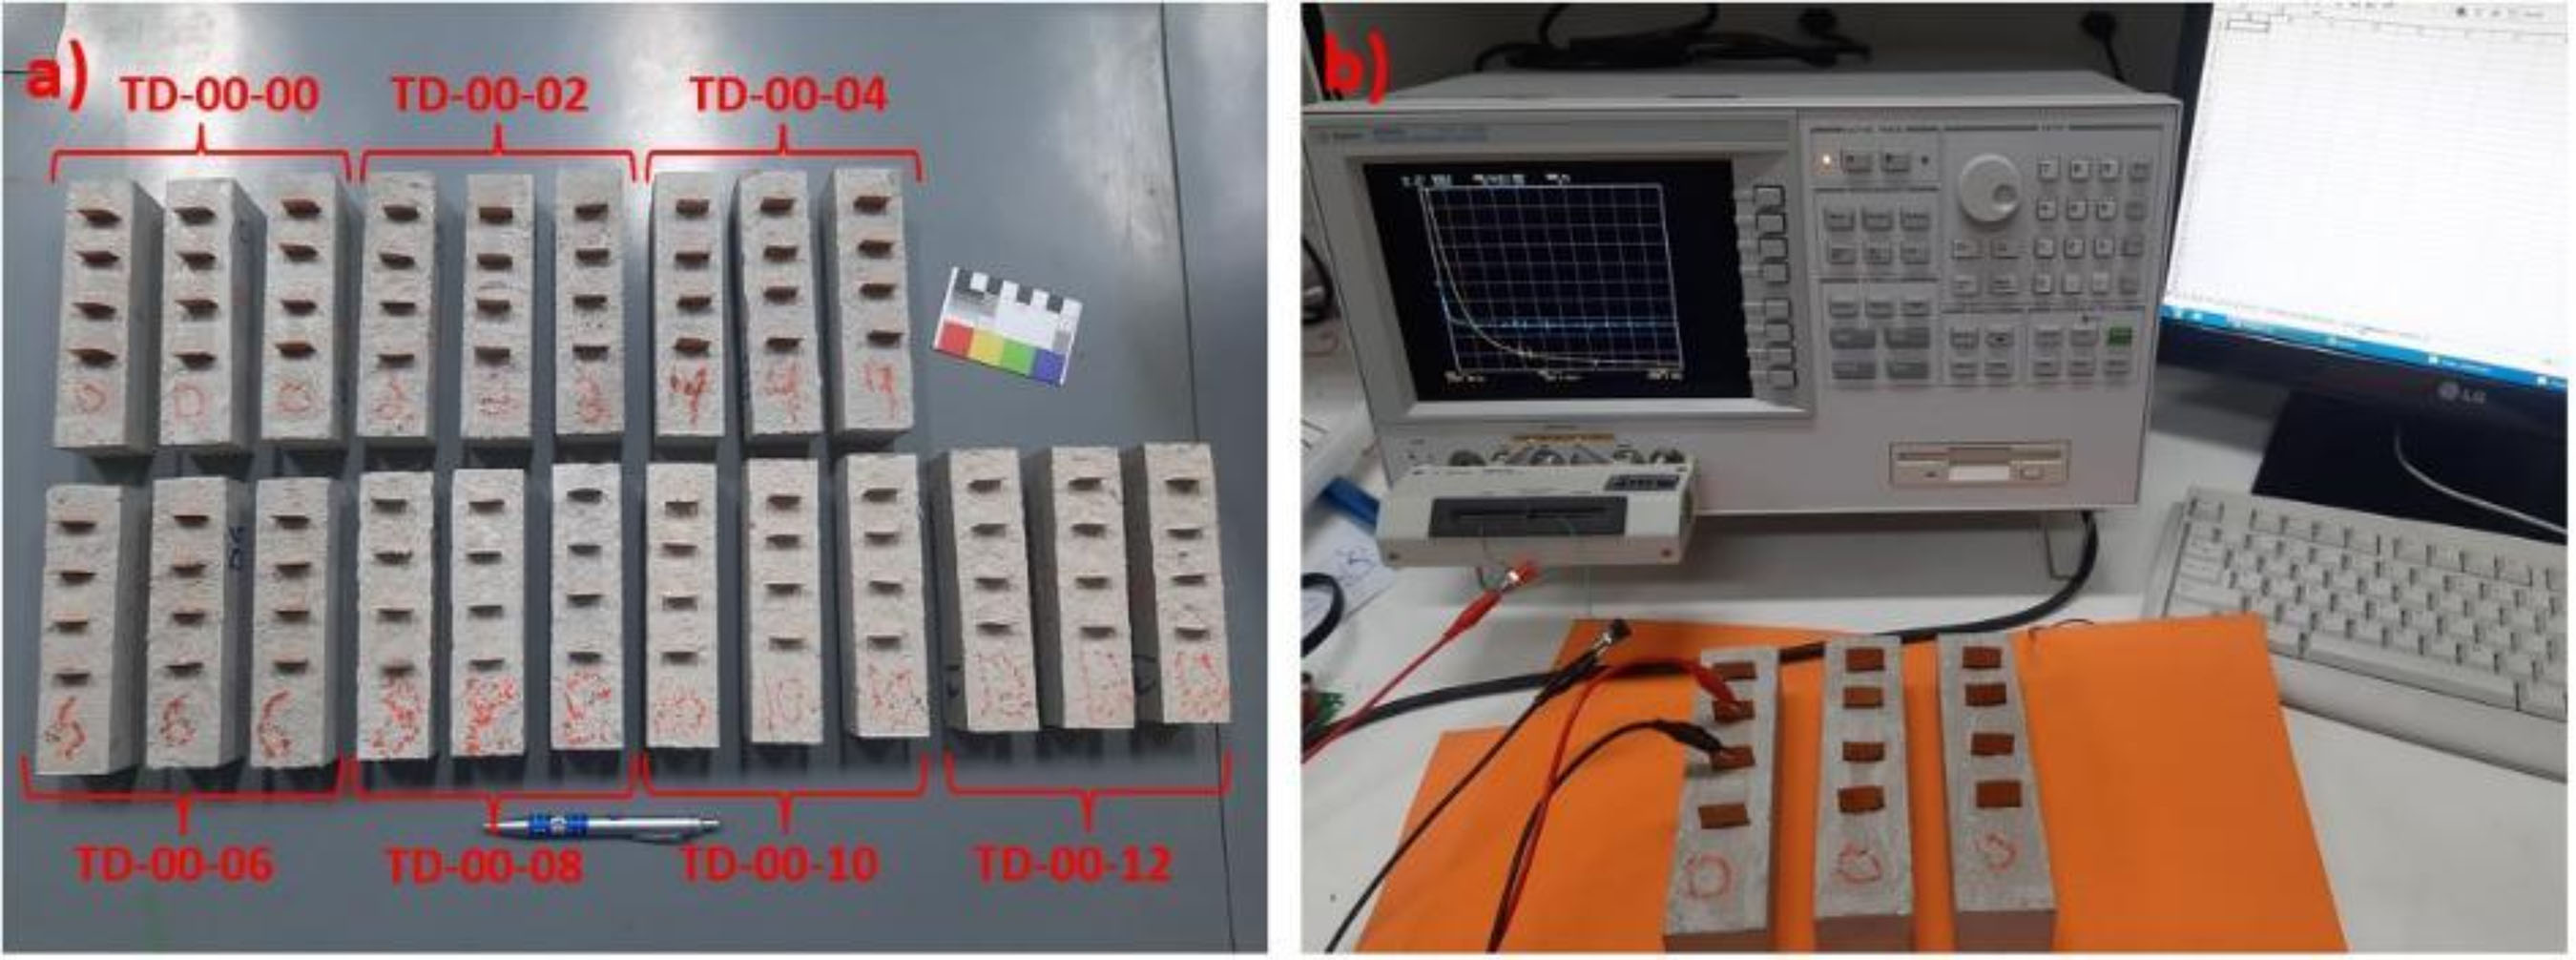
Prismatic specimens were molded, with dimensions of 40 mm × 40 mm × 160 mm, dimensions already used for measurements of electrical quantities in cementitious composites, as reported in the literature (Donnini; Bellezze; Corinaldesi, 2018; Dehghani; Aslani, 2021b). In the specimens used for electrical property analysis, four electrodes were installed in copper sheets, with a thickness of approximately 0.1 mm, as adopted by Carísio et al. (2021). The electrode's sizing was a width of 20 mm, embedded in 40 mm, as well as spaced 30 mm apart, as adopted by Buasiri et al. (2019) and Qi et al. (2023), as shown in Figure 8a.
The curing and demolding of the specimens followed the parameters established in standard NBR 13279 (ABNT, 2005a), through curing at a temperature of 23 ± 2 ºC, relative humidity of 60 ± 5% in a humid chamber, as well as demolding in 48 ± 24 hours.
The determination of compression and flexural strengths followed the procedures of standard NBR 13279 (ABNT, 2005a). The determination of the bulk density of the mortar was carried out according to standard NBR 13280 (ABNT, 2005b). The determination of the modulus of elasticity was carried out using an ultrasonic wave, in accordance with the procedures established in standard NBR 15630 (ABNT, 2008), using the USLab equipment from Agricef.
To determine the electrical properties, the specimens were tested at an age of ≥ 28 days, as well as after drying in an oven (temperature of 105 ± 5 ºC) for 24 hours, a drying procedure adopted by Nalon et al. (2021). The electrical impedance (Z) and phase angle (θ) were measured using an Agilent model 4294A impedance analyzer, as shown in Figure 8b, in pairs of two electrodes. The measurements were made at frequencies from 40 Hz (minimum equipment) to 1 MHz (Segura et al., 2019; Belli et al., 2020), at a voltage amplitude of 1 volt, with 800 readings recorded in the mentioned frequency range.
All these analyses (physical, mechanical, and electrical) were performed on three specimens of each mix proportion.
From the measurements of electrical impedance (Z) and phase angle (θ), the values of imaginary impedance (Z”) and electrical resistance (R) were determined, respectively, using Equations 1 (Lazanas; Prodromidis, 2023) and 2 (Al-Dahawi et al., 2016; Çelik et al., 2021).
Where:
Z is the electrical impedance;
Z" is the imaginary impedance;
θ is the phase angle; and
R is the electrical resistance.
Thus, using Ohm's second law, the electrical resistivity (ρ) of the composite was determined from the electrical resistance (R), the area (A) of the cross-section and the distance between electrodes (l), according to Equation 3 (Scholle; Sinapius, 2021; Monteiro; Cachim; Costa, 2017; Deng et al., 2019).
Where:
ρ is the electrical resistivity;
A is the area of the cross-section;
l is the distance between electrodes; and
R is the electrical resistance.
Finally, the electrical conductivity (σe) was obtained using Equation 4 (Zhang et al., 2024).
Where:
σe is the electrical conductivity; and
ρ is the electrical resistivity.
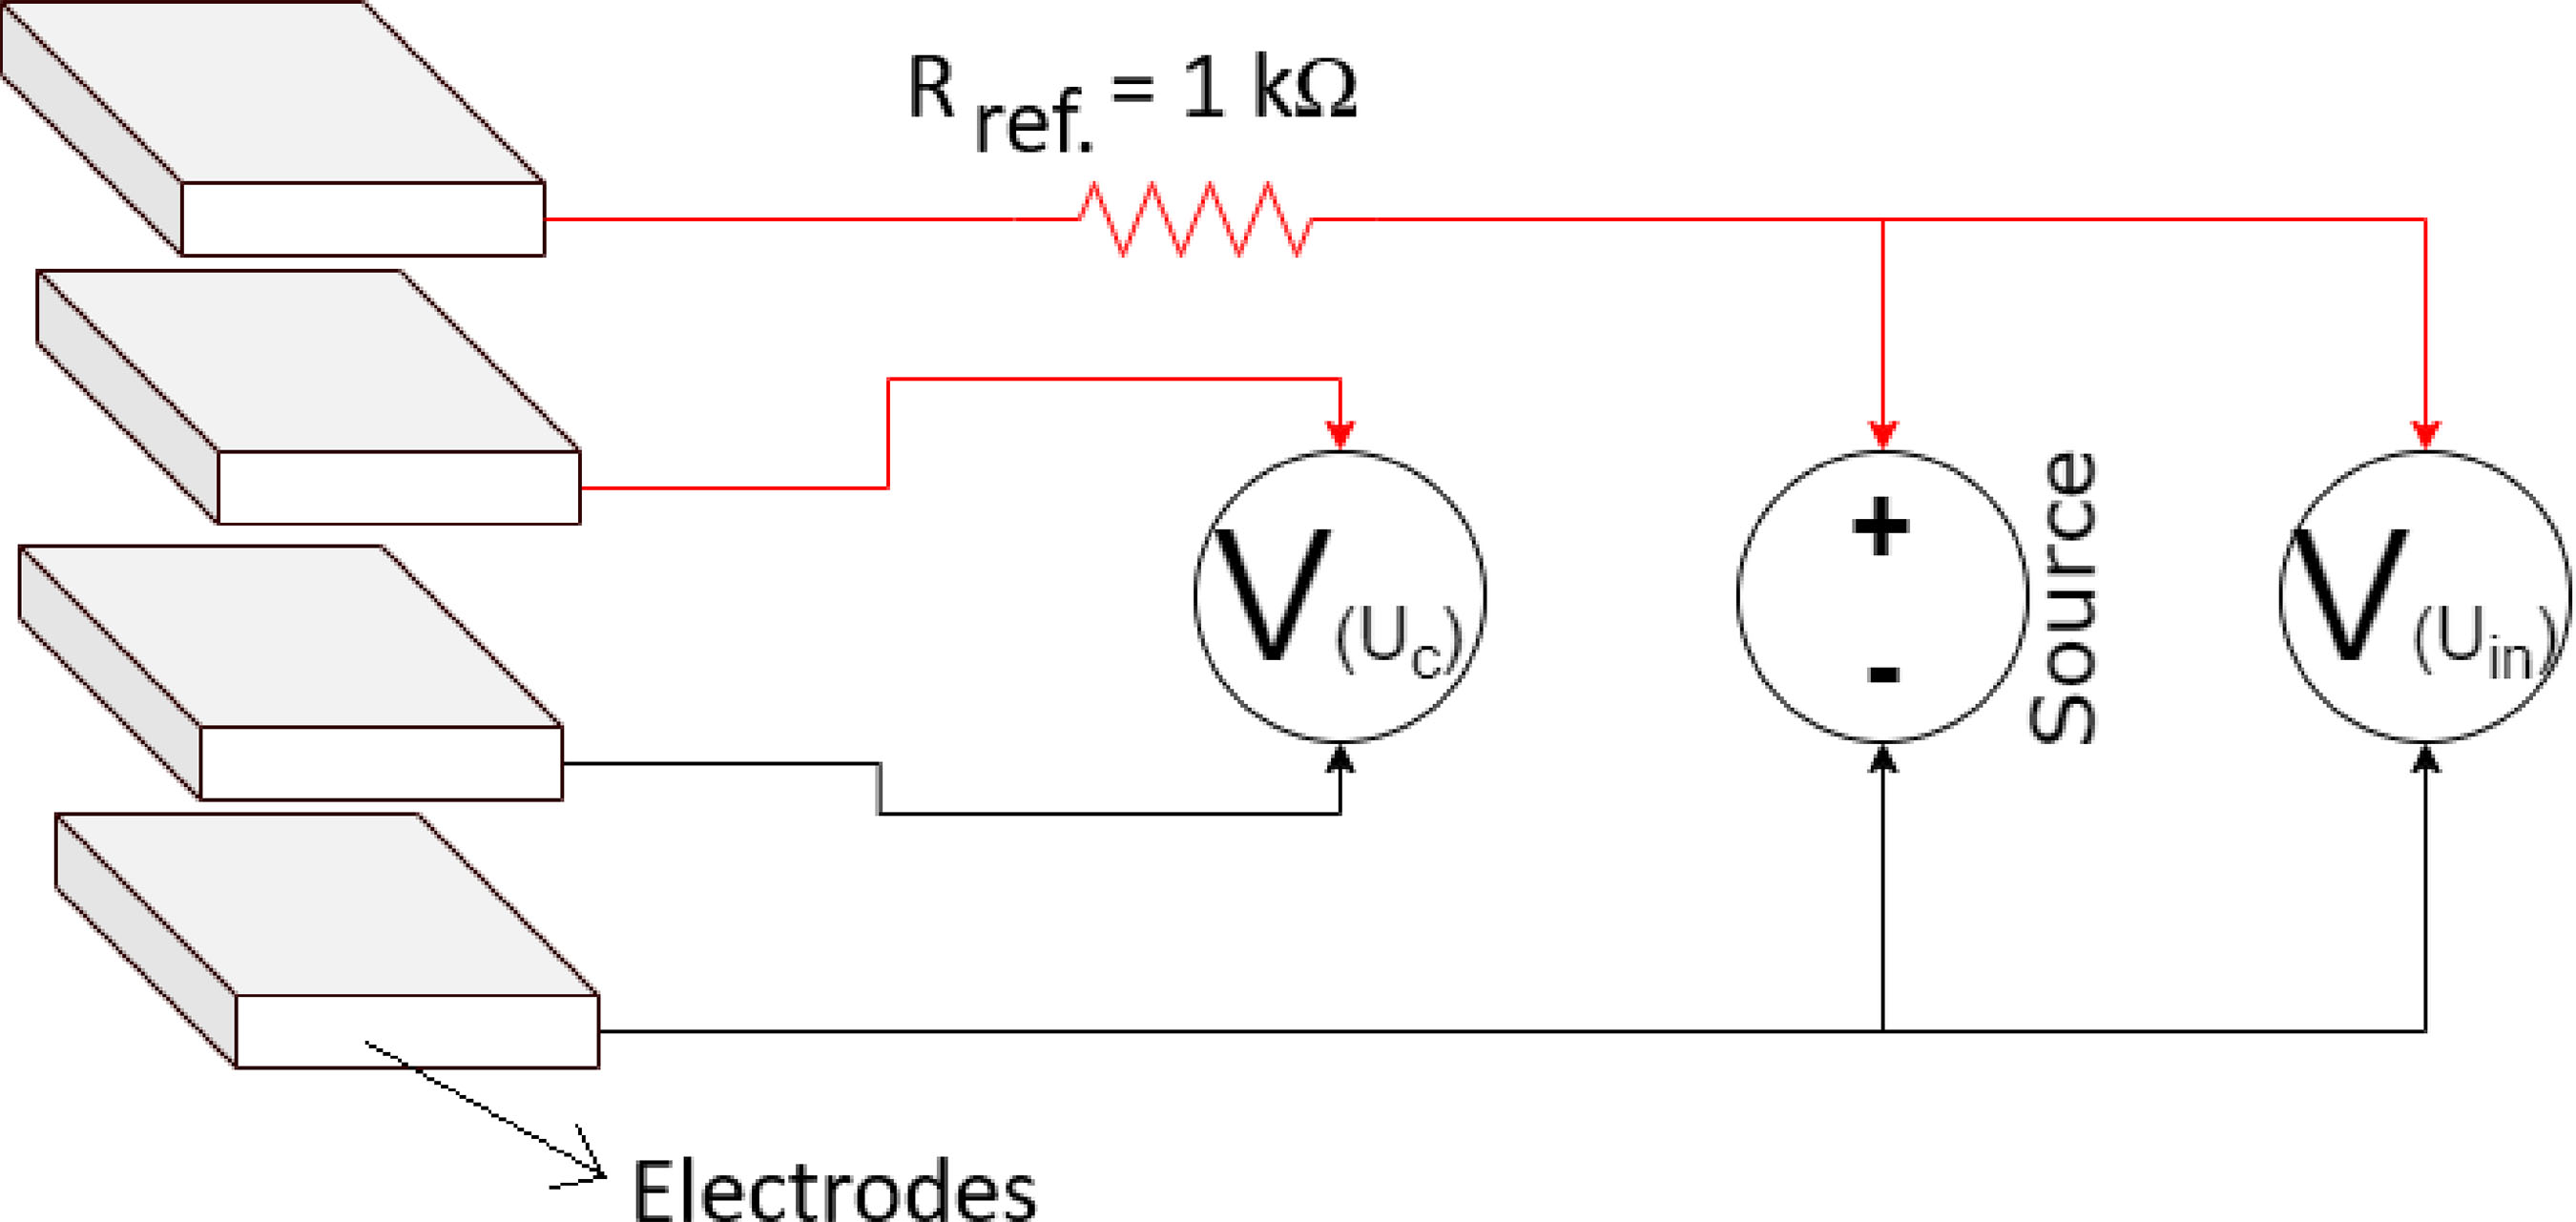
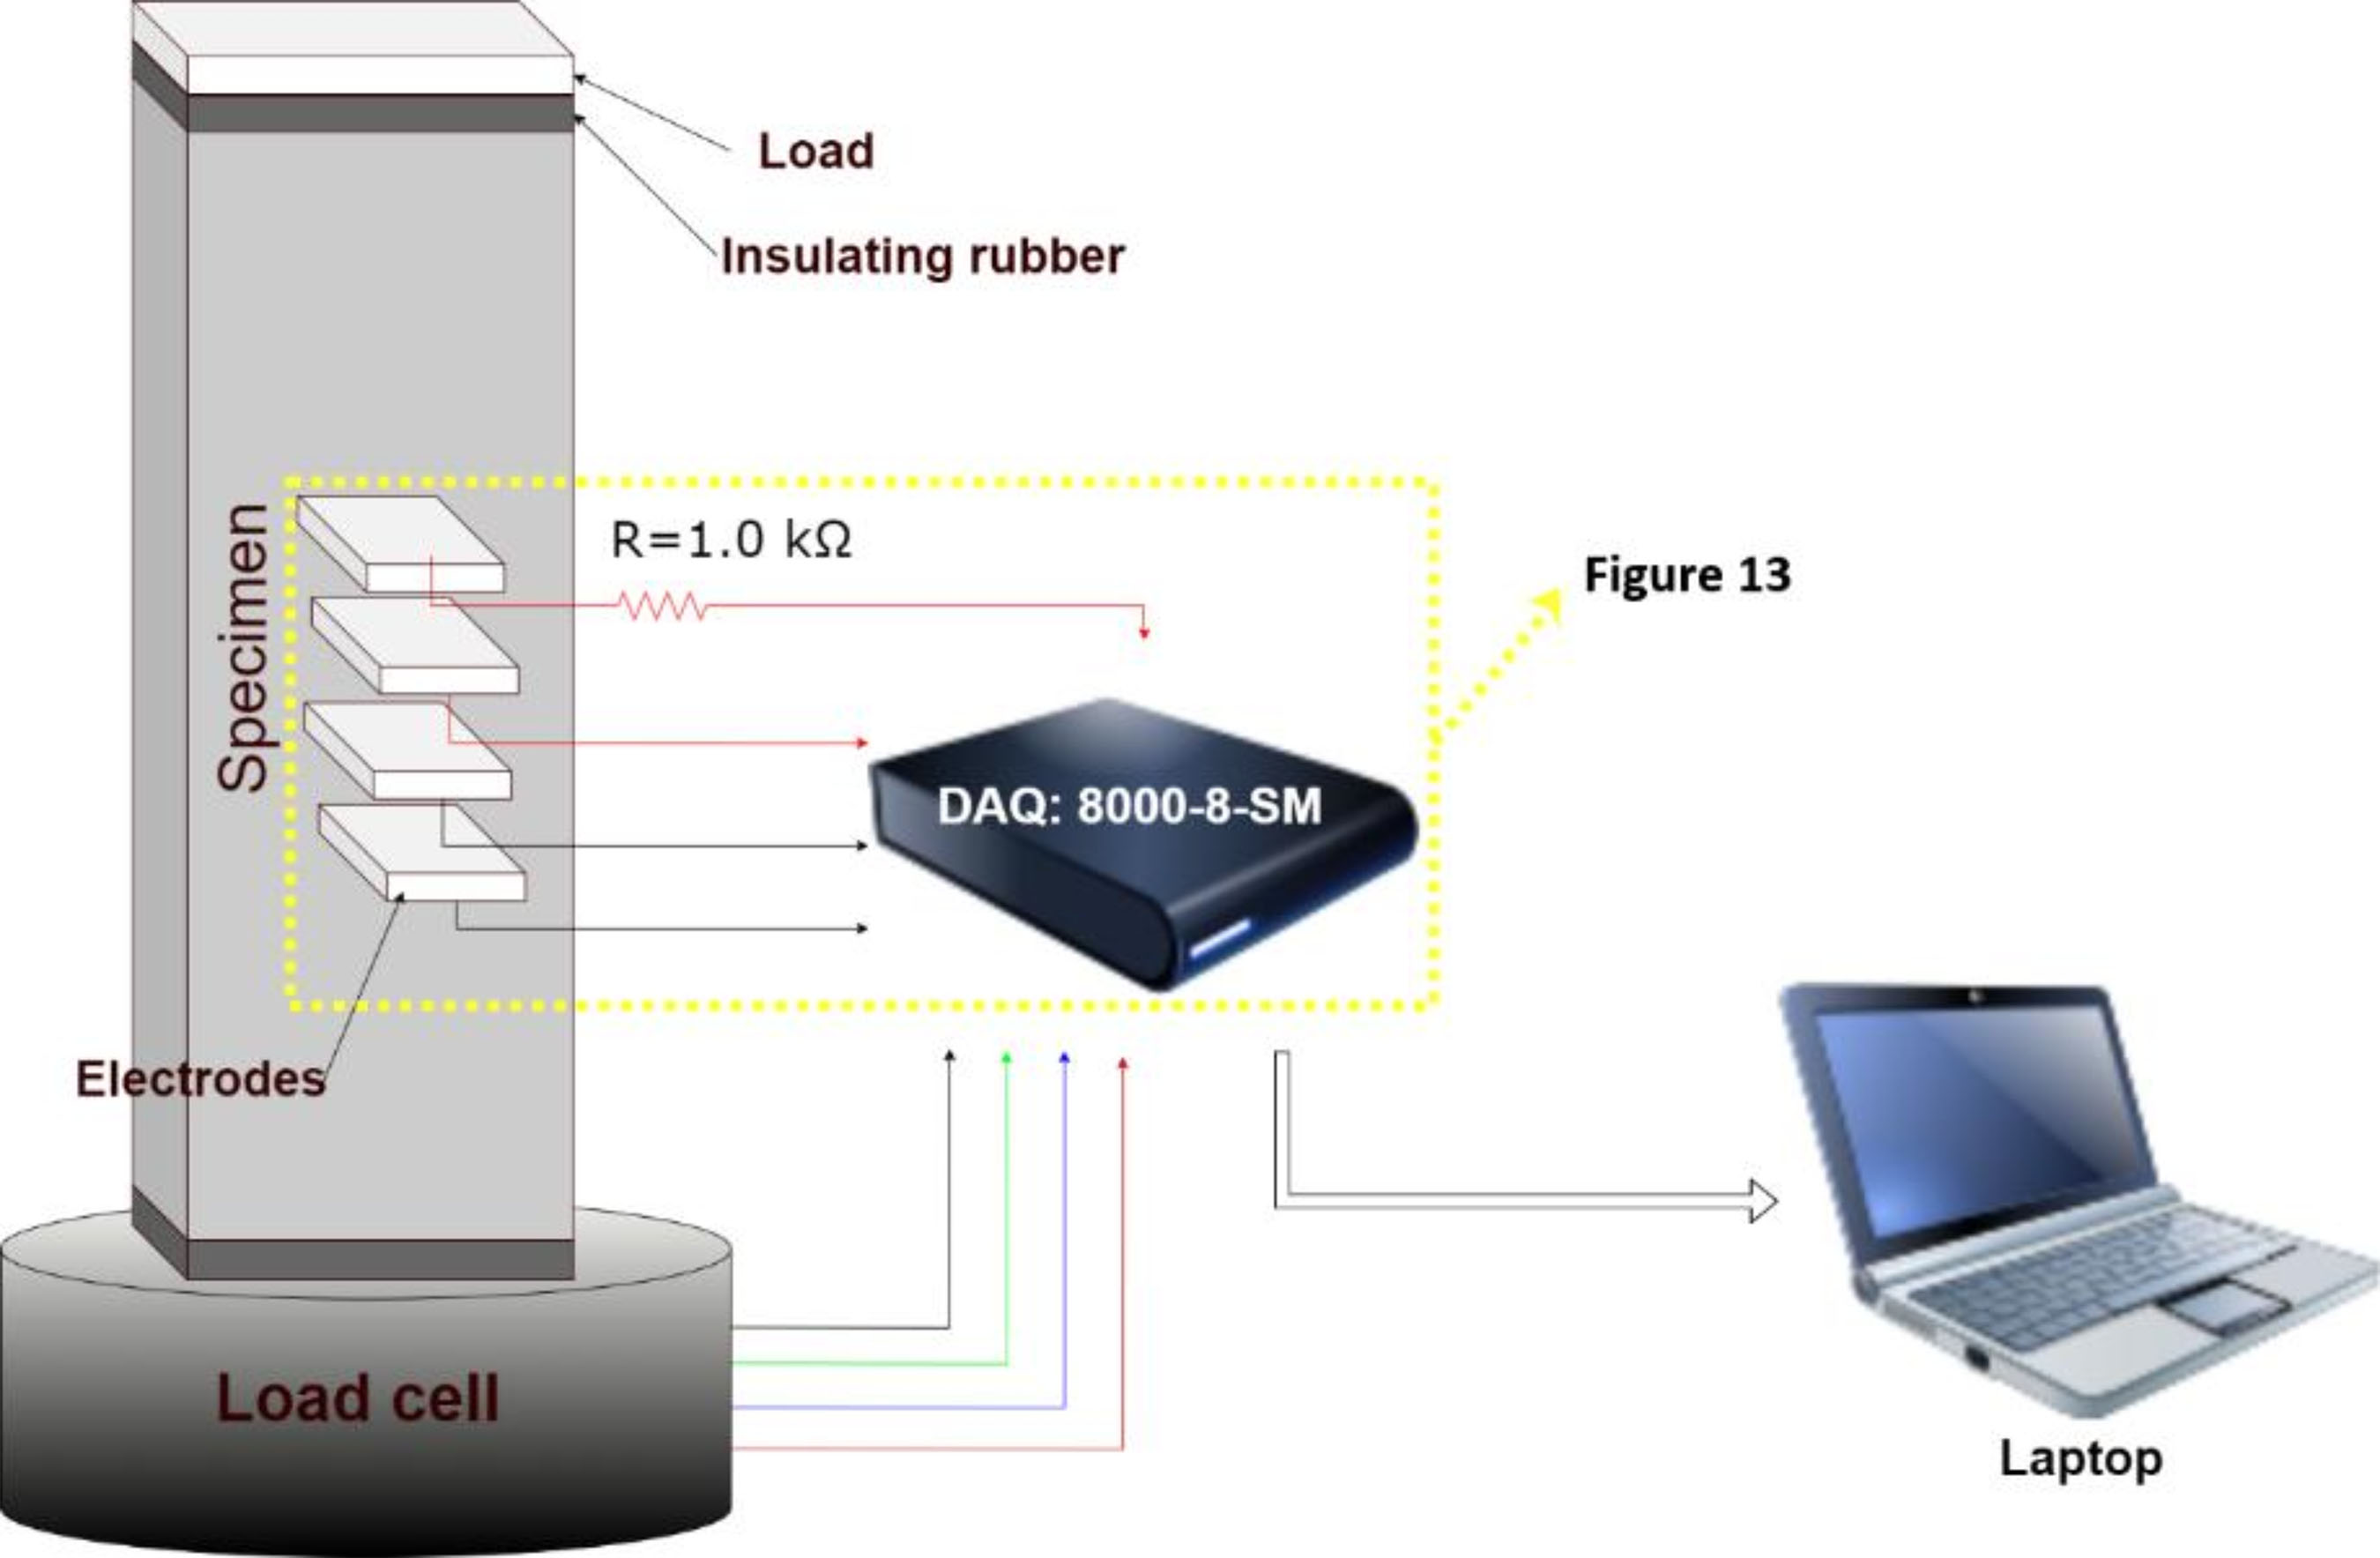
The circuit (Figure 9) with a 5-volt power supply (Dong et al., 2022; Nalon et al., 2021; Carísio et al., 2021), with a 1 kΩ reference resistor (Birgin et al., 2020; Nalon et al., 2021; Demircilioglu et al., 2022), was used for the piezoresistivity analysis. The reference resistor (Rref) was used for subsequent determination of the electrical resistance (Rc), according to Equation 5, where Uc is the voltage in the composite and Uin is the voltage in the source. The direct current (DC) power supply for the piezoresistivity analysis was due to the fact that this type of current is typical in data acquisition (DAQ) devices, such as the one used in the present research, which used a model 8000-8-SM equipment from Micro-Measurements.
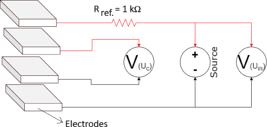
Diagram of the electrical circuit for measuring electrical resistance used in piezoresistivity analysis
Where:
Rref is the resistance of the reference resistor;
Rc is the resistance of the composite;
Uc is the voltage in the composite; and
Uin is the voltage in the source.
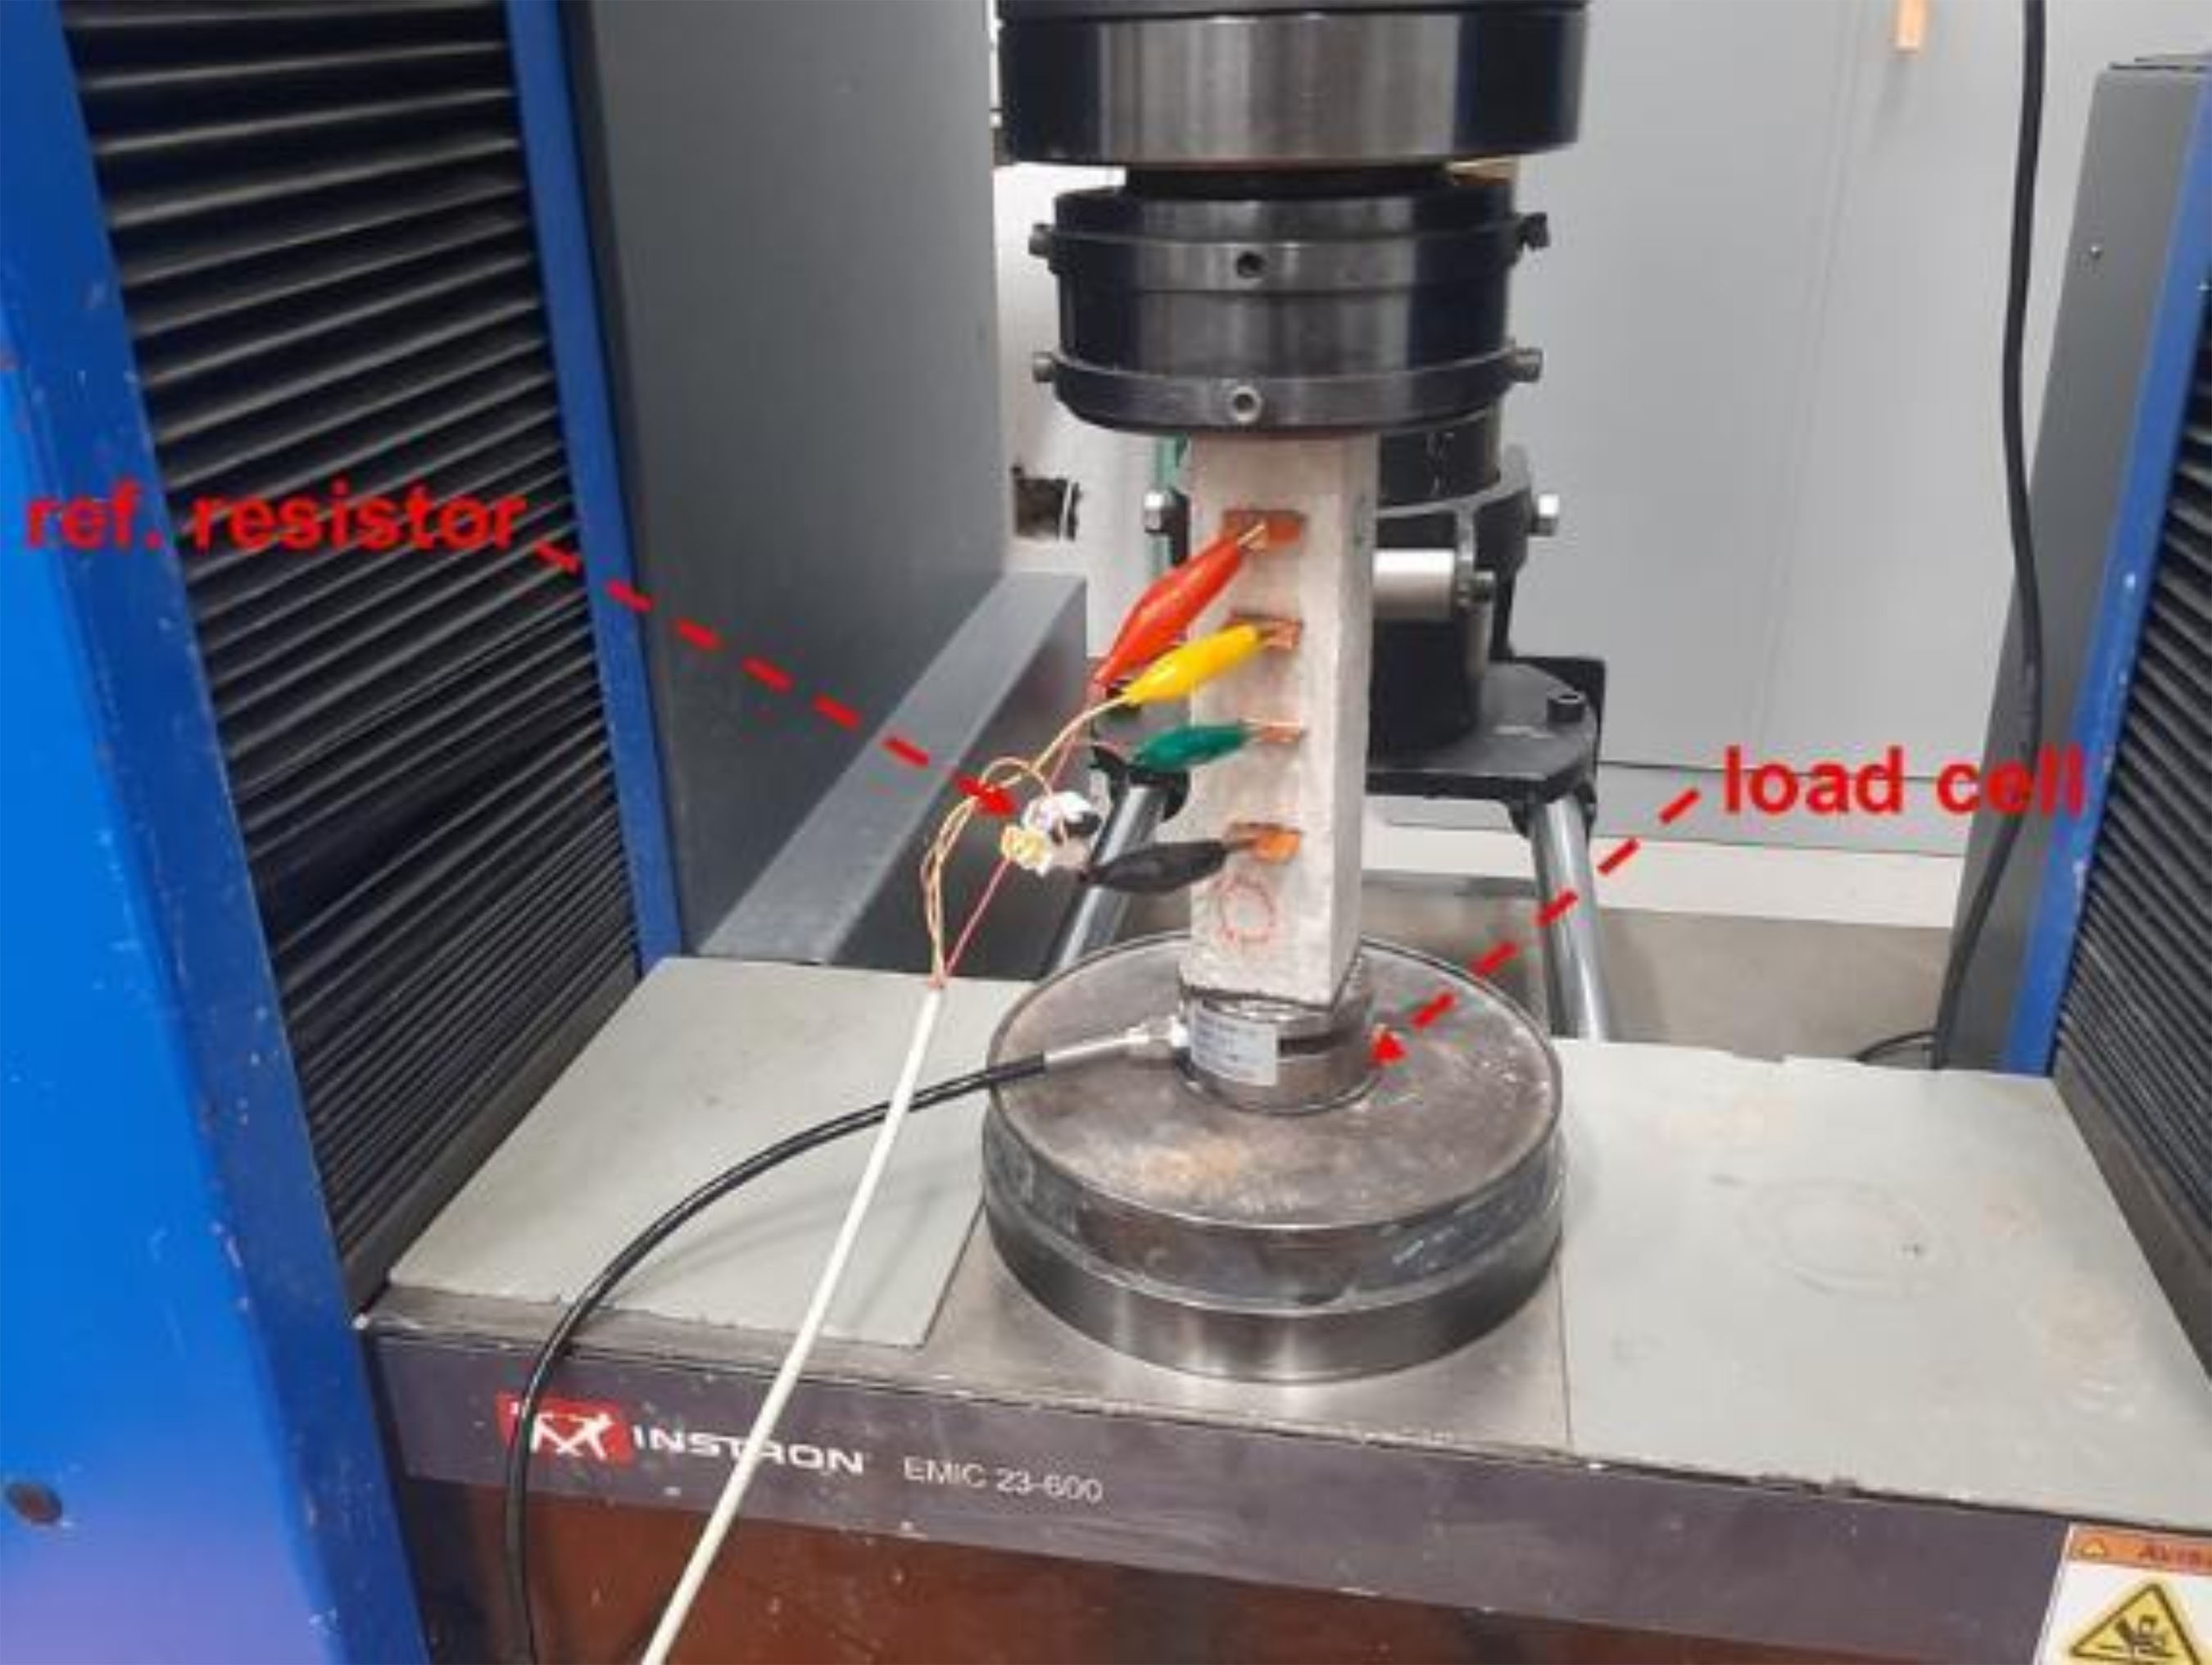
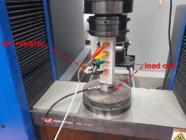
For the piezoresistivity analysis (Figure 10), the voltage readings (from the electrodes of the specimens) and compression force (using a load cell) were recorded simultaneously, at an acquisition rate of 10 Hz.
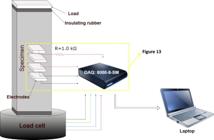
Due to the occurrence of the polarization effect, it was necessary to wait for the stabilization of the electrical voltage measurements, according practice observed in the literature (Ding et al., 2022; Nalon et al., 2020; Liu et al., 2022; Rao; Sasmal, 2022). This stabilization was achieved within 1 to 10 minutes, depending on the mix/composition of the test specimen.
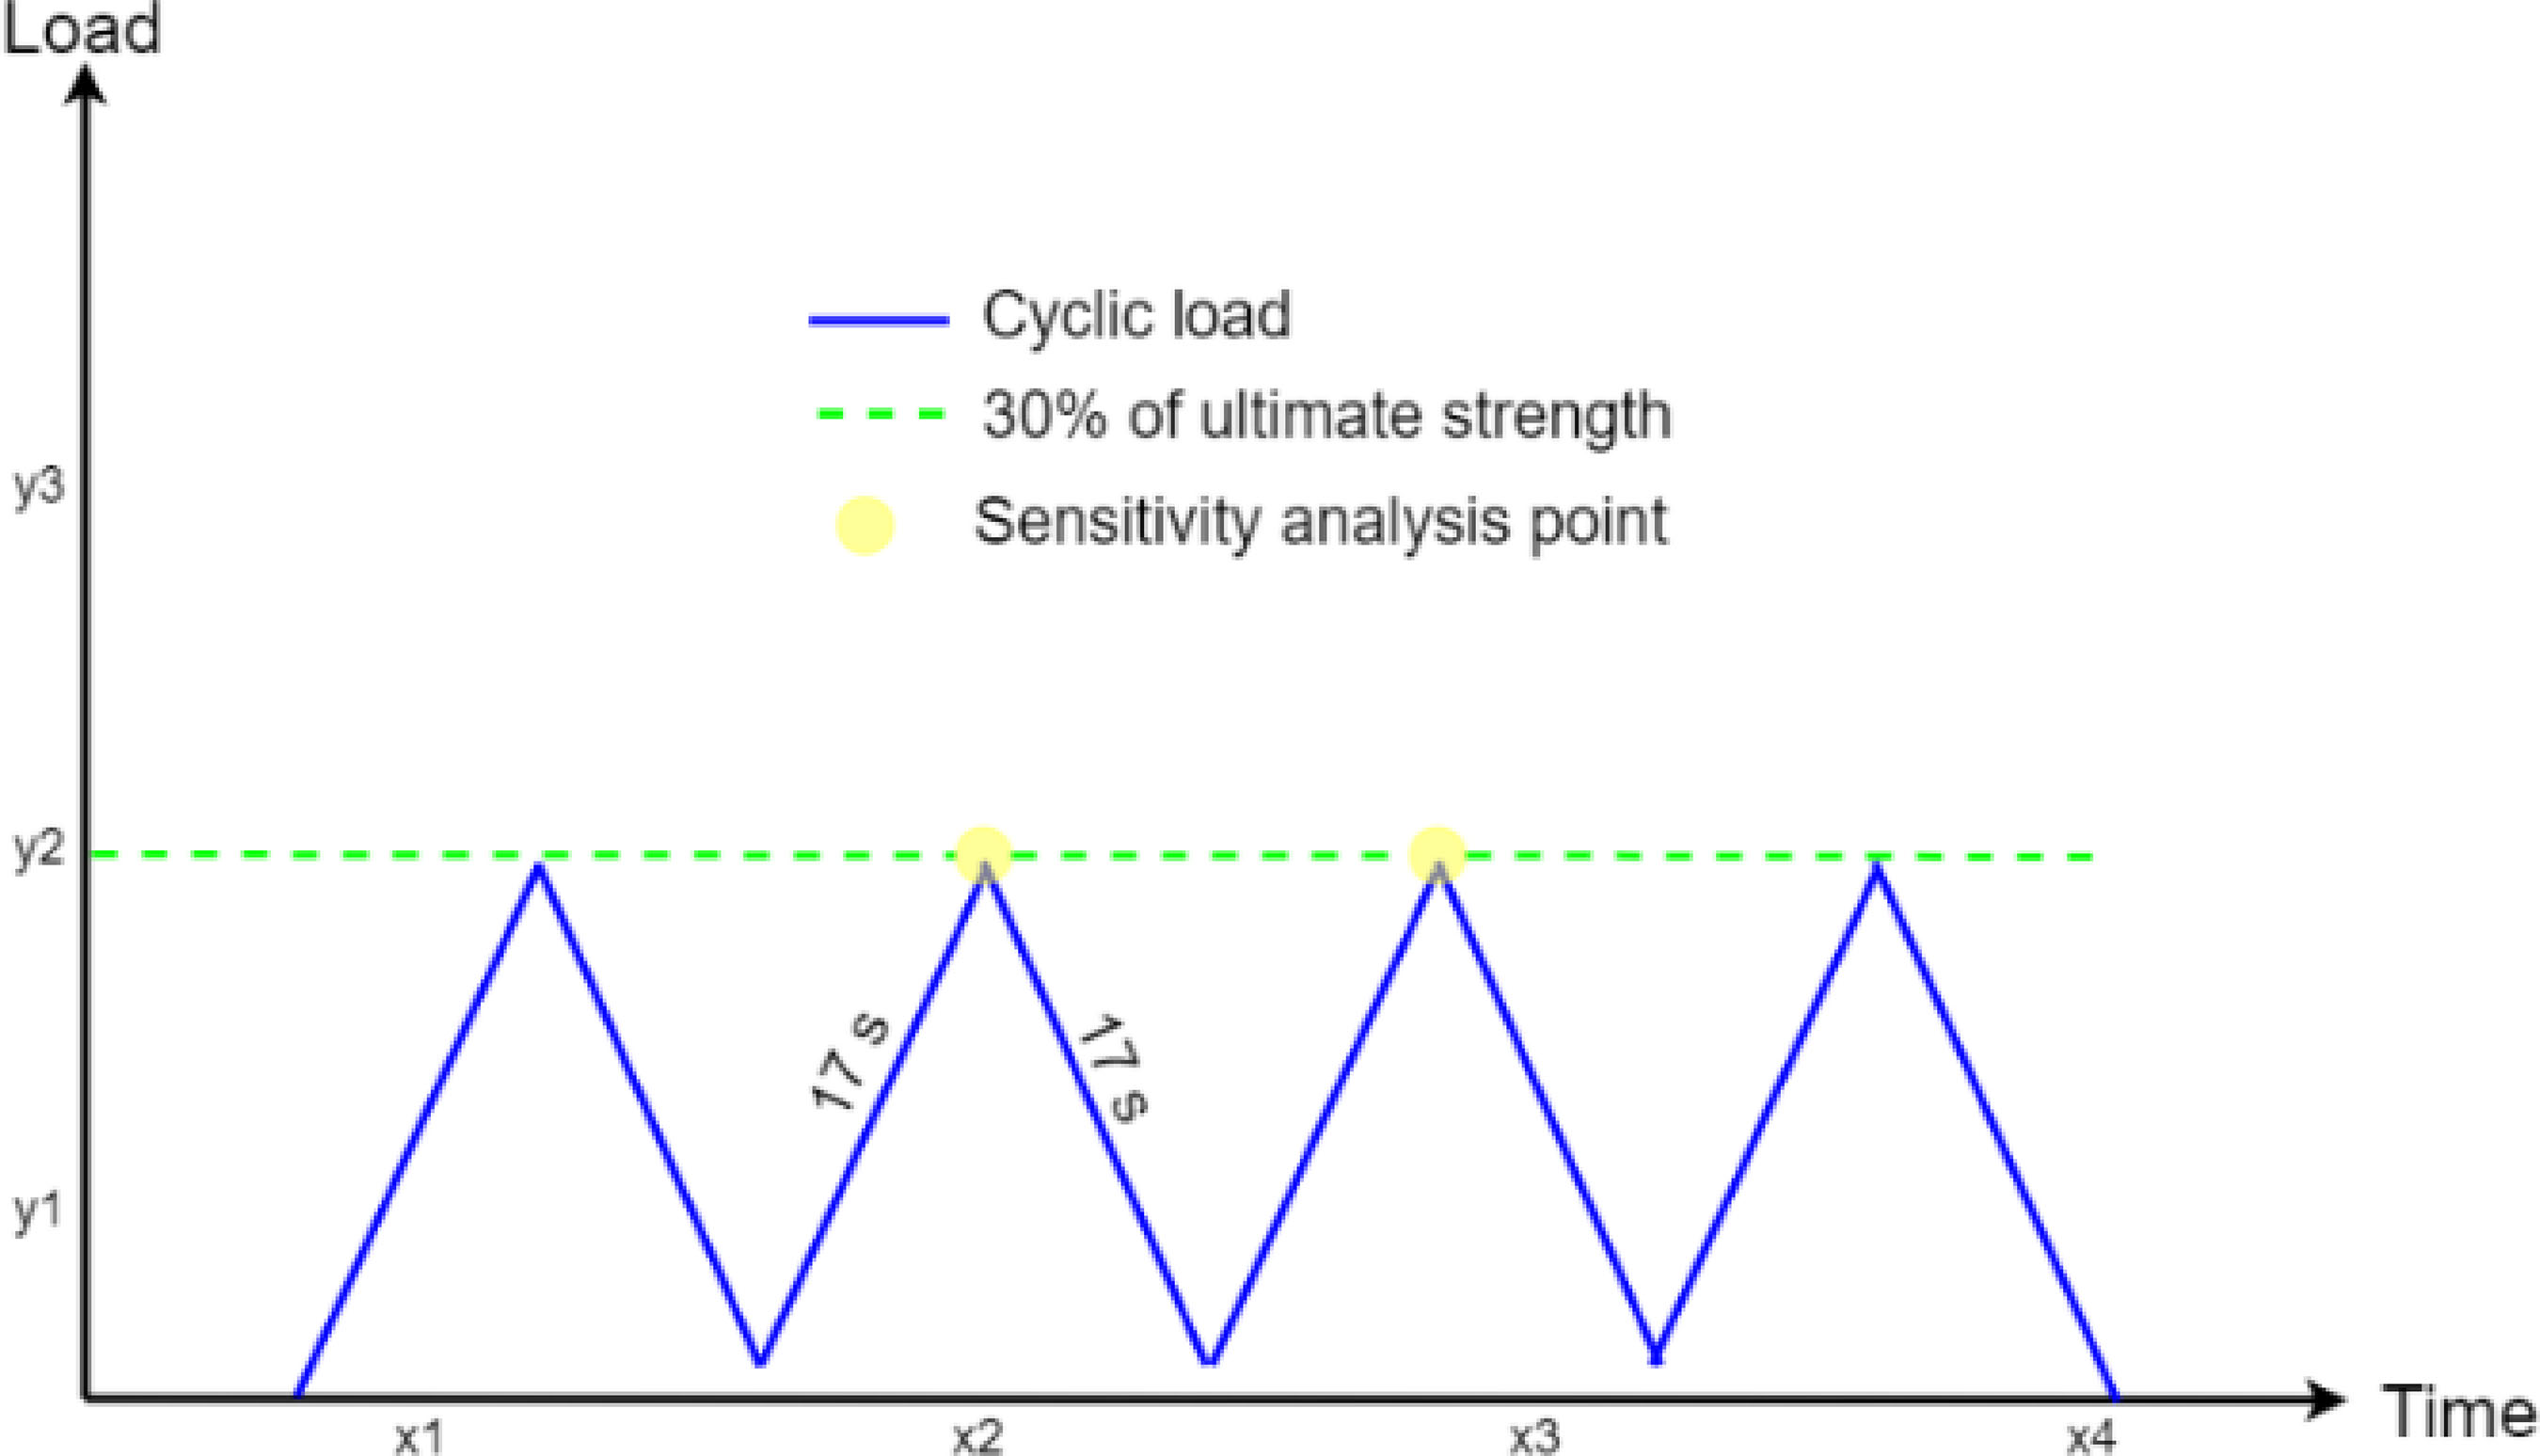
Regarding the application of the compression force to the specimen, cyclic loading was performed based on related studies (Song et al., 2021; Frąc et al., 2022; Cholker; Tantray, 2019; Qiu et al., 2021). The loadings were limited to 30% of the SSCC rupture strength (ABNT, 2021c; Nalon et al., 2021). The 17-second loading and unloading ramps were based on Tian et al. (2022), which resulted in the diagram in Figure 11.
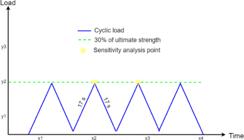
The values of the variation in the compression force (fc) and voltage variation (ΔU), according to Equation 6 (Shahzad et al., 2022), where Un is the voltage reading at the instant “n” (n≥0) and U0 is the first (initial) voltage reading at the instant “0” (zero), were compared with each other to evaluate the piezoresistive effect, as practiced by other researchers (Ferdiansyah; Balayssac; Turatsinze, 2022; Segura et al., 2019). The evaluation of these results used Pearson's coefficient (r), as proposed by Silva, Lintz and Gachet (2023) for self-sensing analyses.
Where:
ΔU is the voltage variation;
Un is the voltage reading at the instant “n”; and
U0 is the first (initial) voltage reading at the instant zero.
The compression stress (σ) values were determined from the compression force (fc) and cross-sectional area of the specimen (Ac), using Equation 7. This was performed to determine the sensitivity analysis (SS) from the compression stress (σ), based on the fractional change in electrical resistivity (FCR), according to Equations 8 and 9 (Kim et al., 2021; Frąc et al., 2022). To obtain the resistivity values (ρ), Equations 3 and 4 were also used.
Where:
σ is the compression stress;
fc is the compression force;
Ac is the cross-sectional area of the specimen;
SS is the stress sensitivity;
FCR is the fractional change in electrical resistivity; and
ρ is the electrical resistivity.
To apply the compression force, a universal testing machine model 23-600, manufactured by EMIC/Instron (Figure 12), was used. The ends of the test specimen were insulated with a layer of Neoprene® to prevent the passage of electrical current between the specimen and the testing machine.
Finally, for microstructural analysis, the following equipment was used: a scanning electron microscope (SEM), model VEGA 3 SEM (TESCAN), with a tungsten filament, maximum energy of 30 kV, and a maximum theoretical resolution of 3 nm and 8 nm at 3 kV; and an energy-dispersive X-ray spectroscopy (EDS) detector, model XFlash 630M (Bruker). The samples used in the microstructural analysis were obtained from fragments of the specimens used in the mechanical strength tests. These samples underwent a preliminary drying process for 24 hours in an oven at a temperature of 105 ± 5 °C.
4 Results and discussions
4.1 Mechanical properties
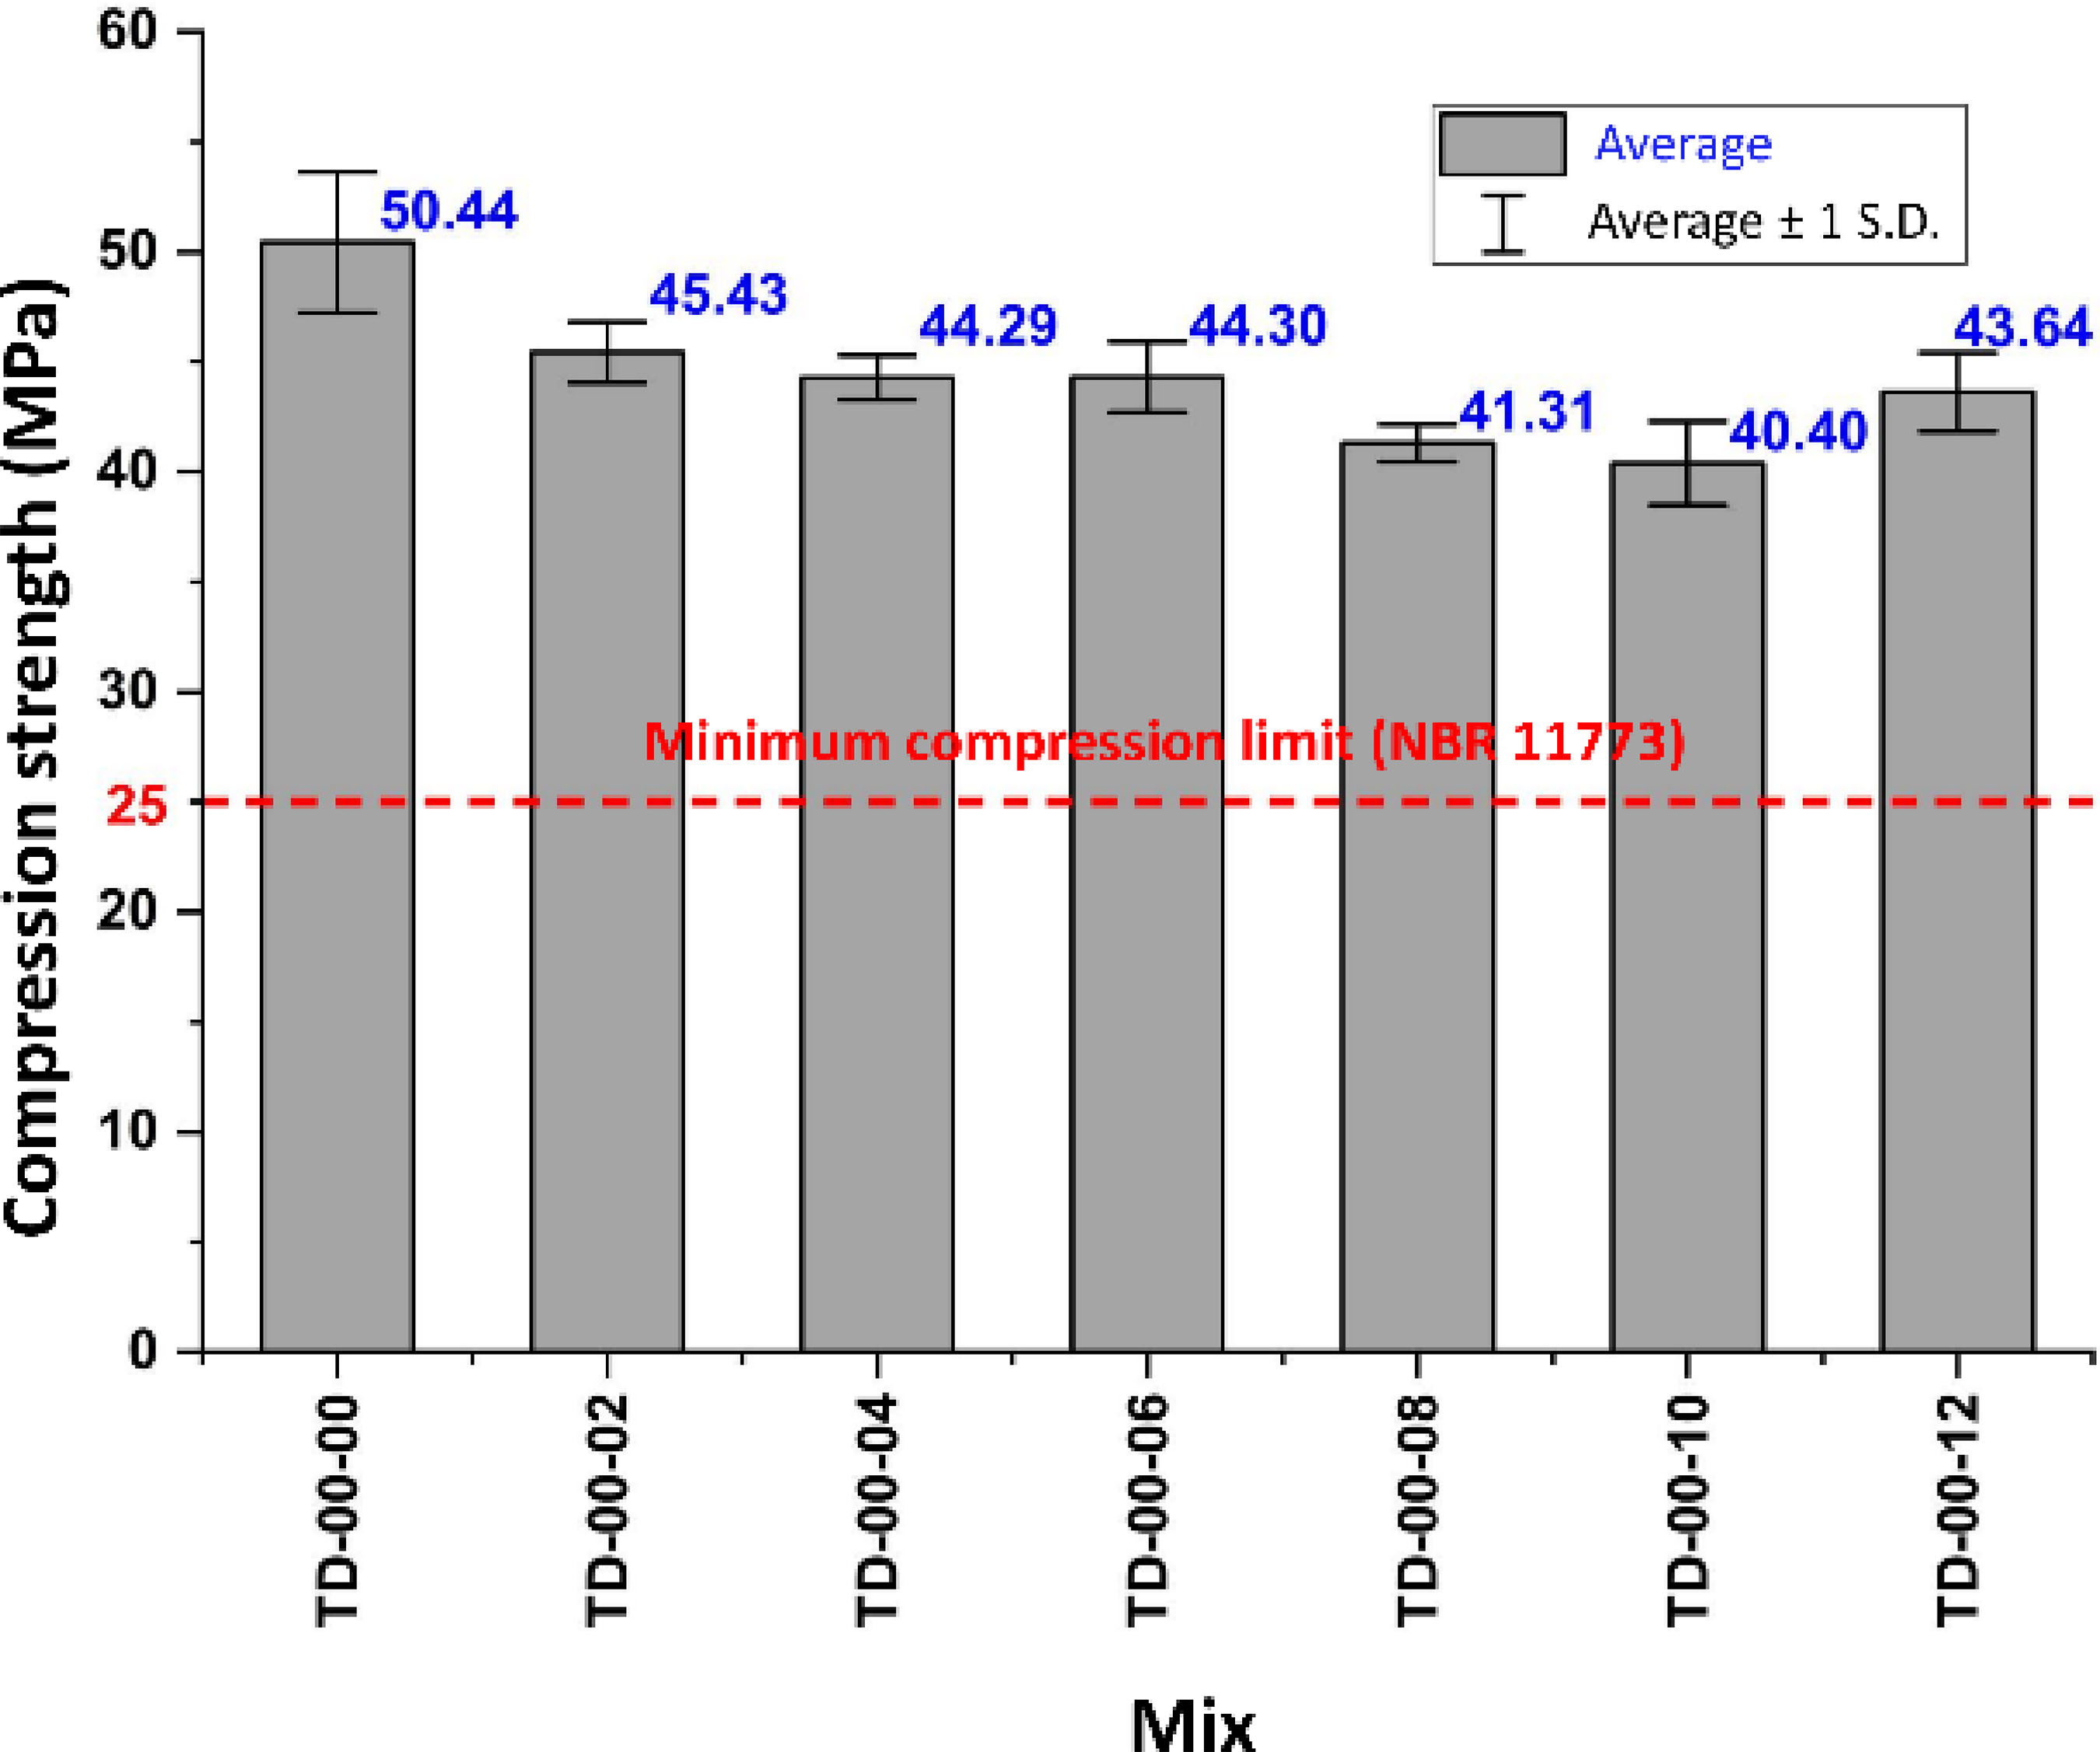
Regarding the mechanical results, the compression strength (Figure 13) showed a reduction with the addition of carbon microfiber. This reduction has been reported in the literature (Belli et al., 2018) and could be attributed to the difficulties in the compaction of the cement matrix due to the presence of the microfiber (Donnini; Bellezze; Corinaldesi, 2018). Although compressive strength has decreased, all the mix proportions presented values higher than the minimum of 25 MPa required by technical standard NBR 11173 (ABNT, 1990).
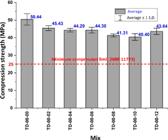
A P-value was obtained from the analysis of variance constant in Table 4, based on the individual compression strength results. This value consolidated the alternative hypothesis that there is a difference between the groups for a critical significance level of 0.05.
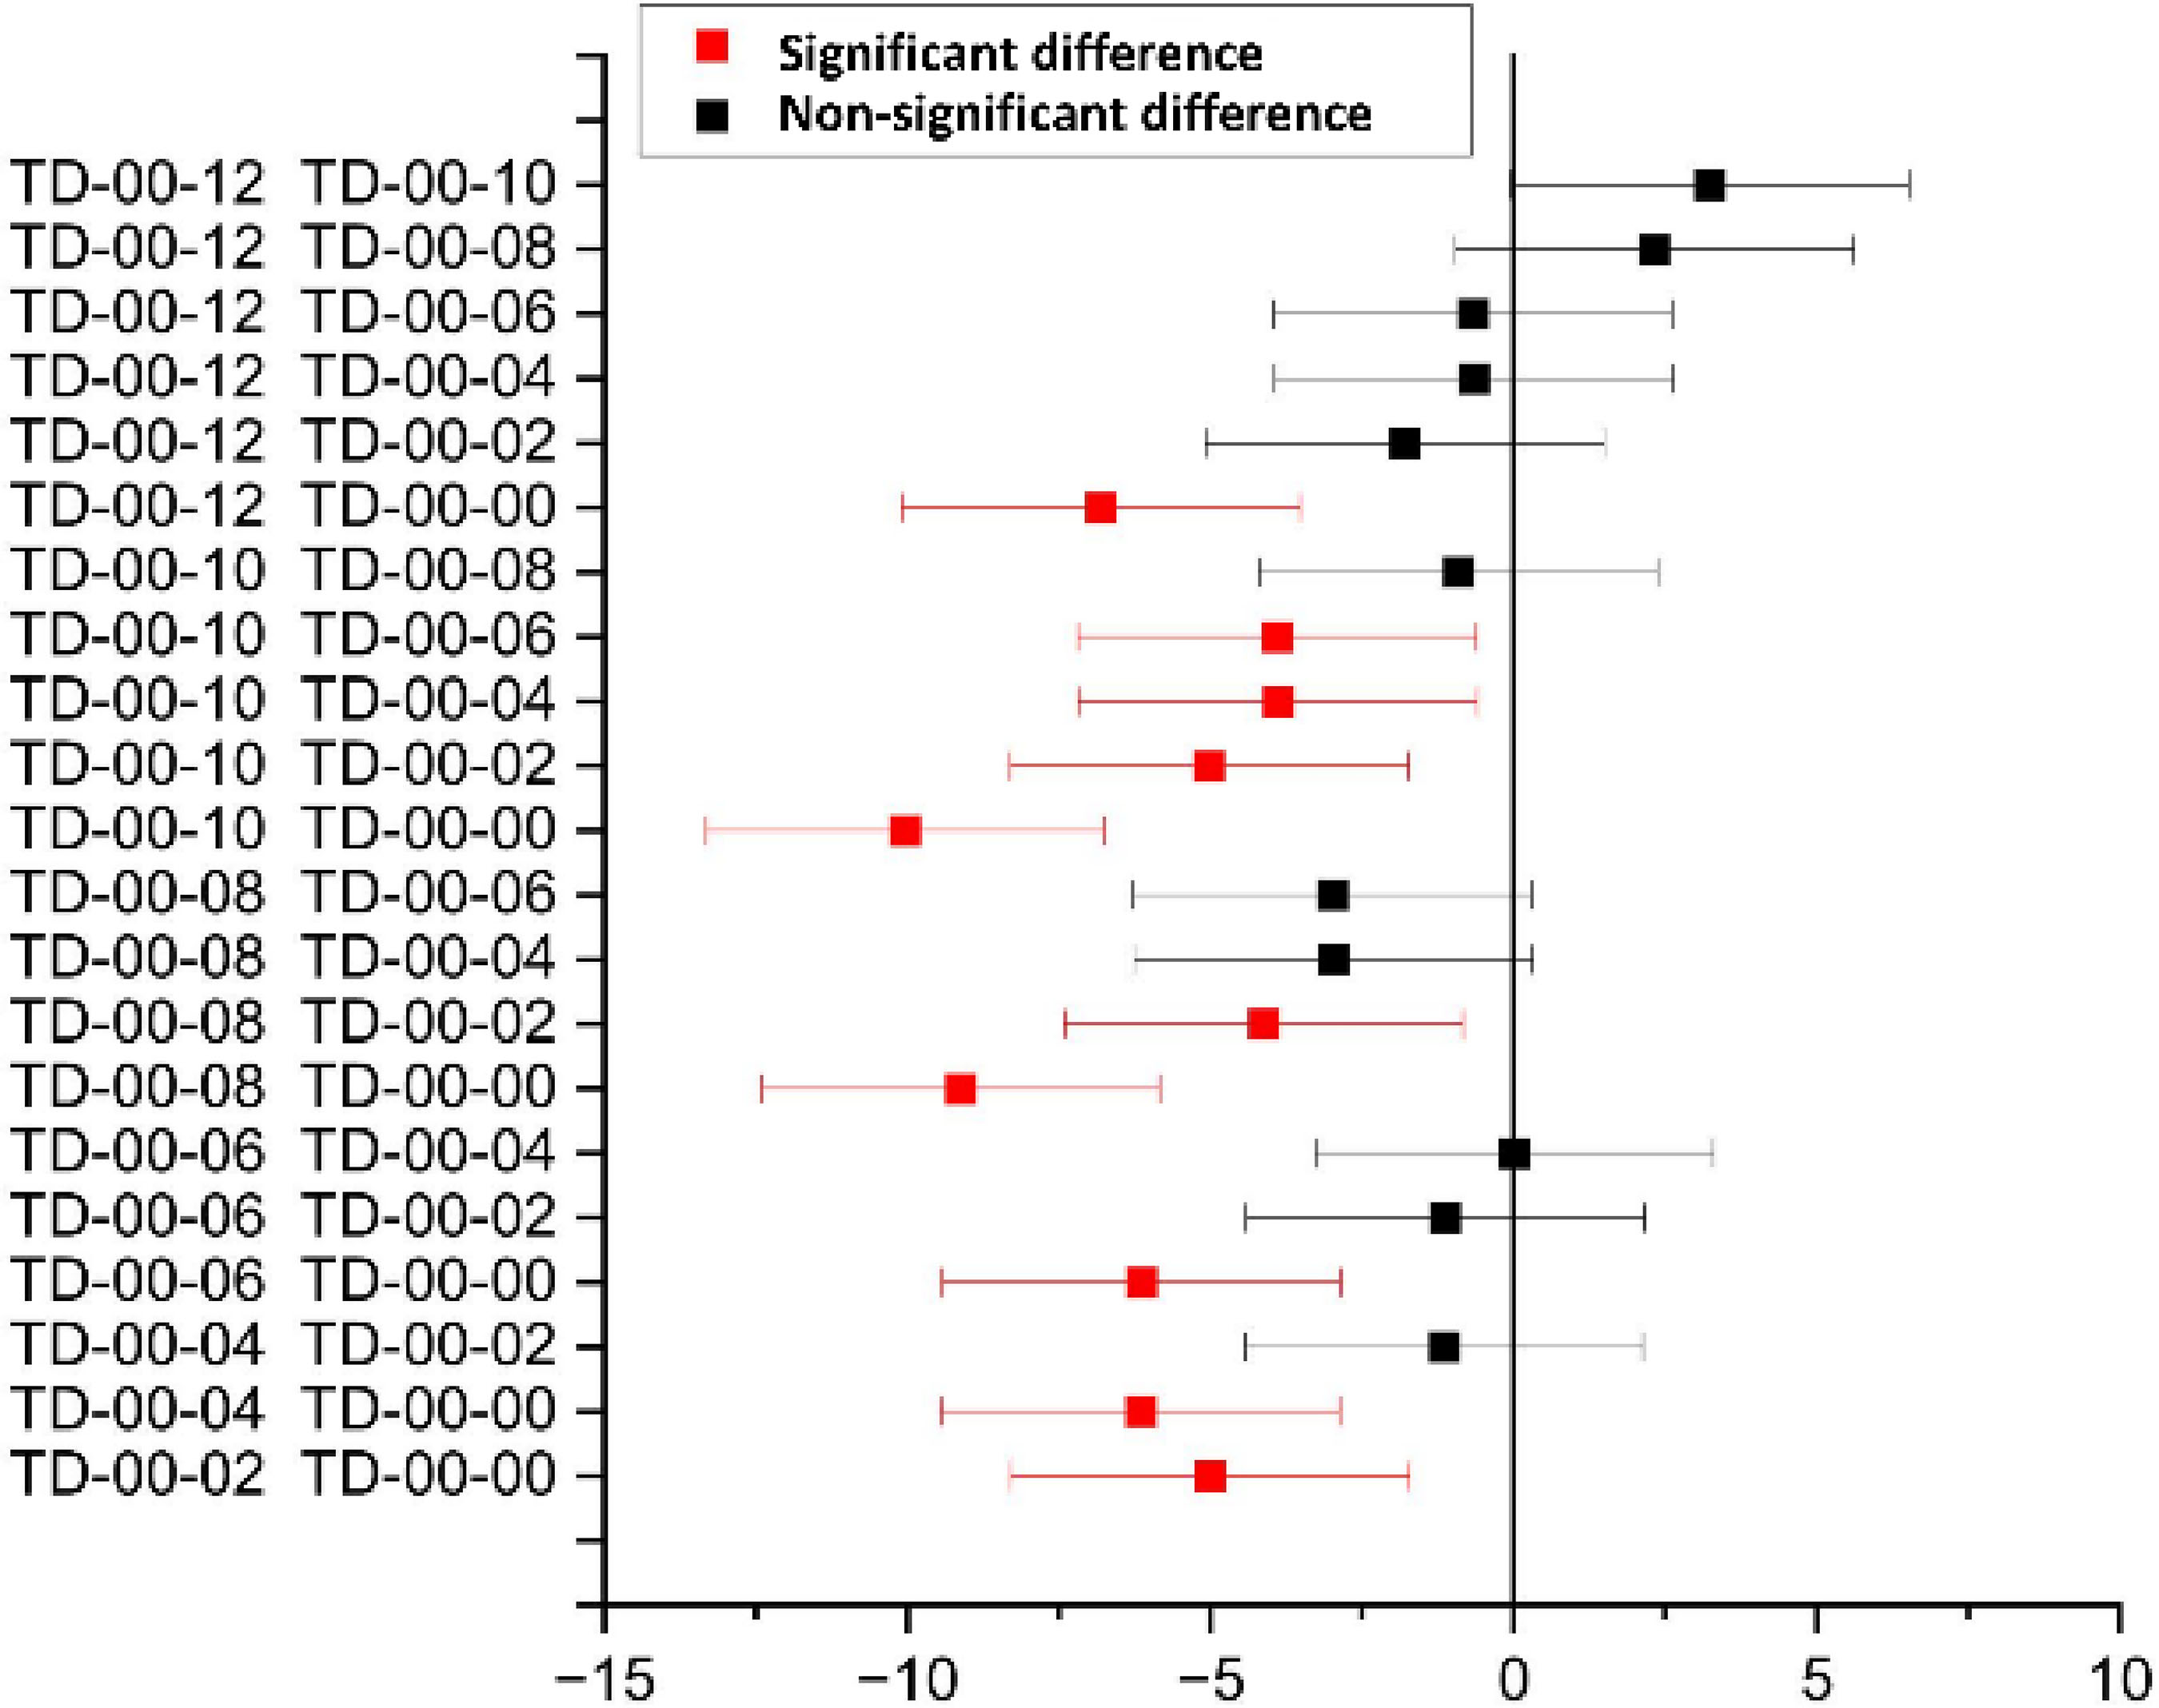
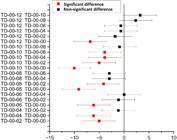
In the Tukey Test analysis (Figure 14) of the compression strength results, all mixes showed a statistically significant difference in the loss of strength in relation to the reference mix (TD-00-00). That is, compression strength differs significantly by carbon microfiber content.
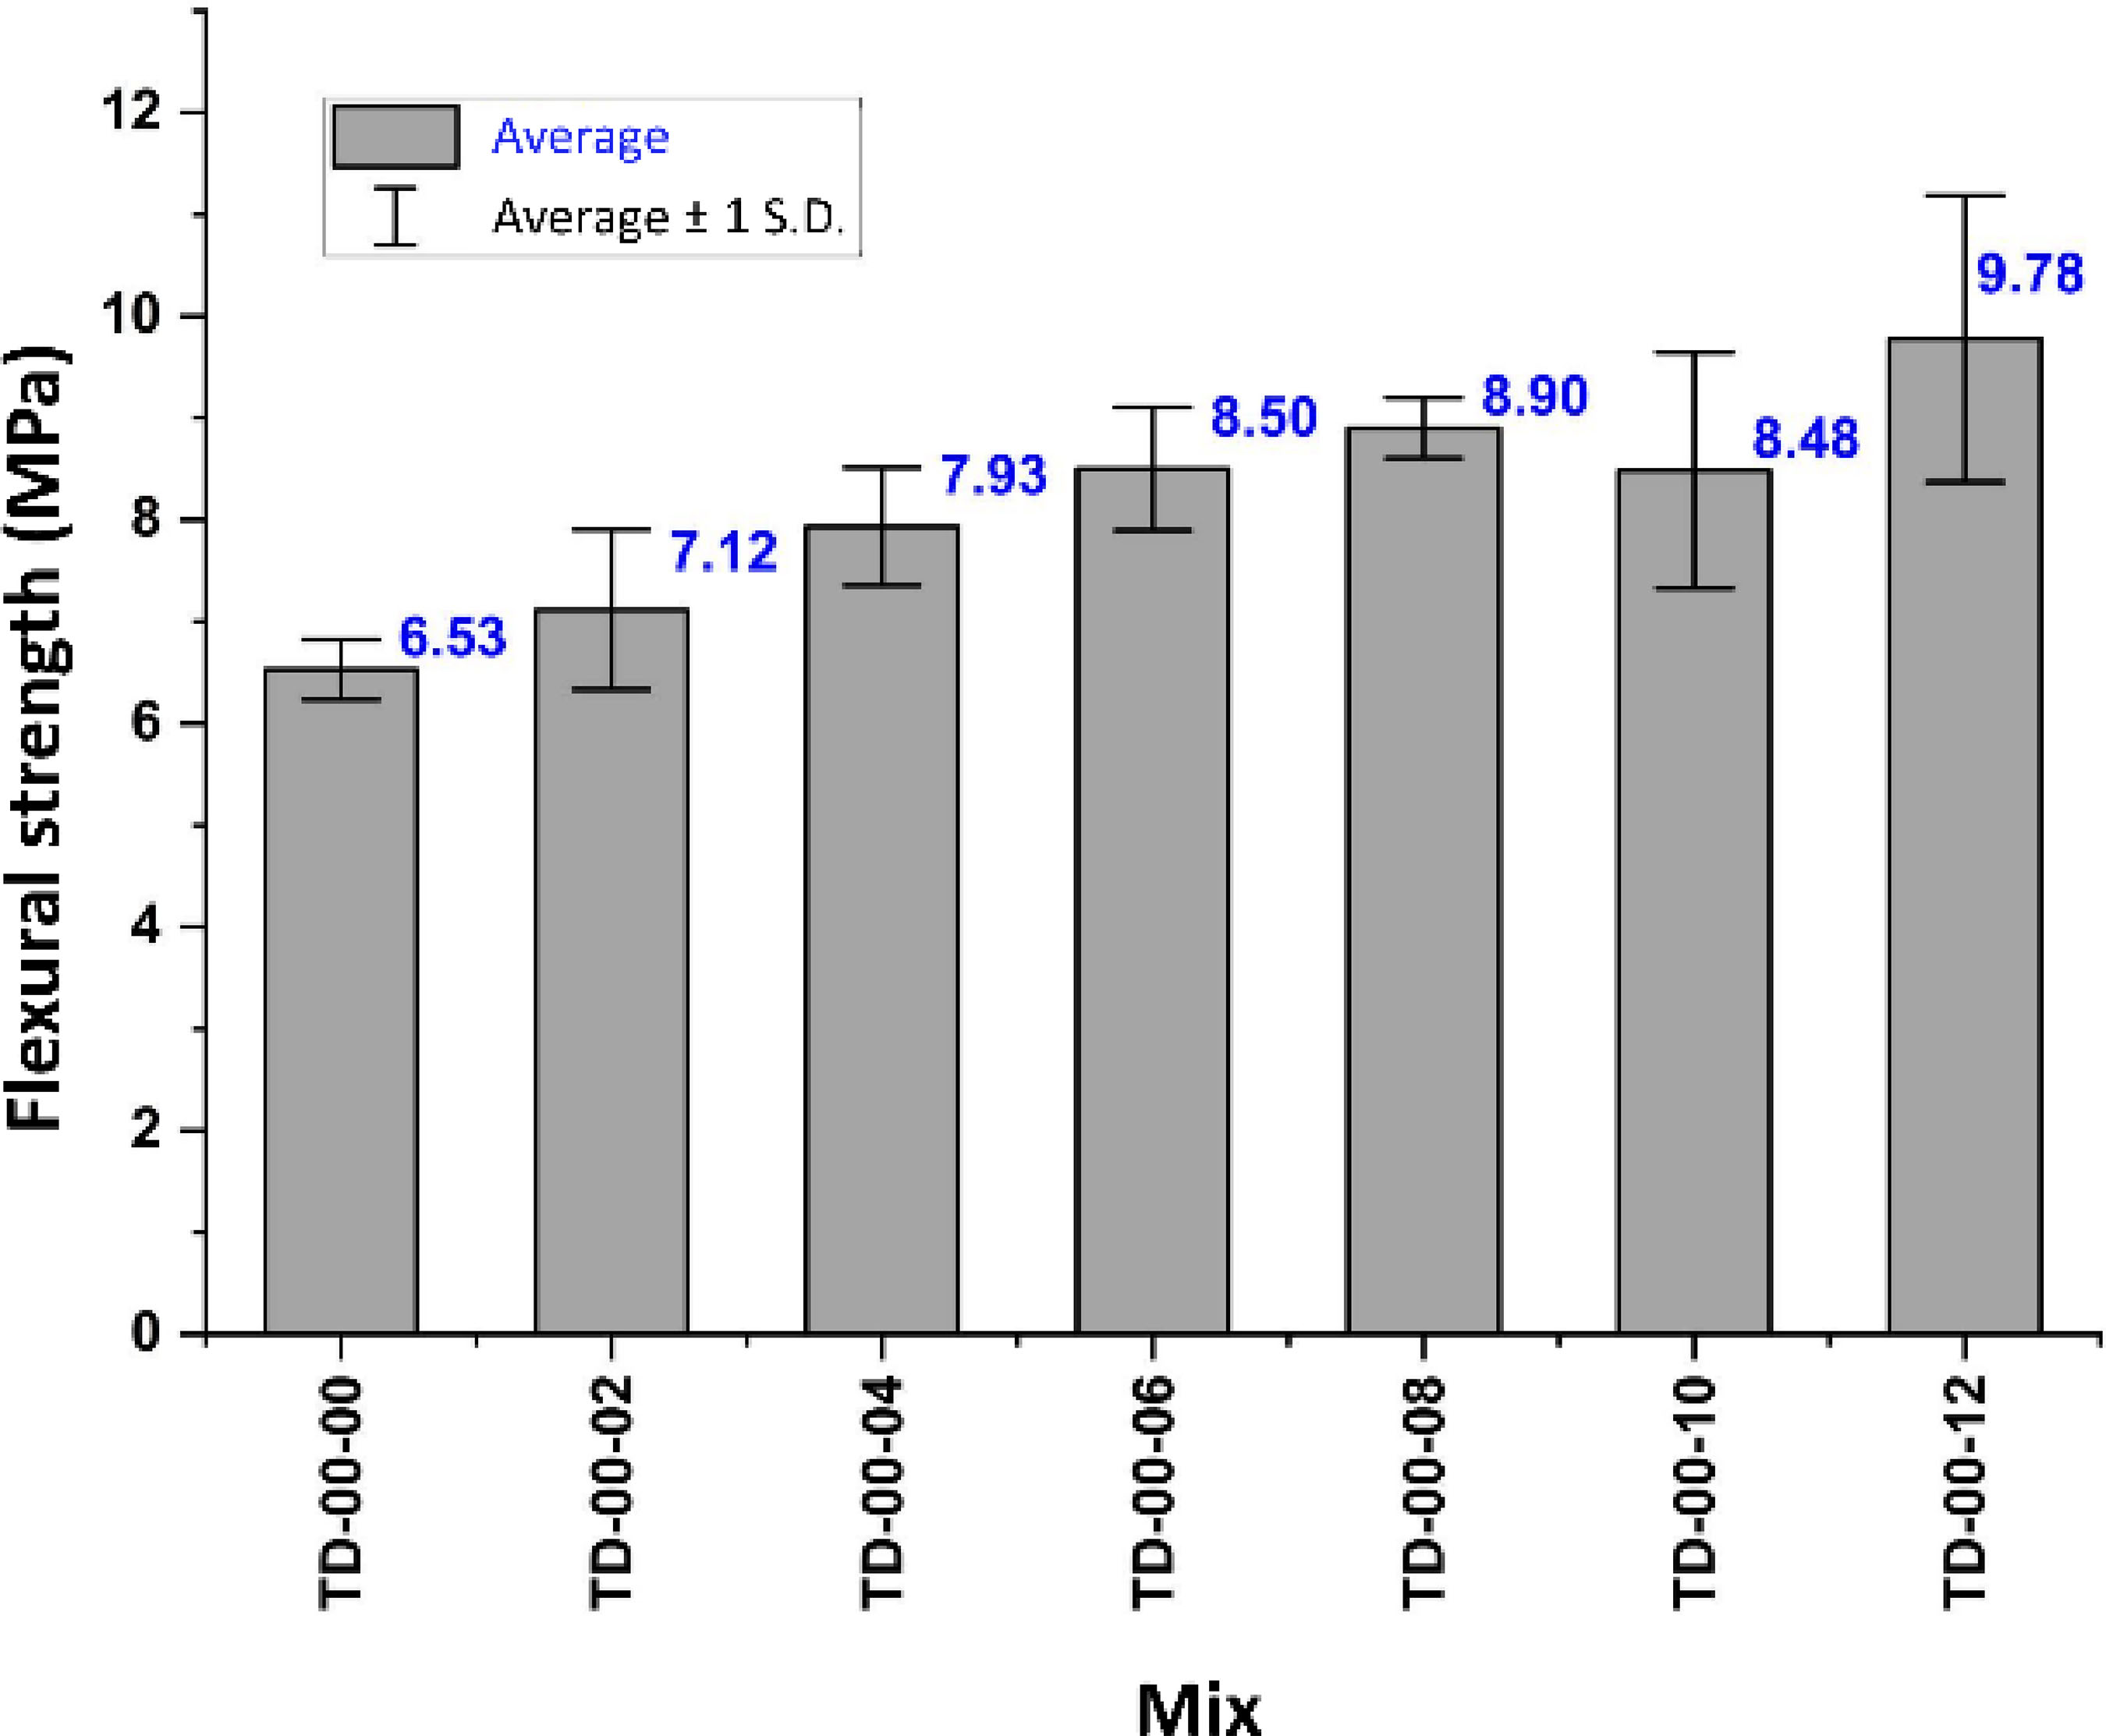
Regarding the flexural strength results (Figure 15), an increase in resistance occurred. This increase is frequently reported in the literature regarding the use of carbon fibers in cementitious composites (Donnini; Bellezze; Corinaldesi, 2018; Belli et al., 2020; Safiuddin; Abdel-Sayed; Hearn, 2022; Muthukumarana et al., 2023).
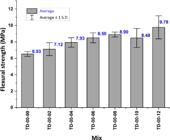
A P-value was obtained from the analysis of constant variance in Table 5, based on the individual results of flexural strength, which consolidated the alternative hypothesis that there is a difference between the groups for a critical level of significance of 0.05. That is, flexural strength differs significantly by carbon microfiber content.
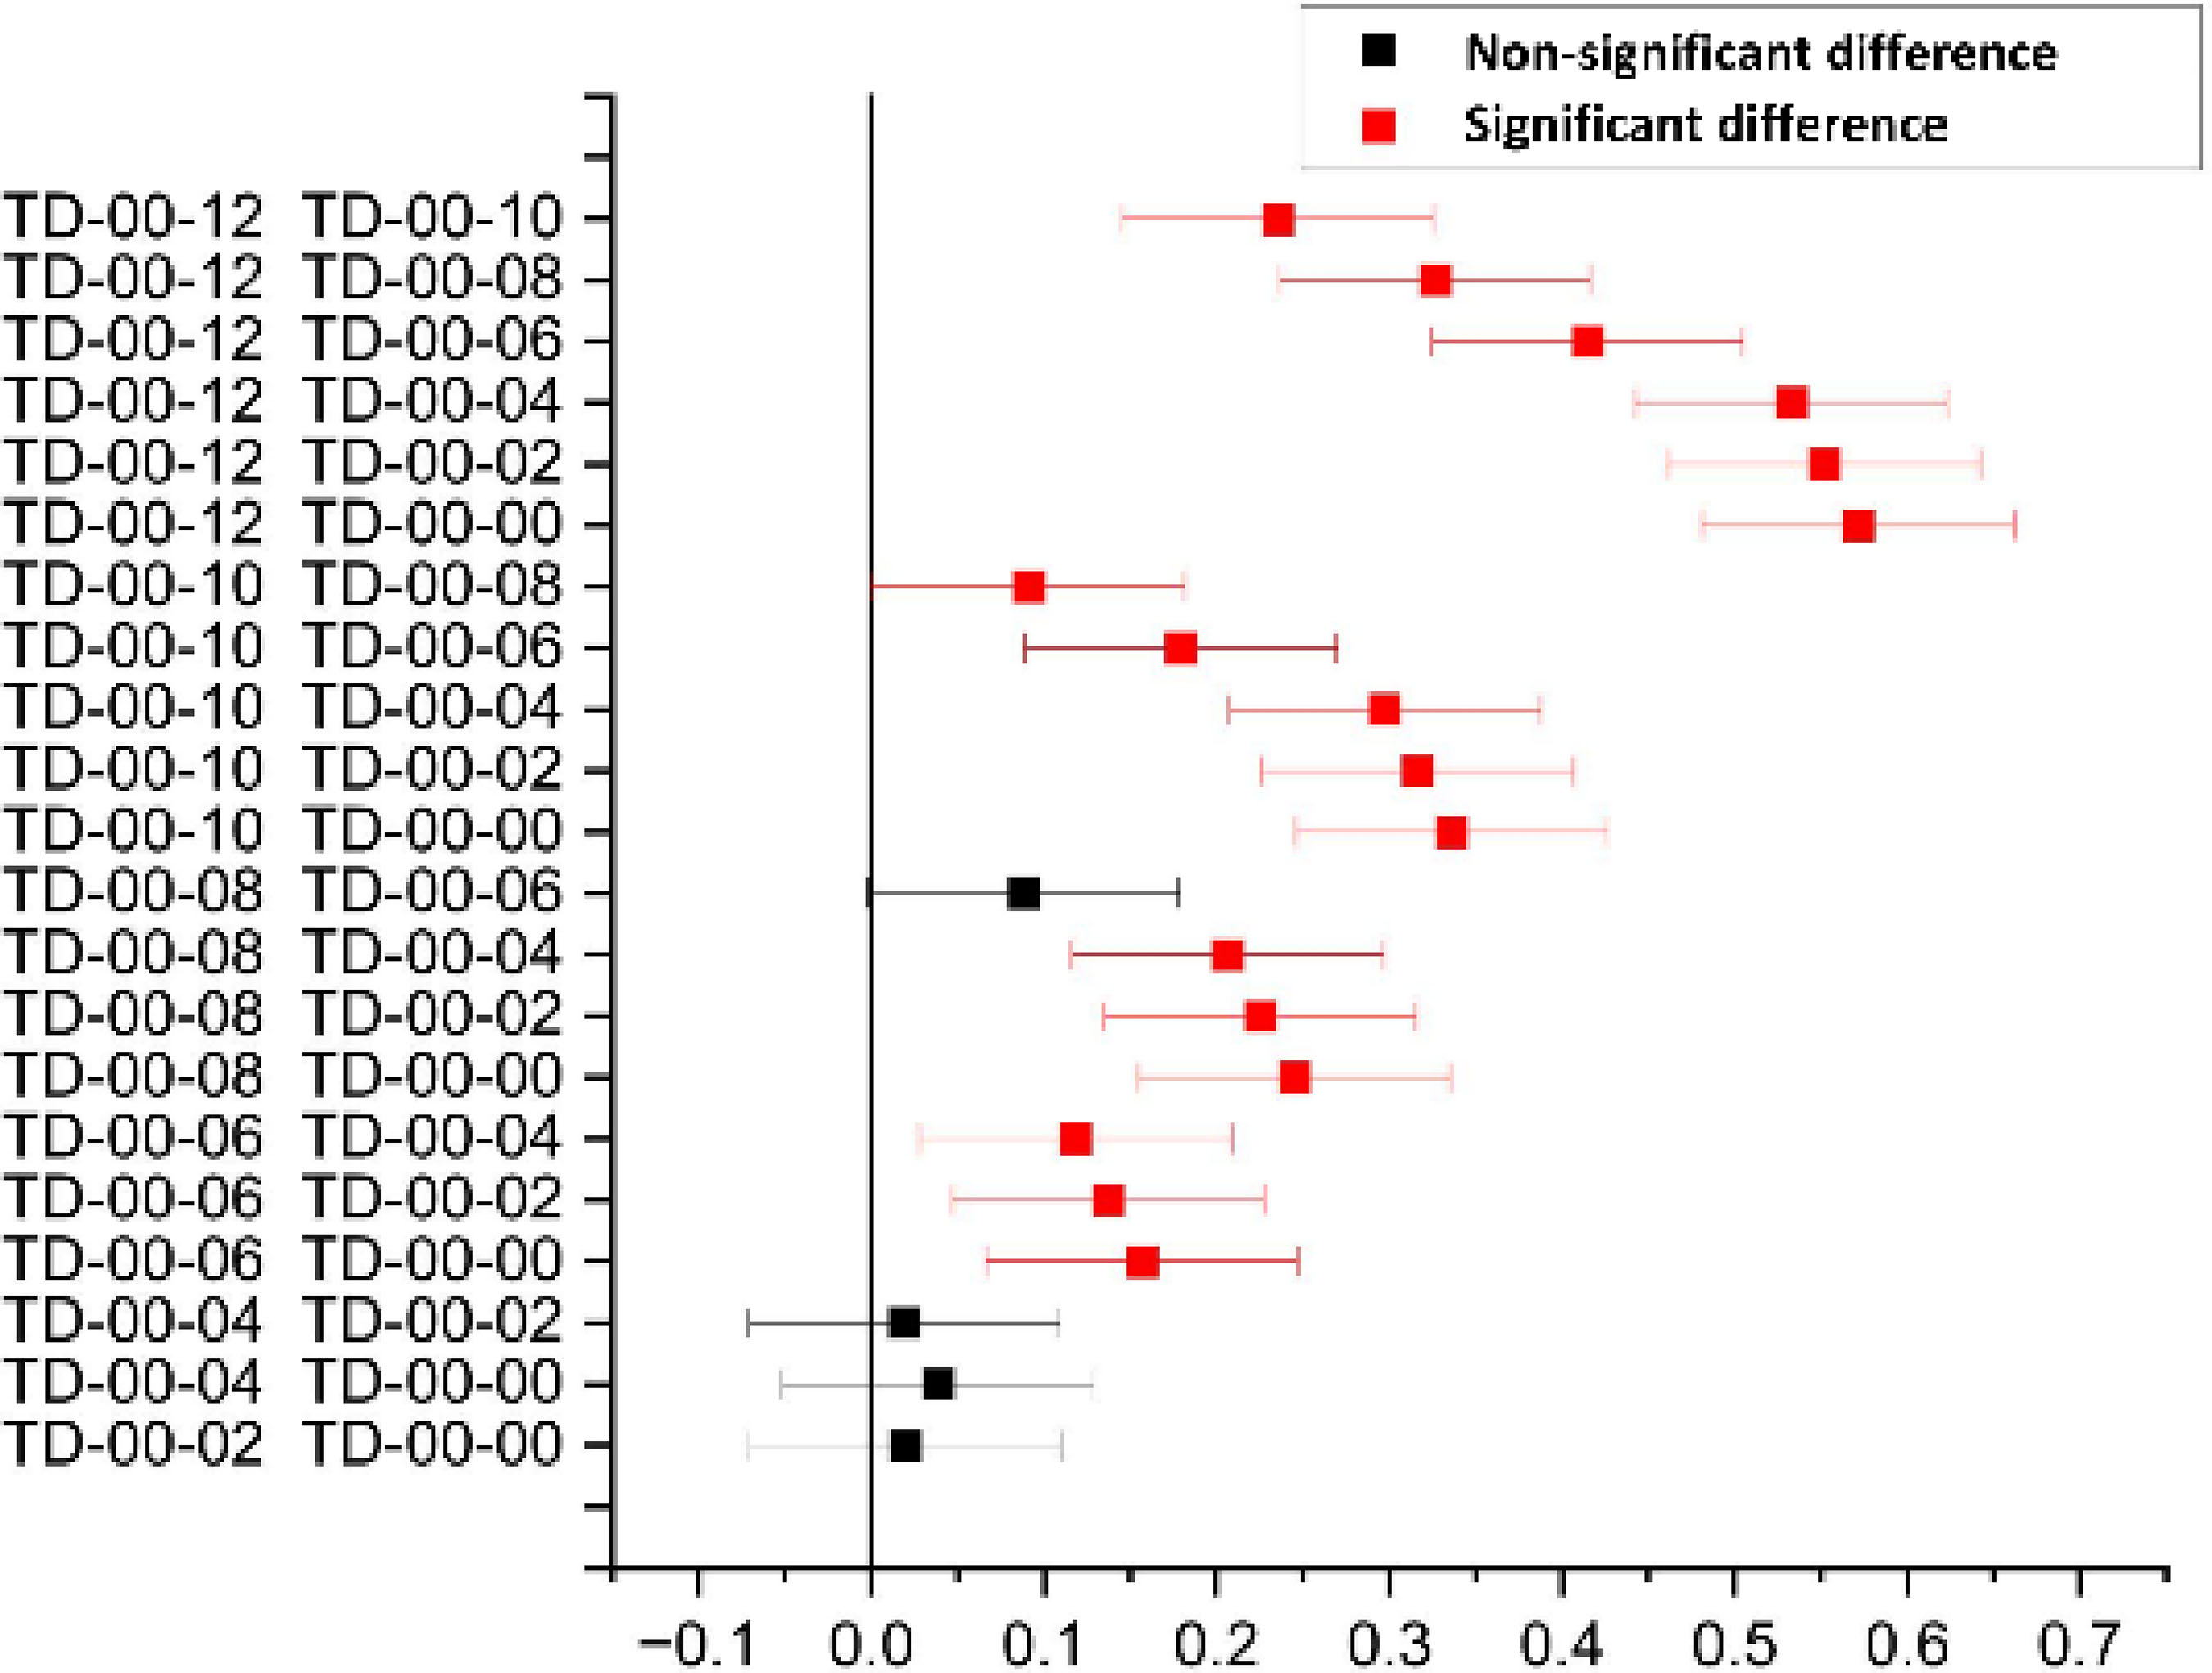
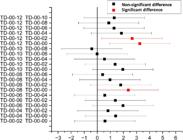
In the Tukey Test analysis (Figure 16), the TD-00-08 and TD-00-12 mixtures showed a statistically significant difference in the gain in flexural strength, in relation to the reference mixture (TD-00-00).
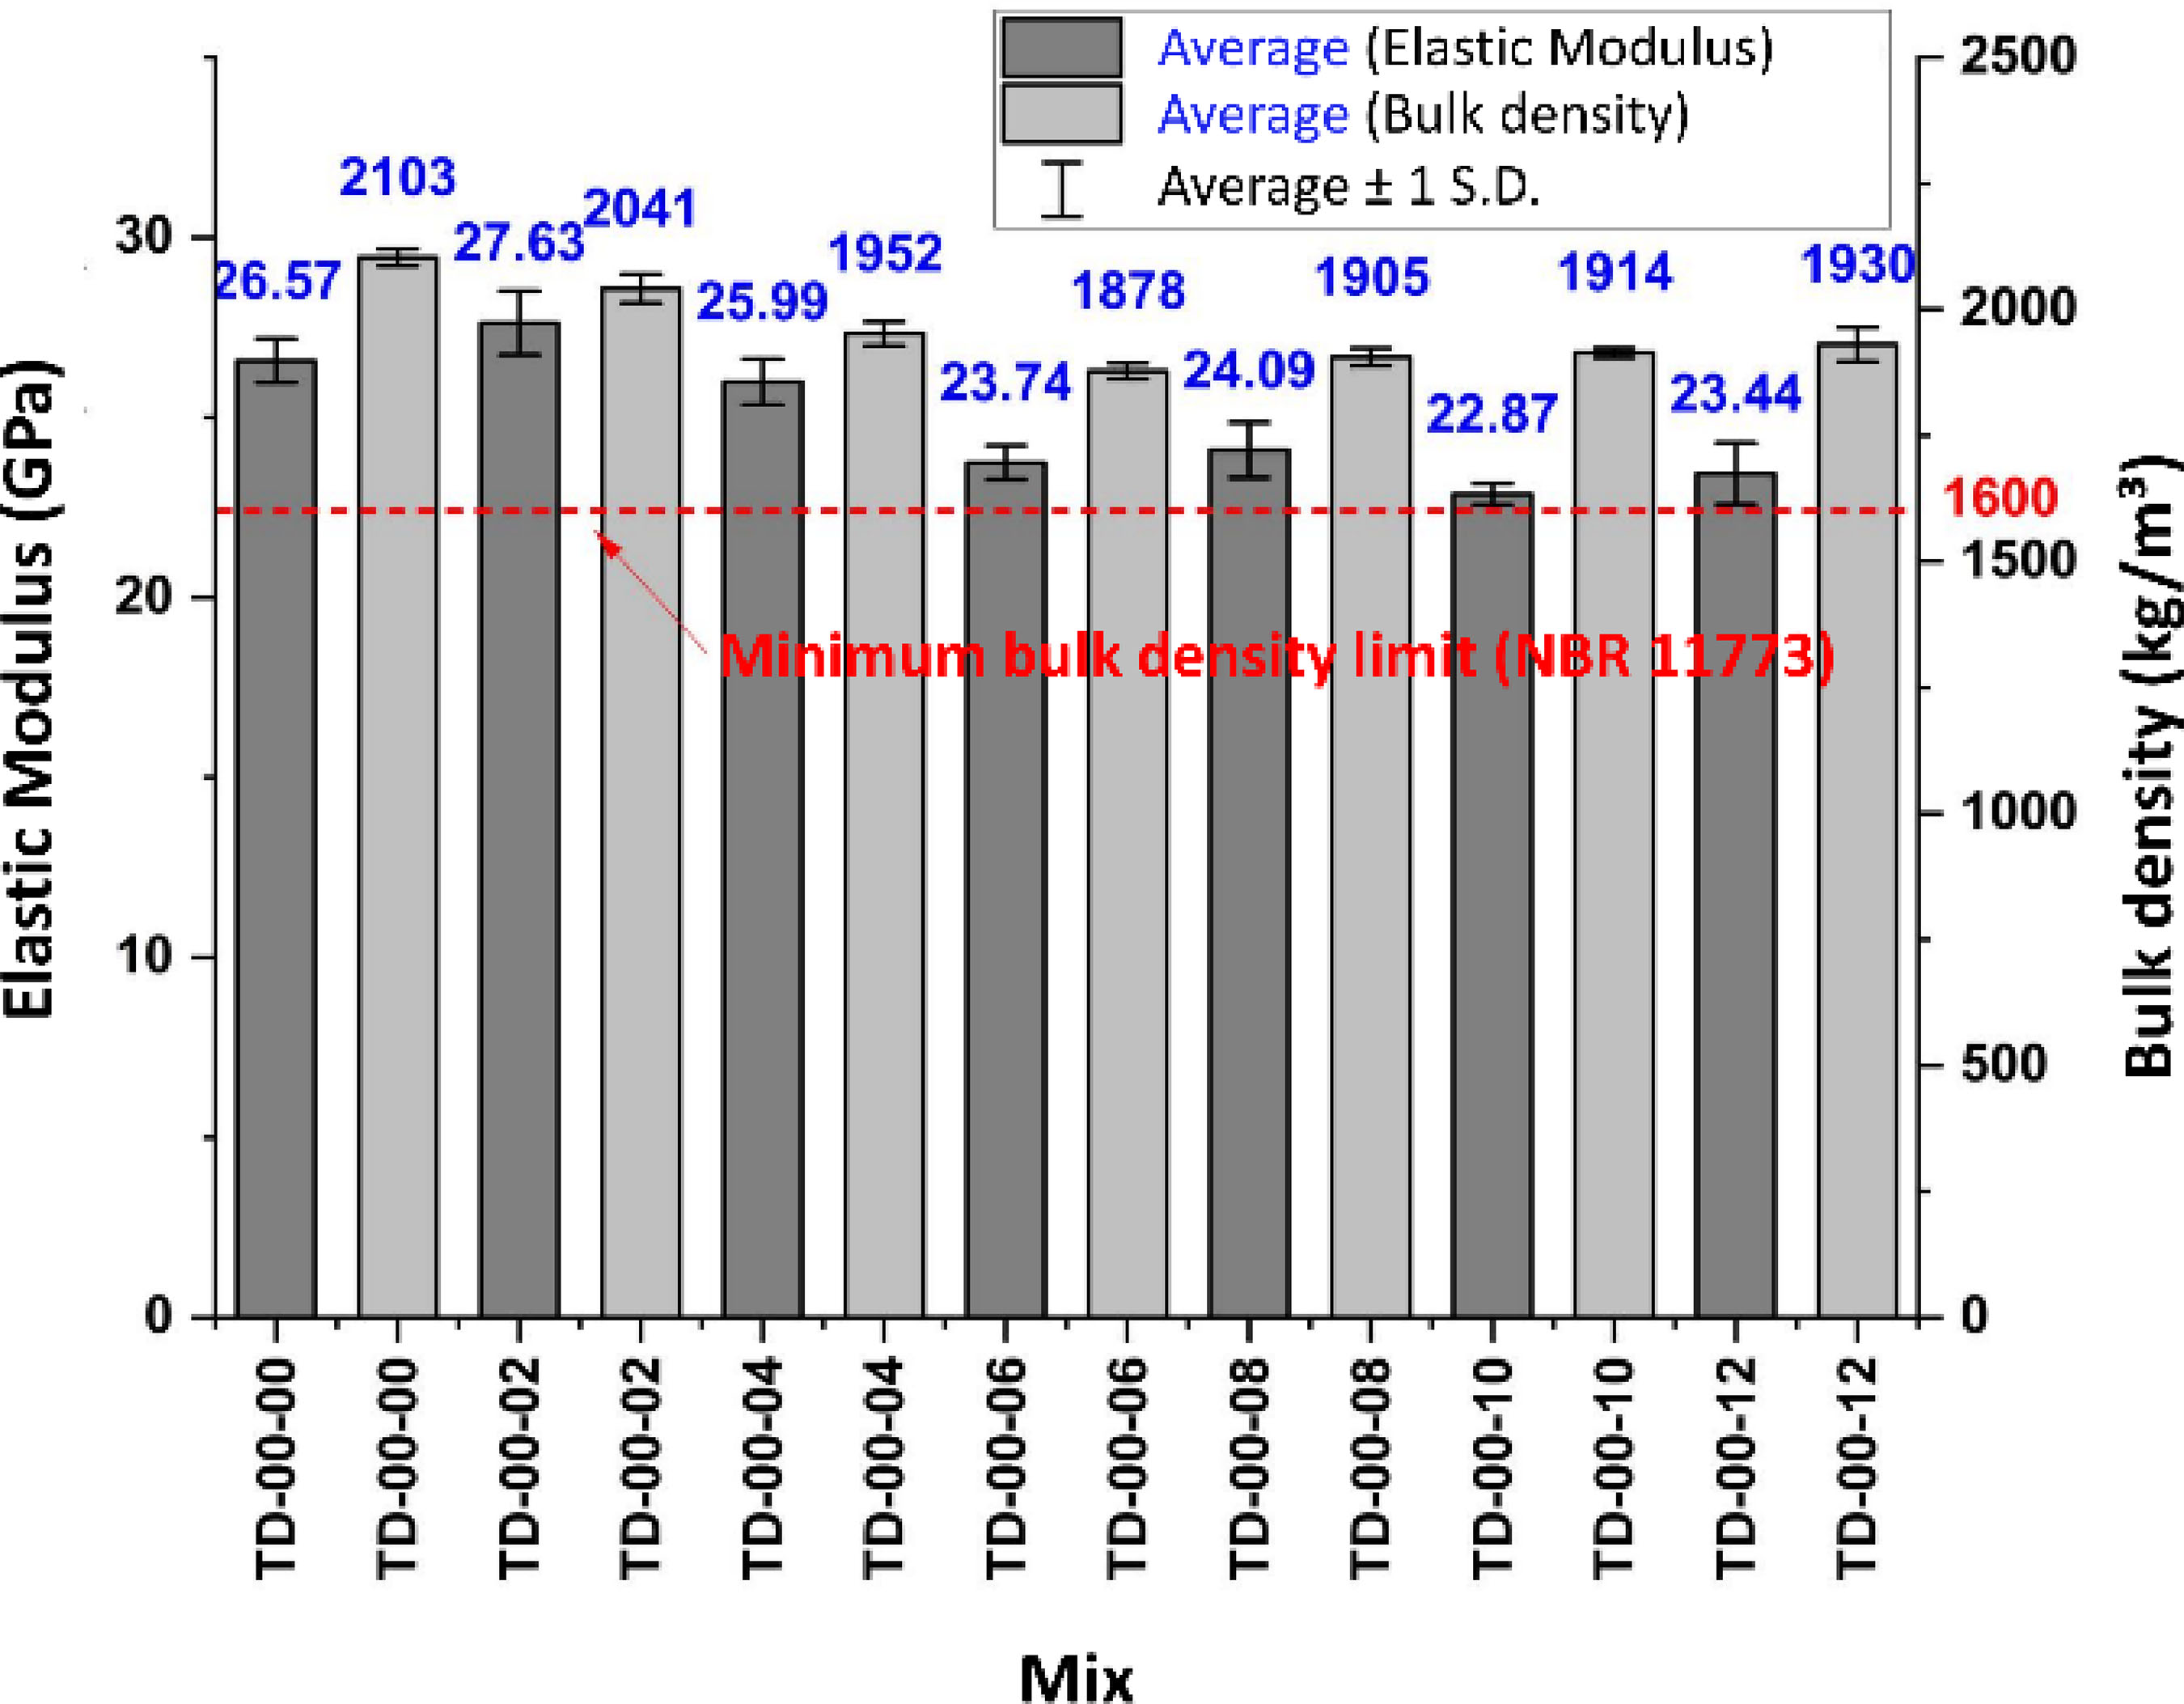
In the case of the elastic modulus and bulk density (Figure 17), beyond the reduction in both, a Pearson correlation of 0.82 was observed between the results of both quantities. This same behavior was observed by Vipulanandan and Garas (2008), who attributed the reduction in modulus to the decrease in mortar density, with the incorporation of carbon fibers. This situation may be associated with the difference in density between the carbon microfiber and any voids caused by its addition. Despite the lower bulk density, all the mix proportions presented values higher than the minimum of 1600 kg/m³ required by technical standard NBR 11173 (ABNT, 1990).
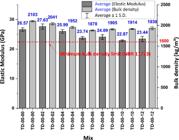
A P-value was obtained from the analysis of variance constant in Table 6, based on the individual results of the elastic modulus. This value consolidated the alternative hypothesis that there is a difference between the groups for a critical significance level of 0.05.
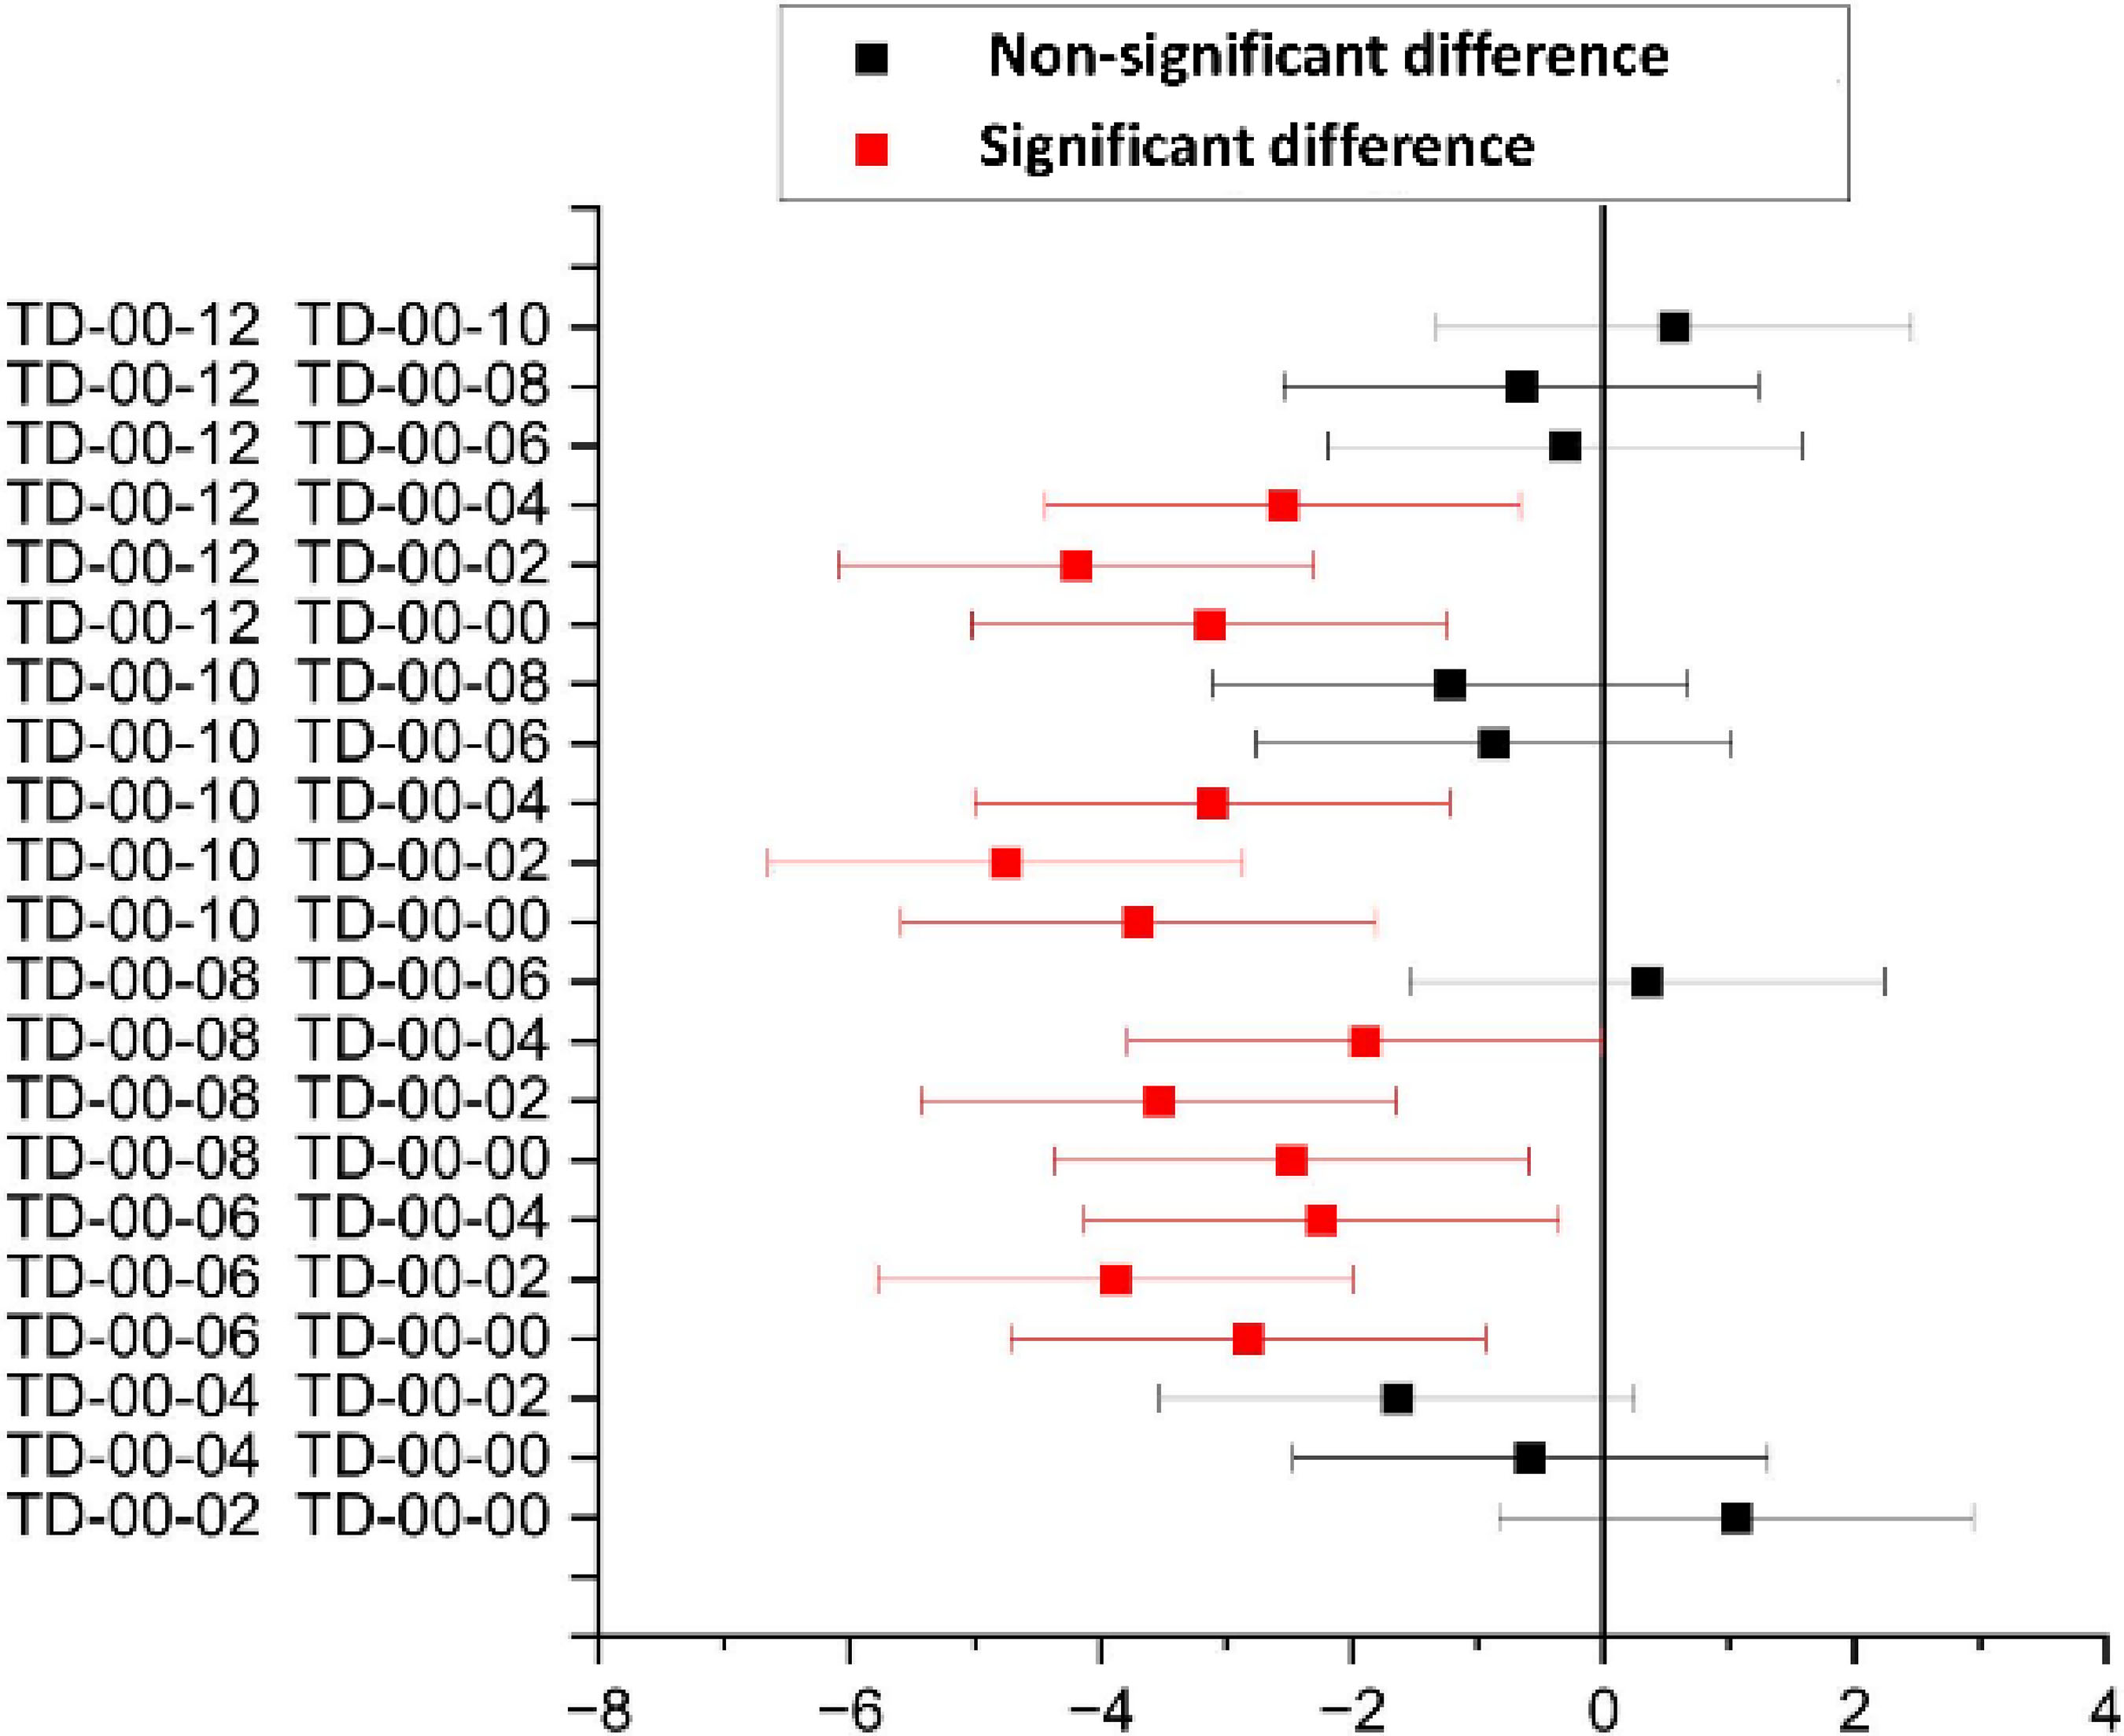
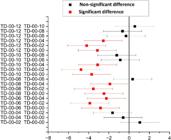
Regarding the Tukey Test analysis (Figure 18), the TD-00-02 and TD-00-04 mixtures did not present a statistically significant difference in the change in the elastic modulus, in relation to the reference mixture (TD-00-00). That is, elastic modulus differs significantly by carbon microfiber content.
4.2 Electrical properties
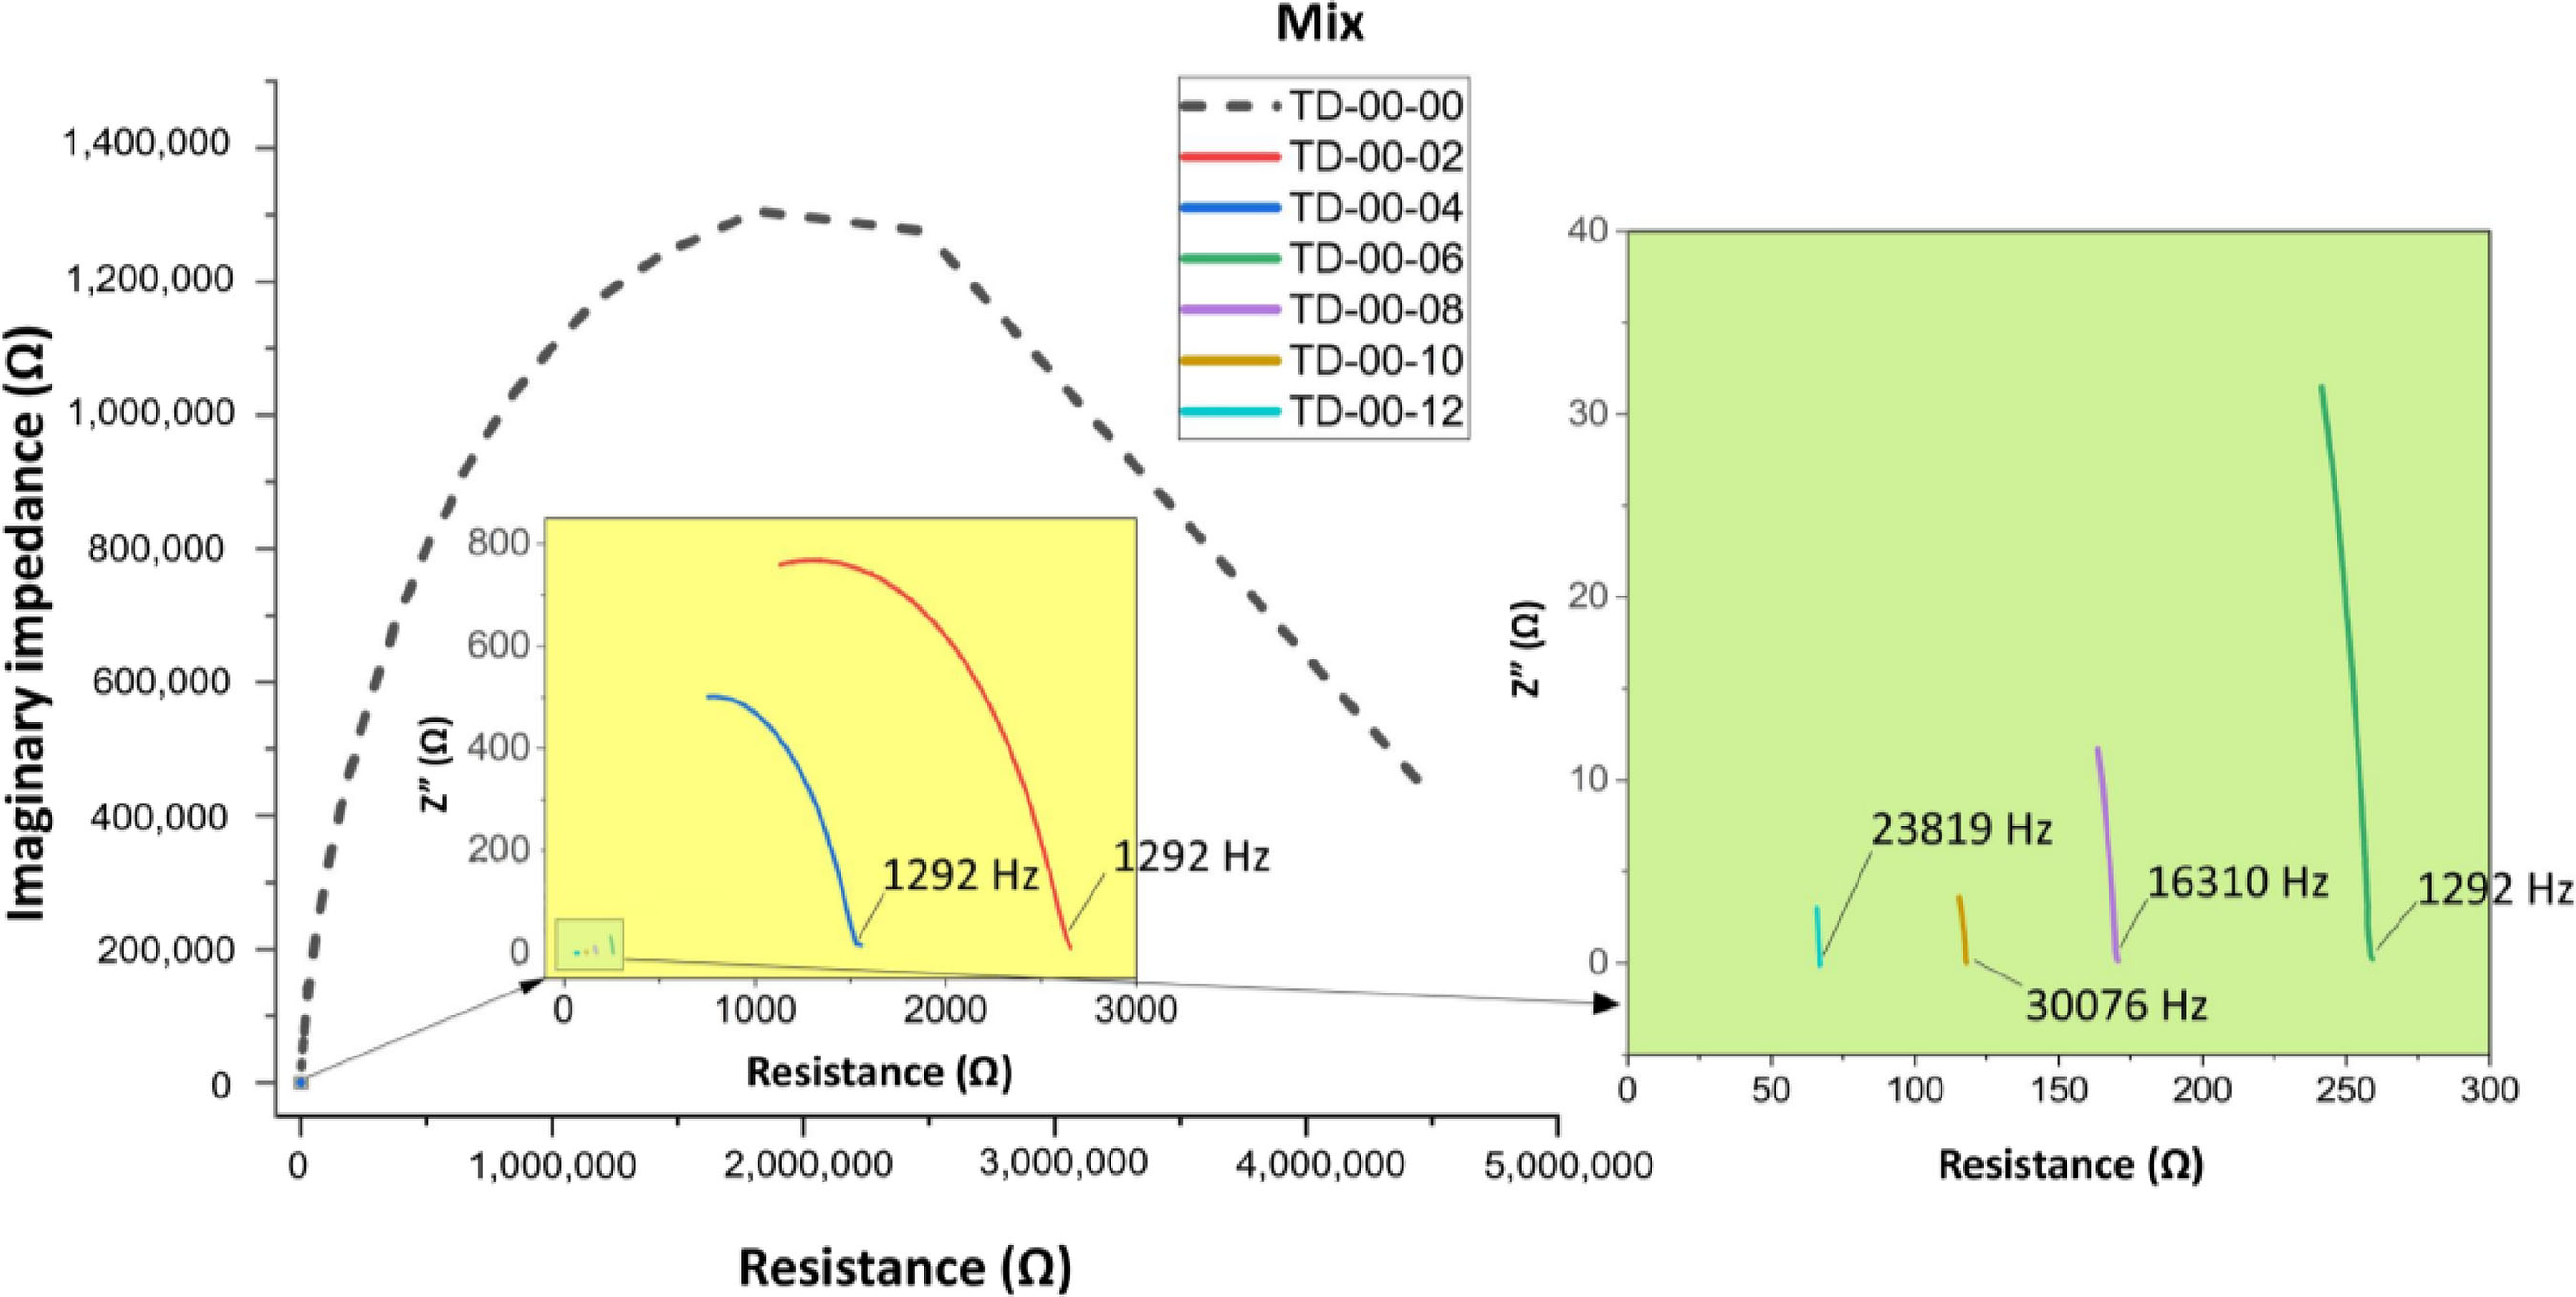
The Nyquist diagram (Figure 19) shows that, starting with mix TD-06-00, the behavior was different from that of the other mixes with less carbon microfiber. Its verticality, as well as that of mixes TD-00-08 to TD-00-12, shows little variation in electrical resistance with increasing frequency. This may indicate that the reactance of the cement composite was less influential, thus favoring the behavior of the microfiber.
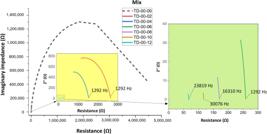
Analysis of electrical resistance (R) and imaginary impedance (Z”) using the Nyquist diagram with frequency at the cusp point
The effect of the electrodes indicated by Zhu et al. (2017) in the Nyquist plot (Figure 3) was probably not observed in this analysis (Figure 19), since the lowest frequency was 40 Hz. While the observation of this effect in studies such as that of Zhang et al. (2022) was possibly due to the minimum frequency being only 1 Hz.
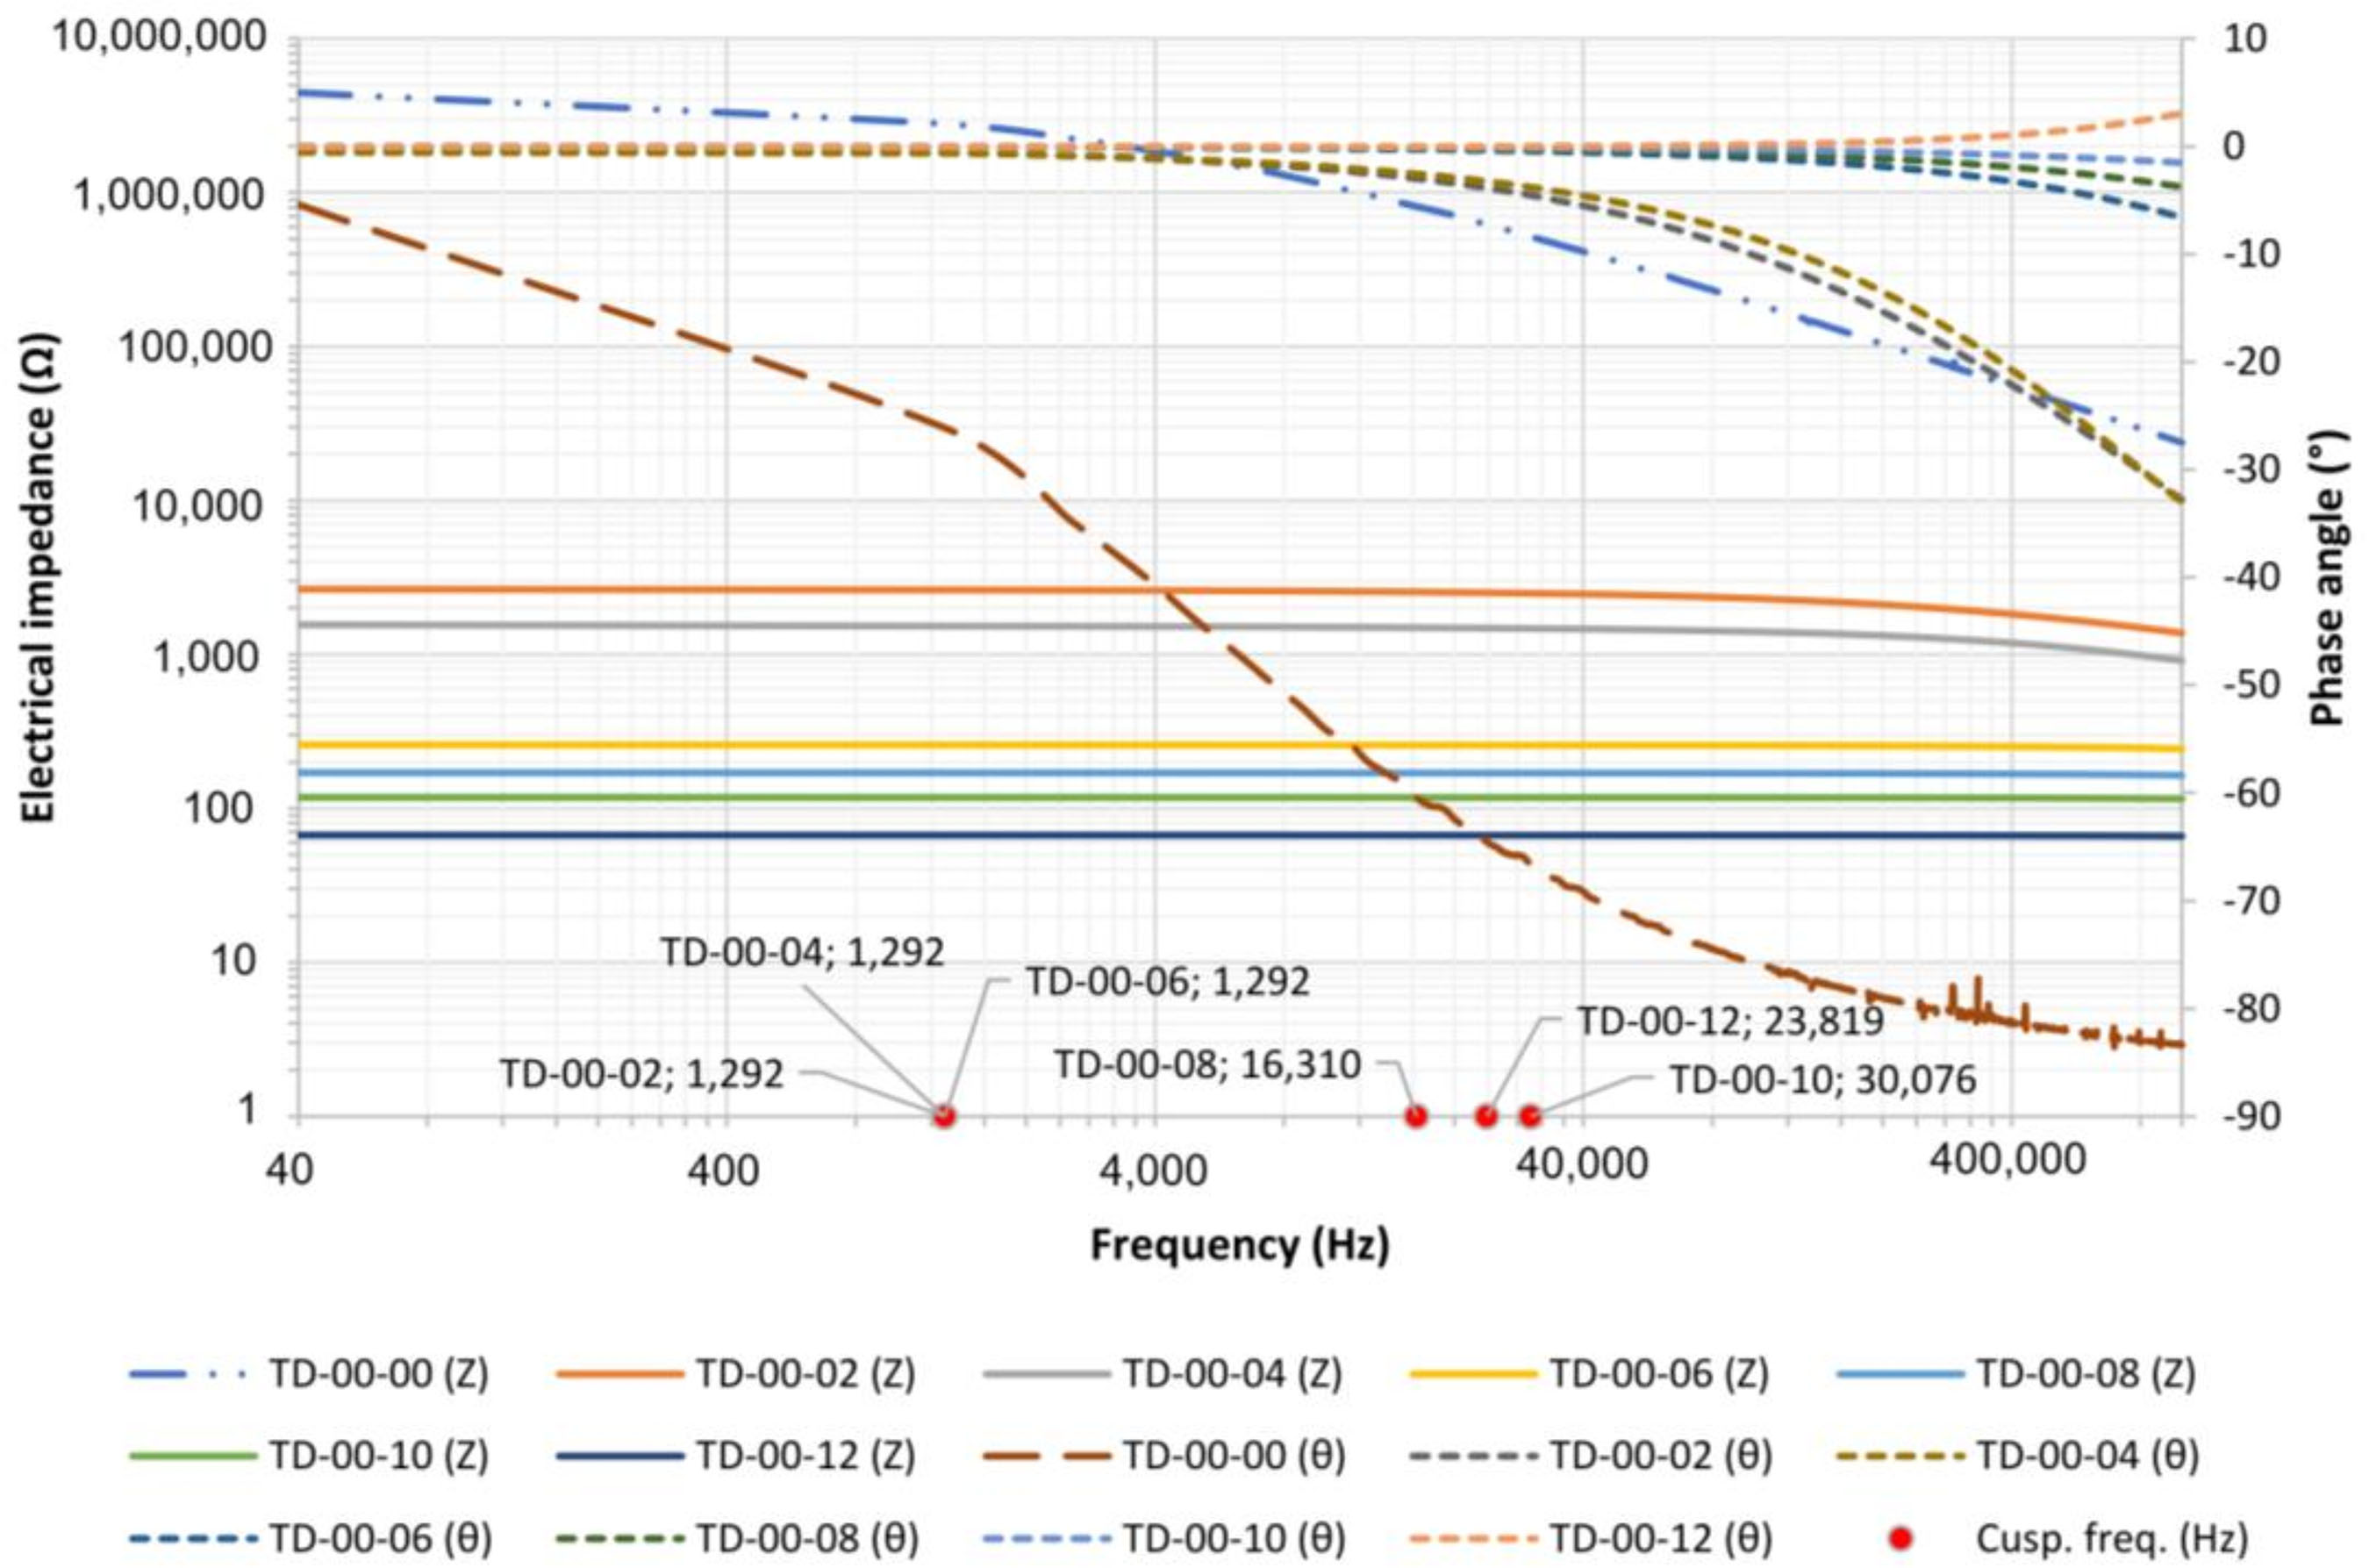
When analyzing the Bode diagram (Figure 20), it is possible to observe that from mix TD-06-00 there was little variation in impedance (Z) as a function of the increase in frequency, different from what was observed in relation to the phase angle (θ). Also, in relation to impedance (Z), it was possible to observe a significant reduction from mix TD-00-02, in relation to the reference mix (TD-00-00), regardless of the frequency analyzed.
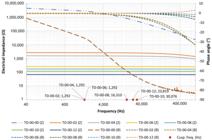
Analysis of impedance (Z) and phase angle (θ) using the Bode diagram with frequency at the cusp point
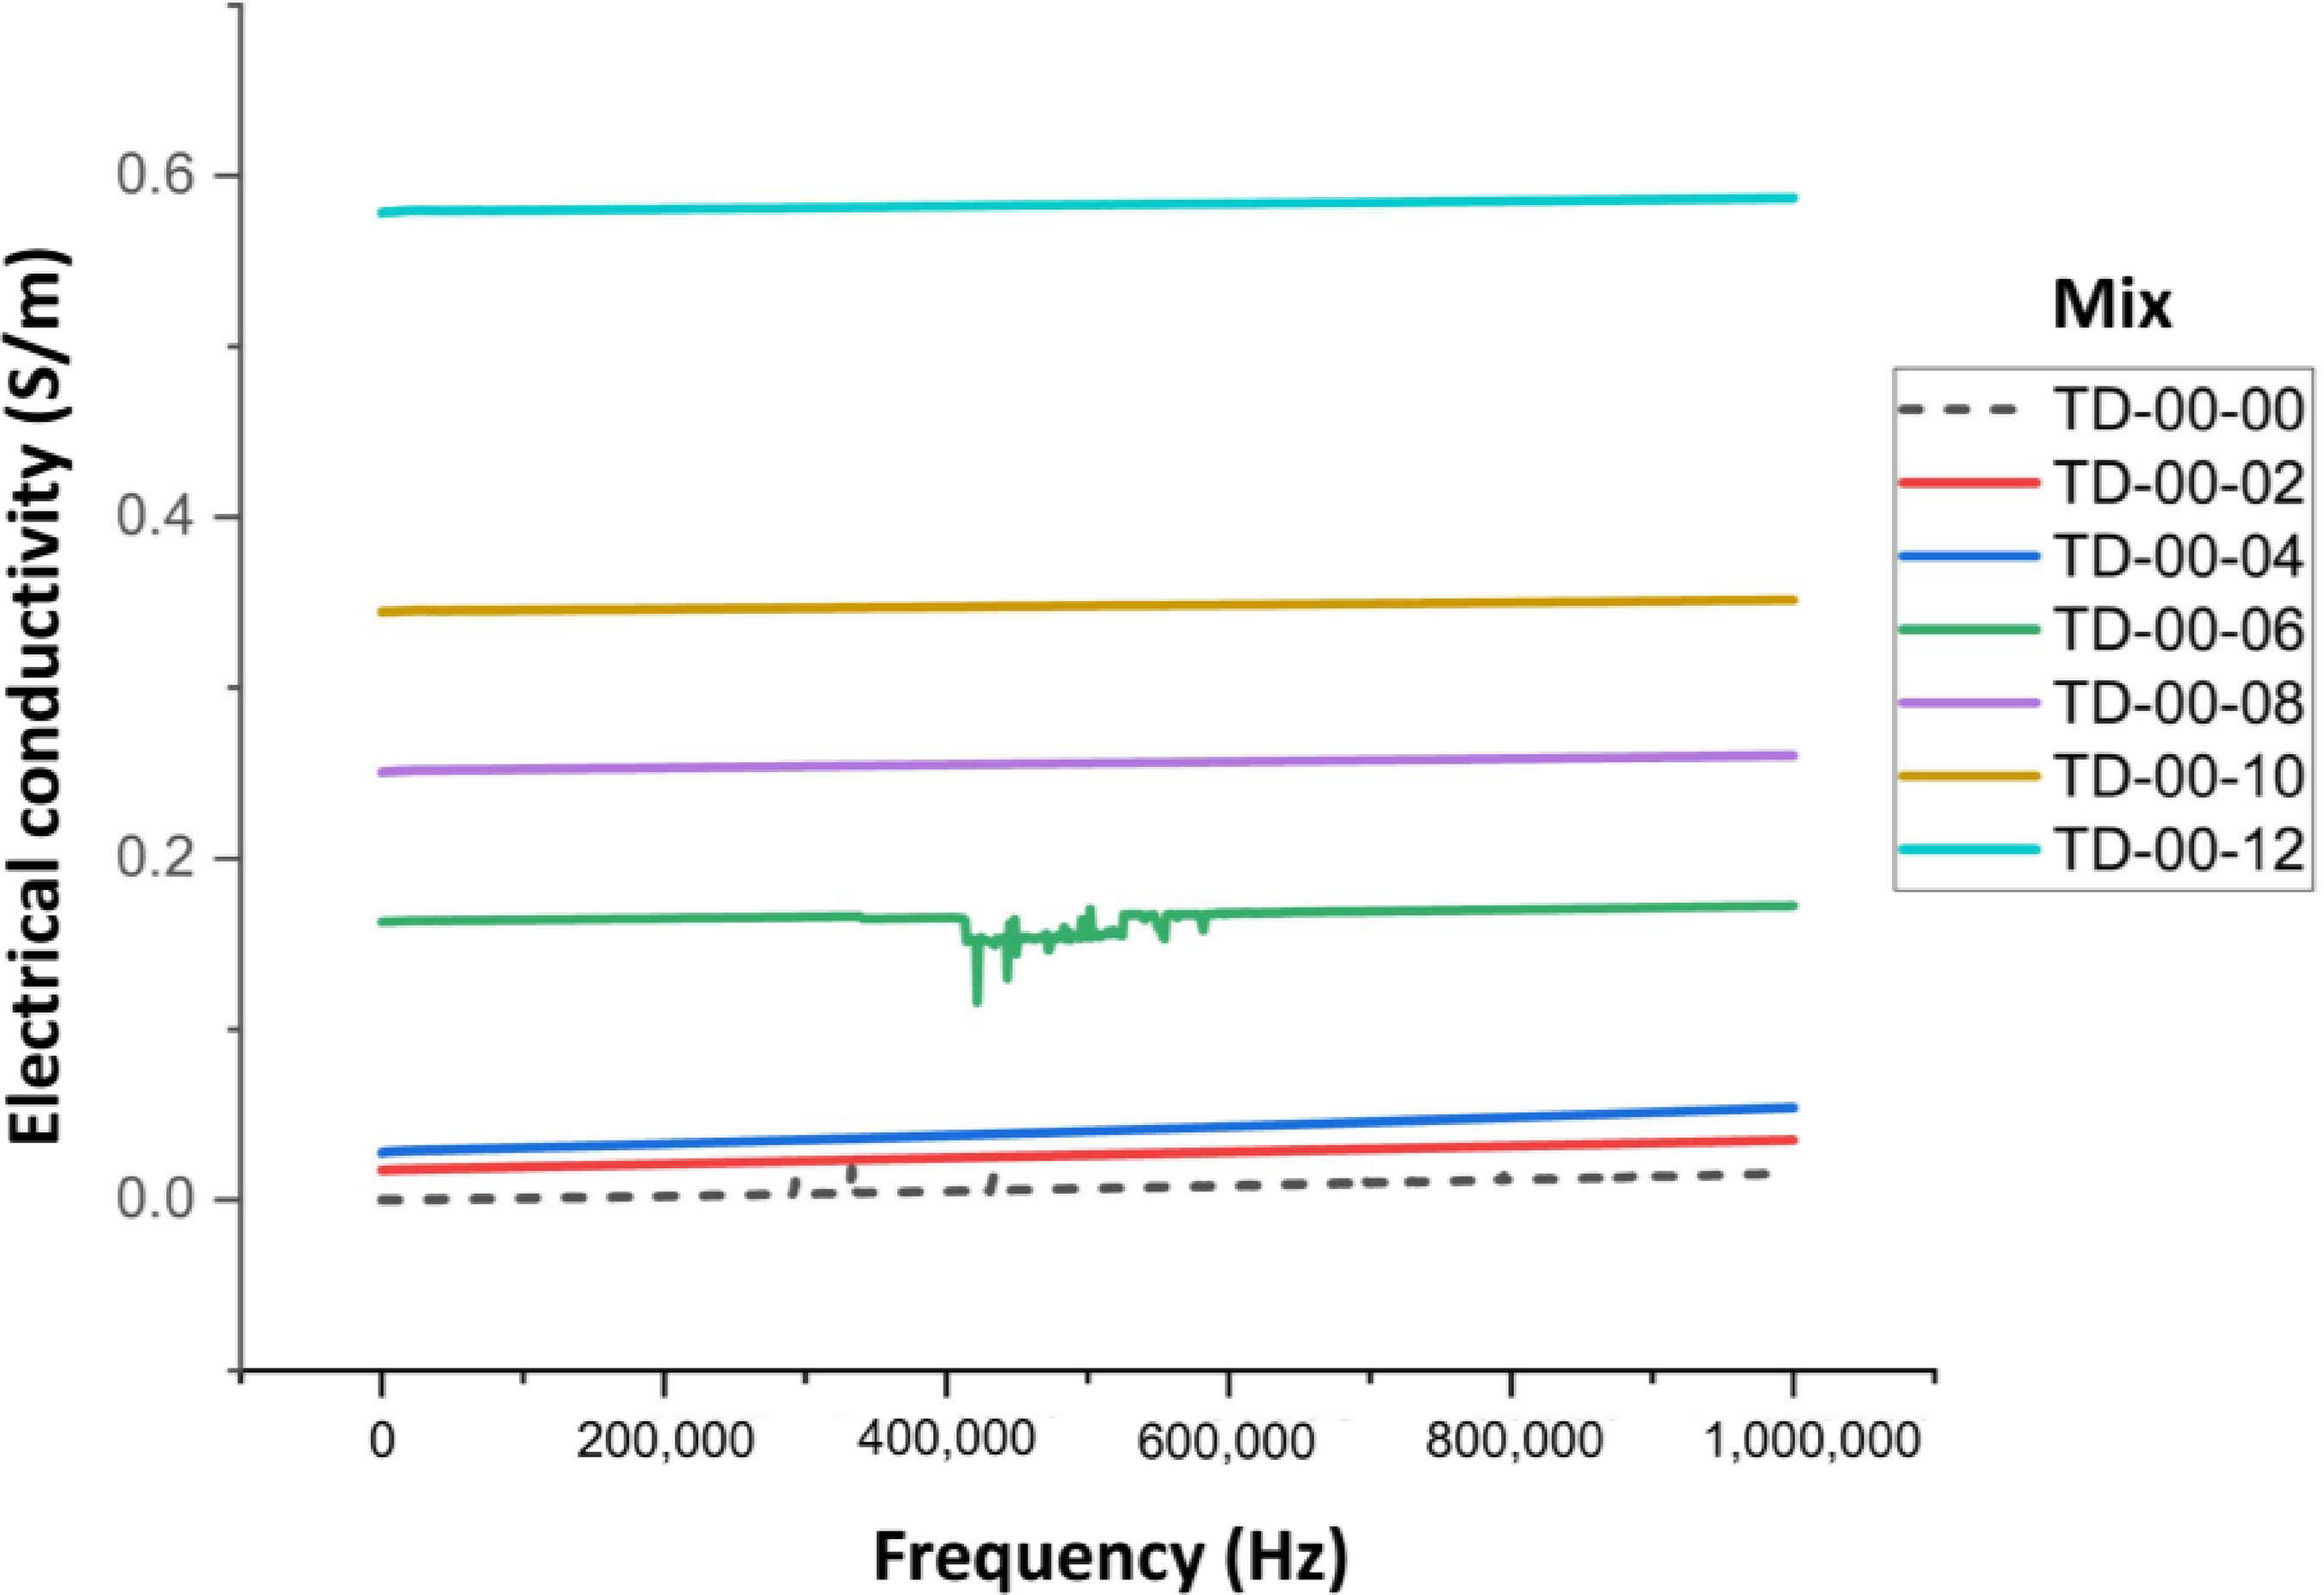
In the electrical conductivity analysis (Figure 21), although no significant change was observed with increasing frequency, the conductivity of the TD-00-00 mix increased approximately 1470 times between 40 Hz and 1 MHz. This demonstrates the influence of frequency, which causes changes in the material's capacitive reactance results. In the other mixes, the conductivity increases between 40 Hz and 1 MHz were only one to two times, demonstrating the low influence of the cement matrix on the conductivity of the carbon microfiber.
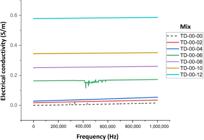
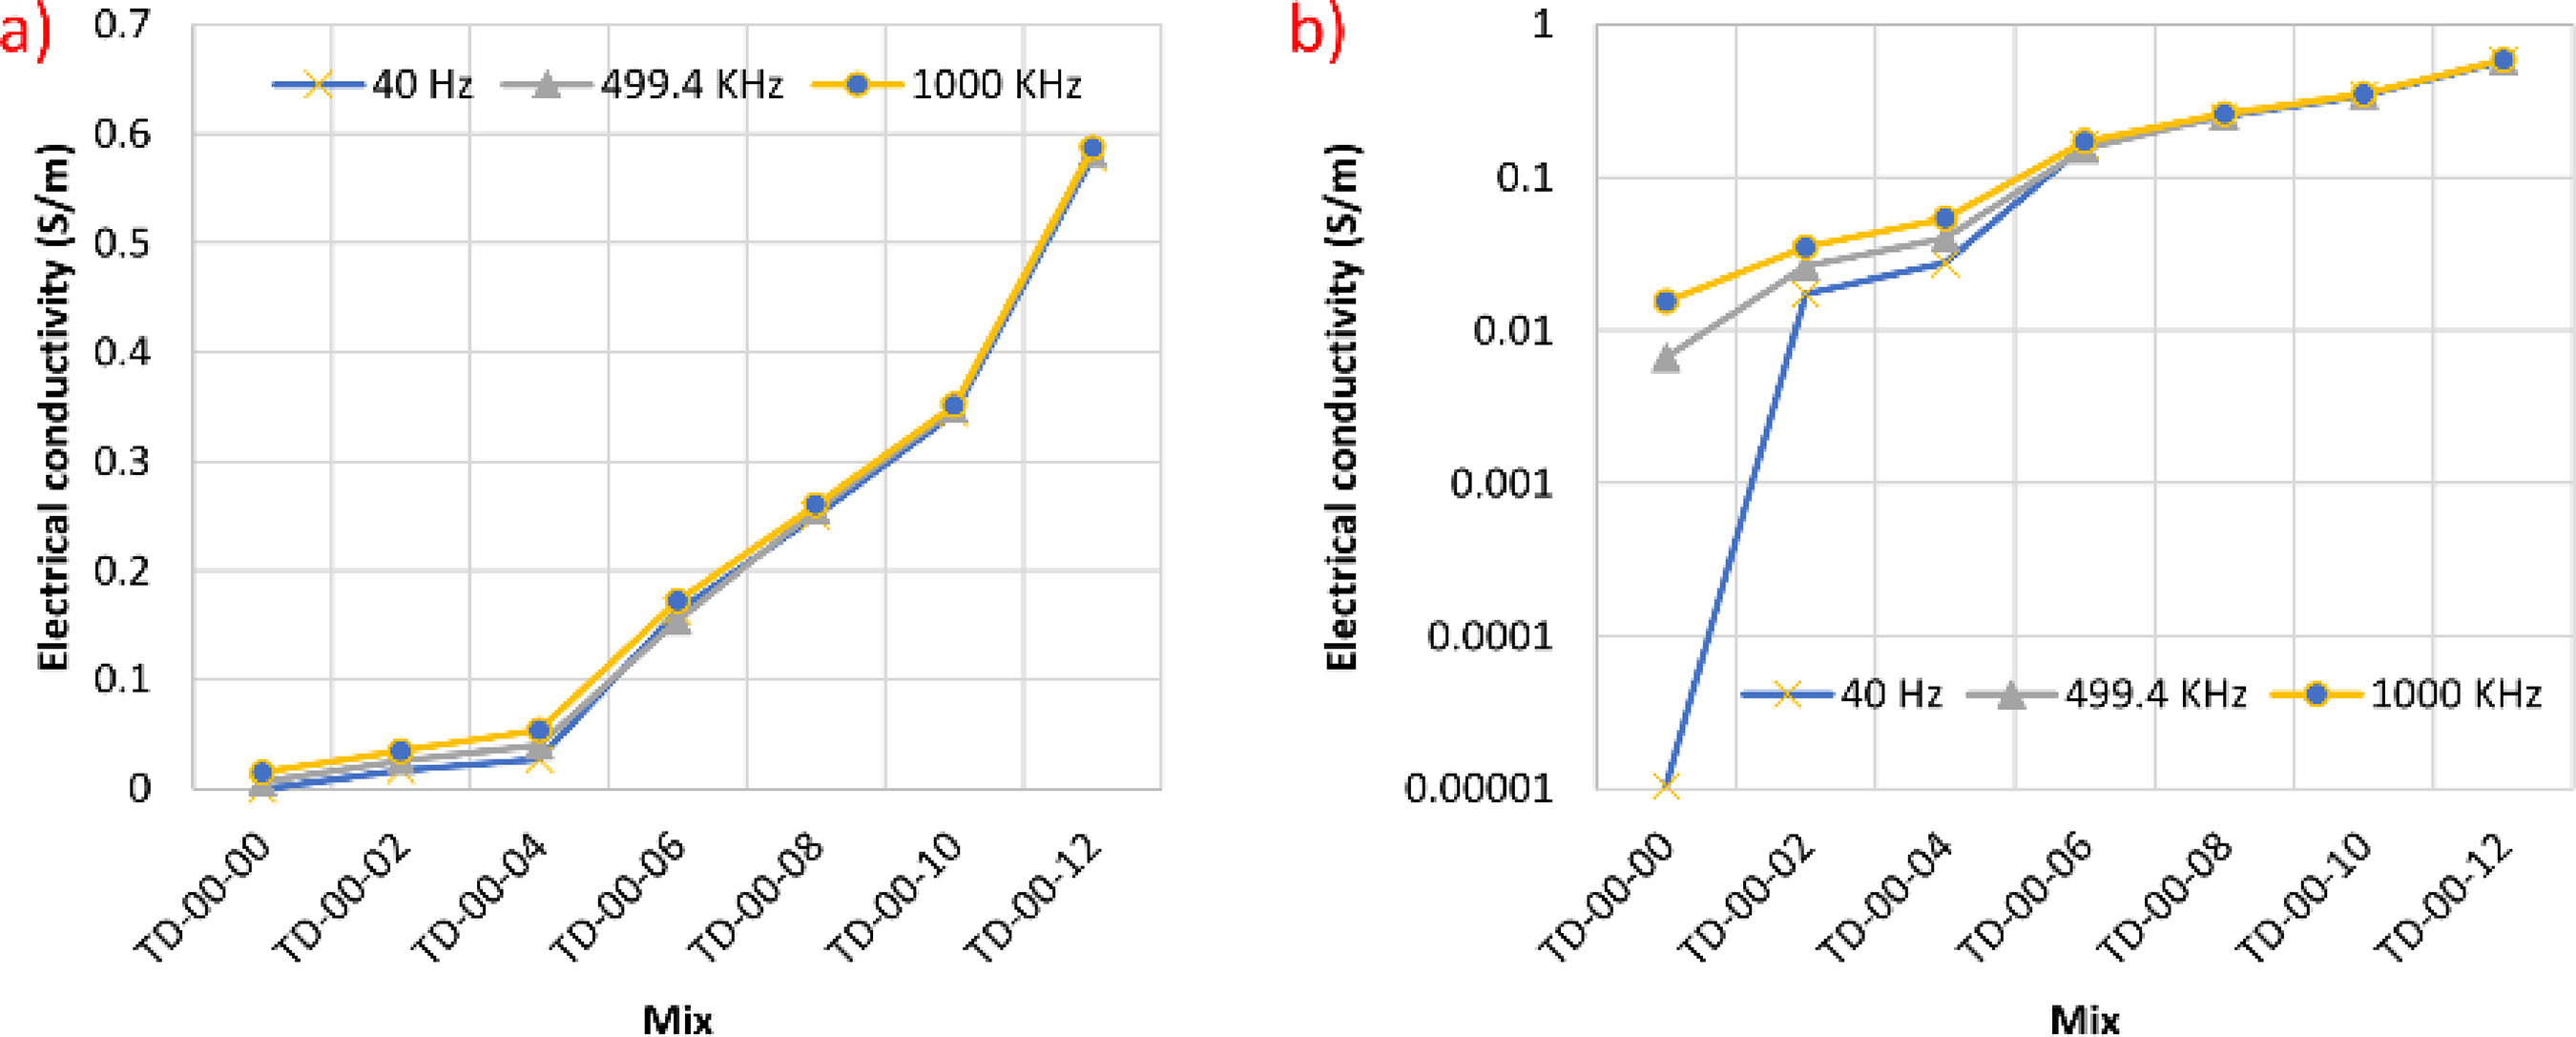
A segmented conductivity analysis was performed at the minimum (40 Hz), medium (499.4 kHz) and maximum (1 MHz) frequencies of the measurement interval. The results of this analysis (Figure 22) show a possible occurrence of the percolation threshold between mixes TD-00-02 and TD-00-06, as well as little influence of frequency on the conductivity from mix TD-00-06 onwards. The increase in conductivity from TD-00-00 to TD-00-06 was approximately 11 times at a frequency of 1 MHz. A significant increase in conductivity from the addition of 0.6% CF (equivalent to TD-00-06) was also observed by Chen, Wu and Yao (2004), in the mix proportion ratio of 1:2 and 0.45 (c/s and w/c), nevertheless, with a fiber length of 5 mm.
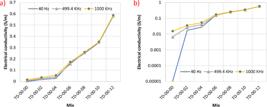
Electrical conductivity results by mix proportions, at the minimum, medium, and maximum frequency of measurements. Linear scale (a) and logarithmic scale (b)
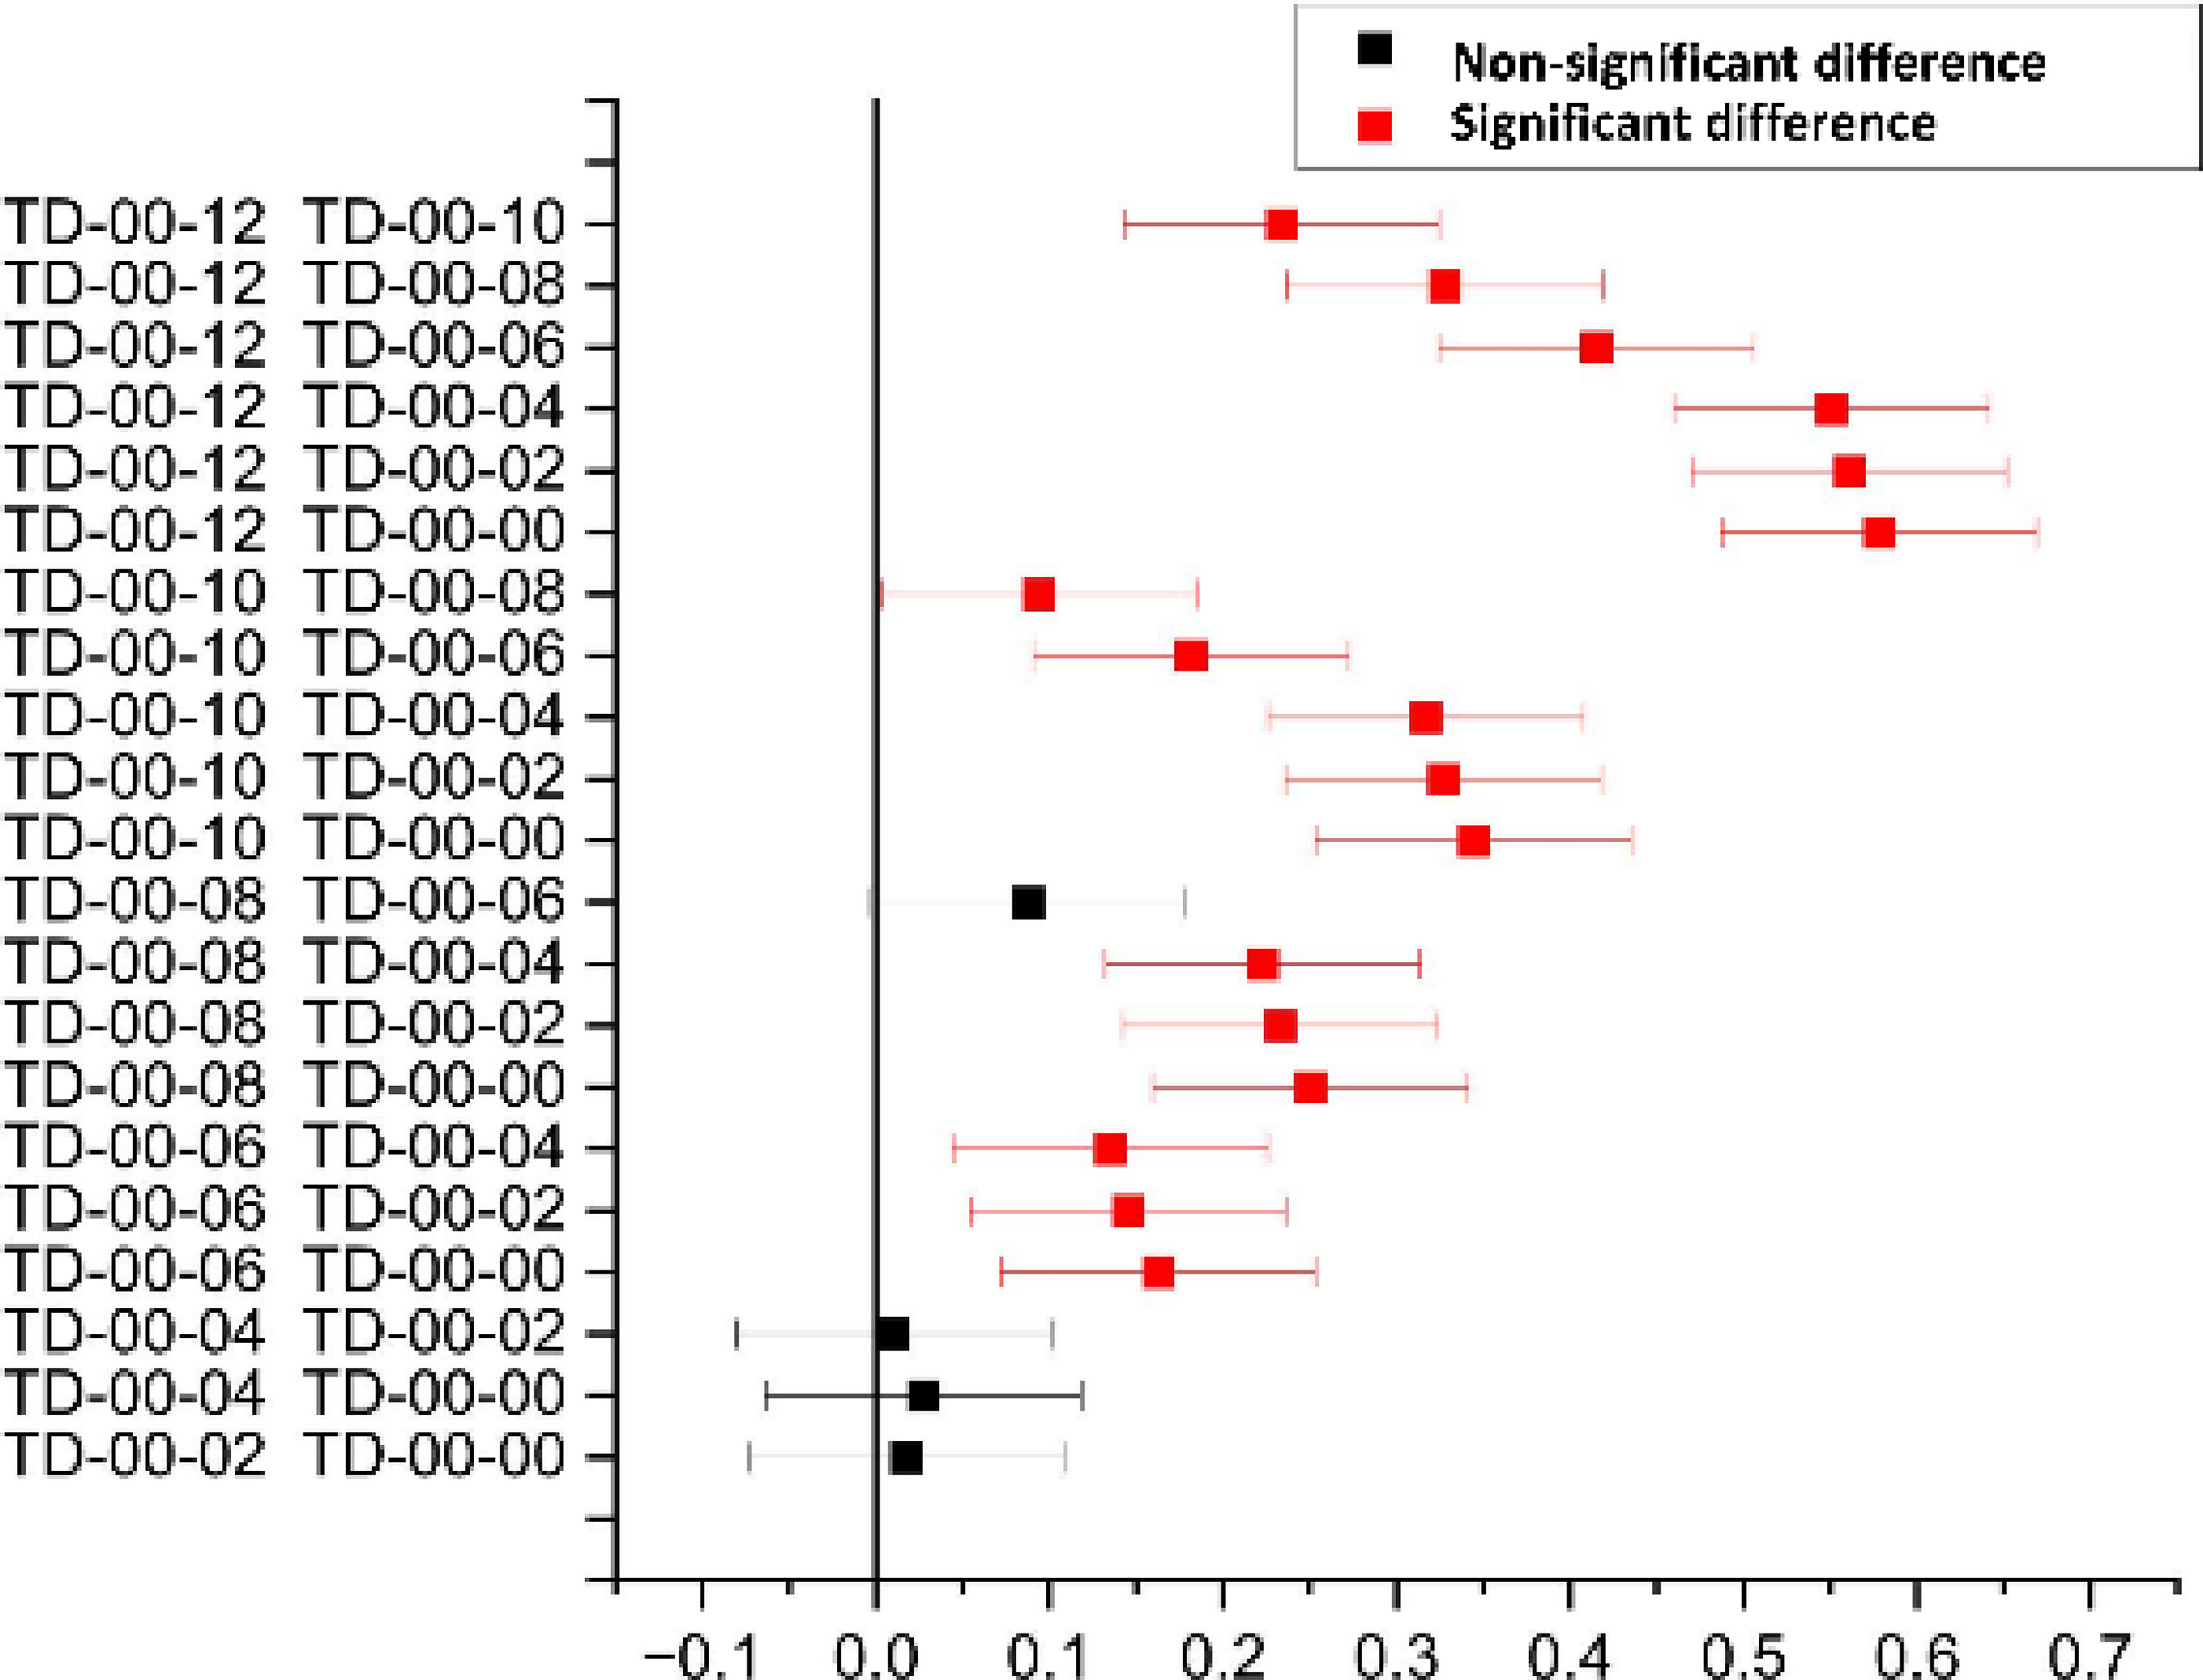
The P-value of the analysis of variance was obtained for the cases shown in Table 7, based on the individual results that supported the average electrical conductivity values in Figure 23, consolidating the alternative hypothesis that there is a difference between the groups for a critical significance level of 0.05.
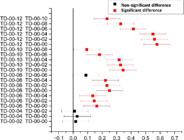
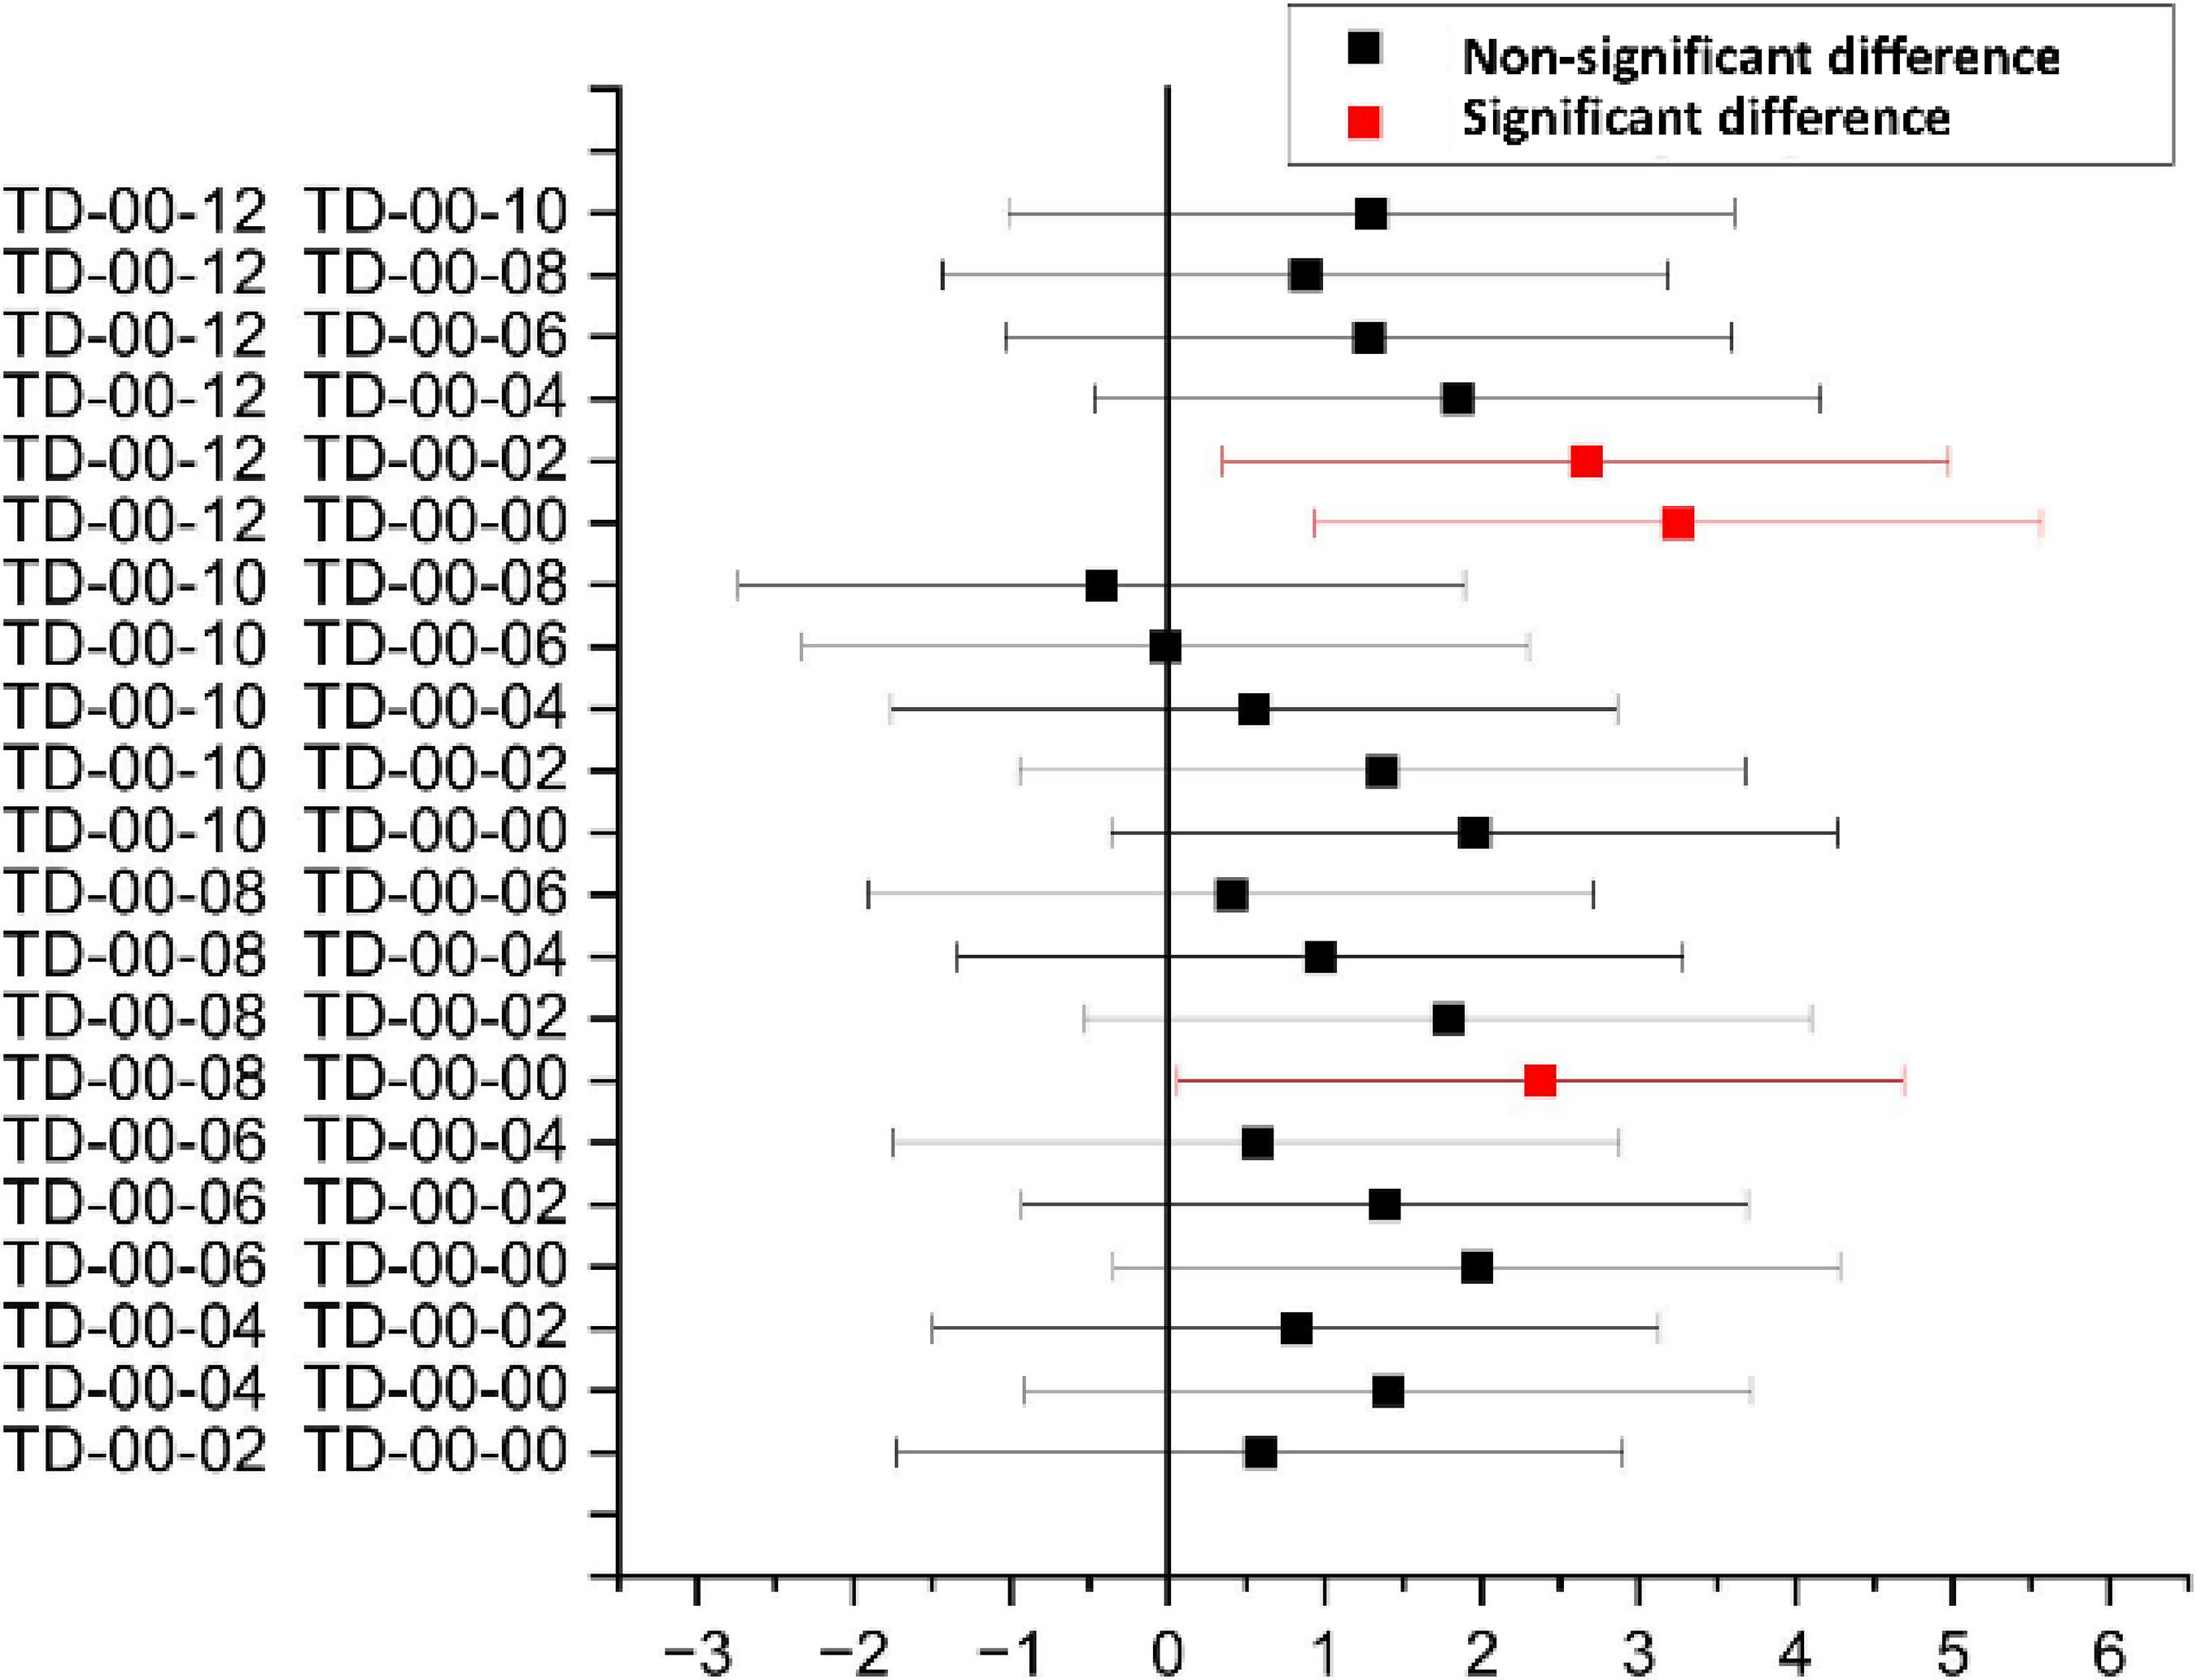
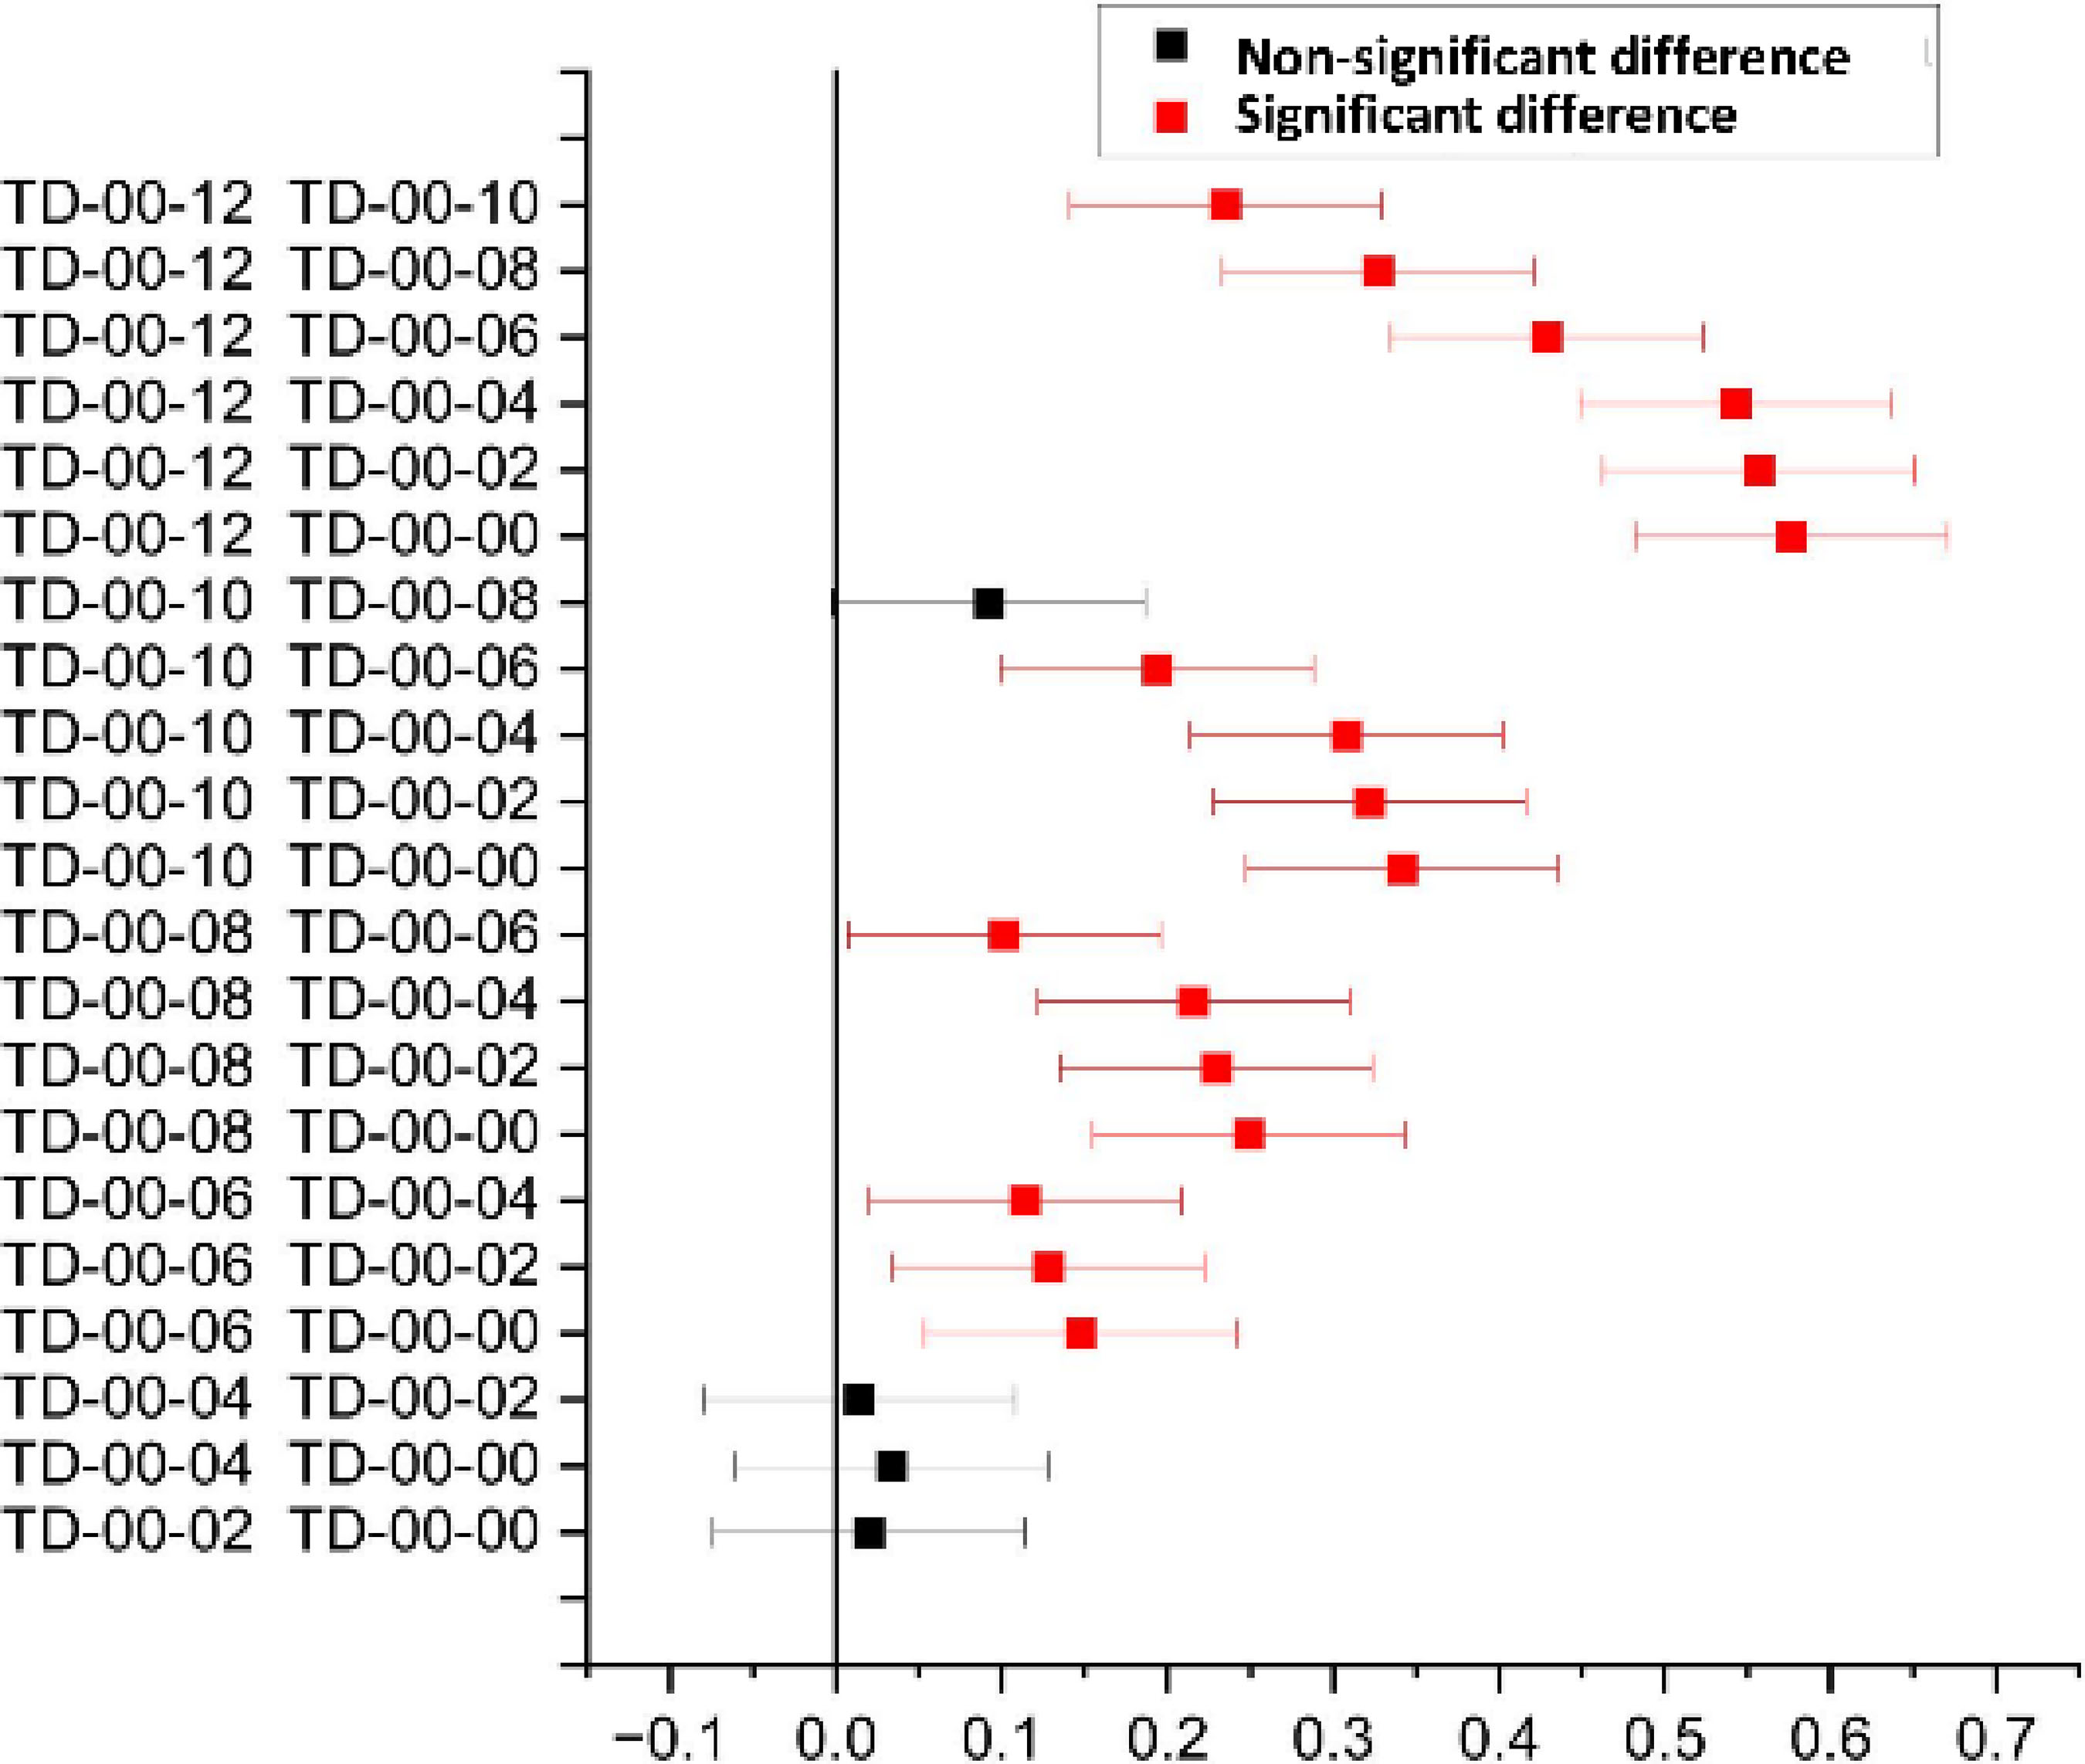
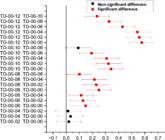
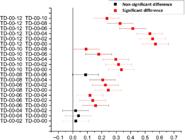
Through the Tukey Test analysis (Figures 23 to 25) of electrical conductivity at frequencies of 40 Hz, 499.4 kHz, and 1 MHz, all mixes from the addition of 0.6% microfiber (TD-00-06) showed a statistically significant difference in the increase in electrical conductivity in relation to the reference (TD-00-00).
4.3 Piezoresistive properties
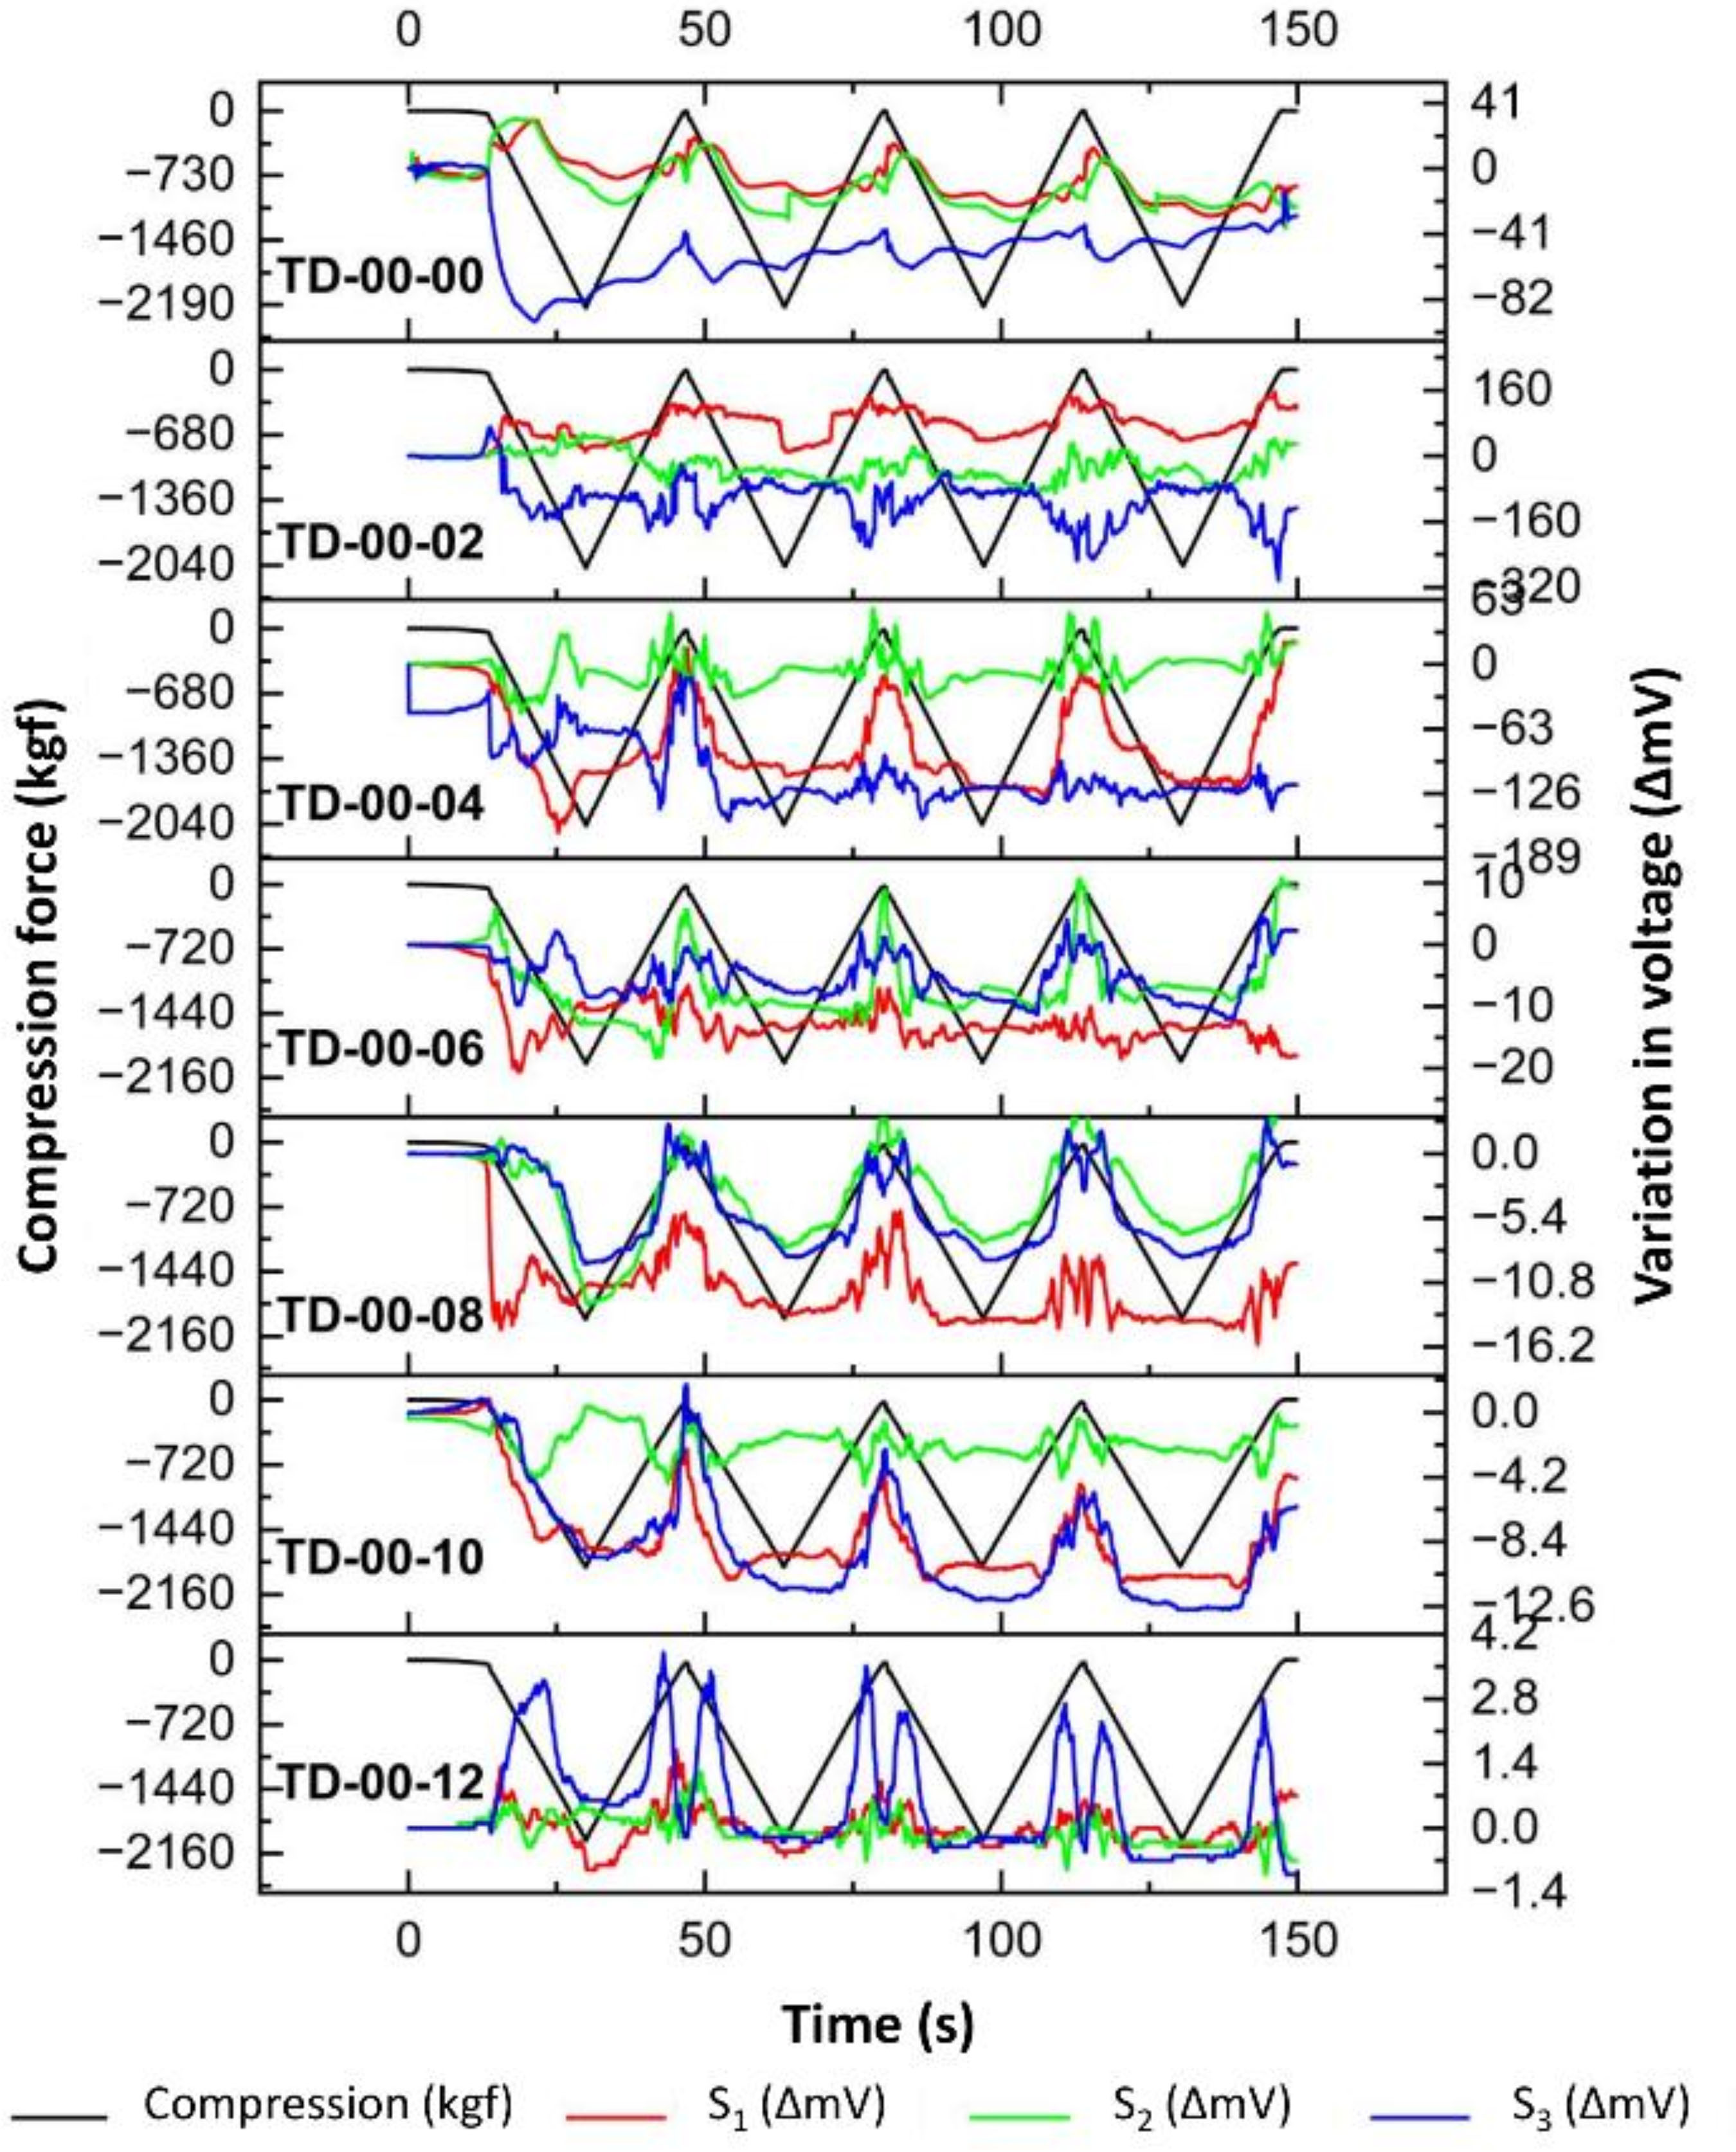
In the piezoresistive analysis, it was not possible to observe a clear improvement in the graphical comparison (Figure 26) between the results of voltage variation (ΔU) and compression force (fc), with the gradual increase in the addition of carbon microfiber. This situation may have occurred because the increase in electrical conductivity is not always capable of promoting an improvement in the piezoresistive effect, as pointed out by Nalon et al. (2022).
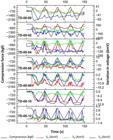
Piezoresistive analysis of voltage variation with cyclic loading with three specimens (S1, S2, and S3) for each mix proportion
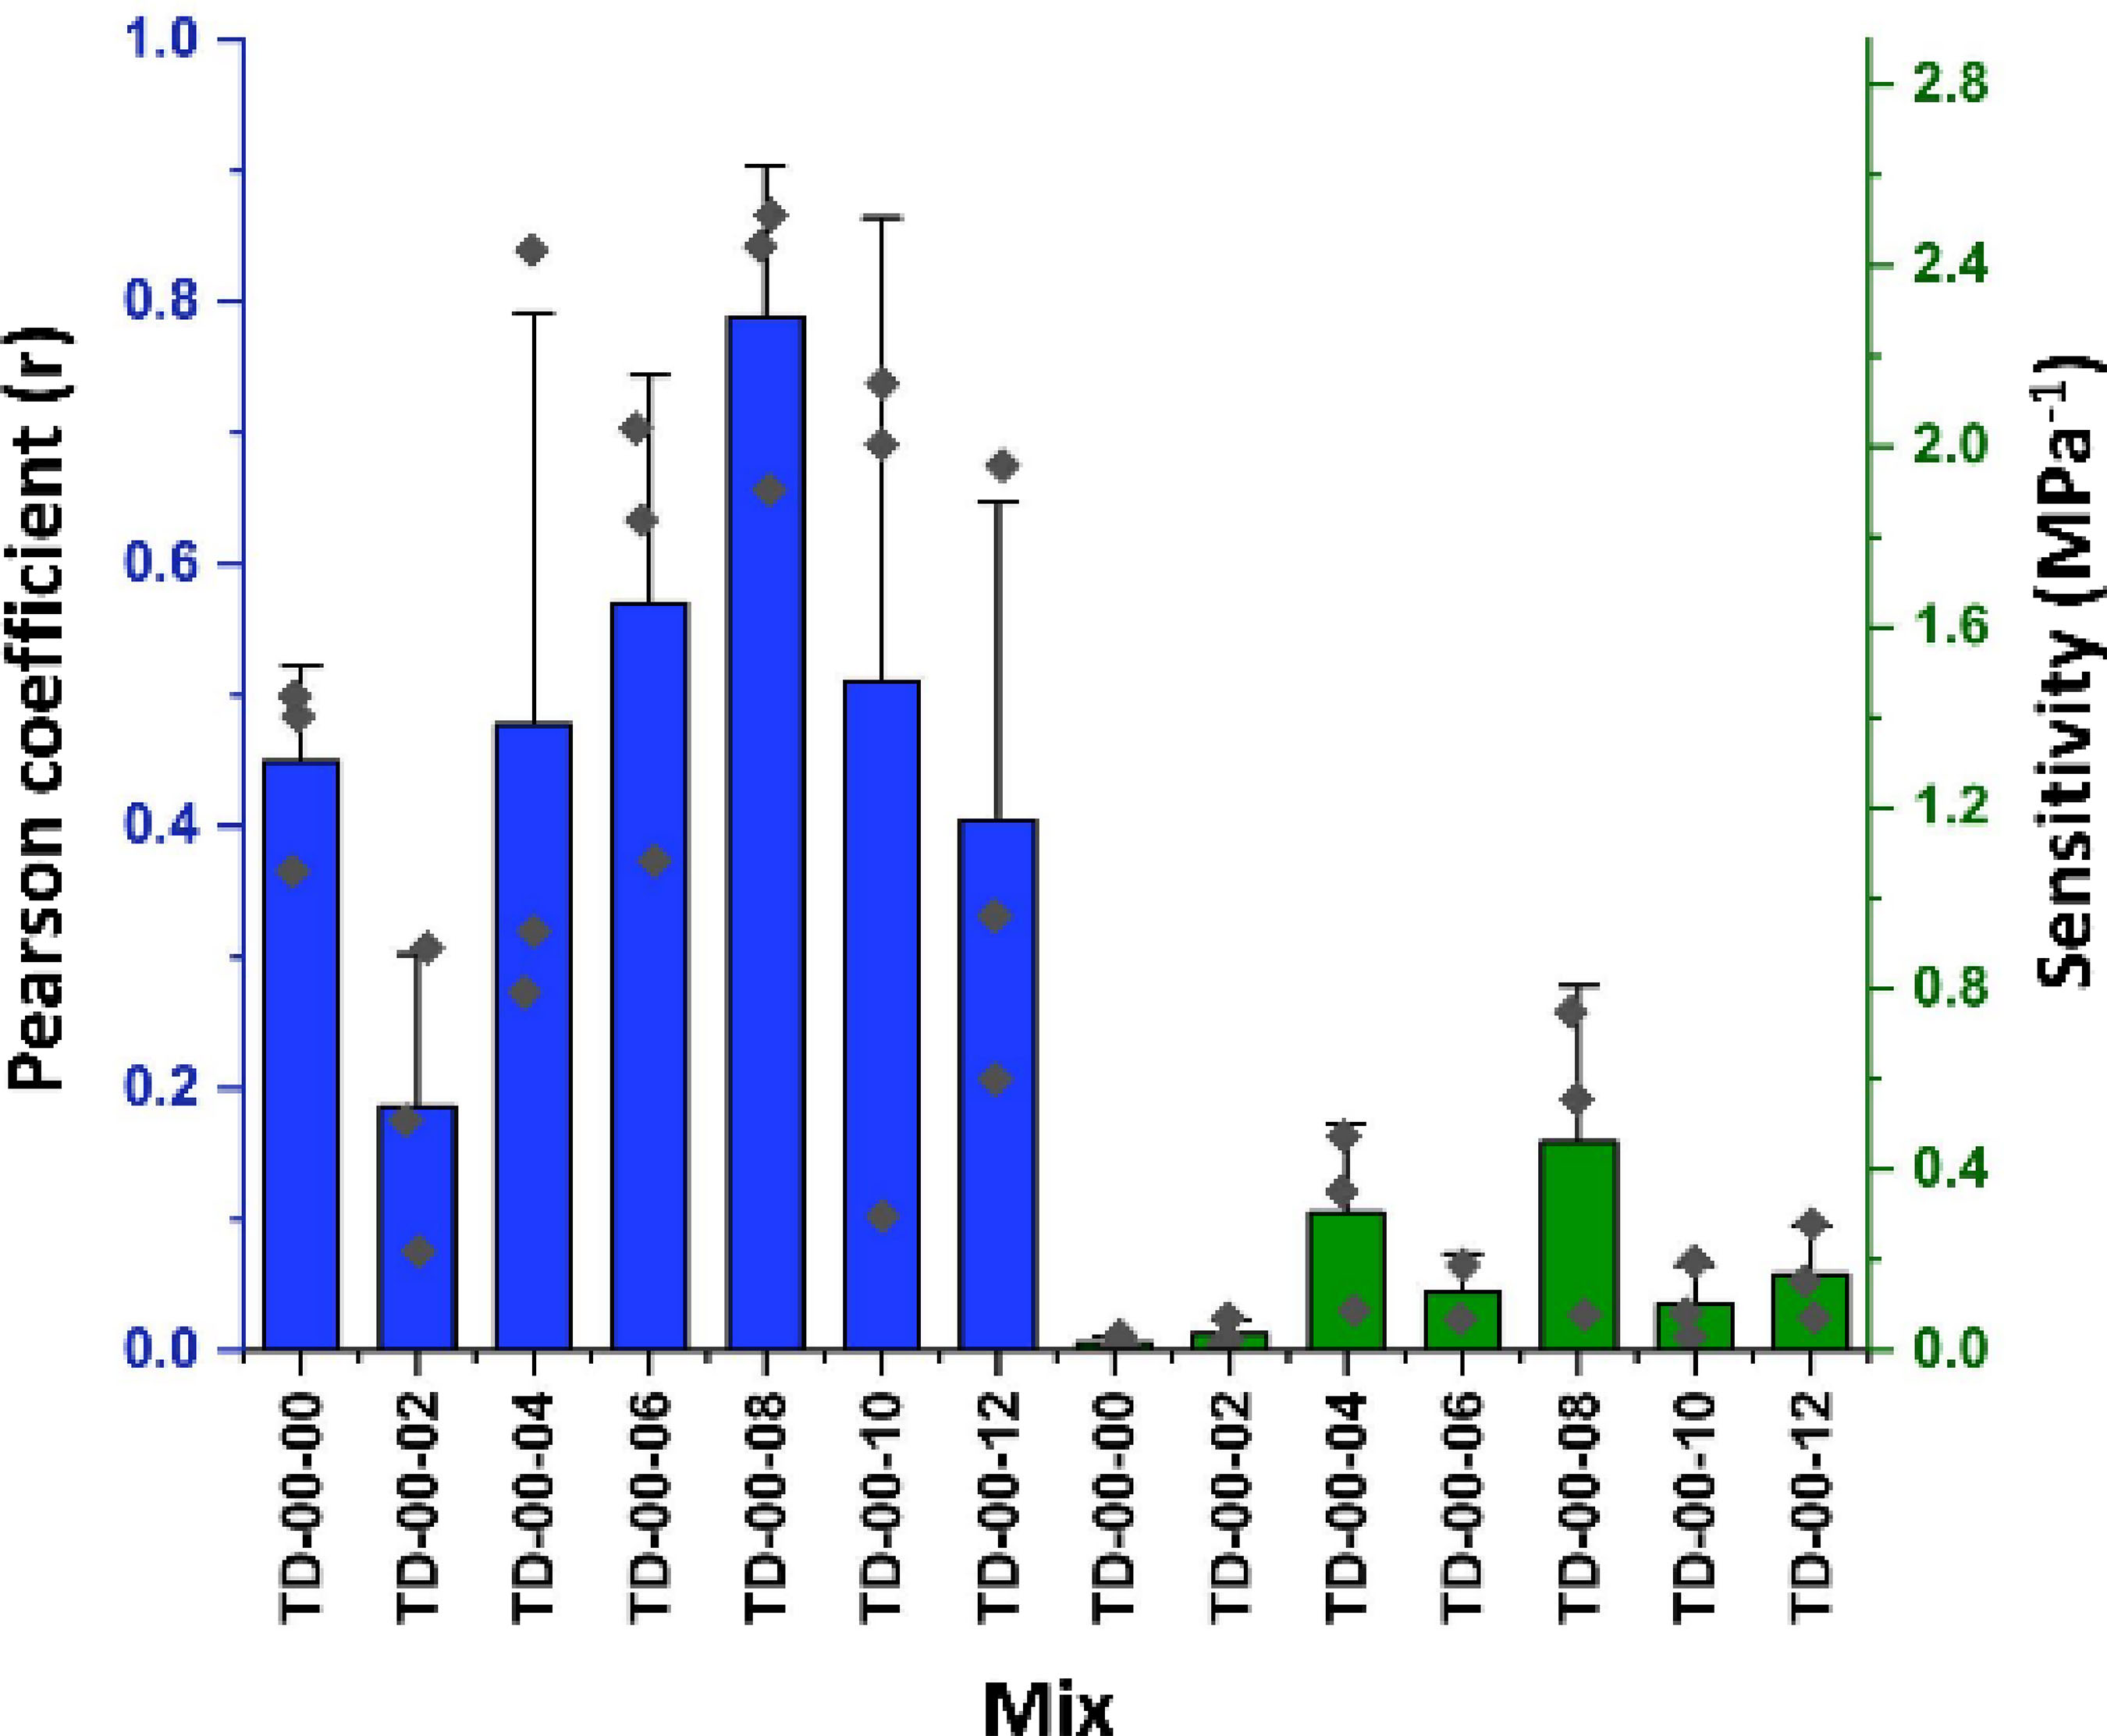
In the correlation (Pearson) and stress sensitivity (SS) analysis, as shown in Figure 27, the best average results were obtained from mix TD-00-08. This observation may be related to the possibility that mix TD-00-08 reached an adequate level of electrical conductivity, i.e., in the percolation threshold region, while mixes TD-00-10 and TD-00-12 may have reached a conductivity above that necessary for the occurrence of the piezoresistive effect.
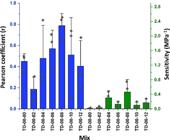
Regarding the results of the Pearson correlation and sensitivity analyses, high standard deviations were observed in some cases. However, this situation has already been observed by other researchers in sensitivity analyses of the piezoresistive effect of cement composites (Adresi et al., 2017; Huang; Li; Qian, 2018; Cosoli et al., 2023). These deviations may be associated with several factors, such as variations in the electrode-composite contact surface in specimens with the same mix.
Studies such as that by Donnini, Bellezze and Corinaldesi (2018) show that the addition of CF in proportions greater than 2% of the cement mass may be necessary to improve the piezoresistive effect. This situation may explain the small improvement in self-sensing ability observed in the present study, up to 1.2%.
4.4 Microstructural analysis
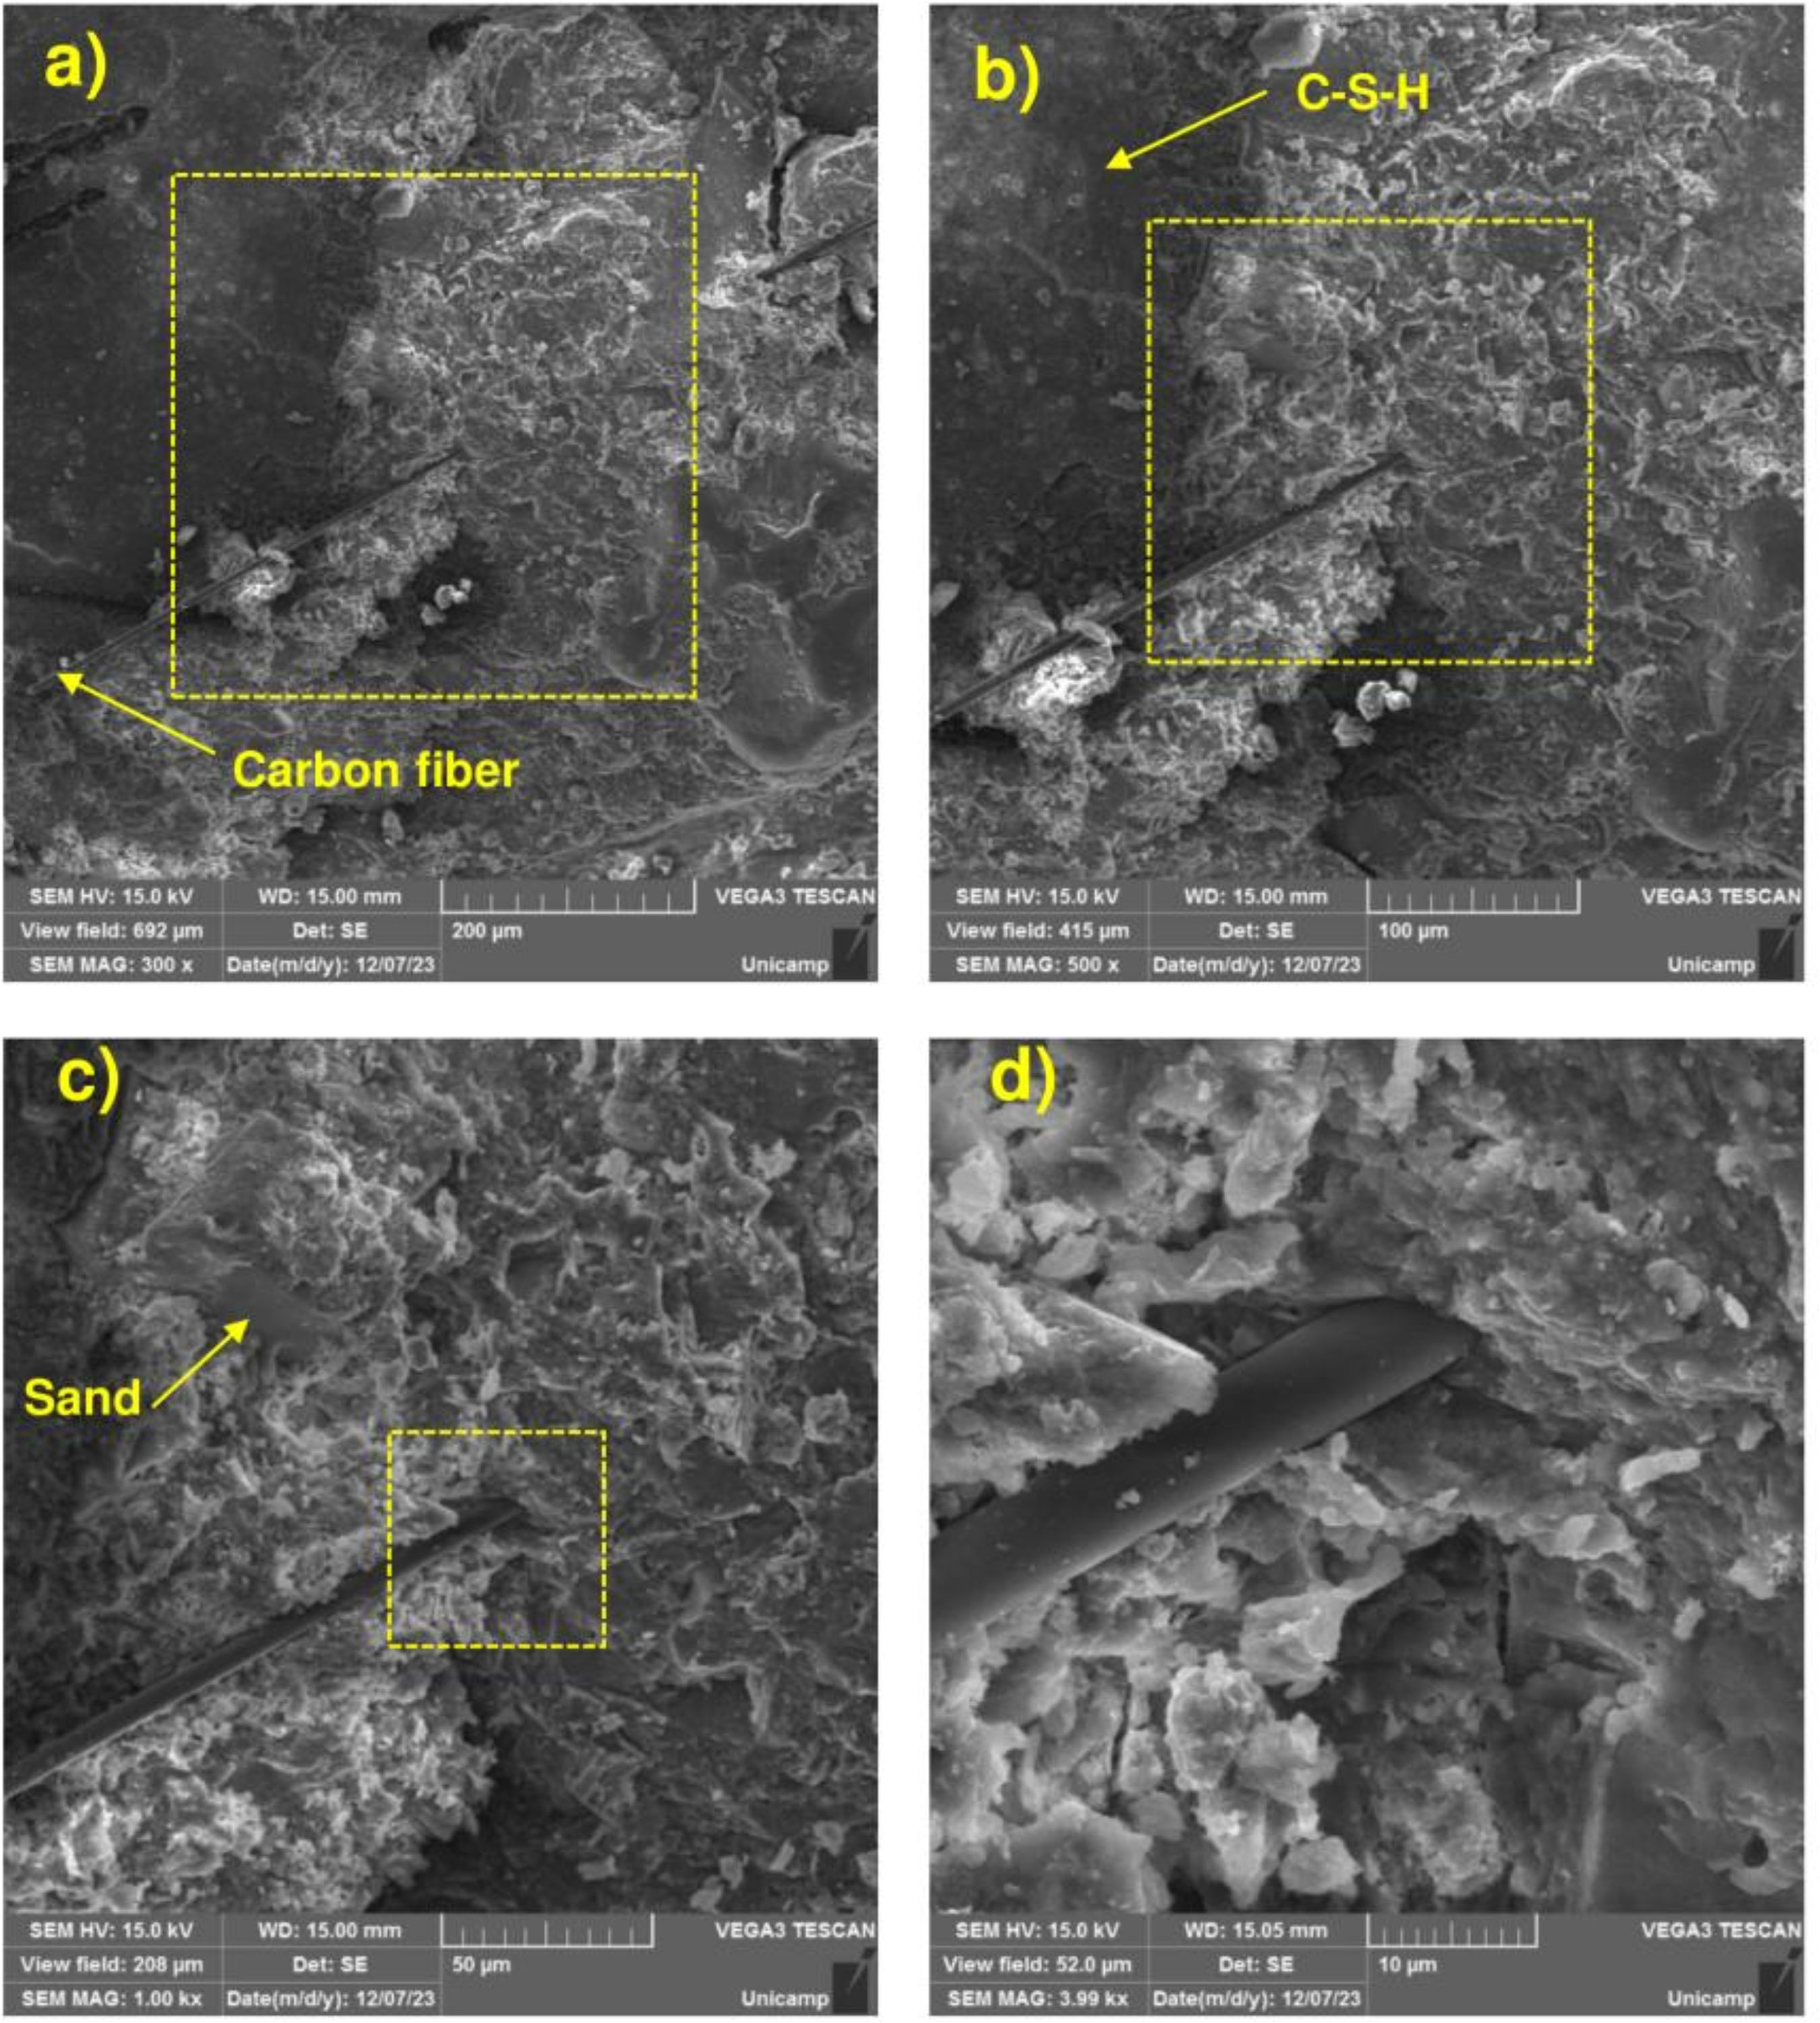
For microstructural analysis, a sample from the TD-00-08 mix was chosen, as it presented the best results in the piezoresistive analysis. The images in Figure 28 show the presence of sand, cement paste, including in the C-S-H form, as well as carbon microfiber in micrometric proportions of the order of 10 µm. In these images, microfiber agglomeration was not observed, in contrast to what was observed by Chuang et al. (2017) using SEM techniques, where poor distribution of CF was observed.
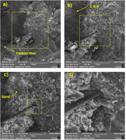
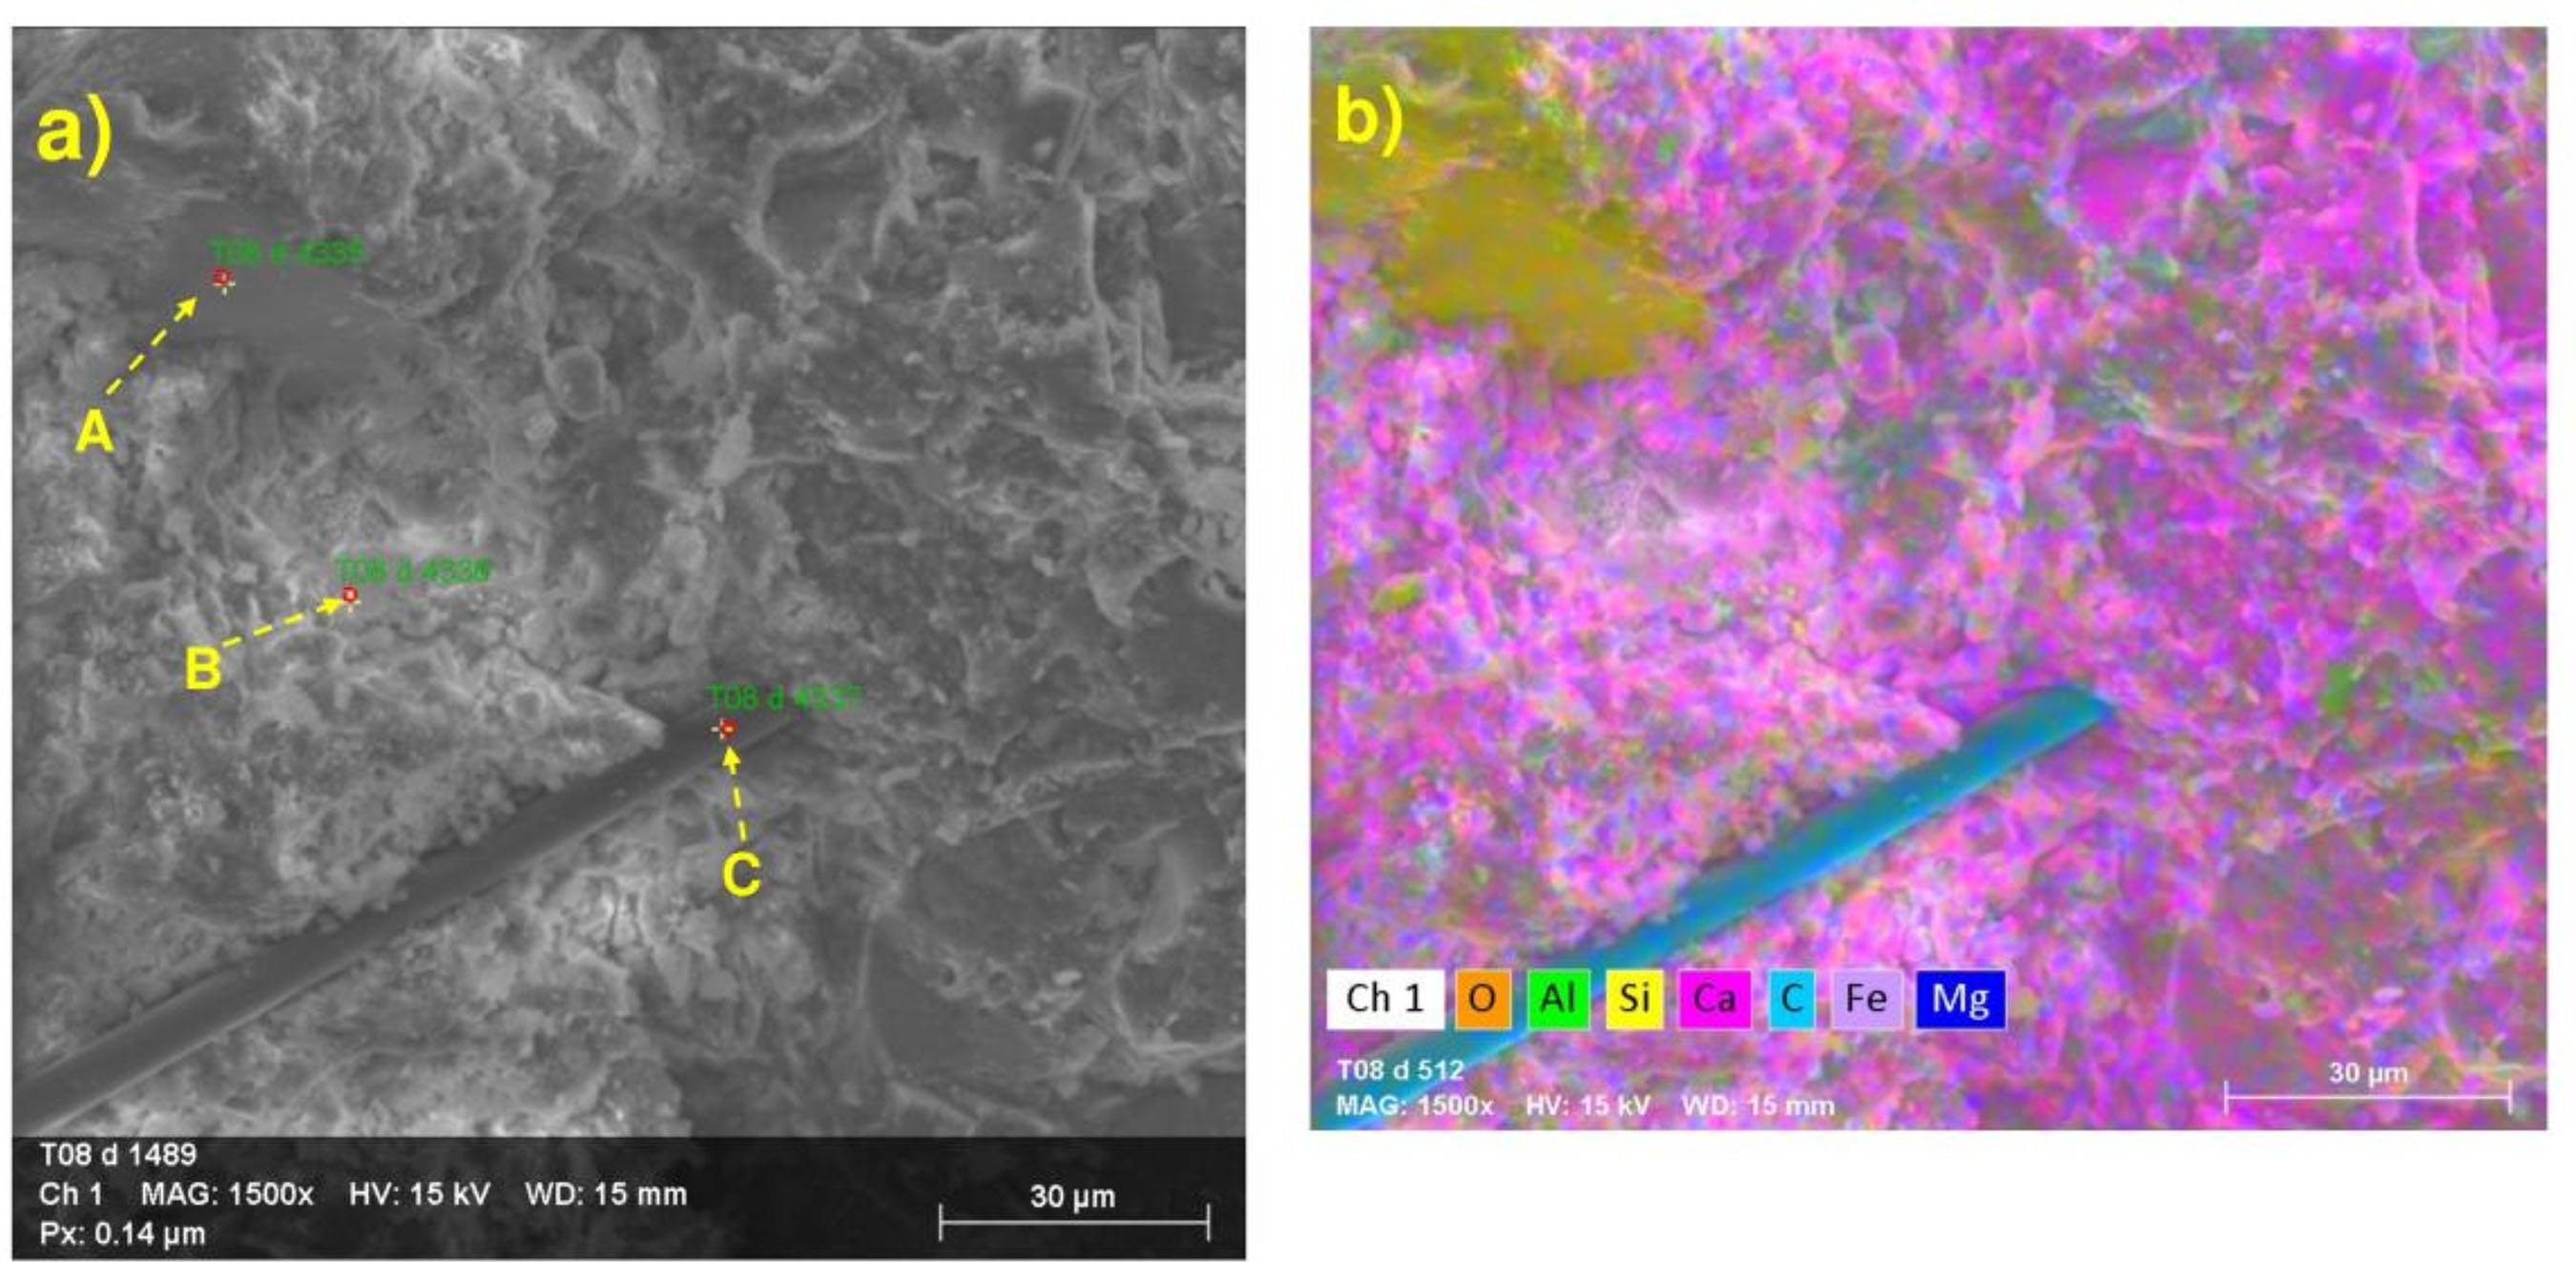
Although a good dispersion trend of microfibers is observed in the images of Figure 28, it is not possible to identify changes in porosity or degree of hydration by SEM microstructural analysis. In the EDS mapping analysis (Figure 29), the high concentrations of silicon (Si), calcium (Ca) and carbon (C) were evident. The point analysis by EDS was performed at the points called "A", "B" and "C", as shown in Table 8. From the morphological information obtained in the SEM images and composition estimates by EDS, the mentioned points can correspond to sand, cement paste and carbon microfiber, respectively.
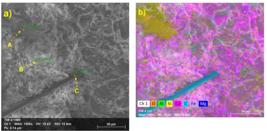
The presence of oxygen (O) and carbon (C) at point “A” may be related to features of the EDS process rather than the elements' original presence in these samples, such as intensity.
5 Conclusions
From the results obtained in this research, it was possible to conclude that for the limiting mix proportions of standard NBR 11173 (ABNT, 1990) with the addition of carbon microfiber, the compression strength, as well as the bulk density, met the parameters recommended by said standard. Furthermore, it was possible to conclude that:
-
with the increased incorporation of carbon microfiber, the capacitive reactance behavior common to cement composites was reduced, and thus the electrical properties of carbon microfiber prevailed;
-
although the evaluation of electrical properties of carbon microfibers in mortars had already been reported in the literature, its use based on the mix and parameters of the NBR 11173 standard (ABNT, 1990) and microfiber length of ~ 4 mm, denotes promising use for applications that may involve the use of multifunctional mortars with electrical properties;
-
although the incorporation of 1.2% carbon microfiber showed better electrical conductivity results, in the piezoresistivity test, the mixture with a 0.8% content had the best results – nevertheless, the self-sensing ability obtained was not satisfactory when compared to other studies; and
-
the TD-00-06 mix can be considered as the most optimized result of the present study, since it presented a statistically significant increase in flexural tensile strength and electrical conductivity, without extreme compromise of the other properties analyzed.
To better understand the effects of microfibers on micro and macroscopic levels, future research should include hydration degree investigations and porosimetry analysis. In addition, the evaluation of the piezoresistive effect under tensile and flexural loading conditions can be studied, in order understand the electromechanical mechanisms and to enhance the sensitivity and stability of the electrical response, for the mix proportion studied in this present research.
Finally, the improvement of mortars with electrical properties allows for advances in their applications, contributing to the development of technologies that enable the use of these mortars in real construction. However, the current study only examined mortar without steel reinforcement, which means that further studies should be carried out in order to investigate its behavior as a structural system.
Acknowledgments
This work has been supported by the following Brazilian research agencies: Coordenação de Aperfeiçoamento de Pessoal de Nível Superior (CAPES) - Finance Code 001; Conselho Nacional de Desenvolvimento Científico e Tecnológico (CNPq) (proc. 310375/2020-7 and proc. 309102/2023-5) and Fundação de Amparo à Pesquisa do Estado de São Paulo (FAPESP) (proc. 2023/05479-4 and proc. 2021/11380-5). The authors also thank the Postgraduate Program in Technology of University of Campinas (UNICAMP).
-
PALMA e SILVA, J. B. L.; OZAKI e SILVA, C. T.; MARÇULA, S. C.; LINTZ, R. C. C.; GACHET, L. A. Analysis of electrical and piezoresistive properties of mortar reinforced with carbon microfibers. Ambiente Construído, Porto Alegre, v. 26, e149412, jan./dez. 2026. ISSN 1678-8621 Associação Nacional de Tecnologia do Ambiente Construído. http://dx.doi.org/10.1590/s1678-86212026000100949
Data Availability Statement
Research data is only available upon request.
References
- ADRESI, M. et al A study of the main factors affecting the performance of self-sensing concrete. Advances in Cement Research, v. 29, p. 216-226, 2017.
- AL-DAHAWI, A. et al Electrical percolation threshold of cementitious composites possessing self-sensing functionality incorporating different carbon-based materials. Smart Materials and Structures, v. 25, n. 10, 105005, 2016.
- ASSOCIAÇÃO BRASILEIRA DE NORMAS TÉCNICAS. NBR 11173: mortar: design and construction: procedure. Rio de Janeiro, 1990.
- ASSOCIAÇÃO BRASILEIRA DE NORMAS TÉCNICAS. NBR 13279: mortars applied on walls and ceilings: determination of the flexural and the compression strength in the hardened stage. Rio de Janeiro, 2005a.
- ASSOCIAÇÃO BRASILEIRA DE NORMAS TÉCNICAS. NBR 13280: mortars applied on walls and ceilings: determination of the specific gravity in the hardened stage. Rio de Janeiro, 2005b.
- ASSOCIAÇÃO BRASILEIRA DE NORMAS TÉCNICAS. NBR 15630: mortars applied on walls and ceilings: determination of elasticity modulus by the ultrasonic wave propagation. Rio de Janeiro, 2008.
- ASSOCIAÇÃO BRASILEIRA DE NORMAS TÉCNICAS. NBR 16541: mortars applied on walls and ceilings: preparation of mortar mixture for tests. Rio de Janeiro, 2016.
- ASSOCIAÇÃO BRASILEIRA DE NORMAS TÉCNICAS. NBR 16605: Portland cement and other powdered material: determination of the specific gravity. Rio de Janeiro, 2017.
- ASSOCIAÇÃO BRASILEIRA DE NORMAS TÉCNICAS. NBR 16972: aggregates: determination of the unit weight and air-void contents. Rio de Janeiro, 2021b.
- ASSOCIAÇÃO BRASILEIRA DE NORMAS TÉCNICAS. NBR 17054: aggregates: determination of granulometric composition: test method. Rio de Janeiro, 2022.
- ASSOCIAÇÃO BRASILEIRA DE NORMAS TÉCNICAS. NBR 8522-1: hardened concrete: determination of elasticity and deformation modulus: part 1: static modulus by compression. Rio de Janeiro, 2021c.
- ASSOCIAÇÃO BRASILEIRA DE NORMAS TÉCNICAS. NBR NM 16916: fine aggregate: determination of density and water absorption. Rio de Janeiro, 2021a.
- BAEZA, F. J. et al. Effect of aspect ratio on strain sensing capacity of carbon fiber reinforced cement composites. Materials & Design, v. 51, p. 1085-1094, 2013.
- BEKZHANOVA, Z.; MEMON, S.; KIM, J. R. Self-sensing cementitious composites: review and perspective. Nanomaterials, v. 11, n. 2355, 2021.
- BELLI, A. et al. Commercial and recycled carbon/steel fibers for fiber-reinforced cement mortars with high electrical conductivity. Cement and Concrete Composites, v. 109, 103569, 2020.
- BELLI, A. et al. Evaluating the self-sensing ability of cement mortars manufactured with graphene nanoplatelets, virgin or recycled carbon fibers through piezoresistivity tests. Sustainability, v. 10, 4013, 2018.
- BIRGIN, H. B. et al. Smart graphite–cement composite for roadway-integrated weigh-in-motion sensing. Sensors, v. 20, n. 16, 4518, 2020.
- BIRGIN, H. B.; D’ALESSANDRO, A.; UBERTINI, F. A new smart sustainable earth-cement composite doped by carbon microfibers with self-sensing properties. Developments in the Built Environment, v. 14, 100168, 2023.
- BUASIRI, T. et al. Piezoresistive load sensing and percolation phenomena in portland cement composite modified with in-situ synthesized carbon nanofibers. Nanomaterials, v. 9, n. 4, 594, 2019.
- CARÍSIO, de A. P. et al. Dispersion of carbon nanotubes with different types of superplasticizer as a dispersing agent for self-sensing cementitious materials. Applied Sciences, v. 11, 8452, 2021.
- ÇELIK, D. N. et al. Self-monitoring of flexural fatigue damage in large-scale steel-reinforced cementitious composite beams. Cement and Concrete Composites, v. 123, 104183, 2021.
- CHEN, B.; WU, K.; YAO, W. Conductivity of carbon fiber reinforced cement-based composites. Cement and Concrete Composites, v. 26, n. 4, p. 291–297, 2004.
- CHOLKER, A. K.; TANTRAY, M. A. Micro carbon fiber based concrete as a strain-damage sensing material. Materials Today: Proceedings, v. 19, p. 152-157, 2019.
- CHUANG, W. et al. Dispersion of carbon fibers and conductivity of carbon fiber-reinforced cement-based composites. Ceramics International, v. 43, n. 17, p. 15122-15132, 2017.
- CHUNG, D. D. L. Self-sensing concrete: from resistance-based sensing to capacitance-based sensing. International Journal of Smart and Nano Materials, v. 12, n. 1, p. 1-19, 2021a.
- CHUNG, D. D. L.; XI, X. A review of the colossal permittivity of electronic conductors, specifically metals and carbons. Materials Research Bulletin, v. 148, 111654, 2022.
- CHUNG, D. D. L. Pitfalls and Methods in the measurement of the electrical resistance and capacitance of materials. Journal of Electronic Materials, v. 50, p. 6567-6574, 2021b.
- COSOLI, G. et al. Development and metrological characterization of cement-based elements with self-sensing capabilities for structural health monitoring purposes. Acta IMEKO, v. 12, p. 1-12, 2023.
- D’ALESSANDRO, A. et al. Electrical modelling of carbon nanotube cement-based sensors for structural dynamic monitoring. AIP Conference Proceedings, v. 1603, p. 23-30, 2014.
- DAS, A. K. et al. Smart self-healing and self-sensing cementitious composites. Recent Developments, Challenges, and Prospects Advances in Civil Engineering Materials, v. 8, n. 3, p. 554-578, 2019.
- DEHGHANI, A.; ASLANI, F. Piezoelectric behaviour of hybrid engineered cementitious composites containing shape-memory alloy, steel, and carbon fibres under compression stress cycles. Construction and Building Materials, v. 273, 121671, 2021b.
- DEHGHANI, A.; ASLANI, F. Piezoresistive sensing of cementitious composites reinforced with shape memory alloy, steel, and carbon fibres. Construction and Building Materials, v 267, 121046, 2021a.
- DEMIRCILIOĞLU, E. et al. Cross tension and compression loading and large-scale testing of strain and damage sensing smart concrete. Construction and Building Materials, v. 316, 125784, 2022.
- DENG, L. et al Preparation and piezoresistive properties of carbon fiber-reinforced alkali-activated fly ash/slag mortar. Construction and Building Materials, v. 222, 738-749, 2019.
- DING, S. et al. Development of sensing concrete: Principles, properties and its applications. Journal of Applied Physics, v. 126, n. 24, 241101, 2019.
- DING, S. et al. In-situ synthesizing carbon nanotubes on cement to develop self-sensing cementitious composites for smart high-speed rail infrastructures. Nano Today, v. 43, 101438, 2022.
- DONG, W. et al. Piezoresistive performance of hydrophobic cement-based sensors under moisture and chloride-rich environments. Cement and Concrete Composites, v. 126, 104379, 2022.
- DONNINI, J.; BELLEZZE, T.; CORINALDESI, V. Mechanical, electrical and self-sensing properties of cementitious mortars containing short carbon fibers. Journal of Building Engineering, v. 20, p. 8-14, 2018.
- DOWNEY, A. et al. Automated crack detection in conductive smart-concrete structures using a resistor mesh model. Measurement Science and Technology, v. 29, n. 3, 035107, 2018.
- FERDIANSYAH, T.; BALAYSSAC, J. P.; TURATSINZE, A. An experimental approach for characterisation of concrete damage using the wheatstone bridge circuit. International Journal of Civil Engineering, v. 20, p. 75-89, 2022.
- FRĄC, M. et al. The applicability of shungite as an electrically conductive additive in cement composites. Journal of Building Engineering, v. 45, 103469, 2022.
- FRĄC, M.; PICHÓR, W. Piezoresistive properties of cement composites with expanded graphite. Composites Communications, v. 19, p. 99-102, 2020.
- GARCÍA-MACÍAS, E. et al. Micromechanics modeling of the electrical conductivity of carbon nanotube cement-matrix composites. Composites Part B: Engineering, v. 108, p. 451-469, 2017.
- HAGHGOO, M.; ANSARI, R.; HASSANZADEH-AGHDAM, M. K. Prediction of piezoresistive sensitivity and percolation probability of synergetic CNT-GNP conductive network composite. Sensors and Actuators A: Physical, v. 336, 113414, 2022.
- HAN, B.; DING, S.; YU, X. Intrinsic self-sensing concrete and structures: a review. Measurement, v. 59, p. 110-128, 2015.
- HAN, J. et al. A review on carbon-based self-sensing cementitious composites. Construction and Building Materials, v. 265, 120764, 2020.
- HUANG, Y.; LI, H.; QIAN, S. Self-sensing properties of engineered cementitious composites. Construction and Building Materials, v. 174, p. 253-262, 2018.
- HUO, L. et al. Bond-slip monitoring of concrete structures using smart sensors: a review. Sensors, v. 19, n. 5, 1231, 2019.
- IRFAN, M. S. et al. Carbon coated piezoresistive fiber sensors: From process monitoring to structural health monitoring of composites: a review. Composites Part A: Applied Science and Manufacturing, v. 141, 106236, 2021.
- KIM, T. U. et al. Development of a smart concrete block with an eccentric load sensing capacity. Construction and Building Materials, v. 306, 124881, 2021.
- LAZANAS, A. C.; PRODROMIDIS, M. I. Electrochemical Impedance Spectroscopy: a tutorial. ACS Measurement Science Au, v. 3, p. 162-193, 2023.
- LIU, L. et al. Improving electrical and piezoresistive properties of cement-based composites by combined addition of nano carbon black and nickel nanofiber. Journal of Building Engineering, v. 51, 104312, 2022.
- LUO, T.; WANG, Q. Effects of graphite on electrically conductive cementitious composite properties: a review. Materials, v. 14, 4798, 2021.
- MO, Y. L. et al. Electrical impedance of carbon nanofiber aggregates. In: LIEW, M. S. et al. Micro and nano technologies, smart nanoconcretes and cement-based materials London: Elsevier, 2020.
- MONTEIRO, A. O.; CACHIM, P. B.; COSTA, P. M. F. J. Self-sensing piezoresistive cement composite loaded with carbon black particles. Cement and Concrete Composites, v. 81, p. 59-65, 2017.
- MUTHUKUMARANA T. V. et al. A review on the variation of mechanical properties of carbon fibre-reinforced concrete. Construction and Building Materials, v. 366, 130173, 2023.
- NALON, G. H. et al. Effects of different kinds of carbon black nanoparticles on the piezoresistive and mechanical properties of cement-based composites. Journal of Building Engineering, v. 32, 101724, 2020.
- NALON, G. H. et al. Recycling waste materials to produce self-sensing concretes for smart and sustainable structures: a review. Construction and Building Materials, v. 325, 126658, 2022.
- NALON, G. H. et al. Residual piezoresistive properties of mortars containing carbon nanomaterials exposed to high temperatures. Cement and Concrete Composites, v. 121, 104104, 2021.
- OZAKI E SILVA, C. T. et al. Mortars with addition of powdered graphite: mechanical and electrical properties. Materials Today: Proceedings, in press, 2023.
- QI, G. et al. Effect of rGO/GNP on the electrical conductivity and piezoresistance of cement-based composite subjected to dynamic loading. Construction and Building Materials, v. 368, 130340, 2023.
- QIU, L. et al. Self-sensing ultra-high performance concrete for in-situ monitoring. Sensors and Actuators A: Physical, v. 331, 113049, 2021.
- RAMACHANDRAN, K. et al. A review on principles, theories and materials for self sensing concrete for structural applications. Materials, v. 15, 3831, 2022.
- RAO, R. K.; SASMAL, S. Smart nano-engineered cementitious composite sensors for vibration-based health monitoring of large structures. Sensors and Actuators A: Physical, v. 311, 112088, 2020.
- SAFIUDDIN, M.; ABDEL-SAYED, G.; HEARN, N. Flexural and impact behaviors of mortar composite including carbon fibers. Materials, v. 15, 1657, 2022.
- SARWARY, M. H. et al. Self-sensing of flexural damage in large-scale steel-reinforced mortar beams. ACI Materials Journal, v. 116, p. 209-221, 2019.
- SCHOLLE, P.; SINAPIUS, M. A review on the usage of continuous carbon fibers for piezoresistive self strain sensing fiber reinforced plastics. Journal of Composites Science, v. 5, n. 4, 96, 2021.
- SEGURA, I. et al. Self-sensing concrete made from recycled carbon fibres. Smart Materials and Structures, v. 28, n. 10, 105045, 2019.
- SHAHZAD, S. et al. Design of smart cementitious composites based on multi-walled carbon nanotubes (MWCNTs) using probe ultrasonicator for dispersion. In: INTERNATIONAL CONFERENCE ON CONCRETE REPAIR, REHABILITATION AND RETROFITTING, 6., Cape Town, 2022. Proceedings […] Cape Town, 2022.
- SILVA, J. B. L. P. E. et al. Self-sensing cement composite based on the piezoresistive effect with brake lining waste. Construction and Building Materials, v. 456, p. 139273, 2024.
- SILVA, J. B. L. P. E; LINTZ, R. C. C.; GACHET, L. A. Use of the arduino platform for the piezoresistivity analysis in self-sensing cement composites. Materials Research, v. 26, n. 1, e20220520, 2023.
- SONG, F. et al. Piezoresistive properties of ultra-high-performance fiber-reinforced concrete incorporating few-layer graphene. Construction and Building Materials, v. 305, 124362, 2021.
- TIAN, Z. et al. A state-of-the-art on self-sensing concrete: materials, fabrication and properties. Composites Part B: Engineering, v. 177, 107437, 2019.
- TIAN, Z. et al. Influence of particle morphology and concentration on the piezoresistivity of cement-based sensors with magneto-aligned nickel fillers. Measurement, v. 187, 110-194, 2022.
- VIPULANANDAN, C.; GARAS, V. electrical resistivity, pulse velocity, and compressive properties of carbon fiber-reinforced cement mortar. Journal of Materials in Civil Engineering, v. 20, n. 2, p. 93-101, 2008.
- WANG, L.; ASLANI, F. Structural performance of reinforced concrete beams with 3D printed cement-based sensor embedded and self-sensing cementitious composites. Engineering Structures, v. 275, 115266, 2023.
- WANG, L.; ASLANI, F. A review on material design, performance, and practical application of electrically conductive cementitious composites. Construction and Building Materials, v. 229, 116892, 2019.
- WANG, L.; ASLANI, F. Mechanical properties, electrical resistivity and piezoresistivity of carbon fibre-based self-sensing cementitious composites. Ceramics International, v. 47, n. 6, p. 7864-7879, 2021.
- YOO, D-Y.; YOU, I.; LEE, S-J. Electrical properties of cement-based composites with carbon nanotubes, graphene, and graphite nanofibers. Sensors, v. 17, 1064, 2017.
- YOU, I. et al. Electrical and self-sensing properties of ultra-high-performance fiber-reinforced concrete with carbon nanotubes. Sensors, v. 17, 2481, 2017.
- YU, Q. et al. Effects of hybrid carbon and steel fibres on selfsensing and electromagnetic wave absorbing properties of concrete. Construction and Building Materials, v. 460, p. 139848, 2025.
- ZHANG, J. et al. Electrical impedance behaviour of carbon fibre reinforced cement-based sensors at different moisture contents. Construction And Building Materials, v. 353, p. 129049, 2022.
- ZHANG, X. et al. The growth of in-situ CNTs on slag to enhance electromagnetic interference shielding effectiveness of cement-based composite. Construction and Building Materials, v. 411, 134643, 2024.
- ZHAO, Y. et al. Effect of carbon fibers and graphite particles on mechanical properties and electrical conductivity of cement composite. Journal of Building Engineering, v. 94, p. 110036, 2024.
- ZHU, Y. et al. Electrochemical impedance spectroscopy (EIS) of hydration process and drying shrinkage for cement paste with W/C of 0.25 affected by high range water reducer. Construction and Building Materials, v. 131, p. 536-541, 2017.
Edited by
-
Editor-in-chief:
Enedir Ghisi
-
Guest editor:
Juliana Machado Casali Peruch

 Source: adapted from
  Source: adapted from
  Source: adapted from
  Source: adapted from
  Source: adapted from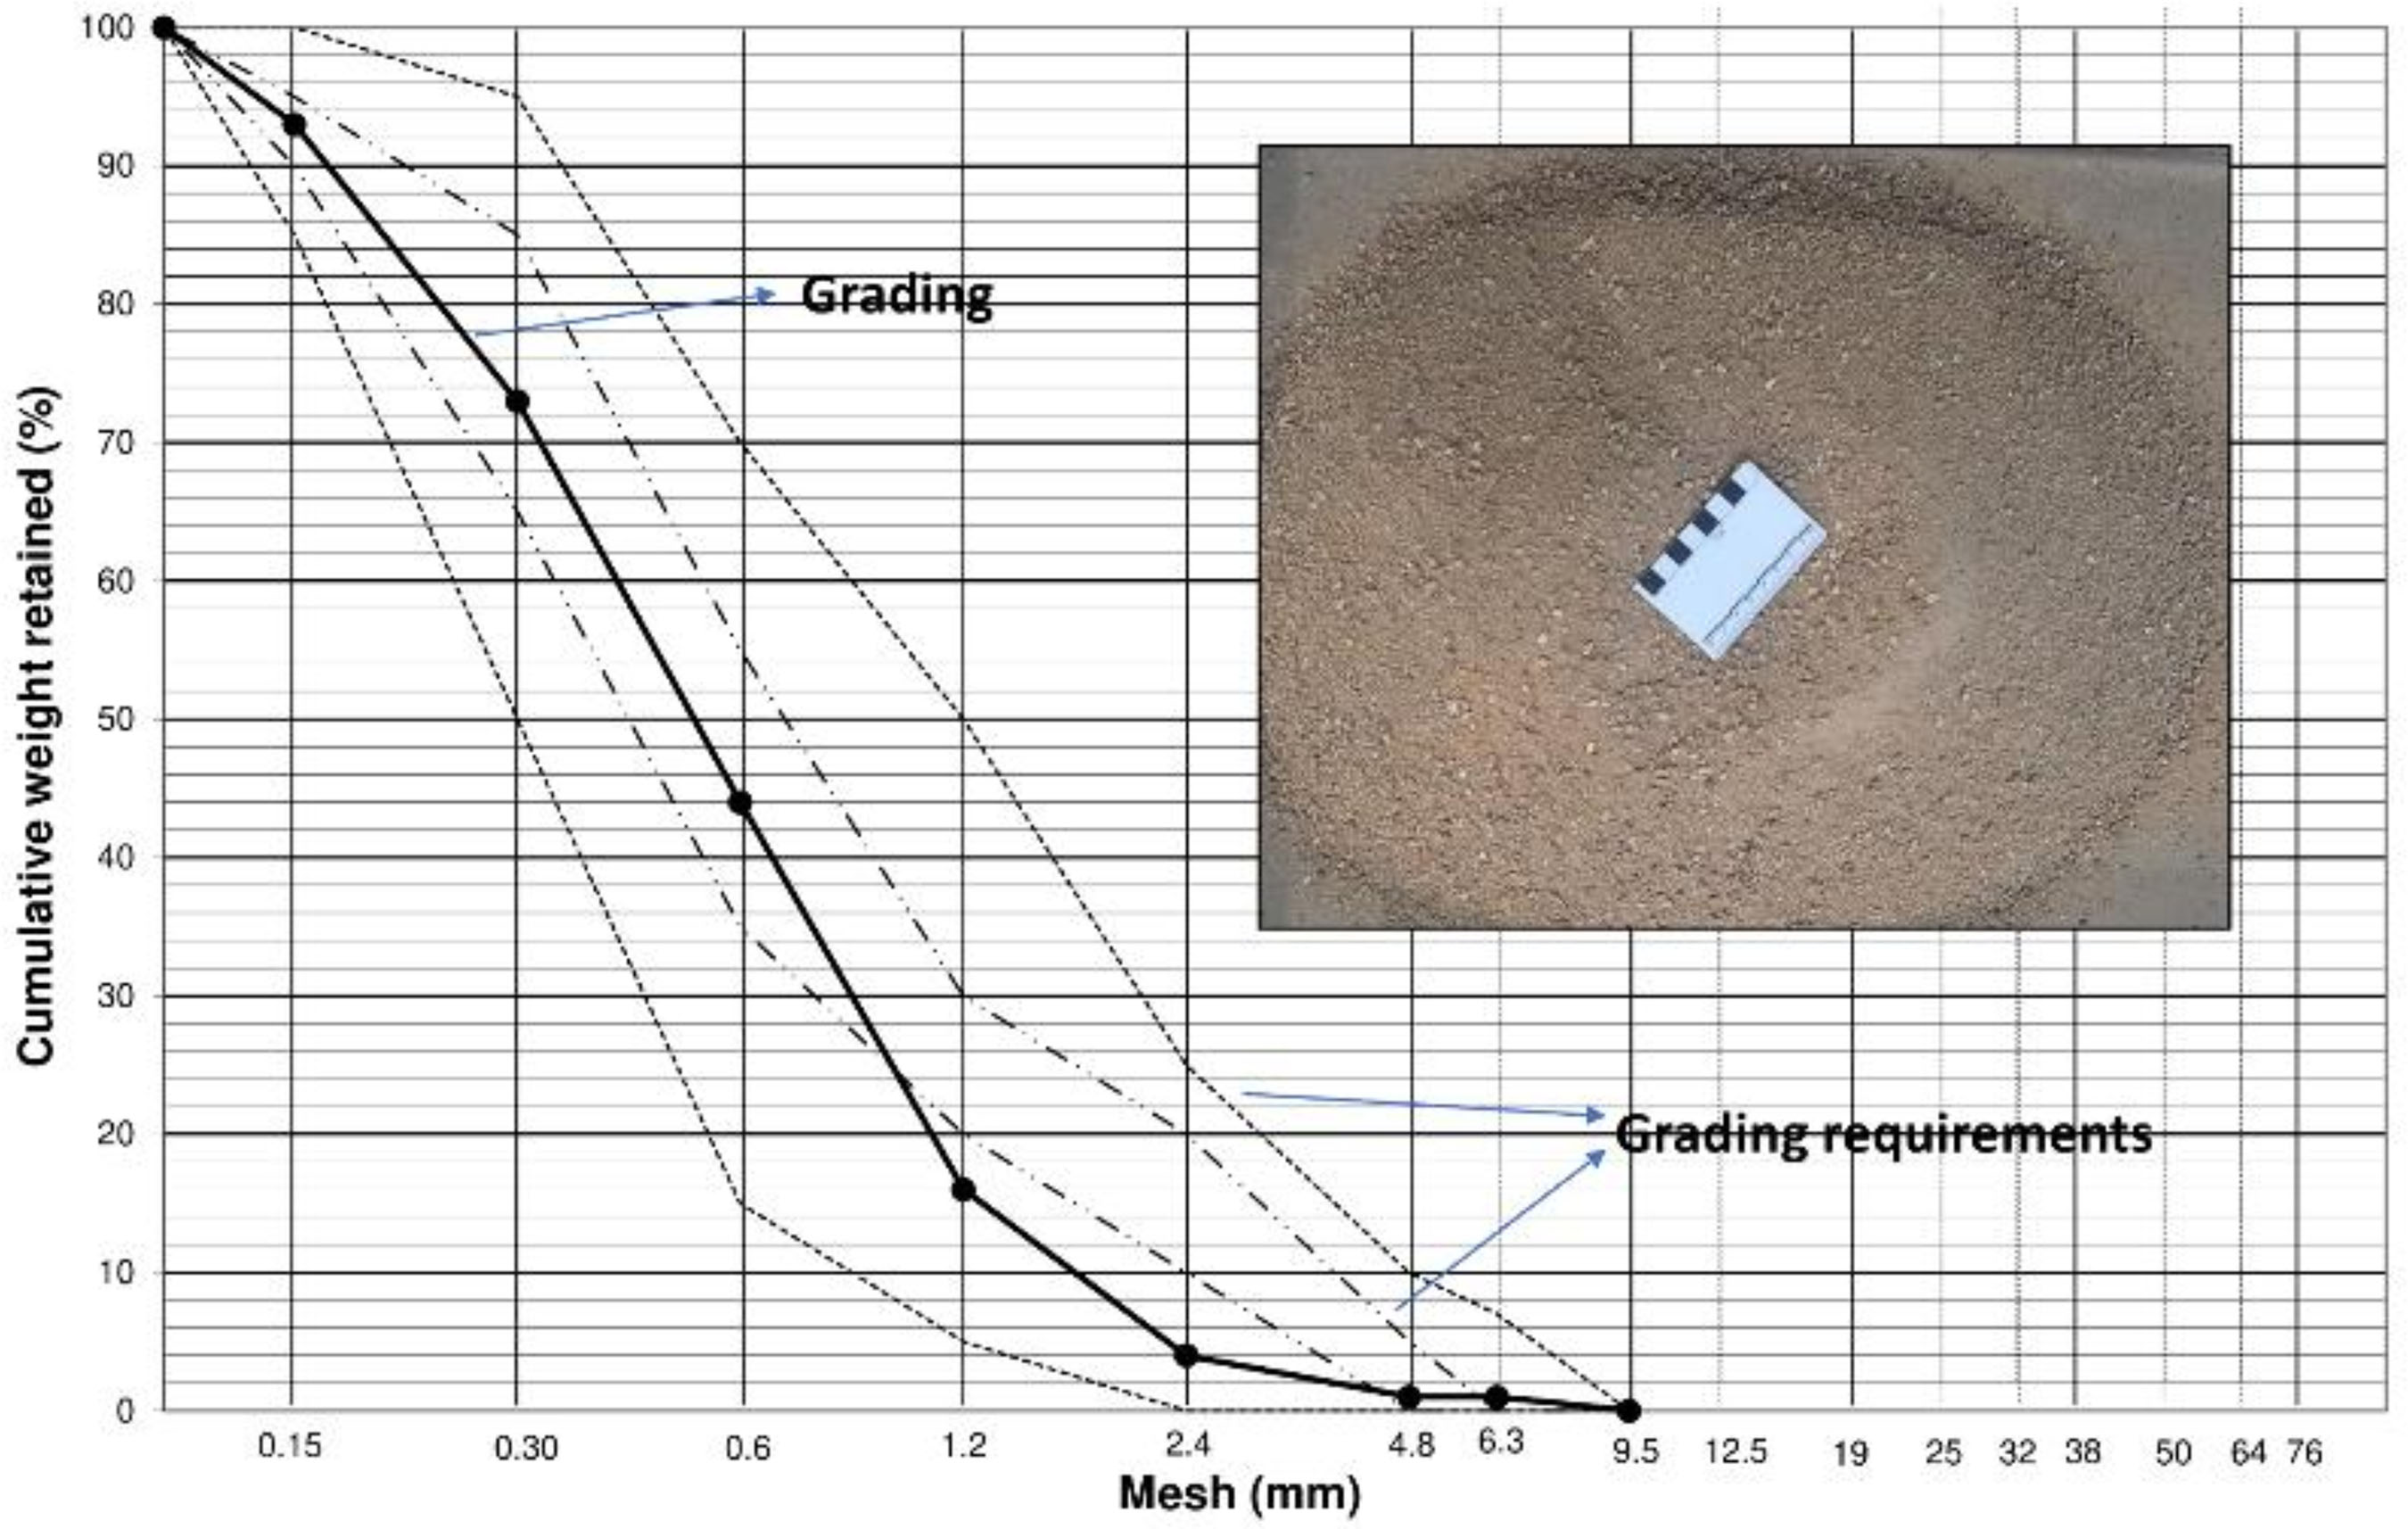
 Source: adapted from
  Source: adapted from
  Source: adapted from