Risk areas prioritization approach to support disaster management: a case study in Porto Alegre, Brazil
Abstract
Climate change has increased the frequency and intensity of climate disasters, impacting over social, environmental and economic dimensions. In this context, this study aims to develop a multicriteria approach to prioritize risk areas, supporting decision-makers in disaster mitigation strategies. The approach integrates social, economic, infrastructure, and physical criteria, selected via expert focus groups and weighted using a mathematical matrix based on the Analytical Hierarchy Process (AHP). The criteria’s weights, combined with local indicators, results in a prioritization index. The approach was tested in risk areas of Porto Alegre, Brazil. The results of the study highlighted social criteria as the higher weights, with 43.7% of importance, followed by physical (25.5%) and infrastructure (19.4%) dimensions, and at least the economic dimension (11.4%). The findings underscore the prevalence of social criteria, highlighting the vulnerability of populations in areas with inadequate infrastructure. That has resulted in higher prioritization indexes in extreme social vulnerability areas in Porto Alegre, especially in areas impacted by hydrological processes, such as floods and flash floods, reflecting the critical reality of recent events, such as the historic 2024 flood. By identifying priority zones, this approach serves as tool for guiding sustainable, resilient urban planning and for optimizing public investment.
Keywords
urban planning; Sustainability; Risk management; Prioritization; Disasters; Resilience
Resumo
As mudanças climáticas têm aumentado em frequência e em número os desastres climáticos, impactando dimensões sociais, ambientais e econômicas. Neste contexto, este estudo tem como objetivo desenvolver uma abordagem multicritério para priorizar áreas de risco, como suporte a tomadores de decisão em estratégias de mitigação de desastres. A abordagem integra critérios sociais, econômicos, físicos e de infraestrutura, selecionados por meio de grupo focal com especialistas e ponderados com base no Processo Analítico Hierárquico. Os pesos dos critérios, combinados com indicadores locais, resultam em um índice de priorização. Esta abordagem foi testada em uma amostra de áreas de risco de Porto Alegre. Os resultados do estudo destacam os critérios sociais com os maiores pesos, com 43.7% de importância, seguidos das dimensões física (25.5%) e infraestrutura (19.4%), e por fim, a dimensão econômica (11,4%). Isto resultou em maiores índices de priorização em áreas de extrema vulnerabilidade social de Porto Alegre, especialmente em áreas impactadas por processos hidrológicos, como enxurradas e inundações, refletindo a realidade crítica de eventos recentes, como a inundação histórica de maio de 2024. Ao identificar as zonas prioritárias, esta abordagem serve como uma ferramenta para o planejamento urbano sustentável e resiliente e por otimizar o investimento público.
Palavras-chave
Planejamento urbano; Sustentabilidade; Gestão de riscos; Prioritização; Desastres; Resiliência
1 Introduction
The increasing intensity and frequency of extreme weather events have become a challenge for urban planning due to their social, economic, and environmental impacts (AghaKouchak et al., 2020). The topic is integrated into agendas such as the Sendai Framework (UN, 2015a) and the Sustainable Development Goals, especially goal 11, which aims to make cities sustainable and resilient (UN, 2015b). Although it is not possible to avoid many weather events, it is essential to identify patterns to develop preventive methods and reduce their damage, enhancing resilient urban planning with the opportunity to create healthier and equitable cities (Wilden; Feldmeyer, 2021).
Amid climate change and the occurrence of extreme events, the main role of public authorities is effective management to reduce disaster risks by prioritizing investments in infrastructure that is exposed to hazards while enhancing resilience (Christoplos et al., 2017; Pirlone; Spadaro; Candia, 2020). The increase in impacts of disasters is directly related to the vulnerability of peripheral communities, which intensifies the hazard due to their inadequate infrastructure and poverty. The reduction of these risks must be associated with decision-making processes, not only post-event but also in public policies and urban planning (Assis et al., 2024).
In this sense, risk can be defined by the product of hazard and vulnerability. Hazards are defined as the probability of an event occurring, linked to the event itself. On the other hand, the concept of vulnerability attempts to quantify the pre-existing conditions that make an exposed element susceptible to a hazardous process. In extreme situations, such as disasters, vulnerability is amplified by the impacts of damage, both direct and indirect, to a community (Bressani, 2024; Silva Filho et al., 2015). The ability to assess disaster vulnerability is a fundamental need for formulating risk reduction strategies, providing relevant information on the most susceptible infrastructure locations. This can improve risk planning and management processes (Alvalá et al., 2024).
The dynamics of risk must consider different possible scenarios, combining the probability of hazardous processes and the relationships among vulnerability indicators. At this point, disaster risk management comes into play: identifying risks and implementing concrete solutions for diverse scenarios. These risk scenarios can be graphically represented through risk area maps of the municipality, separating areas by hierarchical risk order (Lana, 2021).
One way to reduce the impact of disasters is through mitigation, which involves minimizing the adverse effects of threats (Marchezini et al., 2024). Measures can be structural, such as containment of works, drainage, surface protection, urban requalification, and relocation of buildings. These interventions are essential in densely populated urban areas and should be integrated into urban planning for risk management. Non-structural actions encompass educational, institutional, and behavioral policies and practices aimed at prevention. They include land use and occupation, environmental education, early warning systems, training, and specific legislation, with a focus on community participation. Such initiatives strengthen society's adaptive capacity and promote a culture of prevention and resilience (Lana, 2021).
Although it is recognized that all risk-prone areas demand attention and priority in action plans, there is a pressing need for prioritization tools that incorporate the principles of sustainability and urban resilience. Such tools can provide strategic guidance for public authorities, especially in Brazil, where disordered urban expansion is a striking characteristic of high-risk areas, further exacerbating existing vulnerabilities (Ferentz; Garcias, 2020).
Some approaches were identified in literature. The works of Zhang et al. (2020), Anelli, Tajani and Ranieri (2022), and Silva, Alencar and Almeida (2022) stand out for their multicriteria-based methodology. For Zhang et al. (2020), an urban resilience index is an increasingly popular tool for monitoring progress toward climate-resilient cities. The authors developed an index using social, economic, infrastructural, institutional, and environmental indicators to assist municipal planners. Similarly, Anelli, Tajani and Ranieri (2022) developed an indicator-based methodology to construct a synthetic natural risk index that represents disaster exposure in suburban areas. Their model is built upon three components: hazard, exposure, and vulnerability. In the Brazilian context, da Silva, Alencar and Almeida (2022) developed a probabilistic multi-criteria decision-making (MCDM) model to prioritize flood-prone areas. Their model incorporates the decision-maker's preferences regarding environmental, financial, human, and mobility attributes, such as water contamination and loss of life.
The MCDM approach is highlighted as a set of techniques for supporting complex decision-making (Taherdoost; Madanchian, 2023). Analytical Hierarchy Process (AHP) remains a primary method within this approach, decomposing problems into hierarchies to transform subjective judgments into numerical values (Saaty, 1980). Given that disaster management often involves implicit assumptions influenced by cultural and social factors, MCDM approaches allow these complex processes to be resolved through mathematical equations and data models (Magalhães et al., 2022; Ferentz; Garcias, 2020; Taherdoost; Madanchian, 2023).
While there are works on supporting disaster management using several indicators, gaps were identified, specifically in prioritizing risk areas after risk mapping, to support political-administrative decisions on prioritizing public investment actions. It is also found in literature that there is a need to address data scarcity and context-specific criteria in developing countries, such as in south America, as well as it has a need to operationalize collaborative and transparent decision-making for urban risks and apply them into regional context, to ensure robustness and transferability of the models (Khademi; Behnia; Saedi, 2014; Maleki et al., 2026).
To guide the development of this study, the following research question is addressed: How can a multi-criteria approach be constructed, and what are the key dimensions and criteria to guide risk mitigation strategies by prioritizing areas? Associated with this question, a central hypothesis is tested: The development of a prioritization approach, integrating weighted social, economic, infrastructure, and physical criteria and context-specific local indicators, generates risk indices capable of guiding more effective and optimized public investments in disaster mitigation.
This work aims to propose and discuss key criteria for prioritizing high-risk areas by developing an Analytic Hierarchy Process (AHP)-based approach, and apply it to a real-world case in Porto Alegre, Brazil, supporting decision-makers in the implementation of hydrological-geotechnical disaster mitigation plans. The study is directly motivated by the ongoing execution of Porto Alegre’s Municipal Risk Reduction Plan, an initiative proposed by the Brazilian Ministry of Cities.
2 Methods
The method is based on a case study in the city of Porto Alegre/RS during 2024 to 2025, the period in which the Municipal Risk Reduction Plan was implemented. The research phases were identifying criteria for prioritizing risk areas and applying them in a real-world scenario. The methodological framework presented here is an evolution of the approach first introduced in Bach, Passuello and Bressani (2025). While the previous work focused on the criteria discussion, this article provides a more comprehensive analysis by applying the model to a real case study in Porto Alegre.
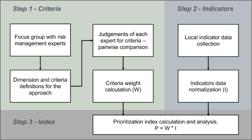
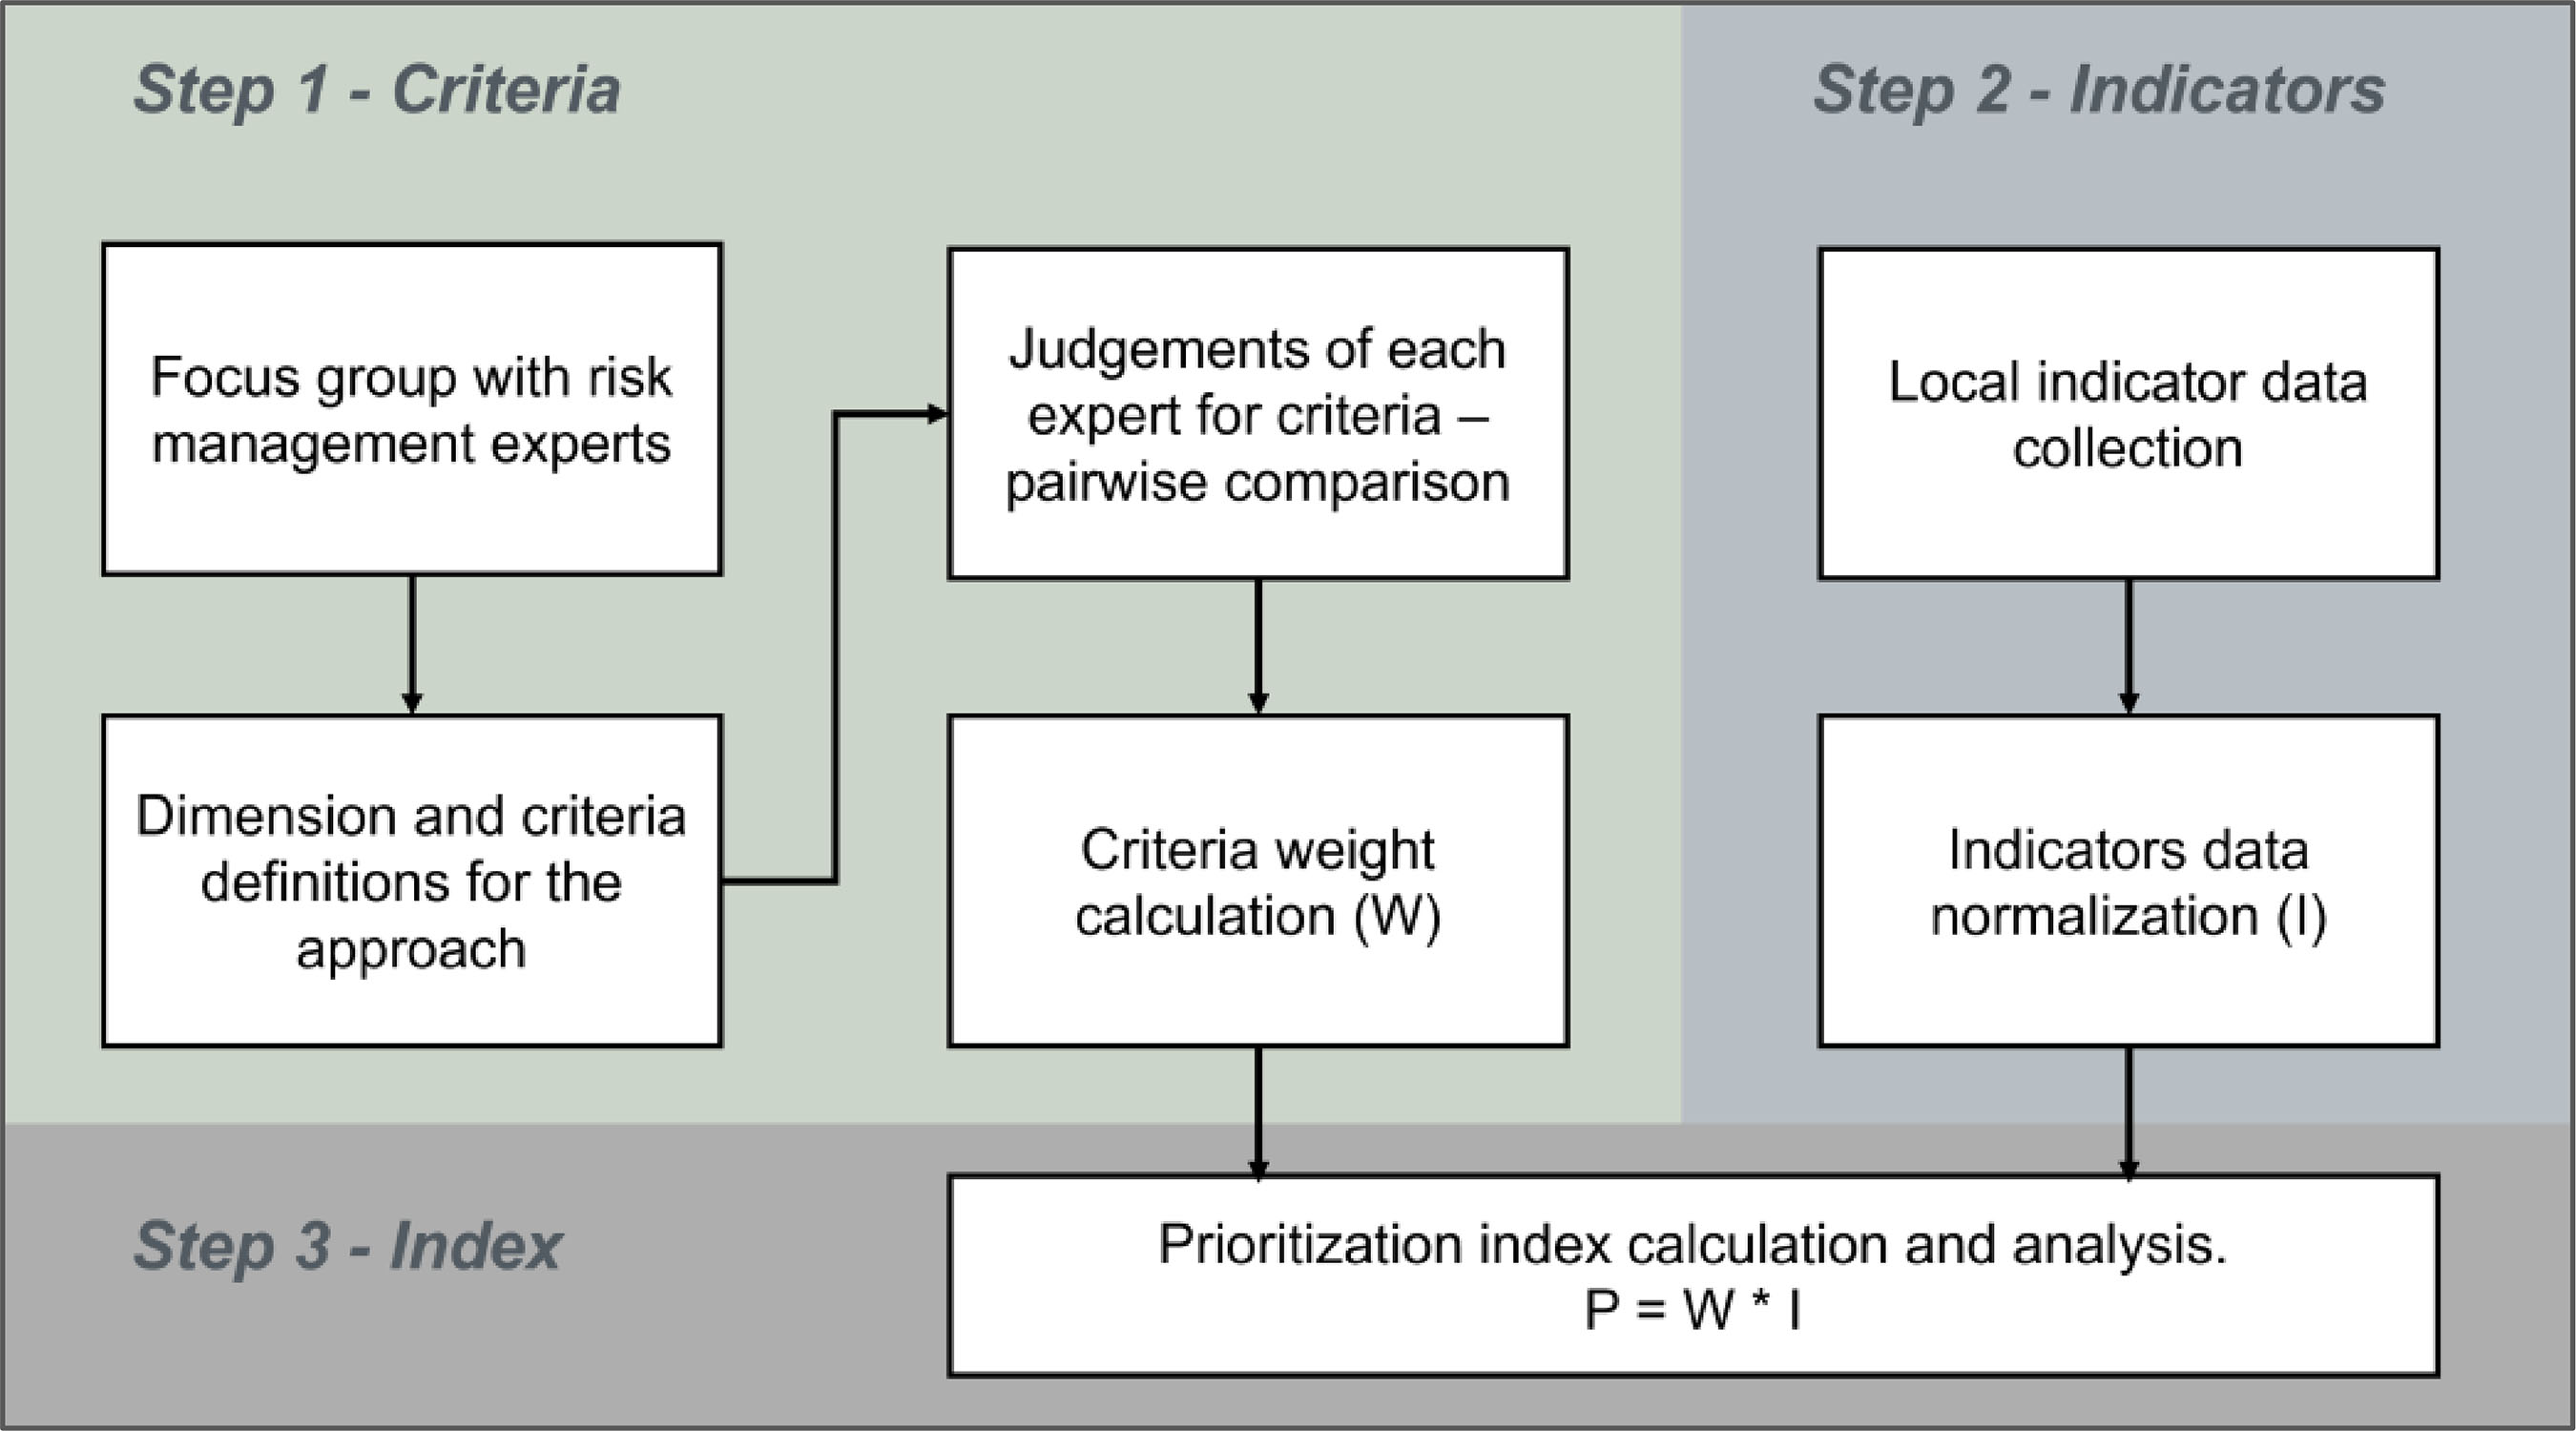
Figure 1 presents a flowchart of the structure of how the study was conducted by three main steps:
-
criteria discussion and definition by a focus group and weights ponderations with AHP;
-
indicators data collection and treatment, specifically collecting data from the case study in Porto Alegre; and
-
prioritization index calculations and analysis.
2.1 Prioritization criteria
The study's prioritization criteria follow two steps: first, a focus group was conducted with the technical team of the Risk Reduction Municipal Plan to develop and discuss prioritization criteria, which were compared with a preliminary study in the literature; second, a questionnaire was conducted to determine the weights for each criterion.
In the first step, four main criteria dimensions were defined as the most relevant to the study: social, economic, infrastructure, and physical, applicable to floods, flash floods, and landslides, which are the most predominantly risk-mapped processes in Porto Alegre (Belletini; Lamberty; Binotto, 2022).
In the second step, eight experts in the risk management area, with an average of 20 years of experience, have answered the questionnaire evaluating pair comparisons between the criteria of each dimension, selecting the following options:
-
equally important (weight 1);
-
a little more important (weight 3);
-
more important (weight 5);
-
much more important (weight 7); and
-
considering their opposites (1/3; 1/5; and 1/7).
The collected data were analyzed using the Analytical Hierarchy Process (AHP) proposed by Saaty (1980, 1987) to normalize the weights for each criterion. The dimensions were compared to assess the impact of each. At the end, two types of weights were generated: dimension weights (wd) and criteria weights (wd) for the different processes considered in the study.
For that, the following steps were taken:
-
position of values in the matrix: the values resulting from the comparisons were placed in the matrix according to the answers obtained, as shown in Table 1, which is an example of one of the matrices that were calculated during the process;
-
matrix normalization: The second step is the matrix normalization, which consists of summing the columns and dividing the result by the value of each cell. The average of the normalized row values represents the average priority vector. The following is a continuation of the example mentioned earlier (Table 2); and
-
Consistency Ratio (CR): Based on the resulting matrix, an inconsistency analysis is performed using the consistency ratio (CR), which is the result of dividing the consistency index (CI) by the random index (RI) (Saaty, 1980). Table 3 presents the following example of the calculation of CR.
Saaty (1980) suggests acceptable consistency ratios close to zero. When consistency ratios exceed 0.1, the author recommends reviewing the matrix to seek refinement. However, it is important that the judgments remain faithful to the evaluator's perception.
2.2 Case study
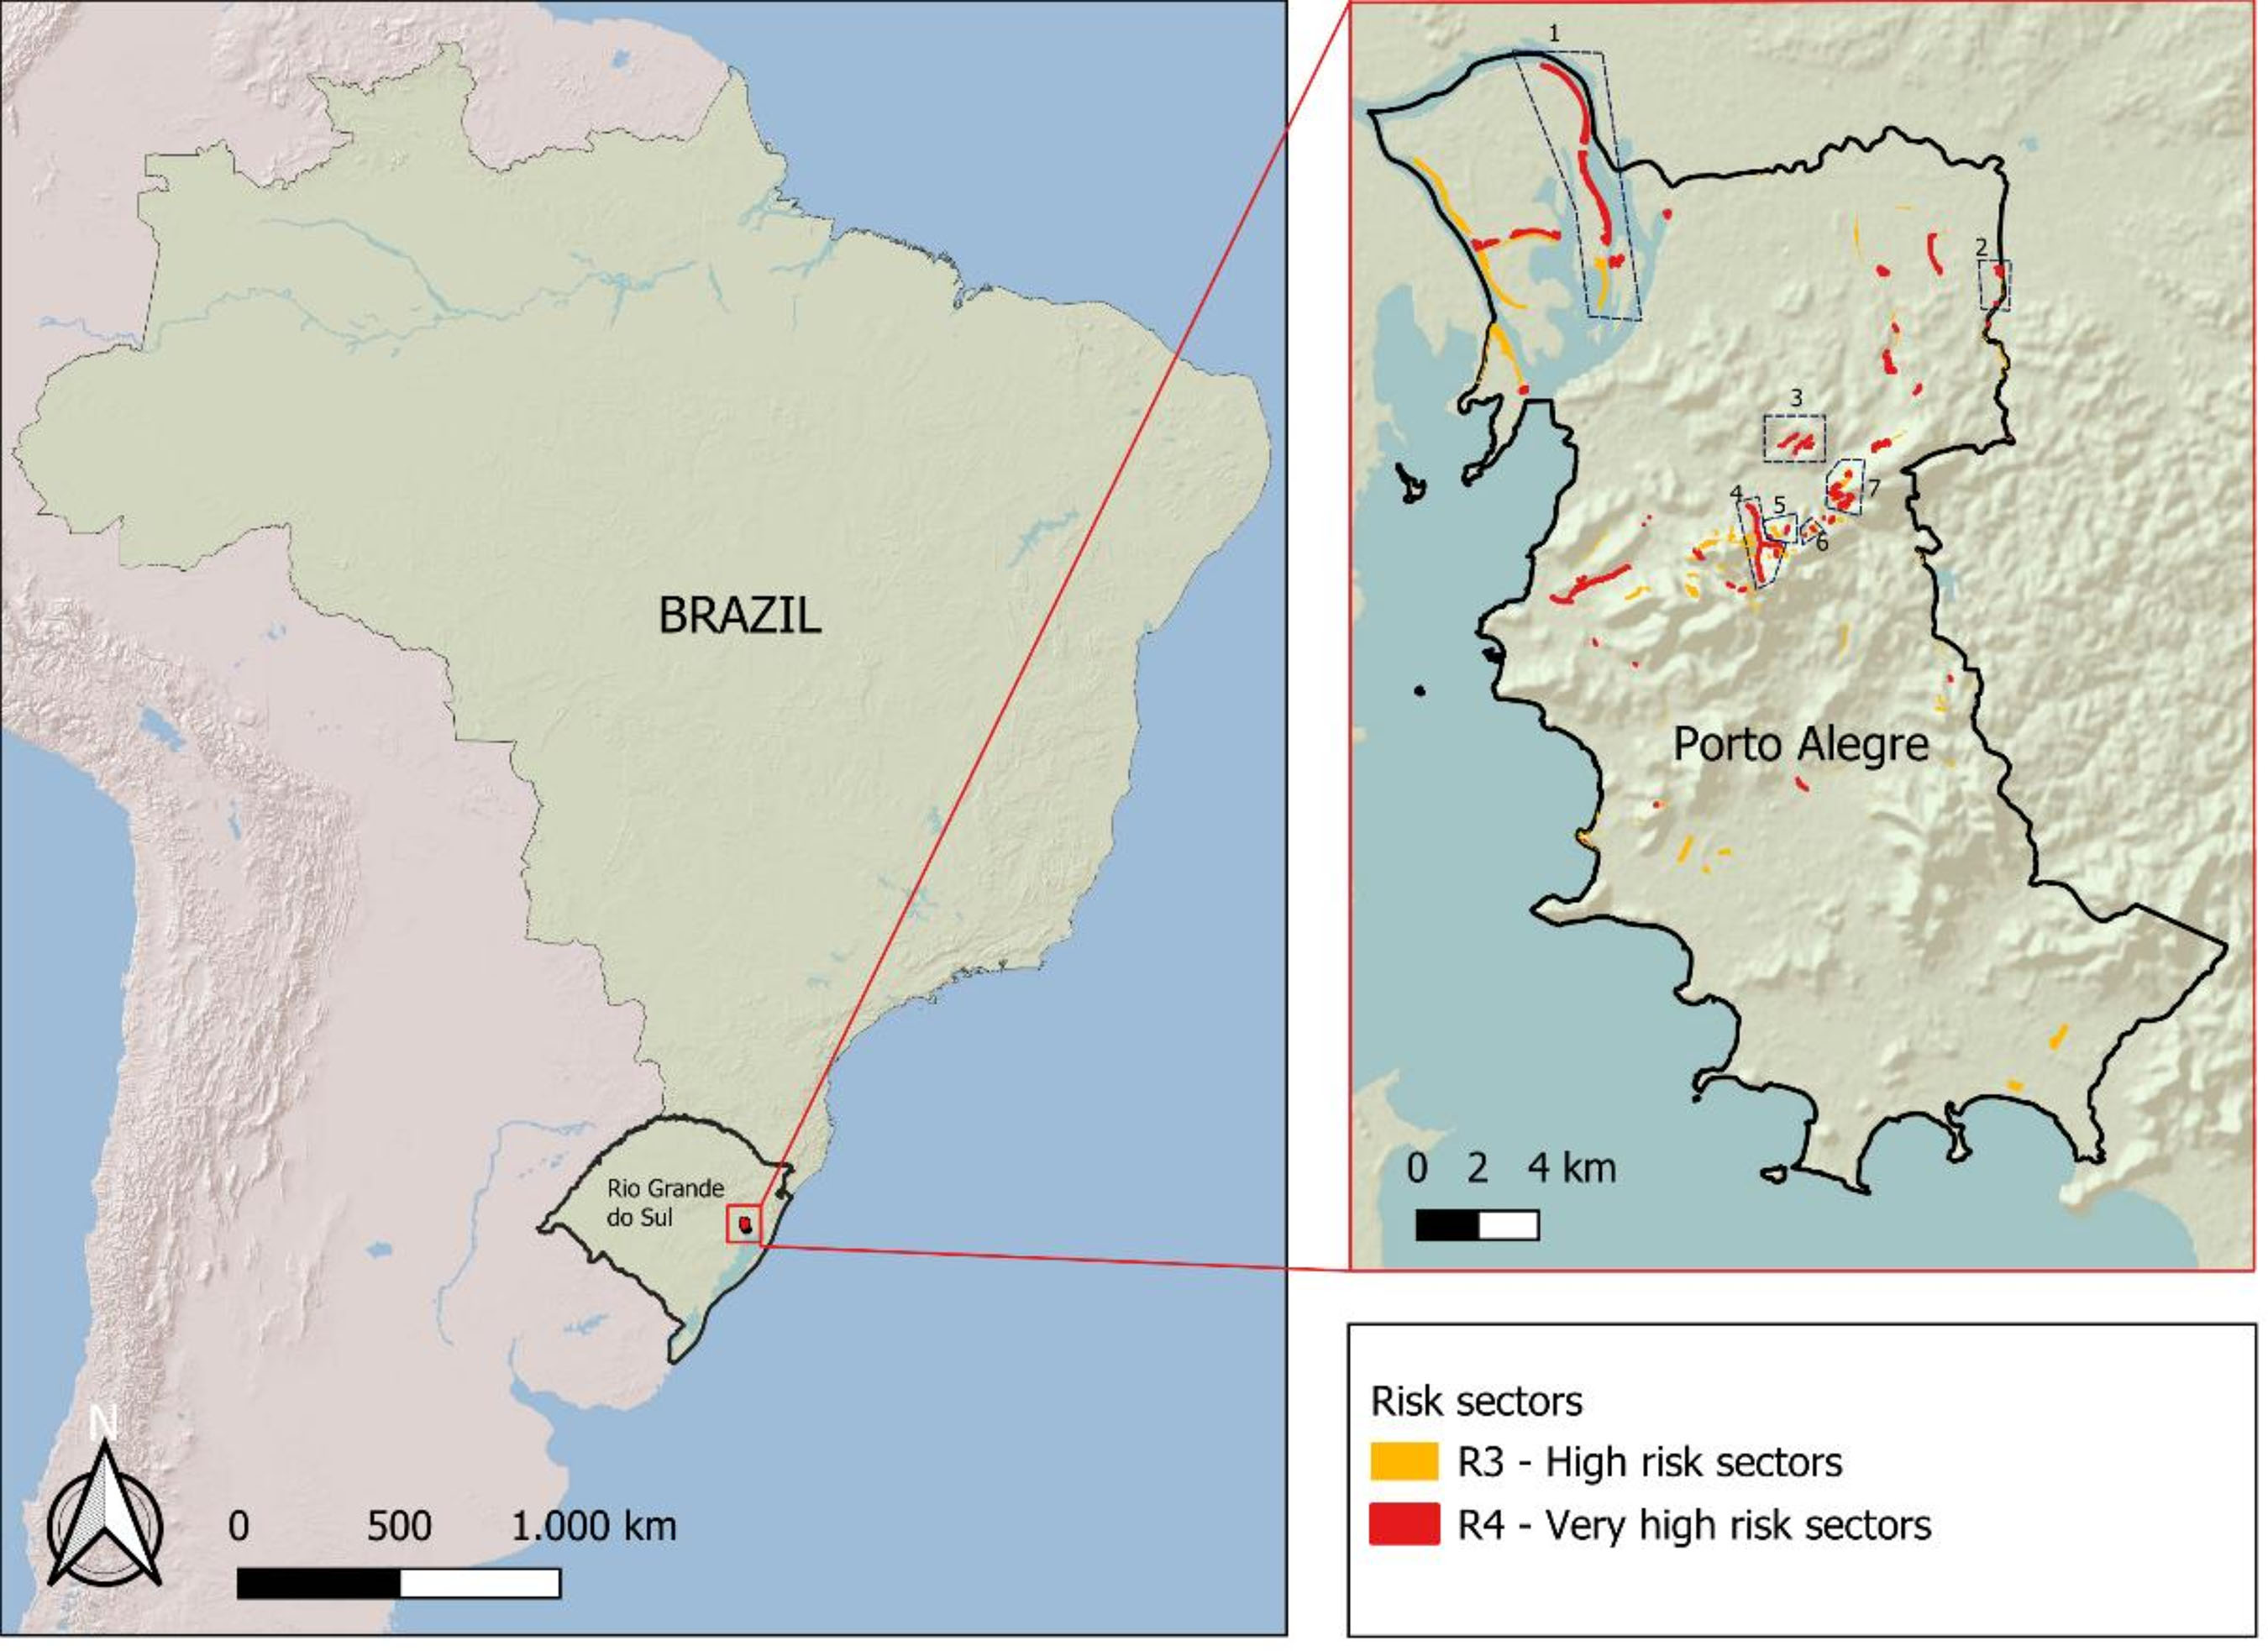
During the development of the work, a case study was conducted in 7 regions of the city of Porto Alegre, southern Brazil, which share common characteristics, particularly because they have been mapped as risk sectors. The study was based on documentary analysis of the mappings produced by the Brazilian Geological Service (SGB-CPRM) and, particularly, on the execution of the Municipal Risk Reduction Plan of Porto Alegre/RS, during which it was possible to participate in technical inspection visits, team meetings, and dialogues with local agents.
Prior to Porto Alegre’s Risk Reduction Municipal Plan, the mapping carried out by the SGB-CPRM indicated, in 2013, the existence of 119 locations at risk in the capital of Rio Grande do Sul. The update of the document, in 2022, shows that the number increased to 142 risk areas, 23 more, totaling 20,884 families living in these locations. The report addressed three main processes: mass movements, hydrological processes, and erosive processes (Belletini; Lamberty; Binotto, 2022).
According to the SGB-CPRM report (Belletini; Lamberty; Binotto, 2022), Porto Alegre has 91 areas of high (R3) geological risk and 51 areas of very high (R4) geological risk. In the high-risk group, there are approximately 14,600 properties and 58,624 people. In the very high-risk areas, there are approximately 6,284 properties and 25,836 people. In 2023, the study indicated an increase to 145 risk areas, with approximately 84,400 people living in these locations.
Based on decisions of the risk reduction plan technical team and municipal agents, areas were selected to be studied more thoroughly. These are 7 distinct neighborhoods with 19 sectors of high (R3) and very high (R4) risk. The 19 risk sectors will be part of the empirical study and will be categorized by their neighbors, as follows:
-
Ilha dos Marinheiros;
-
Rubem Berta and Santa Rosa de Lima;
-
Bom Jesus;
-
Arroio Moinho;
-
Vila São José;
-
Partenon; and
-
Jardim Carvalho (Figure 2).
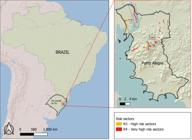
Ilha dos Marinheiros encompasses sectors 43, 44, 45, 46, and hosts the largest resident population among the studied areas, with 4,680 people and 1,170 buildings across 97 hectares. The region is highly vulnerable to flooding from the Jacuí and Guaíba rivers, and during the May 2024 disaster, water levels exceeded 2 meters in height, impacting ground-level residences and highlighting severe failures in emergency communication and evacuation infrastructure.
The risk areas in Rubem Berta and Santa Rosa de Lima are characterized by sectors 69 and 70, which host 840 residents and 210 buildings over 6 hectares. These sectors face threats from flooding and flash floods due to their proximity to the Feijó river; notably, sector 70 was completely impacted by the historic flood of May 2024, resulting in severe material losses for the local population.
In the Bom Jesus neighborhood, the study focuses on risk sectors 109, 110, and 111, all classified as very high risk (R4). The area supports a population of 720 residents and 180 buildings across 4 hectares. The primary threat is flash flooding, which is exacerbated by precarious road infrastructure and building installations placed directly over or very near the watercourses, alongside significant solid waste accumulation that often obstructs drainage pipes.
The Arroio Moinho sub-basin impacts risk sectors 121 and 123, both classified as very high risk (R4). This area supports 1,900 residents and 475 buildings over 18 hectares. Risks include flash floods and mass movements, with critical vulnerabilities identified in the precarious foundations of houses installed very close to the stream and historical reports of fatalities caused by the force of the water during flash flood events.
The Vila São José neighborhood includes risk sectors 55, 117, and 118, where a total population of 1,240 people and 310 buildings occupy 9 hectares. This area presents high socioeconomic vulnerability, including some of the lowest average incomes and highest illiteracy rates among the studied sectors. The risks are associated with mass movements and flash floods, intensified by disordered occupation on steep slopes and fragile building standards.
In the Partenon neighborhood, risk sectors 105 (R3) and 106 (R4) contain a resident population of 680 people and 170 buildings within a 4-hectare area. The risk in these sectors is primarily linked to mass movement processes, specifically rockfalls, which have been documented near residential structures.
Finally, the Jardim Carvalho neighborhood encompasses risk sectors 90, 91, 92, 94, and 95, covering an area of approximately 20 hectares. This location has a total resident population of 4,000 people living in 1,000 buildings. The predominant risks are associated with mass movements and flash floods, where disordered occupation on steep slopes has led to precarious foundation structures currently affected by soil erosion.
2.3 Prioritization index
The case study was used to test the criteria in a decision-making scenario in which one area must be prioritized for a mitigation project. For that, Equation 1 below was used:
Where:
P is the prioritization index of the phenomenon (p) in each area (a);
W is the normalized weight of a given criterion (i) of a given phenomenon (f); and
I is the normalized indicator of a given criterion (i) of a given phenomenon (f) in each area (a).
The data on the weights are from the AHP phase described above.
While the criteria value is derived from AHP calculations, the indicators come from different sources, depending on the criteria. Table 4 presents the main indicators collected in the areas visited in the case study.
The indicators' data were obtained from municipal databases, from the Brazilian Institute of Geography and Statistics (IBGE), from SGB-CPRM reports, from Porto Alegre’s Risk Reduction Municipal Plan’s reports, and from empirical observations made in several visits to those areas. All indicators were normalized to the worst-case scenario in the sample.
3 Results and discussion
3.1 Prioritization dimensions
The first findings of the study are about the prioritization dimensions and their weights, which are the most important members of the proposed approach, serving as a guide to further index calculations. The dimensions meet the principles of multidisciplinary, encompassing the physical, economic, social, and infrastructure faces involving sustainable and resilient disaster risk management (Anelli; Tajani; Ranieri, 2022; Zhang et al., 2020).
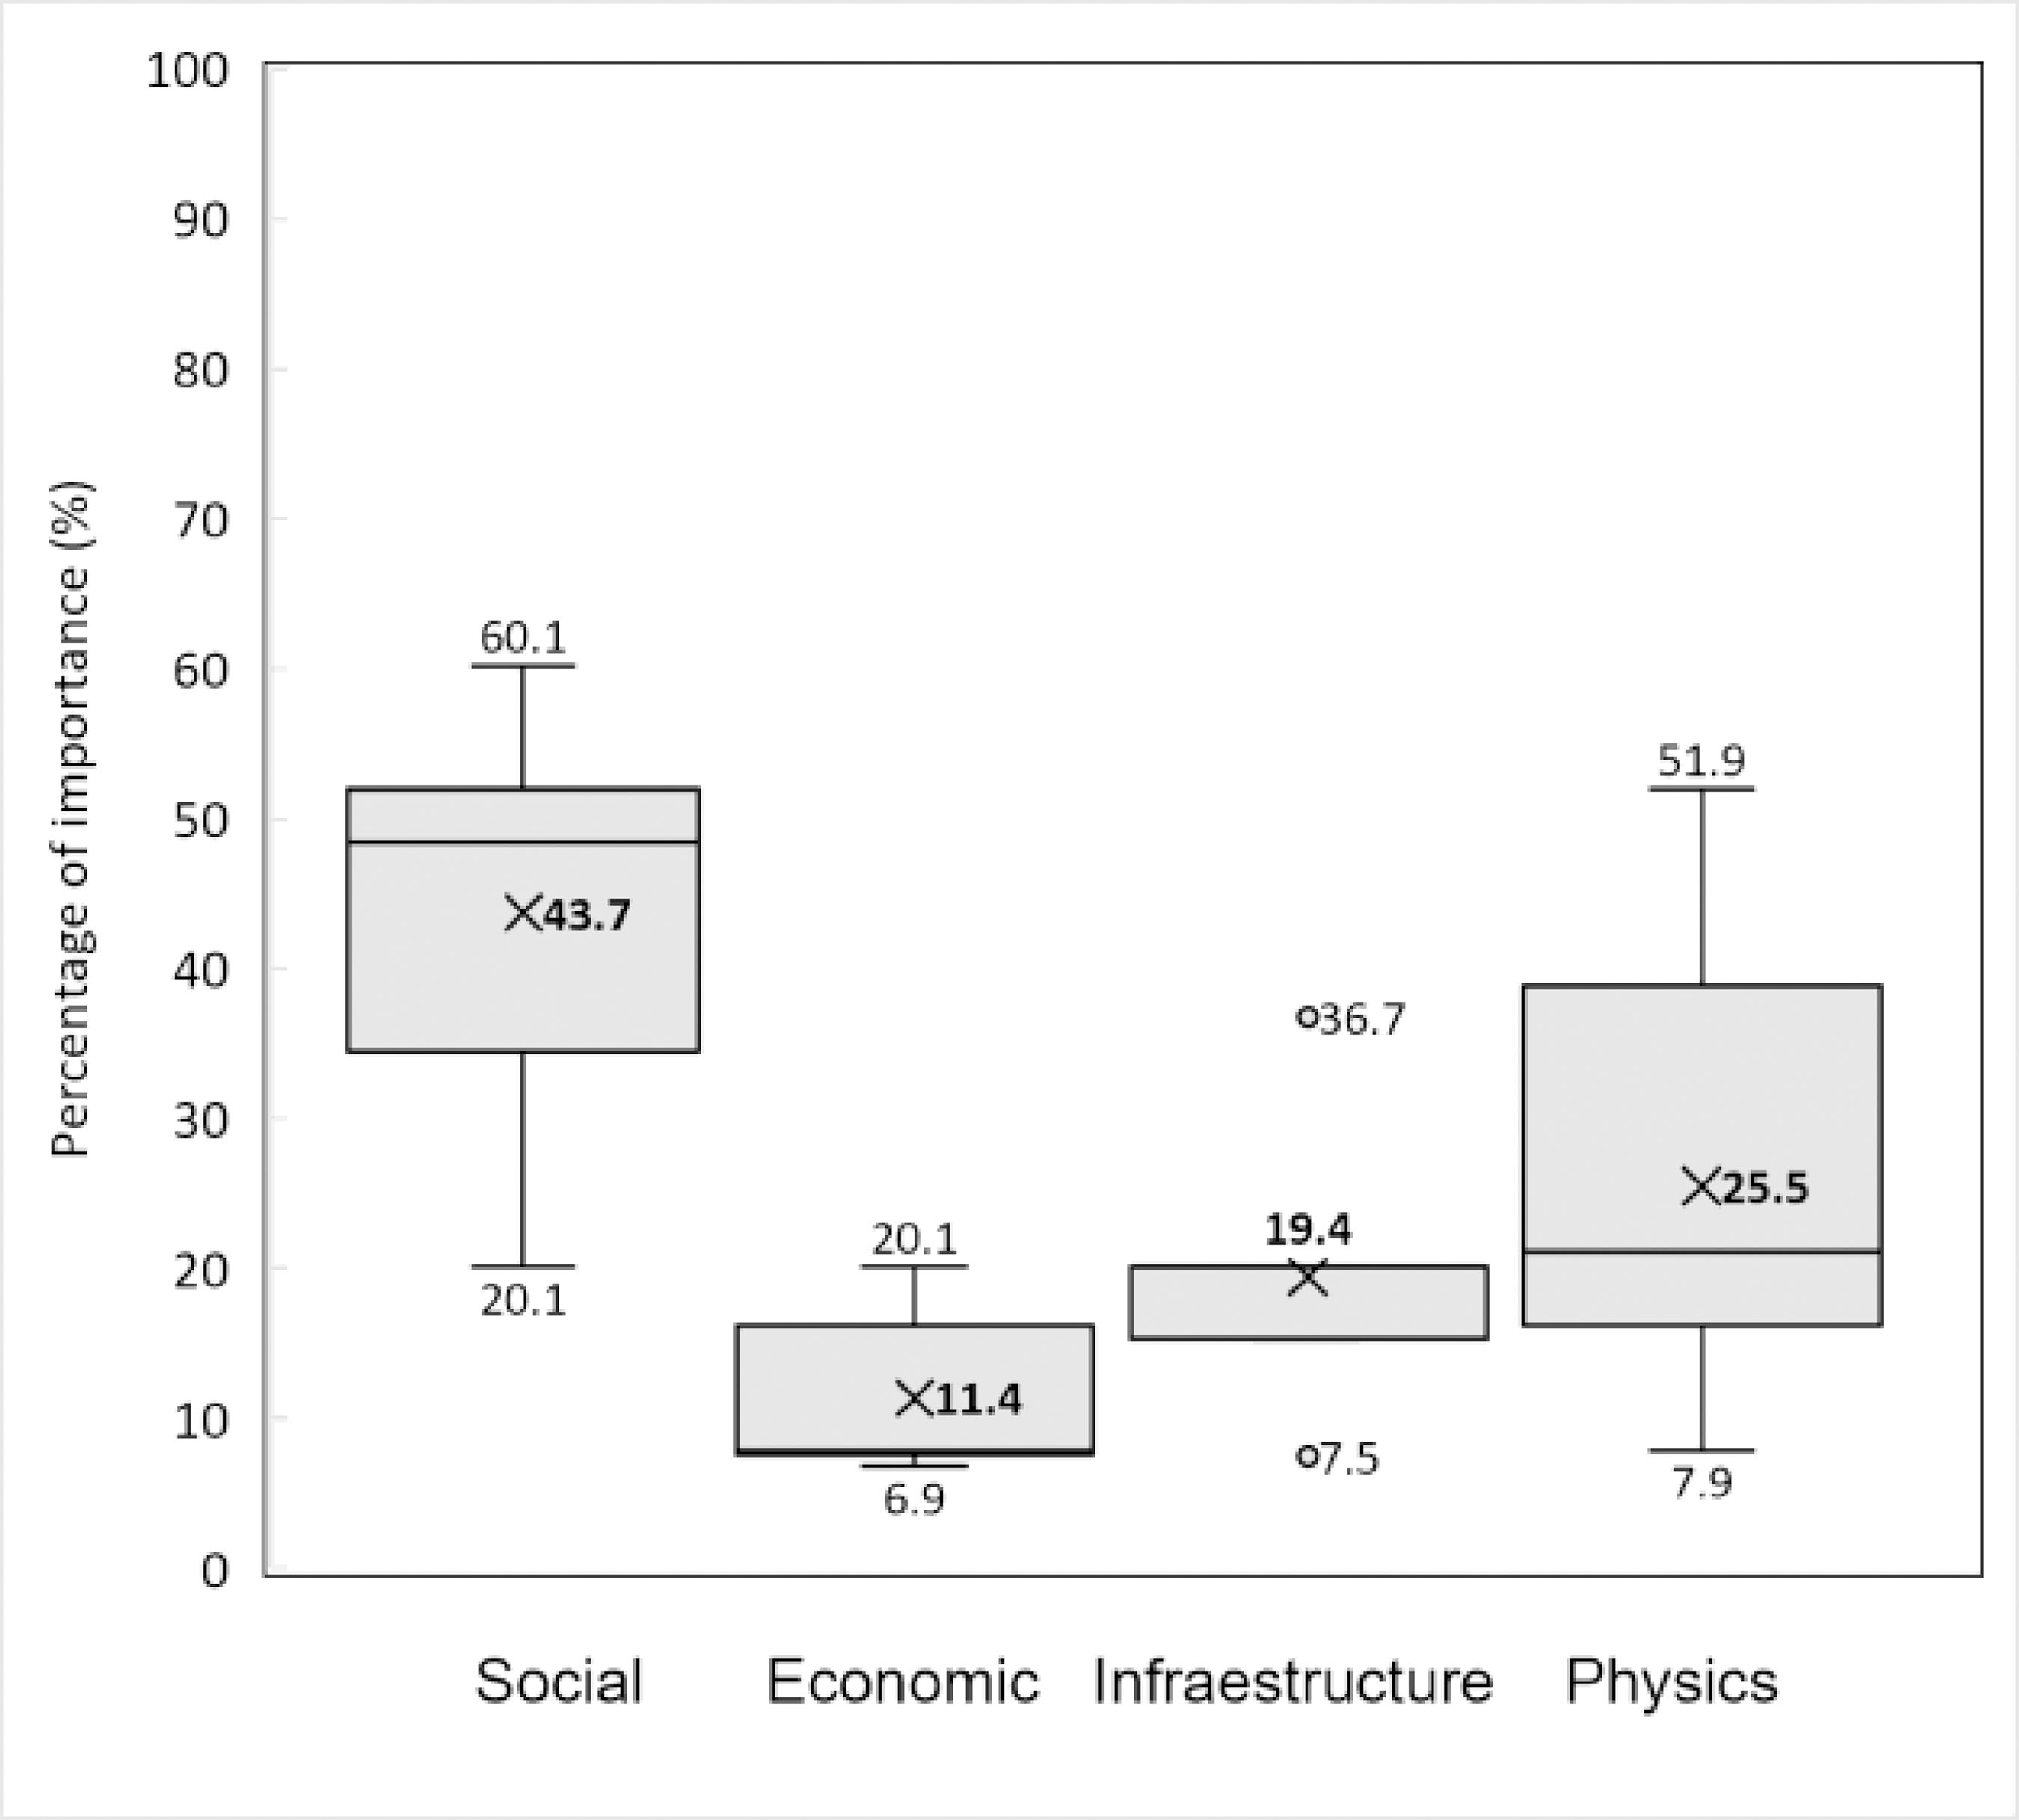
As can be seen in Figure 3, the social dimensions were attributed to the experts as the most important dimensions compared to the others, gained 43.7% of importance. Social factors such as income levels, education, and community organization significantly affect disaster outcomes. Vulnerable populations, such as those in peripheral areas with low income and inadequate infrastructure, are disproportionately affected by disasters, being strongly interwoven with risk itself (Almeida; Welle; Birkmann, 2016; Martins et al., 2024). This result showed that the prioritization of a risk area is strongly related to social issues, and the level of importance attributed to the dimension corroborates with the major outcome from the expert’s focus group, which was the agreement about the prioritization approach being centered in prioritize direct human life risk.
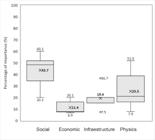
Boxplot representing the dimension’s percentage of importance given by each expert judgment
Furthermore, the social dimension represents the severe damage to human life caused by disasters. In the disaster that occurred in May 2024 in Rio Grande do Sul, there were 183 deaths and more than 580,000 people were displaced (Suarez; Bello; Campbell, 2024). This dimension was considered a key point for assessing the vulnerability conditions of risk areas, since the worst conditions will require the public authorities to adopt more complex, broader, and more costly public policies. This trend can be observed in the risk management literature. Adopting measures to count social vulnerabilities is a way to improve risk planning and management processes. It is necessary to focus on training local agents to improve the risk perception of the population that suffers most from disasters (Alvalá et al., 2024). Moreover, the social dimension is based on the construction of sustainable and resilient cities (UN, 2015a).
The physical dimension had a 25.5% level of importance, close to the weight of the infrastructure dimension at 19.43%. Both assess physical aspects: the first related to the physical conditions of the natural environment, and the second to the conditions of urbanization actions. The physical dimension was considered the second most important dimension by experts, which is related to geodynamics and hydrodynamics of the hazard, such as water depth, flow speed, duration, submerged area, slopes, and rainfall intensity (Kamal et al., 2023; Li et al., 2023). Those dynamics have explicit influence on risk and are related to the infrastructure dimension, especially in the risk areas visited in this study, with poor road infrastructure, low house quality, and high exposure to hazards, where people live very close to hazardous processes. Those conditions were defined as important by the expert group to be considered in the prioritization of risk areas, while many people live in physical and infrastructure conditions that are not good.
Finally, the economic dimension, with lower levels of importance, resulted in 11.4% of the total. The economic dimension is linked to the possible economic impacts of disasters on cities; however, in this scenario, it does not achieve a high level of importance. One way to reduce the impact of disasters is through mitigation, which in turn encompasses social and infrastructure issues (Marchezini et al., 2024). This trend reflects the scenario of increasing disasters in Brazil, while a gap in investments in prevention and risk reduction emerges. These prevention investments are more effective in reducing the number of victims and the population directly affected, in addition to lowering economic losses (Silva et al., 2025).
As is reflected in Figure 3, the percentage of importance of each dimension was composed by an average, but they presented different perspectives from each expert, especially in the social and physics dimensions, which have received a large distance from the minimum to the maximum percentage of importance given to the dimension. This reflects the multidisciplinary team of experts that compose the study, such as professionals from social, environmental, and engineering sciences. This brings diverse knowledge and expertise, helping address the complexity of decision-making problems. The inclusion of multiple experts can reduce biases and enhance the objectivity of the decision-making process, which could also be seen in the works of Magalhães et al. (2022) and Zhang et al. (2020).
On the other hand, a multidisciplinary group can present divergences. On this side, the study is limited to the average calculated, which in some cases can not represent the consensus of the expert group. It is recognized that the AHP method can drive diverse judgments, but this represents the real world, and it needs to find a way to reach consensus to better find the best option for decision-making (Dong; Zhü; Cooper, 2017).
3.2 Prioritization criteria
The prioritization criteria selected and weighed by the group of experts are presented in Table 5. The 19 criteria were selected and evaluated for the three types of processes delimited in the study: flash floods, landslides, and floods.
Selected criteria and weights for each dimension separated by flashfloods, landslides, and floods
For the social dimension, the main common point among the criteria is prioritization based on the risk to human life. For all scenarios, the criterion of the possibility of deaths presented the highest score of importance for prioritizing risk areas, according to the experts' perception, demonstrating the criticality of management focused on reducing these indicators (Alvalá et al., 2024; Silva Filho et al., 2017). The indicators for these criteria can be calculated by historical data, as is described by authors Strouth et al. (2025) and Liu, Liu and Gui (2024), using annual deaths and collapsed houses data. At this point, it is very important for municipalities to have that information available to evaluate the prioritization of the risk areas.
A trend was observed in the death probability criteria’s weights: in landslide processes, it was given a higher weight compared to flashfloods and flood processes, which was explained by the experts to express the uncertainty and rapidity about the processes, which are specific characteristics of that type of hazard (GPDEN, 2024; Marchezini et al., 2024).
Social vulnerability also stood out as one of the most important criteria in the proposed approach. That criterion is well-known in risk management and has many ways to be estimated, especially by having robust data coming from the Brazilian Geography and Statistics Institute (IBGE). This data can serve as a robust way to be used in the prioritization approach, indicating information such as incomes, education, and age (Stafford; Abramowitz, 2017).
The relocation needs criterion is also a great component of the social dimension in the prioritization approach. This is a fundamental criterion for prioritization, while it indicates the priority of public policies that can support that need. On the other hand, it is a very difficult criterion to be measured, having many variables to be considered. Relocation is not considered the best option in some cases, but it can be important in post-disaster situations (Ngulube; Tatano; Samaddar, 2024). Ongoing relocation projects should be considered in the prioritization approach to quantify the number of people who will be relocated.
The criteria of total population describe the number of people that can potentially be impacted by a hazardous event, and for that, information from risk mapping is used as a primary data source to define the indicator for the criteria. This highlights the need for the availability of data in municipalities again, starting with updating risk maps containing key information, such as those described above. The criteria also received a high weight from the experts, varying from being higher for the hydrological processes.
For the infrastructure dimension, the criteria raised are related to the quality of infrastructure in the risk area. The impact on essential services is highlighted as the higher weight around the dimensions criteria. That criterion refers to the potential impact on services such as education and healthcare, but they can also be related to other spaces that can be important in disaster situations. The criteria can be quantified by measuring the number of essential services in the risk area.
Regarding the physical dimension, the data collection dynamics differed from the other dimensions. In this case, it is necessary to identify distinct patterns for each type of hazardous process to list the criteria for prioritizing risk areas, since it is known that each process has specific conditions. The highlights are related to the exposure and speed factors of the processes analyzed. In hydrological processes, the flood speed was considered one of the most important criteria.
It can be observed that the criteria of the physical dimension with the highest levels of importance are related to the exposure and speed factors of the processes. The criteria related to exposure, such as distance from the hazard and impact level, were among the criteria with the greatest weight in each scenario analyzed, being the most important criterion for flash floods and mass movements. The speed of the process also stood out in flash flood and flooding processes.
Finally, the economic dimension had the lowest importance ratings. Despite possessing fundamental aspects for prioritizing risk areas and studying the financial viability of mitigation measures, this dimension had less weight compared to the others. In this sense, criteria focused on protecting human lives received more attention than those focused on economic areas. Furthermore, the commitment of public management to improving the resilience of risk areas can lead to less economic damage in the future (Marchezini et al., 2024; Silva et al., 2025). This highlights the importance of considering the social and infrastructure dimensions in sustainable and resilient urban planning focused on disaster risk management.
As was said before, the weights may not reflect other realities when it comes to applying them in a real context scenario. This is the main limitation of the work; the weights were suggested by a group of experts in Porto Alegre, but they can vary in other cities or regions. But, on the other hand, the methodological approach has been presented as being effective, resulting in trends that could be seen in the literature and reflecting the expert group’s perceptions of what prioritization is in risk management.
3.3 Priority areas in Porto Alegre
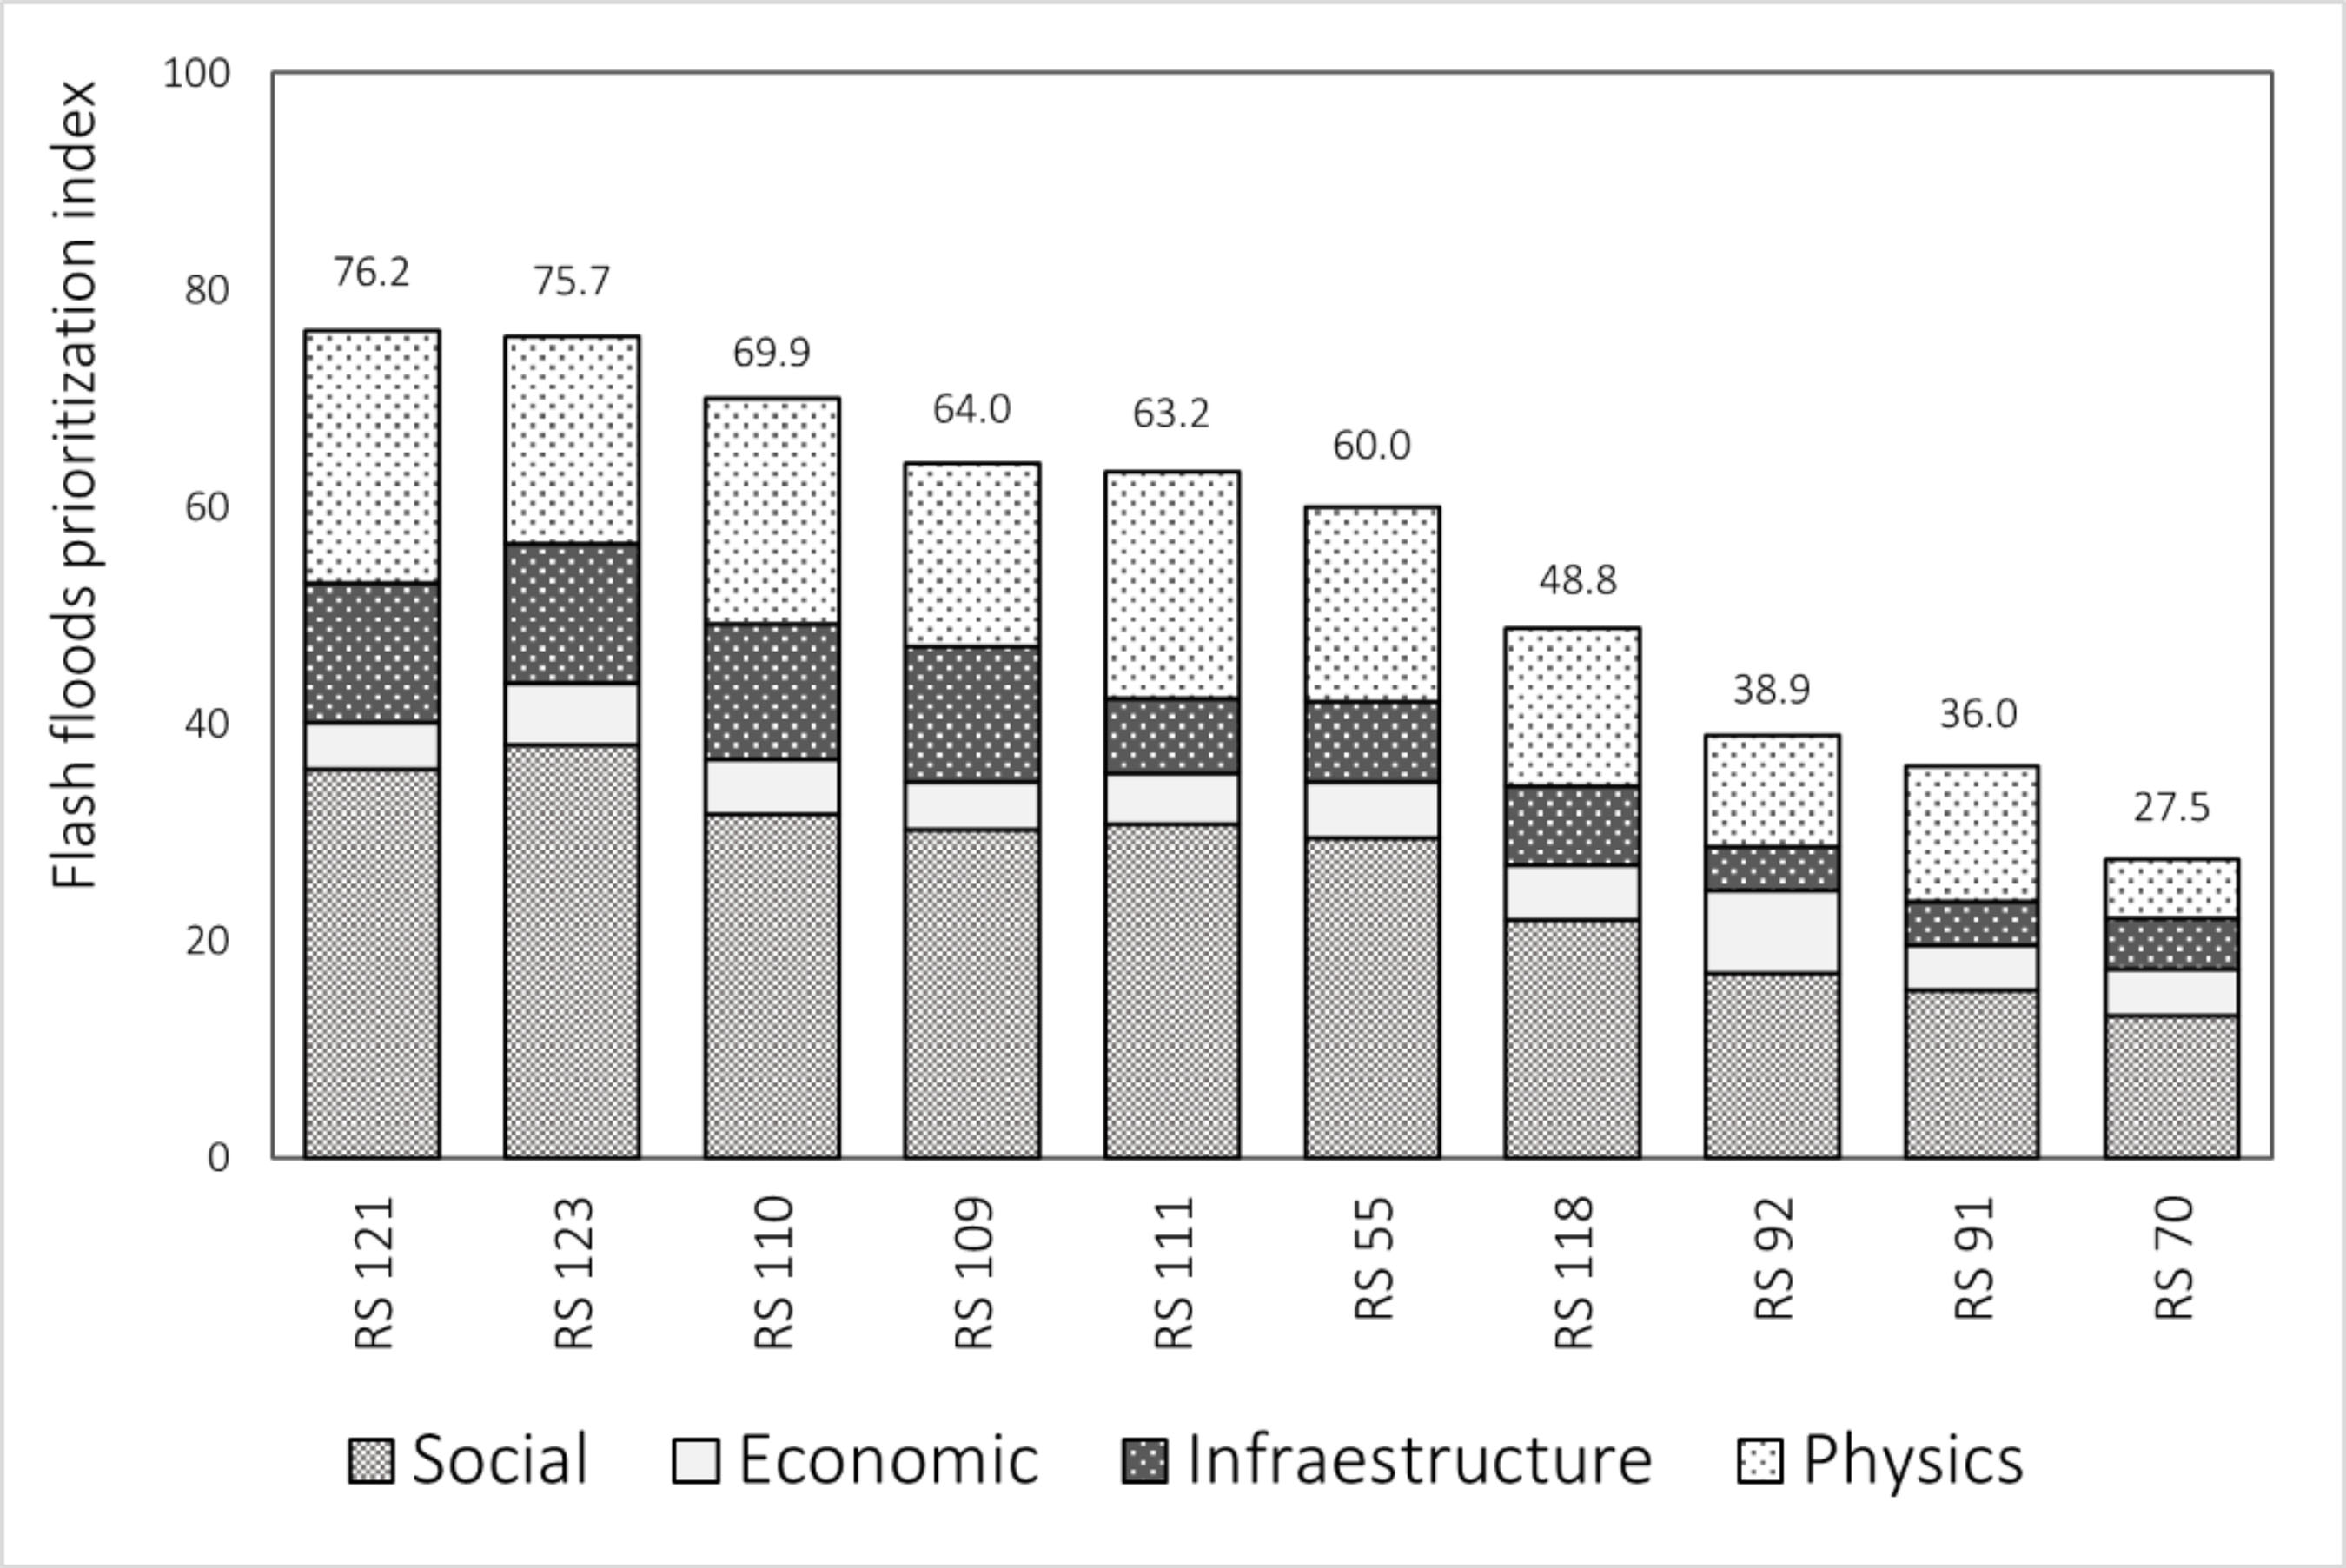
This section presents the application of the prioritization approach in the case study in Porto Alegre. Figure 4 presents the results for the priority risk sector (RS) for the areas affected by flash floods. It is observed that risk sectors 121 and 123 are the most prioritized, being influenced by physical conditions of the Arroio Moinho river and critical social vulnerability indicators, in addition to having prior occurrences that resulted in deaths from such events. Furthermore, the Arroio Moinho risk sectors have the largest potential impacted population, suggesting that the social impact could be on a larger scale if a mitigation project were implemented.
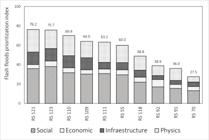
Sectors 110, 109, and 111, from the Bom Jesus neighborhood in Porto Alegre, follow next. These sectors possess similar social characteristics, having close scores in the social dimension. What varies the most are the physical issues, causing sector 110 to have a higher index. The sectors in the Bom Jesus neighborhood are critical locations for flash flood processes and are in a state of social vulnerability. Issues such as infrastructure directly impact the sectors, especially the quality of buildings and road access.
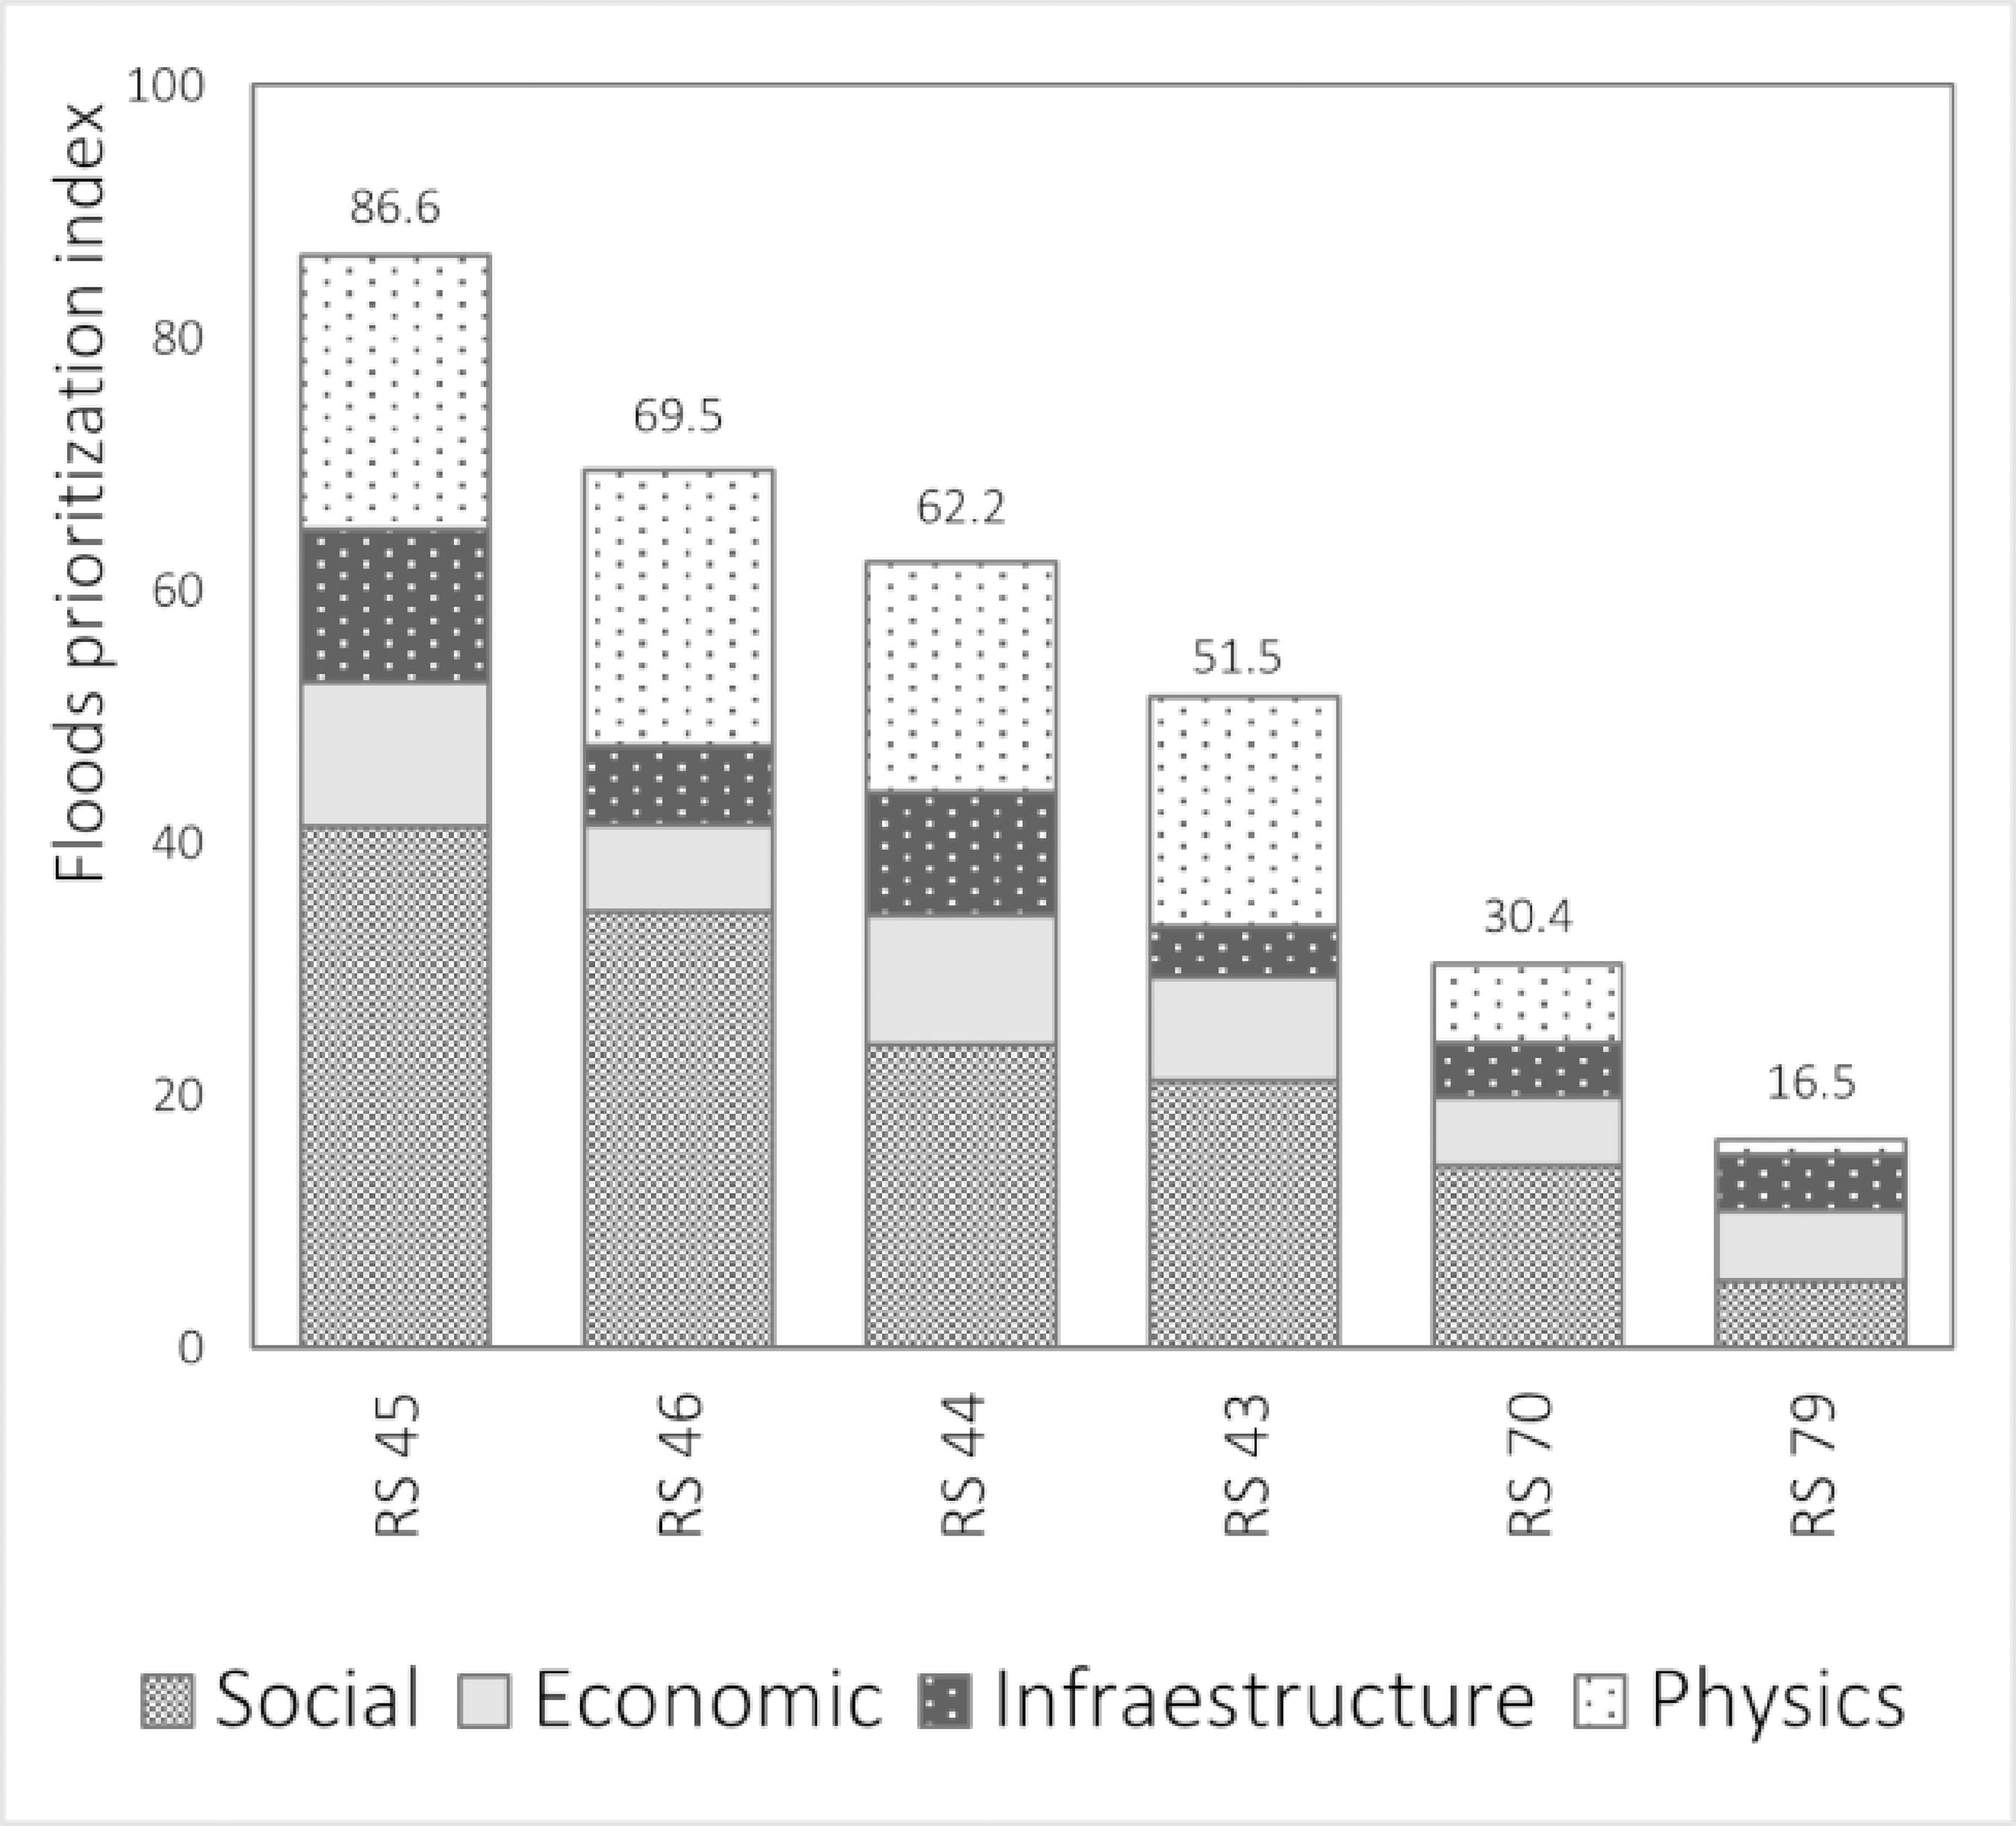
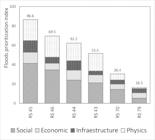
Figure 5 presents the priority risk sectors of the case study for flood processes in Porto Alegre. The sector with the highest index is sector 45, followed by sectors 46, 44, and 43, all located in the Ilha dos Marinheiros neighborhood, which is in the archipelago area of the city. These sectors presented higher indices compared to sectors 67 and 70 in the Rubem Berta neighborhood. The Ilha dos Marinheiros region is characterized by its social, economic, and infrastructural vulnerability, which was reflected in the indices of results. These sectors were heavily hit by the May 2024 flood, reaching the city's highest water levels and covering the sectors in their entirety. The prioritization of this area is strongly linked to social and physical issues. As mentioned, it is a region that lacks public policies aimed at improving social conditions, and physical aspects intensify the risk due to the area's location on the banks of the Guaíba lake, subject to high flood levels and strong currents.
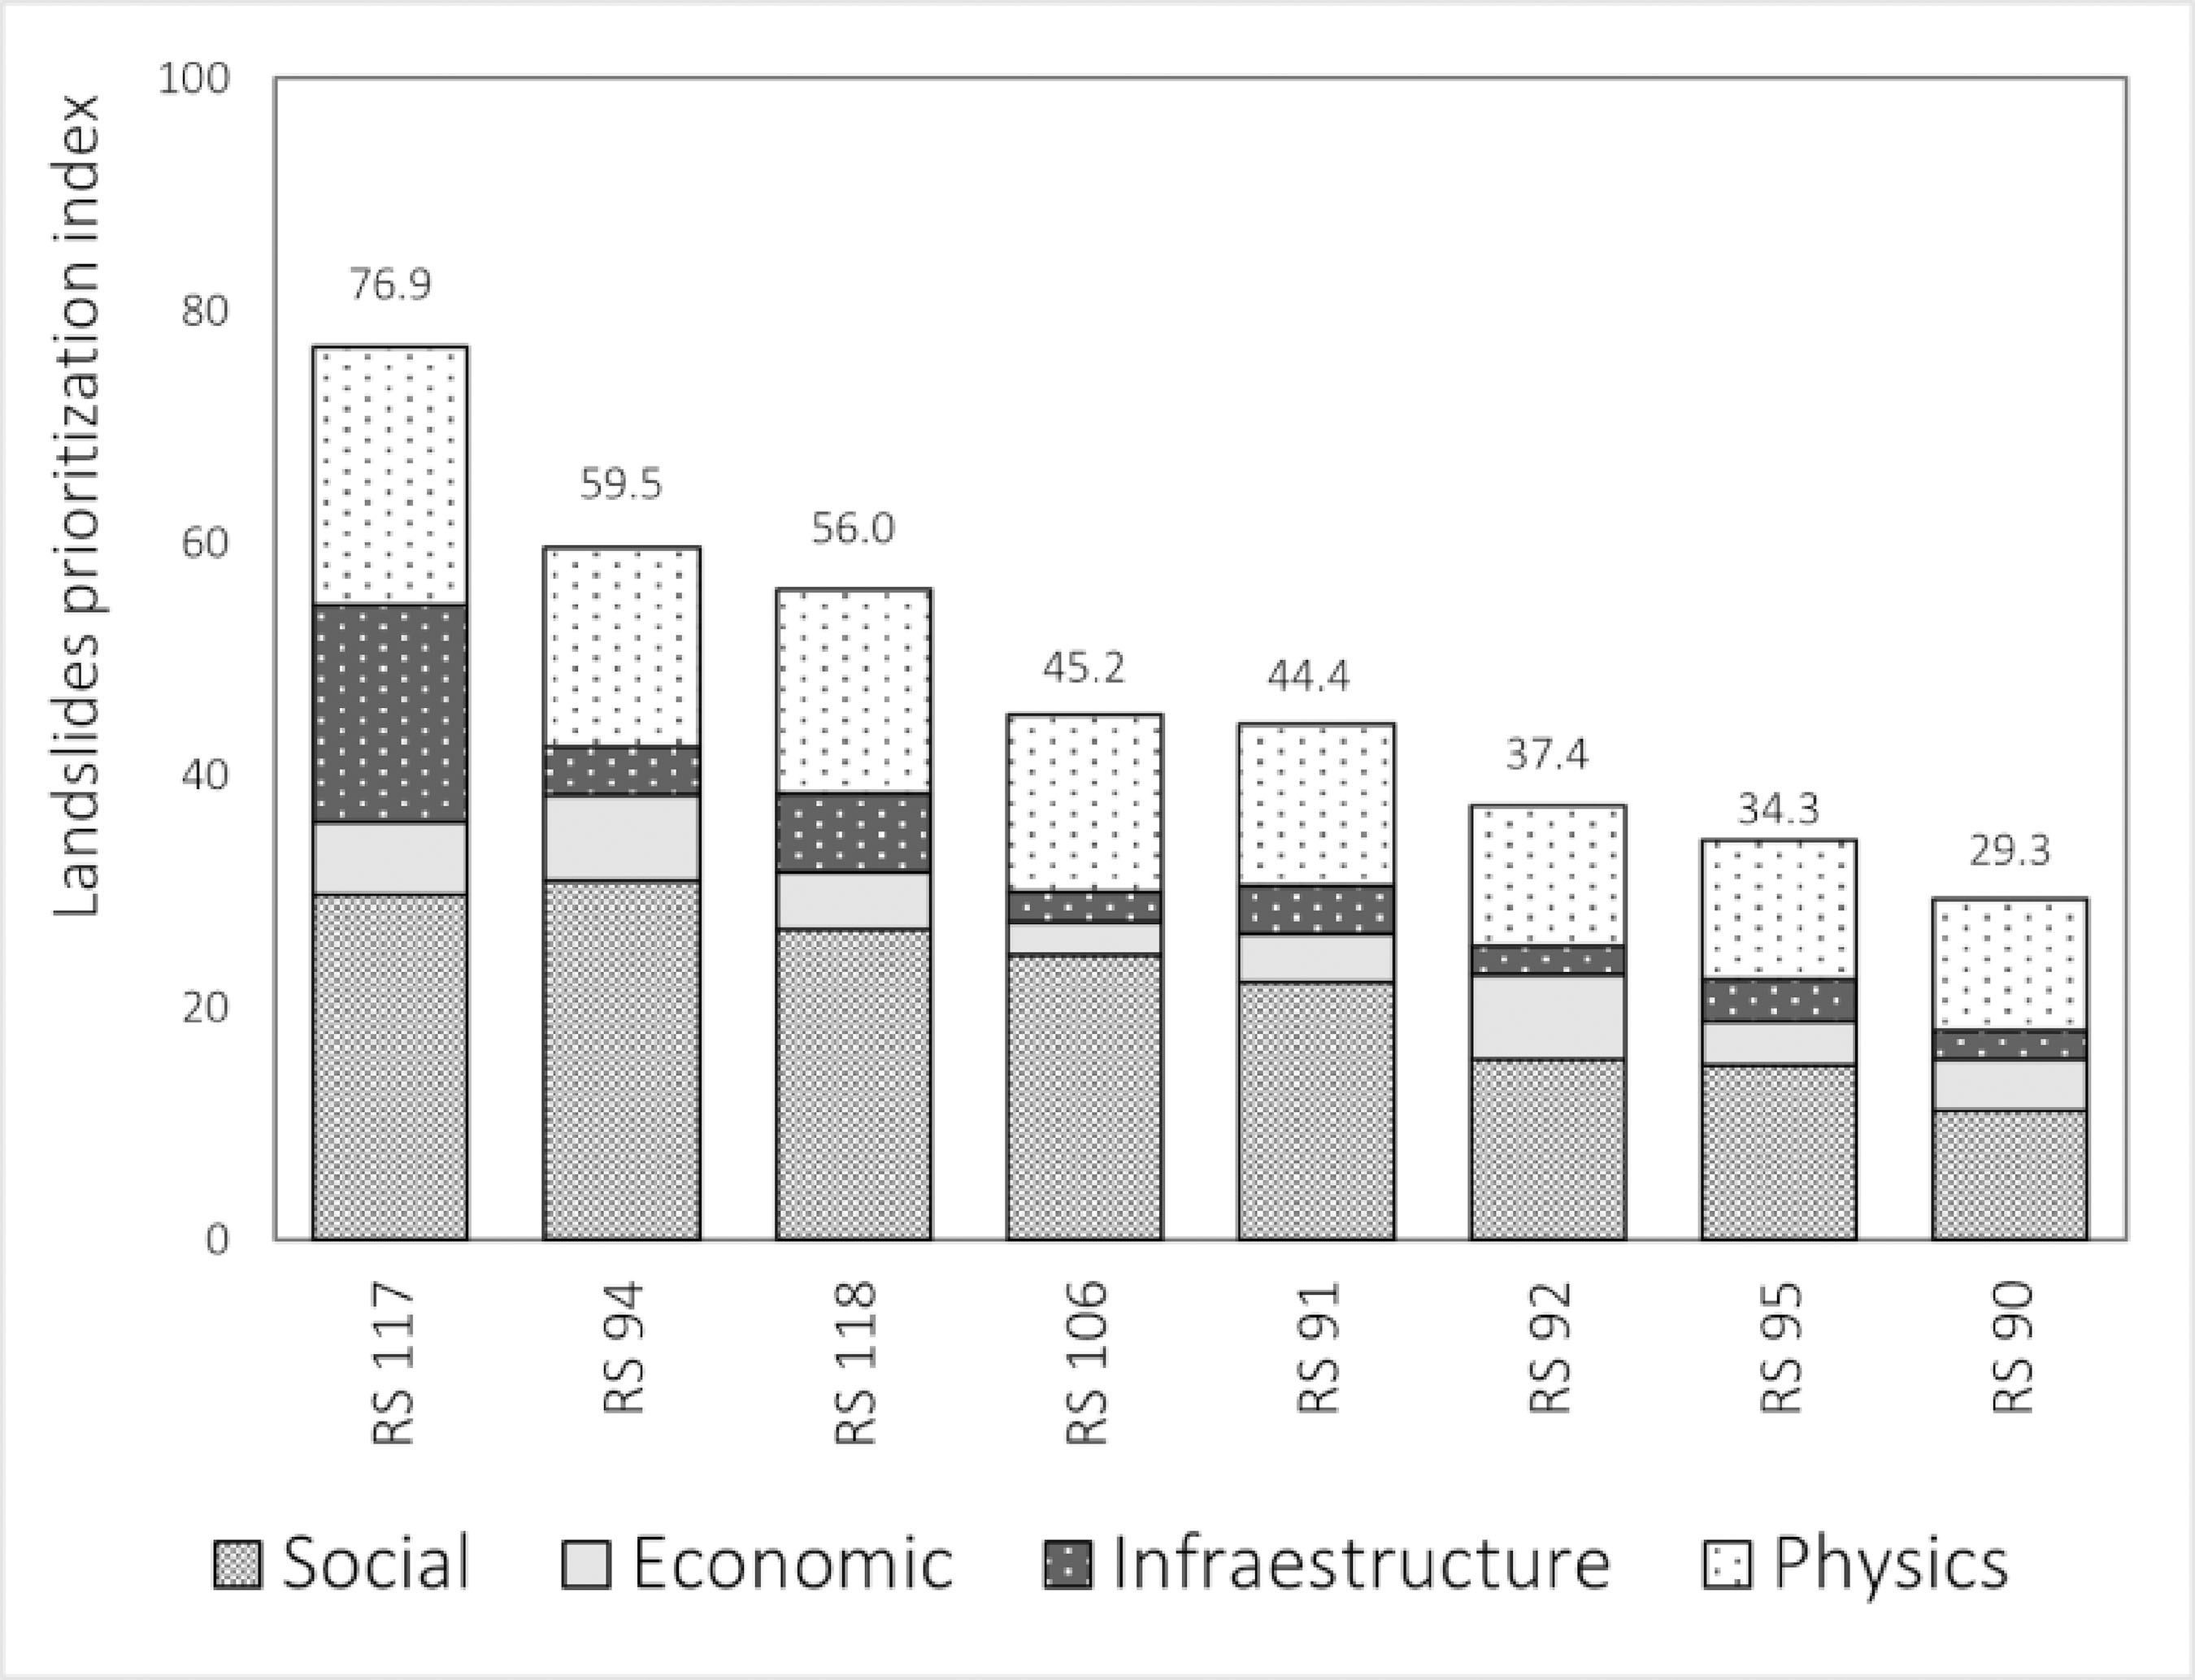
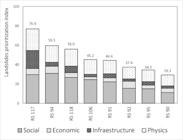
Regarding hazardous landslide processes, Figure 6 presents the resulting priority indices for the risk sectors analyzed in the case study. The sectors that presented the highest scores are sector 117, standing out as the highest score, followed by sector 94 and sector 118. Sectors 117 and 118 are in the same neighborhood called Vila São José, and Sector 94 is from the Jardim Carvalho neighborhood. Both sectors located in the Vila São José neighborhood are characterized by extreme social vulnerability, with high indices for prioritization. Sector 94 of the Jardim Carvalho neighborhood is also highlighted. These sectors share several common characteristics, such as the socioeconomic vulnerability of the population, disordered occupation, and precarious installations on steep slopes. These indicators led these sectors to yield the highest prioritization indices.
The results obtained demonstrate the applicability of the prioritization approach. The results can be used to guide public policies to improve community and infrastructure resilience of the higher indexes. The results can also be used to improve cost-benefit analysis of disaster mitigation projects to be implemented in the city, considering the higher indexes to conclude the bigger benefits, impacting more people and improving more problems related to infrastructure and social issues. That fits with the guidelines for implementing municipal risk reduction plans of the Brazilian Ministry of Cities, which has great importance for prioritizing areas for public investments (Ministério das Cidades, 2023).
3.4 Discussion and implications of the approach
For the proposed prioritization approach, different phases were adopted to get the results, starting with a focus group with experts to raise criteria, followed by a questionnaire to then apply the AHP to get the dimensions and criteria’s weights. The focus group strategy is an interactive activity that can enhance the choice of priorities and, consequently, improve the decision-making process. That has been applied by other authors, such as Ekmekcioğlu, Koc and Özger (2022) and Munpa et al. (2024), before the AHP judgments application. This is a way to improve dimensions and criteria, adding or changing some of them. This is also a way to find the consensus by group and to align the objectives of the prioritization process.
The criteria raised in the focus group have resulted in a great sample. The social, economic, and infrastructure dimensions have 3 to 4 criteria, while the physics dimensions have 8. It was a consensus by the group that the approach must be robust and avoid redundancies. For that reason, it was decided that having fewer criteria and working with more indicators could be the best option to conduct the study. Other authors who have conducted a focus group followed by an AHP, such as Ekmekcioğlu, Koc and Özger (2022), have worked with 10 criteria along with 2 dimensions, in a study conducted in Turkey (Munpa et al., 2024) have worked with 15 criteria, in Thailand; and (Suriadi et al., 2025) who also conducted a questionnaire with experts, worked with 5 criteria and 16 sub-criteria, in a study in Indonesia.
Along with the studies found in literature, the dimensions and criteria selected vary, but it is found that other studies used the risk to human life and social vulnerability criteria in studies located in Brazil, such as Rosa et al. (2024), indicating the importance of considering that in prioritization approaches in the risk management area. In the physics dimension, Oliveira Lima et al. (2025) also used similar criteria, including slope, distance from the water body, land use, and occupation, in a Brazilian study.
The selection of the criteria depends on the goal of the study, and it is geographically related, due to the many specific characteristics of each place, including the geology, population, and government. This part is the main limitation of the work; the criteria may not be efficiently applied in other cities. It is suggested that the criteria and their weights must be revised and may be changed to best fit the characteristics of each place. In this study, a focus group and a questionnaire were applied to local experts who know about local characteristics.
Another implication regarding how the weights were obtained is that the questionnaire with the expert judgment was conducted after the focus group. The judgments can also be made by a consensus of the group during the focus group, but a significant difference in applying separately is that it can be possible to gain statistical definitions, such as arithmetic or geometric means, providing flexibility in handling diverse opinions (Ossadnik; Schinke; Kaspar, 2016). Uncertainties can also be calculated, and they can be used as a parameter to demonstrate the real-world impact of the decision-making process. This strategy also allows experts to express their opinions independently, which can be beneficial when expertise levels vary significantly, especially in this study, which has experts from different disciplines.
The practical implications of the study, which was tested in the case study risk sectors, suggest that the priority areas have the most critical situations, with high levels of social vulnerability and complexity in hazardous processes. The areas also stood out to have many infrastructure problems. That resulted in the priorities that put those areas as the most important places where mitigation projects must be planned, and public investment must be applied. The results can be used to estimate the cost-benefit of implementing one project, having the largest population that could be impacted, and the most critical infrastructure situations. The approach can be used to the urban planning sector and by policymakers to conduct public policies to improve urban resilience in the priority risk areas.
4 Conclusions
This study aimed to propose and apply a prioritization approach to guide decision-makers and policymakers in applying hydrological-geotechnical disaster mitigation plans. As a result, the social dimension has shown greater relevance in the approach, gaining higher levels of importance. Infrastructure and physical dimensions came after as a medium level of importance and at least the economic dimension. This reflects the higher importance of social issues in disaster risk management in Brazil, where a high proportion of socially vulnerable people live in risk areas.
The key criteria selected by the group of experts as the most important reflect the importance of prioritizing human life in all circumstances, expressed in the death probability criterion level of importance, which has received the highest scores across all criteria. Social vulnerability, relocation need, total number of populations, distance from the hazard, impact on essential services, slope angle, and speed are also highly significant criteria in the proposed approach, which intensifies the importance of prioritizing areas with a higher chance of impacting people directly.
The application of the approach in Porto Alegre’s risk areas using local indicators, in addition to the result of practical information for the city and the municipal risk reduction plan, has presented the applicability of the approach. In this sense, the results showed that the prioritized areas are the most socioeconomically vulnerable in the city and have the most prior climate events that impacted the population. Based on that, in a decision-making scenario, it can be concluded that the prioritization multi-criteria approach can guide the government decision-makers in prioritizing actions in the most critical areas based on local data. This highlights the urgent need for municipalities to update databases of the risk areas of the city.
Despite the approach having proven to be effective, there are limitations regarding applicability in other places, especially because the criteria were selected and weighed in the context of Porto Alegre, which cannot reflect the reality of other cities. The hazardous processes and the criteria weights must be reconsidered in different scenarios, along with uncertainties about the weights, which are suggestions for future work.
-
Declaration of Generative AI and AI-Assisted Technologies in the Writing Process
During the preparation of this work, the authors used Grammarly EDU to improve the English grammar, syntax, and readability of the manuscript. After using this tool, the authors reviewed and edited the content as needed and takes full responsibility for the content of the publication.
-
Financial Support
The authors acknowledge support from the Brazilian Ministry of Cities (MCID), through the National Secretariat of Peripheries (SNP) as a part of the Municipal Risk Reduction Plan of Porto Alegre project. The participation of A.P is sponsored by CNPq through the research fellowships PQ 2021 [grant number 310208/2021–1]. The authors also thank the support by CAPES.
-
BACH, A. H.; BRESSANI, L. A.; PASSUELLO, A. C. B. Risk areas prioritization approach to support disaster management: a case study in Porto Alegre, Brazil. Ambiente Construído, Porto Alegre, v. 26, e154560, jan./dez. 2026. ISSN 1678-8621 Associação Nacional de Tecnologia do Ambiente Construído. http://dx.doi.org/10.1590/s1678-86212026000100995
Data Availability Statement
The data supporting the findings of this study will be made available on reasonable request from the corresponding authors.
References
- AGHAKOUCHAK, A. et al. Climate extremes and compound hazards in a warming world. Annual Review of Earth and Planetary Sciences, v. 48, n. 1, p. 519–548, may 2020.
- ALMEIDA, L. Q. de; WELLE, T.; BIRKMANN, J. Disaster risk indicators in Brazil: a proposal based on the world risk index. International Journal of Disaster Risk Reduction, v. 17, p. 251–272, ago. 2016.
- ALVALÁ, R. C. S. et al. Analysis of the hydrological disaster occurred in the state of Rio Grande do Sul, Brazil in September 2023: Vulnerabilities and risk management capabilities. International Journal of Disaster Risk Reduction, v. 110, 104645, 2024.
- ANELLI, D.; TAJANI, F.; RANIERI, R. Urban resilience against natural disasters: mapping the risk with an innovative indicators-based assessment approach. Journal of Cleaner Production, v. 371, p. 133496, out. 2022.
- ASSIS, J. E. de S. et al. Uso da matriz gut como ferramenta voltada para o planejamento estratégico de ações voltadas para a Gestão De Risco De Desastres (GRD). Revista de Arquitetura IMED, v. 13, n. 2, p. 1, dez. 2024.
- BACH, A. H.; PASSUELLO, A. C. B.; BRESSANI, L. A. Critérios para priorização de áreas de risco na gestão de desastres hidrológico-geotécnicos. In: ENCONTRO LATINO-AMERICANO E EUROPEU SOBRE EDIFICAÇÕES E COMUNIDADES SUSTENTÁVEIS, 6., Rio de Janeiro, 2025. Anais [...] Rio de Janeiro, 2025.
- BELLETTINI, A. da S. et al. Setorização de áreas de risco geológico: Porto Alegre, Rio Grande do Sul. Porto Alegre: SGB-CPRM, 2022.
- BRESSANI, L. A. Gestão de riscos: conceitos e instrumentos, casos e aprendizados. Apresentado na Oficina Técnica PMRR Porto Alegre, Porto Alegre, 2024.
- CHRISTOPLOS, I. et al The evolving local social contract for managing climate and disaster risk in Vietnam. Disasters, v. 41, n. 3, p. 448–467, jul. 2017.
- DONG, Q.; ZHÜ, K.; COOPER, O. Gaining consensus in a moderated group: a model with a twofold feedback mechanism. Expert Systems with Applications, v. 71, p. 87–97, abr. 2017.
- EKMEKCIOĞLU, Ö.; KOC, K.; ÖZGER, M. Towards flood risk mapping based on multi-tiered decision making in a densely urbanized metropolitan city of Istanbul. Sustainable Cities and Society, v. 80, p. 103759, may 2022.
- FERENTZ, L. M. da S.; GARCIAS, C. M. State capacity in risk and disaster management after the national policy of protection and civil defense (Law 12.608/2012). Revista Brasileira de Políticas Publicas, v. 10, n. 1, p. 245–267, 2020.
- SILVA FILHO, L. C. P. da S. et al Mapeamento de vulnerabilidades em áreas suscetíveis a deslizamentos e inundações de oito municípios do RS. In: CONGRESSO BRASILEIRO DE GEOLOGIA DE ENGENHARIA E AMBIENTAL, 15., Bento Gonçalves, 2017. Anais [...] Bento Gonçalves, 2015.
- GRUPO DE PESQUISA EM DESASTRES NATURAIS. Nota técnica: Sinais da ocorrência de movimentos de massa (escorregamento translacional, escorregamento rotacional e fluxo de detritos). Grupo de Pesquisa em Desastres Naturais do IPH/UFRGS, 2024.
- KAMAL, A. S. M. M. et al Assessing the effectiveness of landslide slope stability by analysing structural mitigation measures and community risk perception. Natural Hazards, v. 117, n. 3, p. 2393–2418, jul. 2023.
- KHADEMI, N.; BEHNIA, K.; SAEDI, R. Using Analytic Hierarchy/Network Process (AHP/ANP) in developing countries: shortcomings and suggestions. The Engineering Economist, v. 59, n. 1, p. 2–29, jan. 2014.
- LANA, J. C. Guia de procedimentos técnicos do Departamento de Gestão Territorial Brasília: Serviço Geológico do Brasil - CPRM, 2021.
- LI, Y. et al. A Multiple model approach for flood forecasting, simulation, and evaluation coupling in zhouqu county. Water, v. 15, n. 24, p. 4246, dez. 2023.
- LIU, Y.; LIU, H.; GUI, G. Research on annual disaster probability risk assessment based on historical disaster big data. In: QIN, C.; ZHOU, H. (org.). INTERNATIONAL CONFERENCE ON IMAGE PROCESSING AND ARTIFICIAL INTELLIGENCE, Suzhou, 2024. Proceedings […] Suzhou: SPIE, 2024.
- MAGALHÃES, R. F. de et al. The risk management tools’role for urban infrastructure resilience building. Urban Climate, v. 46, p. 101296, dez. 2022.
- MALEKI, M. et al. Urban resilience to urbanisation, climate change and natural risk in urban historic areas of developing countries: a systematic review. Advances in Space Research, v. 77, n. 9, p. 8538–8558, may 2026.
- MARCHEZINI, V. et al Capacidades organizacionais de preparação para eventos extremos: glossário transdisciplinar. São José dos Campos: Victor Marchezini, 2024.
- MARTINS, D. P et al. Social vulnerability as support for disaster management: discussions from a method applied in brazil that strengthens the resilience of communities. Social Indicators Research, v. 175, n. 3, p. 1131–1154, dez. 2024.
- MINISTÉRIO DAS CIDADES. Secretaria Nacional de Periferias. Guia PMRR: orientação para elaboração do Plano Municipal de Redução de Risco. Brasília: Ministério das Cidades, 2023.
- MUNPA, P. et al Building a resilient city through sustainable flood risk management: the flood-prone area of Phra Nakhon Sri Ayutthaya, Thailand. Sustainability, v. 16, n. 15, p. 6450, jul. 2024.
- NGULUBE, N. K.; TATANO, H.; SAMADDAR, S. Factors impacting participatory post-disaster relocation and housing reconstruction: the case of Tsholotsho District, Zimbabwe. International Journal of Disaster Risk Science, v. 15, n. 1, p. 58–72, fev. 2024.
- OLIVEIRA LIMA, K. C. et al. Integrated use of the analytical hierarchy process method for mapping areas susceptible to flooding in the urban area in a city in southwest Bahia, Brazil. Journal of South American Earth Sciences, v. 167, p. 105778, dez. 2025.
- OSSADNIK, W.; SCHINKE, S.; KASPAR, R. H. Group aggregation techniques for analytic hierarchy process and analytic network process: a comparative analysis. Group Decision and Negotiation, v. 25, n. 2, p. 421–457, mar. 2016.
- PIRLONE, F.; SPADARO, I.; CANDIA, S. More resilient cities to face higher risks: the case of Genoa. Sustainability, v. 12, n. 12, p. 4825, jun. 2020.
- ROSA, A. G. F. et al A GIS-based multi-criteria approach for identifying areas vulnerable to subsidence in the world’s largest ongoing urban socio-environmental mining disaster. The Extractive Industries and Society, v. 19, p. 101500, set. 2024.
- SAATY, R. W. The analytic hierarchy process: what it is and how it is used. Mathematical Modelling, v. 9, n. 3/5, p. 161–176, 1987.
- SAATY, T. L. The analytic hierarchy process New York: McGraw-Hill, 1980.
- SILVA, L. B. L da; ALENCAR, M. H.; ALMEIDA, A. T. de. A novel spatiotemporal multi-attribute method for assessing flood risks in urban spaces under climate change and demographic scenarios. Sustainable Cities and Society, v. 76, 103501, 2022.
- SILVA, M. A. G. et al. From setback to breakthroughs: the shift in financial investment balance perspectives for disaster risk and management in Brazil. International Journal of Disaster Risk Reduction, v. 119, 2025.
- STAFFORD, S.; ABRAMOWITZ, J. An analysis of methods for identifying social vulnerability to climate change and sea level rise: a case study of Hampton Roads, Virginia. Natural Hazards, v. 85, n. 2, p. 1089–1117, jan. 2017.
- STROUTH, A. et al Landslide life-loss risk quantification based on historical fatalities. Canadian Geotechnical Journal, v. 62, p. 1–18, jan. 2025.
-
SUAREZ, G.; BELLO, O.; CAMPBELL, J. Avaliação dos efeitos e impactos das inundações no Rio Grande do Sul Inter-American Development Bank, 2024. Available: https://doi.org/10.18235/0013254 Access: 30 March 2026.
» https://doi.org/10.18235/0013254 - SURIADI, N. A. et al. Analytical Hierarchy Process (AHP): a strategy to develop disaster resilient tourism priority in Indonesia. Journal of Applied Engineering and Technological Science, v. 6, n. 2, p. 970–983, jun. 2025.
- TAHERDOOST, H.; MADANCHIAN, M. Multi-Criteria Decision Making (MCDM) methods and concepts. Encyclopedia, v. 3, n. 1, p. 77–87, jan. 2023.
-
UNITED NATIONS. Agenda 2030 para o Desenvolvimento Sustentável Organização das Nações Unidas, 2015a. Available: https://sdgs.un.org/2030agenda Access: 30 March 2026.
» https://sdgs.un.org/2030agenda - UNITED NATIONS. Sendai framework for disaster risk reduction 2015-2030 Sendai: Organização das Nações Unidas, 2015b.
- WILDEN, D.; FELDMEYER, D. Measuring knowledge and action changes in the light of urban climate resilience. City and Environment Interactions, v. 10, p. 100060, abr. 2021.
- ZHANG, M. et al. Measuring urban resilience to climate change in three chinese cities. Sustainability, v. 12, n. 22, p. 9735, nov. 2020.
Edited by
-
Editor-in-chief:
Enedir Ghisi
-
Guest editor:
Aline Maria Costa Barroso

 Note: map produced based on CPRM risk areas databases (