Numerical investigation on the global stability of welded high-strength steel columns with flame-cut flange edges under axial compression
Abstract
Existing studies on high-strength steel (HSS) column stability have mainly focused on rolled or conventionally welded members. The effect of flame-cut flanges and the associated residual stress distributions on the global buckling resistance of welded I-shaped sections remains insufficiently quantified in current design standards. This study investigates the global buckling behavior of welded HSS I-section columns with flame-cut flanges under axial compression using finite element analysis accounting for geometric and material nonlinearities, residual stresses, and initial imperfections. Parametric studies were conducted on 460 MPa and 690 MPa steel columns across a range of slenderness ratios and cross-sectional dimensions. A comparison between the obtained results and the ANSI/AISC 360-16 and EN 1993-1-1 curves shows that EN 1993-1-1 predictions are generally conservative, while the AISC curve agrees well for normalized slenderness up to 1.5, though it overestimates minor-axis buckling capacity for 460 MPa columns. Three new design curves were calibrated using numerical results, showing improved accuracy in predicting buckling behavior. These findings provide a basis for developing more reliable and less conservative design provisions for HSS columns.
Keywords
Advanced analysis; Global buckling curves; Residual stresses; Welded I-section; High strength steel columns
Resumo
Estudos existentes sobre a estabilidade de pilares de aço de alta resistência (HSS) têm se concentrado principalmente em membros laminados ou soldados por técnicas convencionais. O efeito dos flanges cortados a chama e das distribuições de tensões residuais associadas sobre a resistência global à flambagem de perfis I soldados ainda não está suficientemente quantificado nas normas de projeto atuais. Este estudo investiga o comportamento de flambagem global de pilares HSS de perfis I soldados com flanges cortados a chama sob compressão axial, utilizando análise por elementos finitos que considera não linearidades geométricas e de material, tensões residuais e imperfeições geométricas iniciais. Estudos paramétricos foram realizados em pilares de aço de 460 MPa e 690 MPa, abrangendo diferentes níveis de esbeltez e dimensões de seção transversal. A comparação dos resultados obtidos com as curvas da ANSI/AISC 360-16 e EN 1993-1-1 indica que as previsões do EN 1993-1-1 são geralmente conservadoras, enquanto a curva da AISC apresenta boa concordância para esbeltezas normalizadas até 1,5, embora superestime a capacidade de flambagem no eixo menor para pilares de 460 MPa. Três novas curvas de projeto foram calibradas com base nos resultados numéricos, mostrando maior precisão na previsão do comportamento à flambagem. Estes achados fornecem base para o desenvolvimento de disposições de projeto mais confiáveis e menos conservadoras para colunas HSS.
Palavras-chave
Análise avançada; Curvas de flambagem global; Tensões residuais; Perfil I soldado; Pilares de aço de alta resistência
1 Introduction
High strength steels (HSS), which have a yield strength between 460 MPa and 690 MPa, have proven to be an excellent material for obtaining lighter and slender structures. Nevertheless, compared to conventional steels, HSS exhibits a limited degree of hardening after yielding, and a reduction in its ductility, i.e., with a lower elongation at fracture point (Shi; Chen, 2018; Ma, 2019). These findings suggest that as the steel grade increases, the material becomes less ductile and more prone to strain hardening, which can lead to a decrease in the length of the yield plateau. The decrease in the tensile to yield strength ratio and ductility may have implications for the design and performance of structures fabricated from HSS. Therefore, a concern for several researchers has been the applicability of current standards in the design of elements made of HSS, since the most part of design standards were developed considering mild steels, which usually have nominal yield strength ranging from 235 MPa to 345 MPa (ECCS, 1976; Ziemian, 2010; Simões et al., 2025). As stated by Sun et al. (2021), although the use of HSS in construction is promising, its use is restricted due to the lack of precise standards for projects.
In addition, welded sections composed of HSS have a magnitude and pattern of distribution of residual stresses quite different from those made of mild steels and rolling process. These differences can have significant effects on the mechanical performance of structures (Ma, 2019).
Considering this context, recent research has been carried out in this field with the aim of predicting, with better precision, the behavior of structures manufactured in 690 MPa high strength steel, as the works of Sun, Liang and Zhao (2020), Le et al. (2020), Xiong et al. (2021), Jiang et al. (2019), among others. Studies on steels with nominal yield strength of 460 MPa can be found in Yang et al. (2016, 2018), Deng et al. (2021) and Xiong et al. (2016).
Some of the cited works were especially devoted to the study of residual stresses in welded HSS sections. These stresses are generated during manufacturing processes involving material deformation, heat treatment, machining or processing operations. The intensity and distribution of residual stresses are dependent on the techniques used in the production of steel profiles (welding, rolling or cold forming techniques) and their dimensions. They originate from the non-uniform cooling of the plates that make up the profiles, since the steel is overheated, either by hot rolling, hot cutting of the plates or by electric welding (Fakury; Silva; Caldas, 2016).
A residual stress model widely used in numerical analysis involving welded sections is the one proposed by the European Convention for Constructional Steelwork (ECCS) (1984), which was developed for steel grades S235 and S355. This residual stress pattern is characterized with the tensile residual stress at the weldment equal to the steel yield strength. Nevertheless, some researches have shown that this assumption is not adequate for representing existing residual stresses in HSS welded sections (Li et al., 2020; Schaper et al., 2022).
Although the American steel standard (AISC, 2016) covers steel materials with yield strengths up to 690 MPa, and Eurocode 3 (ECS, 2007) establishes recommendations for extension of the code up to the steel grade S700 (700 MPa), the buckling curves for predicting the resistant capacity of centrally loaded columns were developed based on experimental and analytical studies on mild carbon steels.
Given the limited number of studies assessing the applicability of current standard specifications to the design of high-strength steel (HSS) columns, this study investigates the global buckling behavior of welded I-section columns made from 460 𝑀𝑃𝑎 and 690 𝑀𝑃𝑎 steels with flame-cut flange edges under axial compression, considering buckling about both the major and minor axes. The numerical resistant capacity of the columns obtained by the PPLANLEP software program (Silva et al., 2018; Viana et al., 2020; Machado et al., 2022) is compared to the ones proposed by ANSI/AISC 360-16 (AISC, 2016) and EN 1993-1-1 (ECS, 2005). The analysis performed by the PPLANLEP program considered second-order effects, initial geometric imperfections, residual stresses and material nonlinearity through the distributed plasticity approach.
2 Review on standard buckling curves
The American standard ANSI/AISC 360-16 (AISC, 2016) provides a single buckling curve for any type of cross-section and yield resistance class contemplated by the standard. This is intended to simplify the design process by reducing the number of different curves that need to be considered.
According to this standard, the reduction factor associated with global instability is computed by Equation 1.
in which 𝜆0 is the column non-dimensional slenderness given by Equation 2:
Where:
Leff is effective length of the column;
r is radius of gyration of the section; and
E is the steel modulus of elasticity.
By contrast, in order to account for buckling effects, Eurocode 3 (ECS, 2005) presents five different buckling curves, which are based on theoretical and experimental studies conducted by the European Convention for Constructional Steelwork (ECCS). These curves are labeled as curve a0, a, b, c and d, and they represent different levels of conservatism in the design of steel members. The choice of buckling curve to be used in a particular design depends on the cross-section of the steel member being analyzed.
According to the guidelines of the European standard, the reduction factor associated with global instability can be computed by Equations 3 and 4:
Where:
The imperfection factor 𝛼 is defined after determining which curve among the five existing ones is the most suitable for a given cross section according to the analyzed axis, and also the yield strength class to which the steel belongs. Table 1 shows the values of 𝛼 for each curve.
3 Parametric analysis
This section outlines the parameters adopted in the numerical investigation of HSS welded I-section columns subjected to axial compression. Initially, the finite element (FE) model employed in the simulations is validated against experimental results available in the literature, ensuring the reliability of the numerical framework. Subsequently, a study is conducted to assess the influence of residual stresses and initial geometric imperfections on the structural response of HSS columns. Finally, a comprehensive parametric analysis is presented, focusing on the global buckling behavior of welded I-section columns fabricated from 460 MPa and 690 MPa steels, considering variations in slenderness ratio and cross-sectional dimensions.
3.1 Configuration of the columns and FE mesh
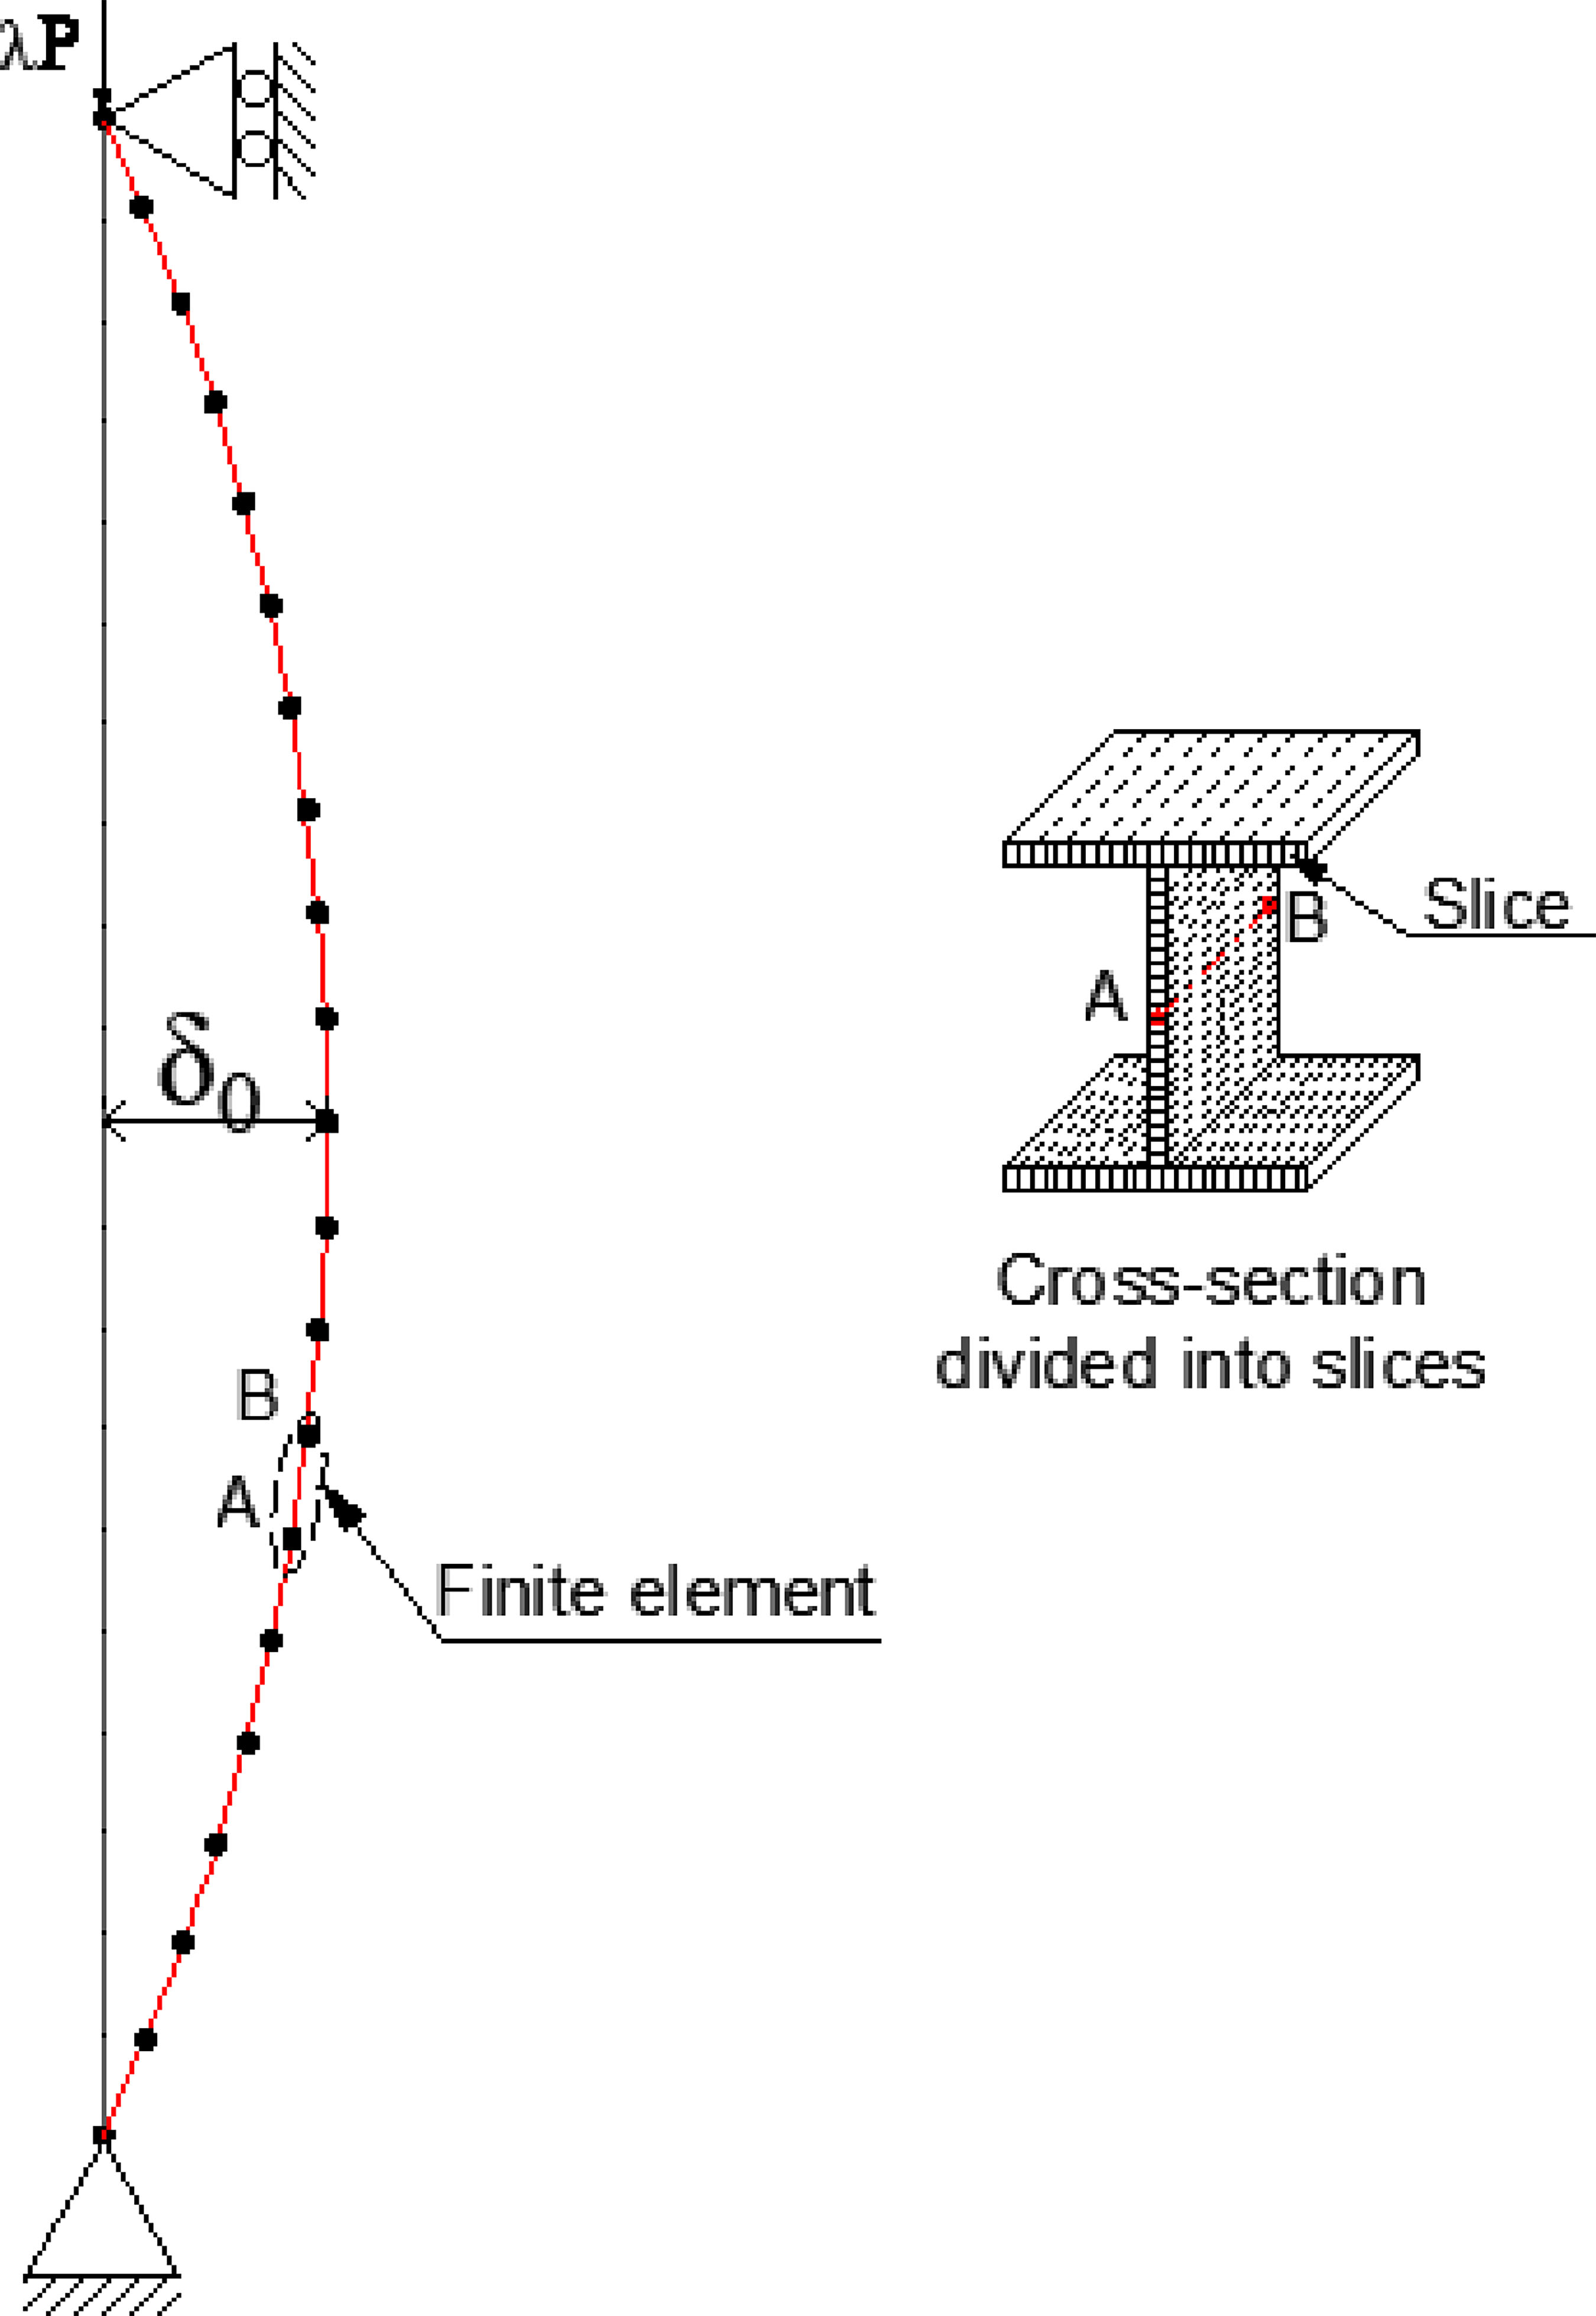
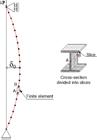
As shown in Figure 1, the columns were modeled with pinned-pinned boundary conditions. For each of the eight cross-sectional profiles listed in Table 2, 11 different lengths were evaluated, covering slenderness ratios from 20 to 200 (specifically: 20, 30, 40, 50, 60, 70, 80, 100, 120, 160 and 200).
In Table 2, 𝐵 denotes the flange width, 𝐻 is the total section height, 𝑡𝑤 and 𝑡𝑓 represent the web and flange thicknesses, respectively, ℎ0 is the distance between the two flanges (i.e., the clear web height), and 𝑏𝑓 corresponds to the flange overhang, defined as half of the difference between the flange width and the web thickness.
To conduct the nonlinear analysis, the structure was discretized into 20 line finite elements, and the cross-section was divided into 68 slices – 23 slices for the flanges and 22 slices for the web. The thickness of the slices along the plates' length was set to 60 mm or less. In total, 528 finite element simulations were carried out to assess the overall buckling behavior of 460 MPa and 690 MPa HSS columns.
3.2 Stress-strain curve for HSS
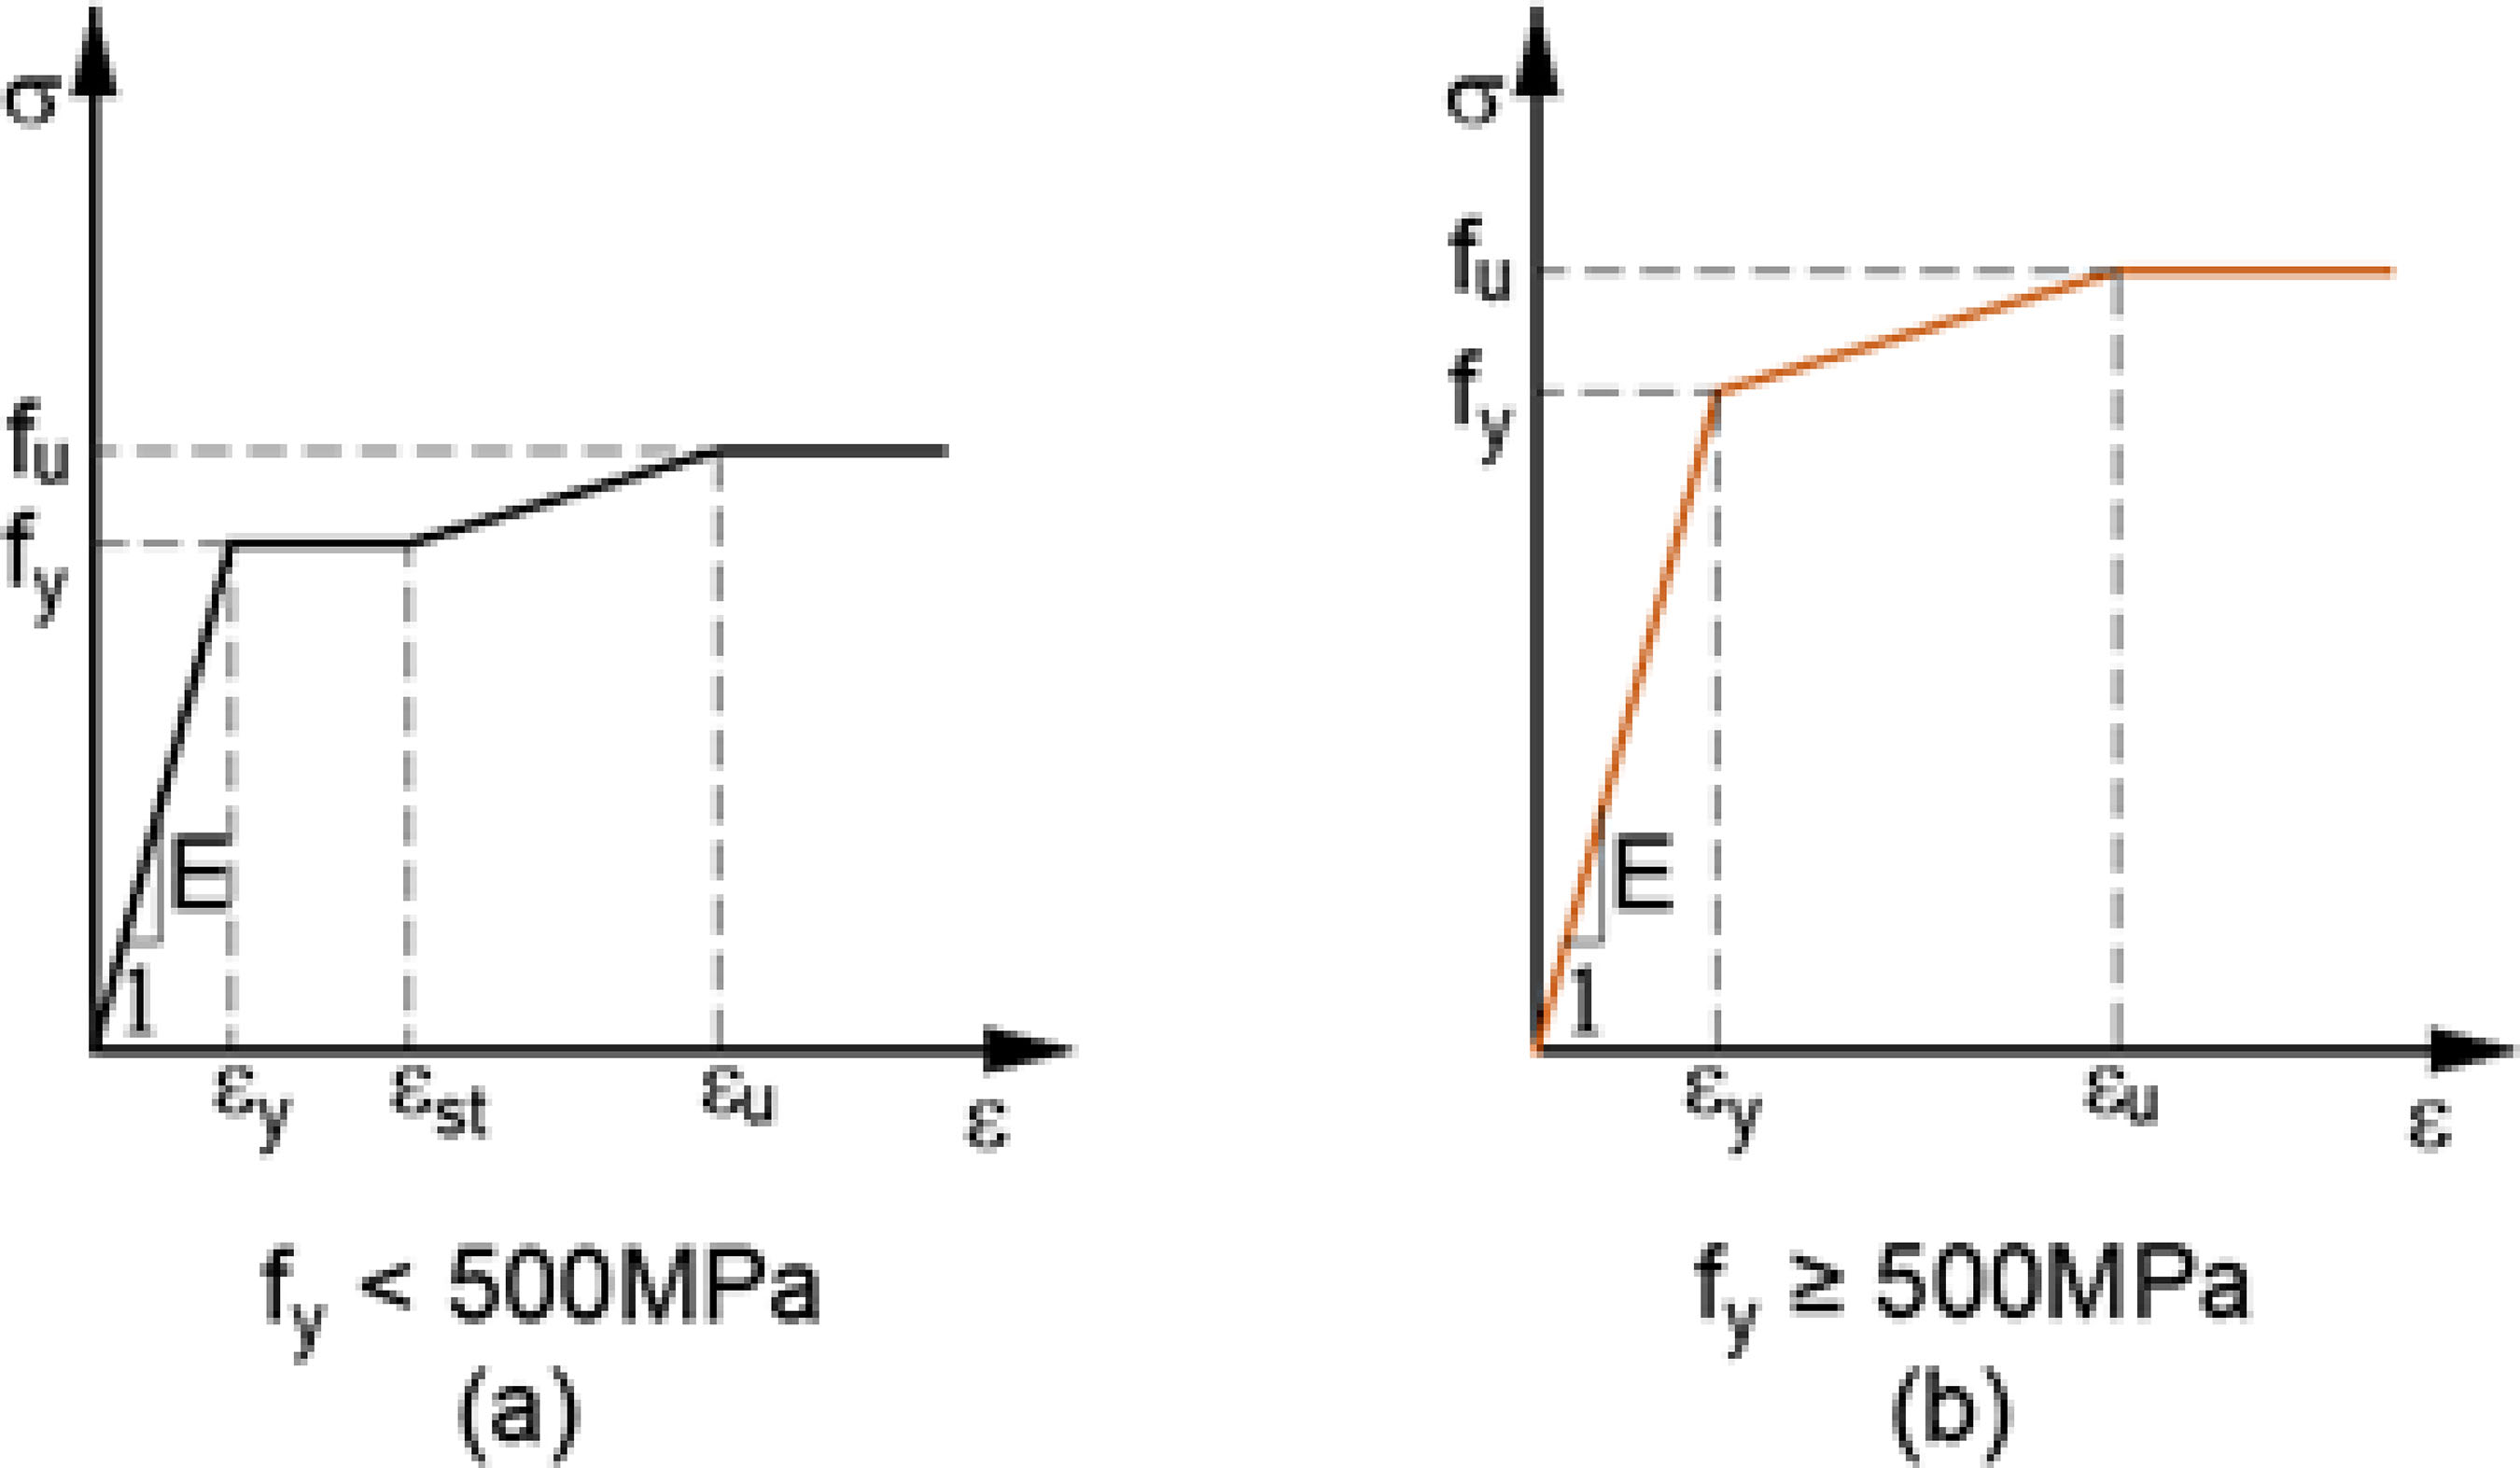
Considering experimental studies, Ban and Shi (2018) proposed the multi-linear stress-strain model shown in Figure 2 to simulate the behavior of high-strength steels subjected to uniaxial stress. For HSS with nominal yield strength below 500 MPa (Figure 2a), a yield plateau is observed in the stress-strain curve. However, this plateau is not present in higher-grade steels with a nominal yield strength of 500 MPa or greater, as illustrated in Figure 2b.
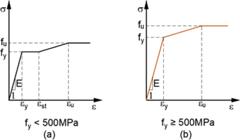
These stress-strain diagrams were applied to the slices of the columns' cross-sections. The material parameters were defined based on Table 3, which includes the yield strain (𝜀𝑦), ultimate strain (𝜀𝑢), yield strength (𝑓𝑦), and ultimate strength (𝑓𝑢). It is important to emphasize that the analysis was stopped in cases where a slice of the cross-section experienced a strain greater than 4%.
3.3 Residual stress distribution pattern
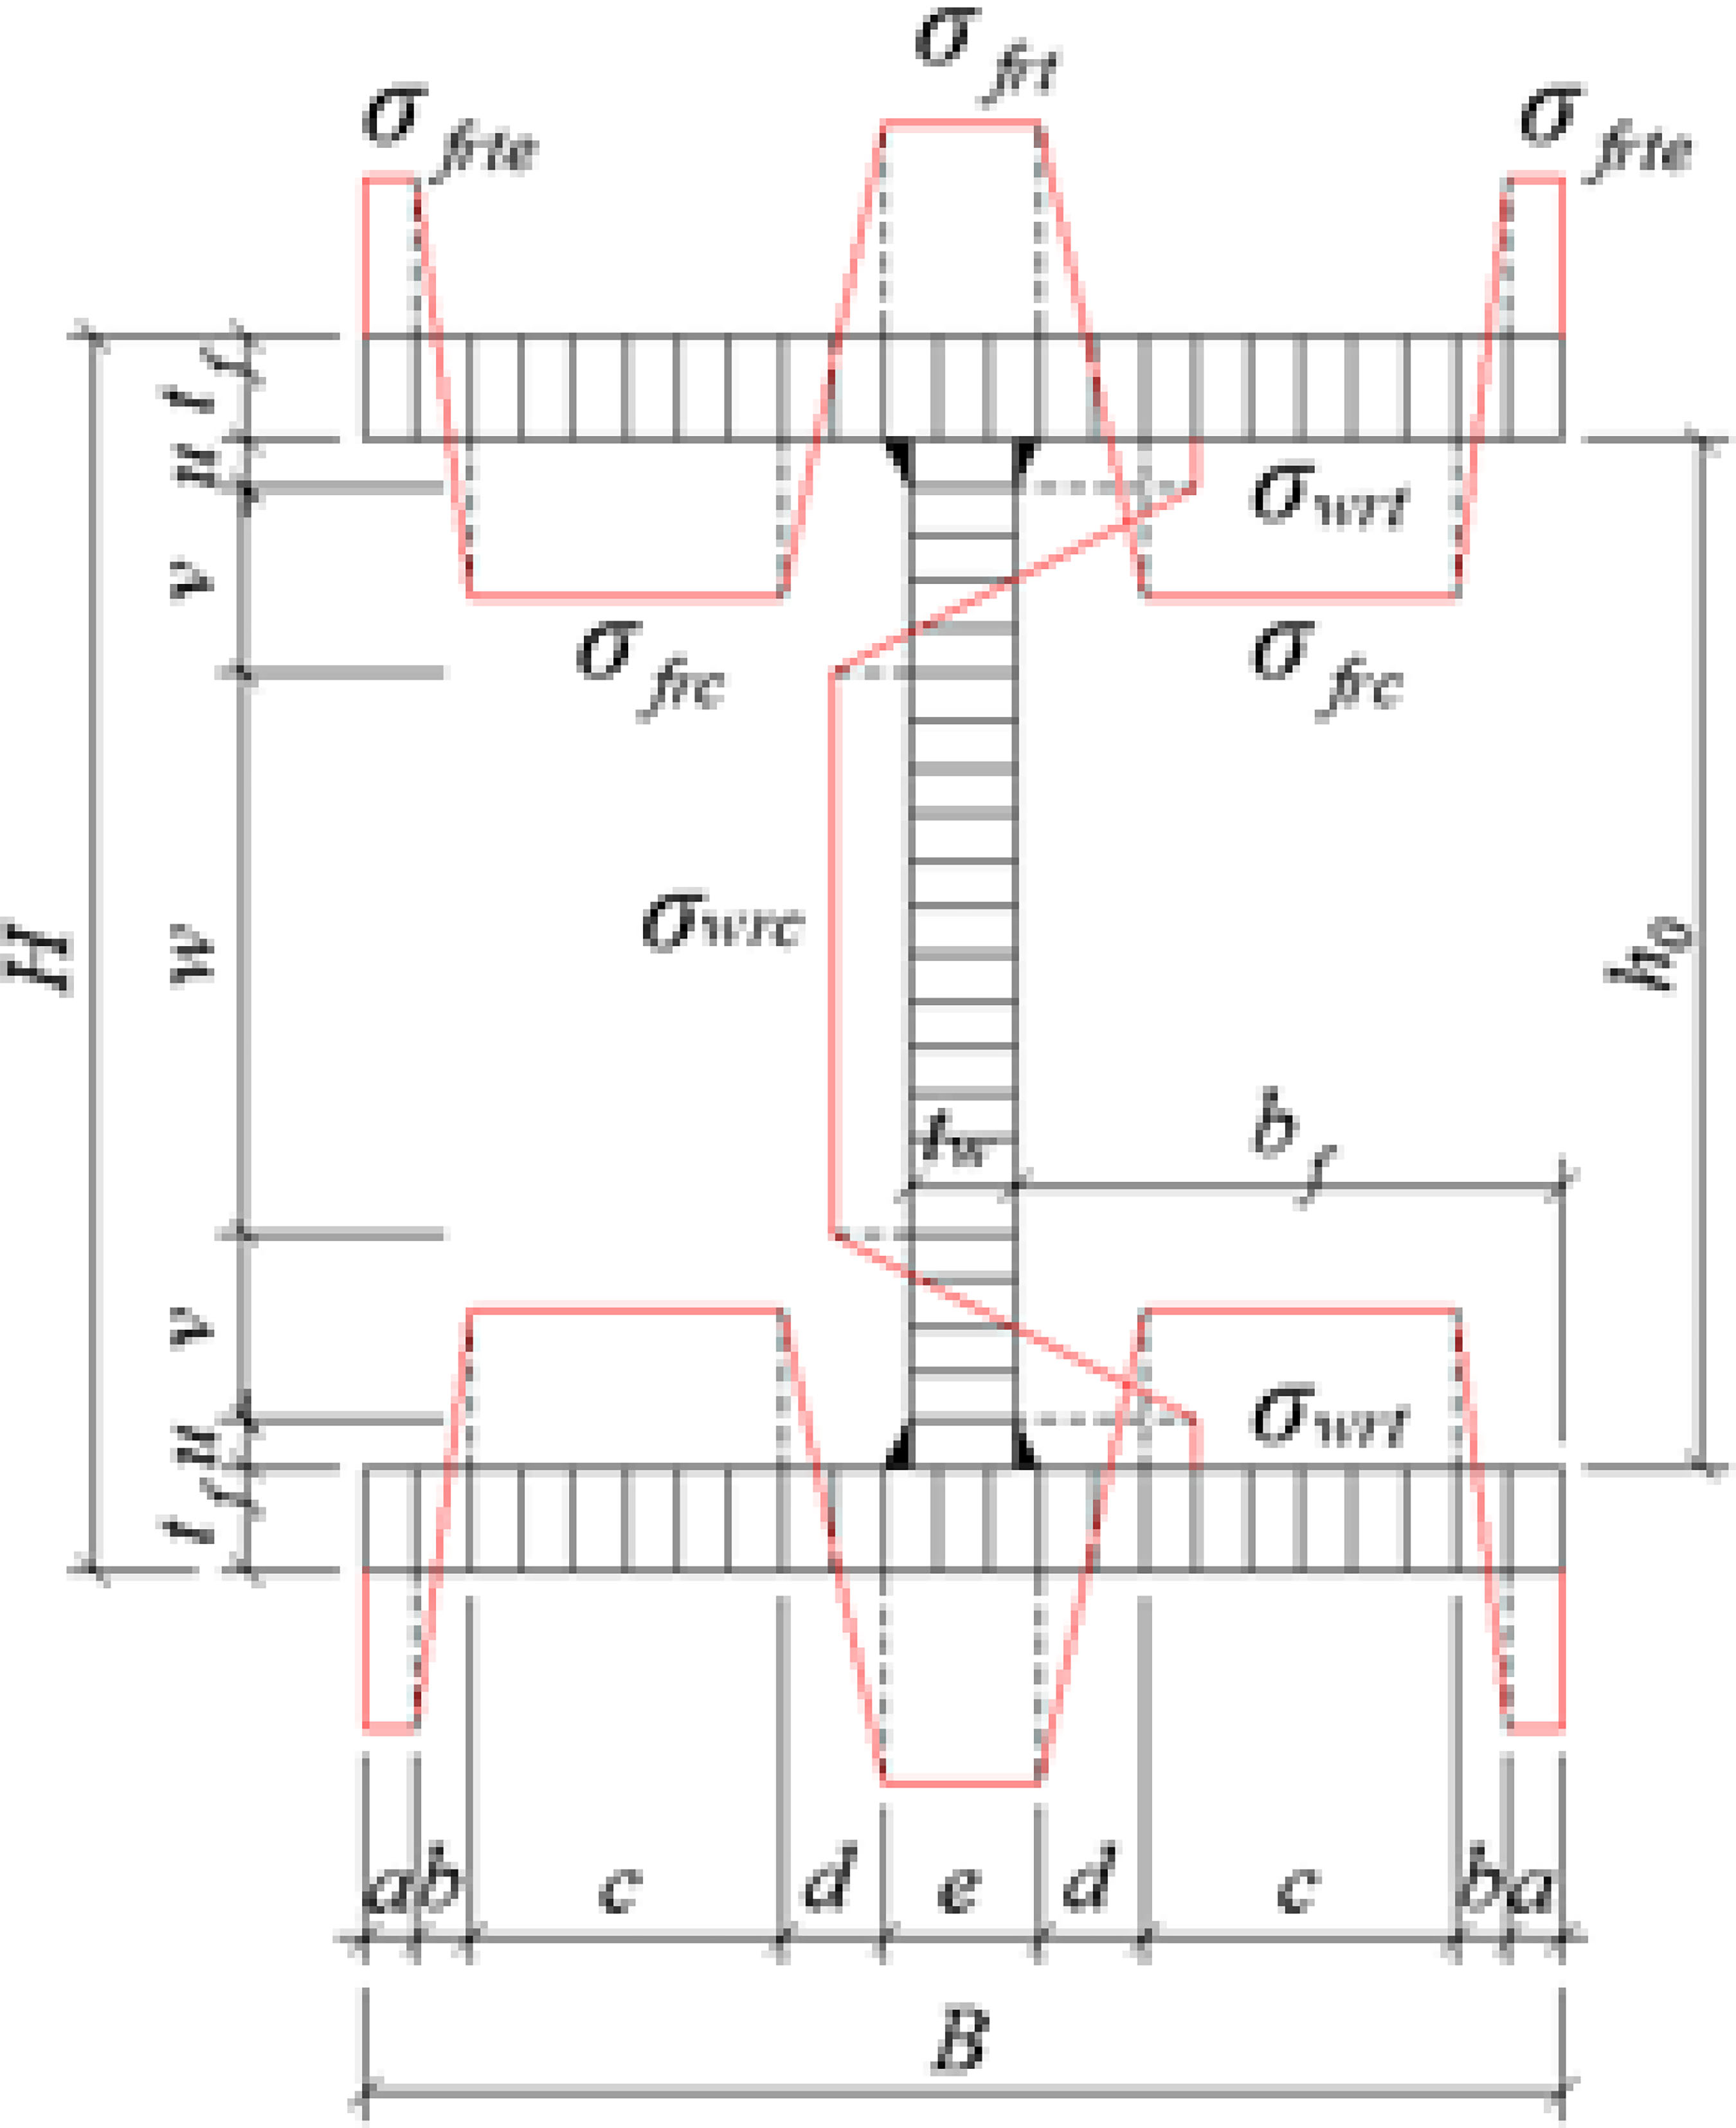
This research applied the residual stress distributions proposed by Ban, Shi and Shi (2014) for HSS columns with welded sections, as illustrated in Figure 3. This model, developed from experimental data on I-shaped sections fabricated with Chinese steel grades (from 460 MPa to 960 MPa), has been widely employed in related research (Zhou et al., 2023). In this work, the normal self-balanced residual stresses were directly applied to each slice of the cross-section in the first step of the analysis.
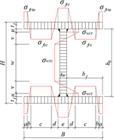
The maximum residual compressive stresses for flanges (σfrc) and web (σwrc) can be computed by Equations 6 and 7, respectively:
In which:
𝑏𝑓/𝑡𝑓 and ℎ0/𝑡𝑤 are the width–thickness ratios of the flange and the web, respectively; and
The maximum residual tensile stresses at the weld region (σfrt and σwrt) are defined by Equations 8 and 9:
The maximum residual tensile stress at the flange flame-cut edge(σfrte) is computed by Equation 10:
In addition to these expressions, it is necessary to consider Equations 11 to 14 for defining the residual stress distribution pattern:
In which:
𝐴𝑓 and 𝐴𝑤 are the area of the flange and web, respectively. are the area of the flange and web, respectively.
The parameters a, b, c, d, e, u, v and w in the residual stress model can be obtained from Table 4, where te represents the width of the weld region. In parametric analysis, the value of te was set equal to the minimum fillet weld size, as specified in Table 5, for the sake of simplicity.
3.4 Initial geometric imperfections
Initial geometric imperfections are an important aspect to consider in structural design. These imperfections refer to misalignments or curvatures exhibited by a structure due to quality failures during the manufacturing process or damage during transport and storage of steel profiles. As they can anticipate the buckling phenomenon, they must be considered when designing structures.
In this study, the initial geometric imperfections were explicitly modelled with a sinusoidal shape by directly offsetting the nodes coordinates. A deviation magnitude (𝛿0) of L/1000 was applied at the middle of the column height, where L is the effective length of column.
4 Results
4.1 Validation of FE model
In this section, the numerical simulation of the structural behavior of a slender welded I-shaped column is presented, following the experimental parameters established by Ma et al. (2018) and Ma (2019). The purpose is to compare the predicted ultimate strengths with the experimental results, thereby validating the parametric analysis developed subsequently. The modeled column consists of a welded I-shaped section, with its geometric dimensions given in Table 6, and fabricated from high-strength steel plates whose mechanical properties are listed in Table 7. In Table 6, A is the cross-sectional area, Leff is the effective column length and Iz corresponds to the moment of inertia about the weaker axis. The parameter |v| represents the initial out-of-straightness, corresponding to the mid-height lateral deviation of the column. This geometric imperfection was modeled as a half-sine wave and explicitly introduced into the finite element model. According to EN 1993-1-1 (ECS, 2005), the modeled section is classified as Class 1.
To simulate the behavior of the high-strength steel material, a bilinear elastoplastic model with isotropic hardening was adopted in this study. For both the flanges and the web of section, the elastic modulus (E) was taken as 212 GPa, while the yield strength (fy) was assumed to be 756 MPa. Owing to the inherent limitations of the PPLANLEP software formulation, the longitudinal strain was restricted to 4%, under the assumption of a small-strain regime.
Within the PPLANLEP program, residual stresses are introduced as input parameters, being assigned to each fiber of the cross-section and subsequently combined with the normal stresses during the analysis. In this investigation, the residual stress distribution proposed by proposed by Ban, Shi and Shi (2014) was implemented. The preference for Ban, Shi and Shi (2014) model over that used by Ma (2019) was due to its higher flexibility for future parametric investigations on welded I-shaped sections, as it encompasses high-strength steel grades ranging from 460 MPa to 960 MPa, consistent with the specimens investigated in this study, and is also suitable for sections fabricated using flame-cut plates.
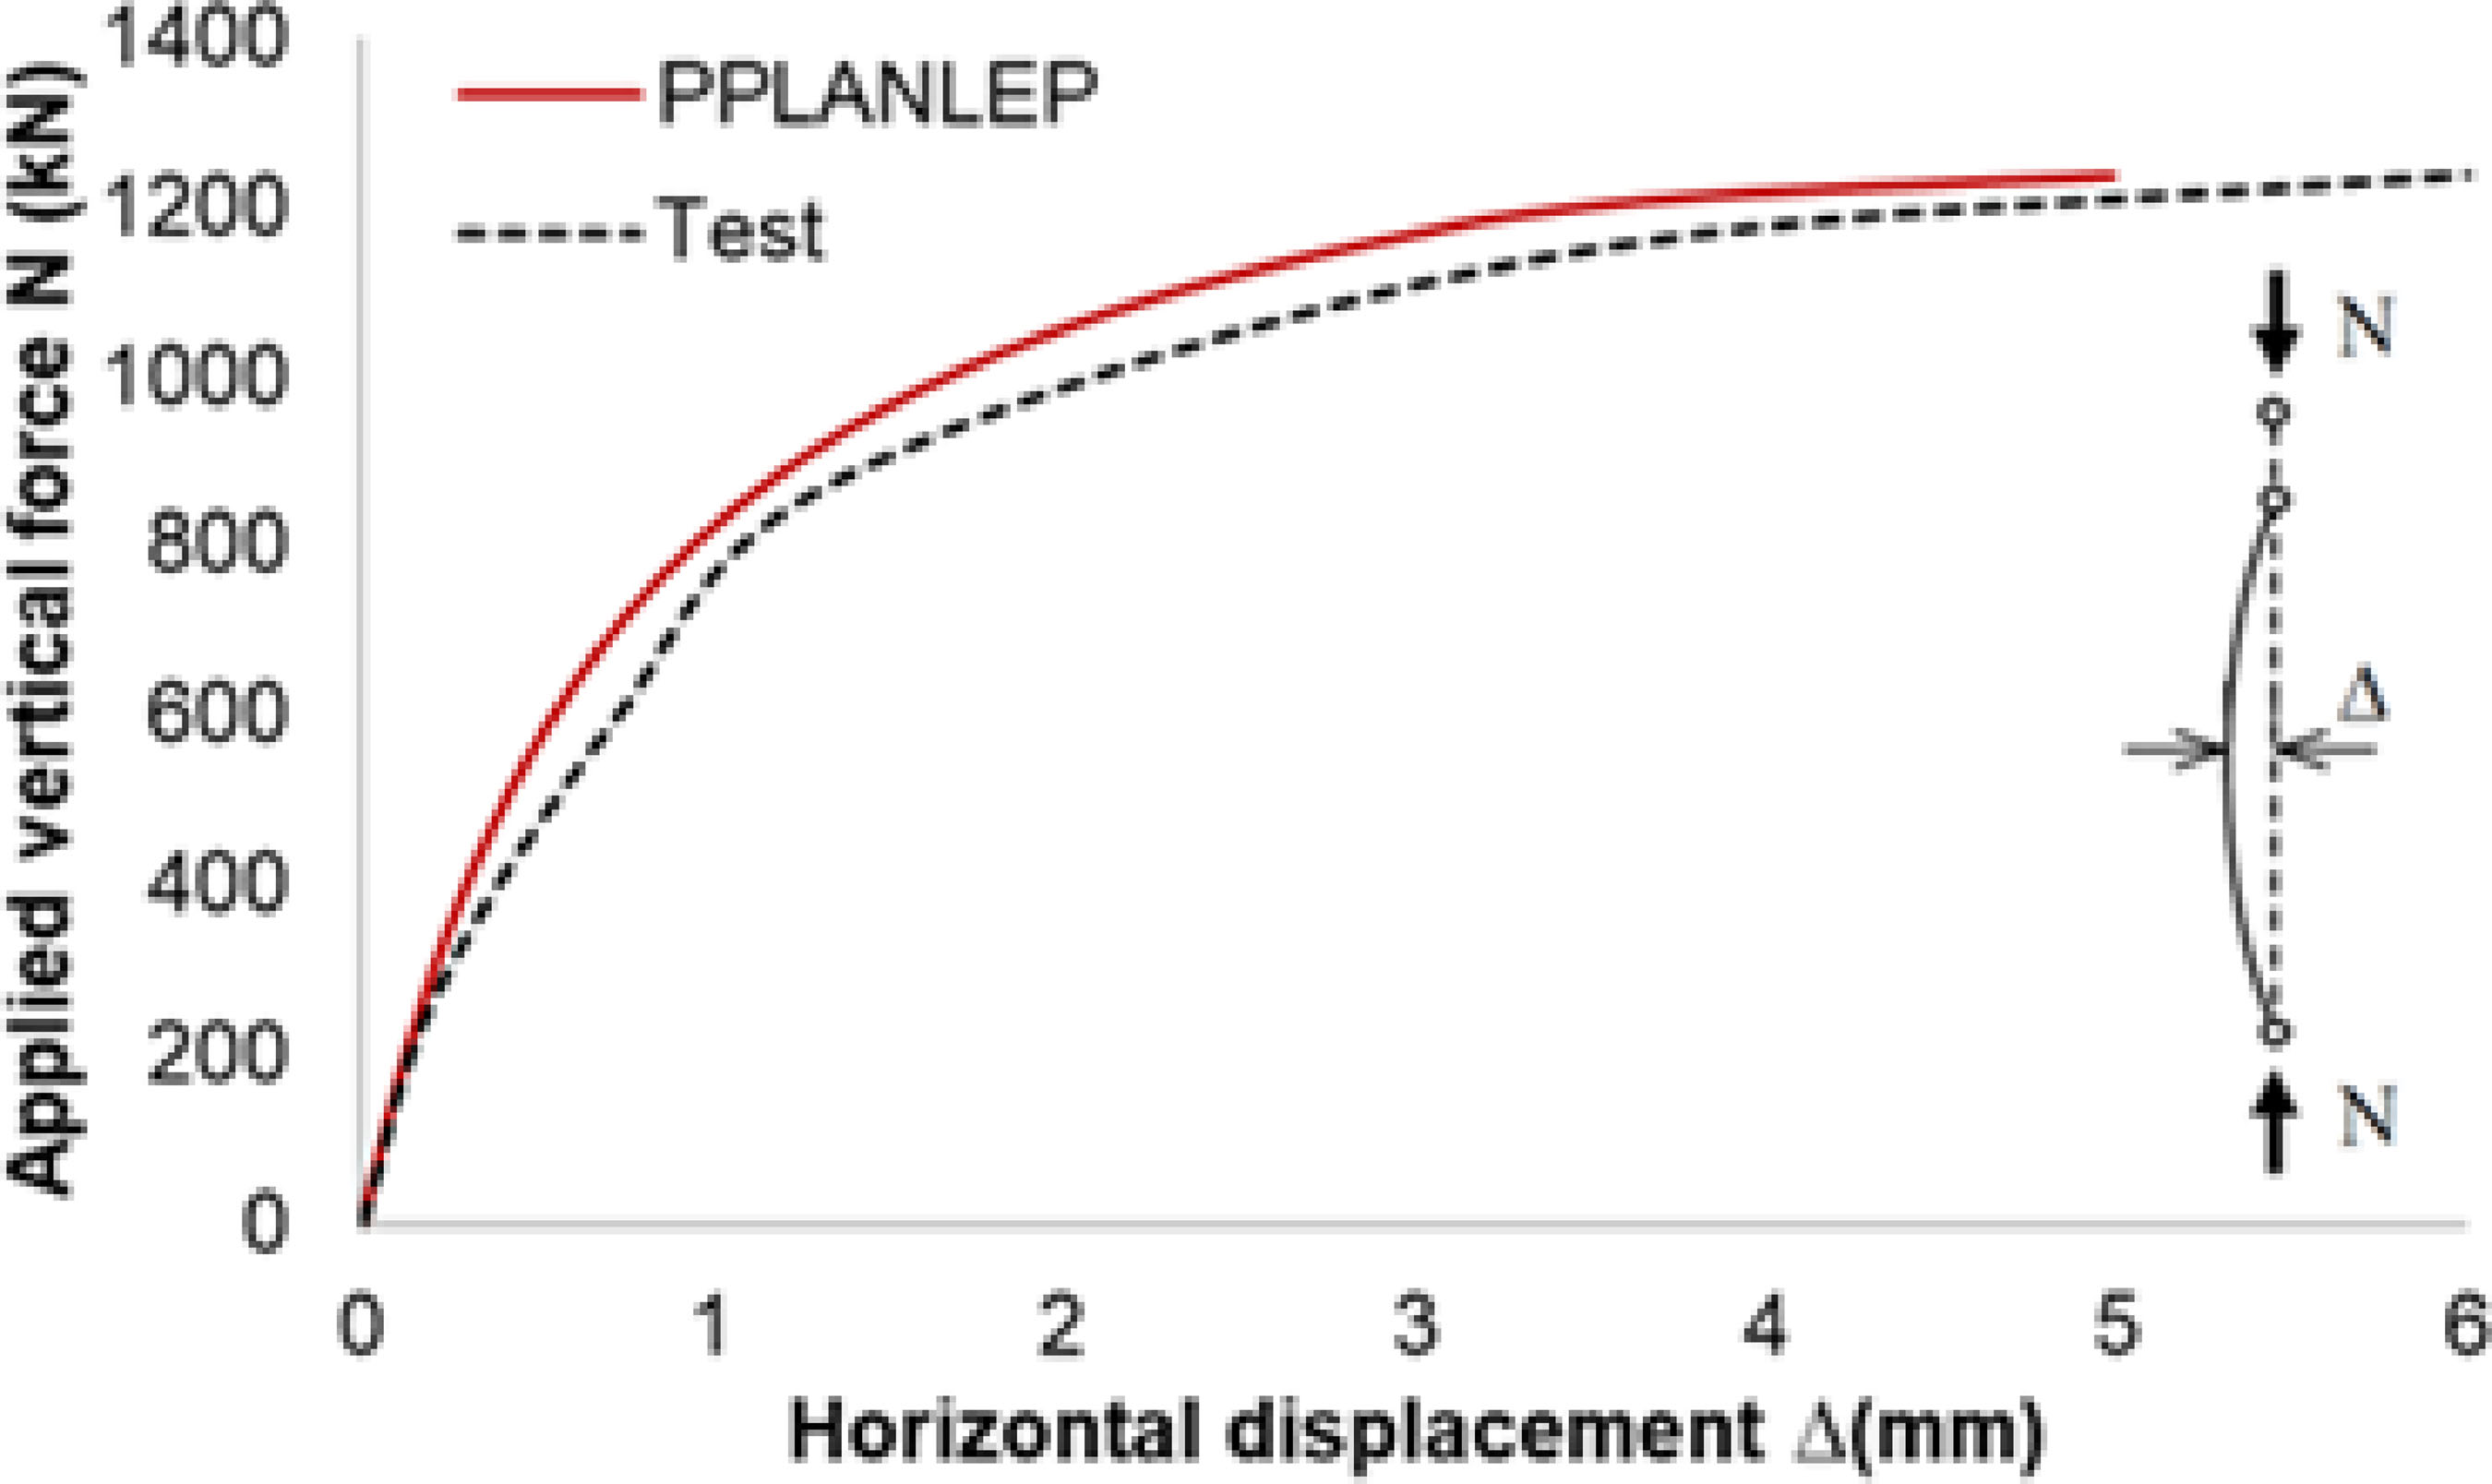
The load-deflection curve of the investigated column is shown in Figure 4. A close agreement between the numerical results and the experimental data reported by Ma et al. (2018) and Ma (2019) can be observed.
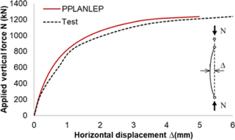
The ultimate loads obtained from the PPLANLEP software (𝑁𝑃𝑃𝐿𝐴𝑁𝐿𝐸𝑃) and those from Ma’s experiments (𝑁𝑇𝑒𝑠𝑡) and FE analyses (𝑁𝐴𝐵𝐴𝐶𝑈𝑆) are presented in Table 8, together with the corresponding percentage deviations. In Table 8, ∆𝑇−𝑃 represents the percentage difference between the experimental results and the PPLANLEP predictions, while ∆𝐴−𝑃 represents the percentage difference between the FE analysis results and the PPLANLEP predictions. These results confirm the reliability of the PPLANLEP model for predicting the ultimate load of HSS columns and validate its suitability for subsequent parametric studies.
Additional comparisons between PPLANLEP results and experimental results of high-strength steel welded columns fabricated using flame-cut plates can be found in Simões (2025).
4.2 Effect of residual stresses on stability with respect to the weak axis
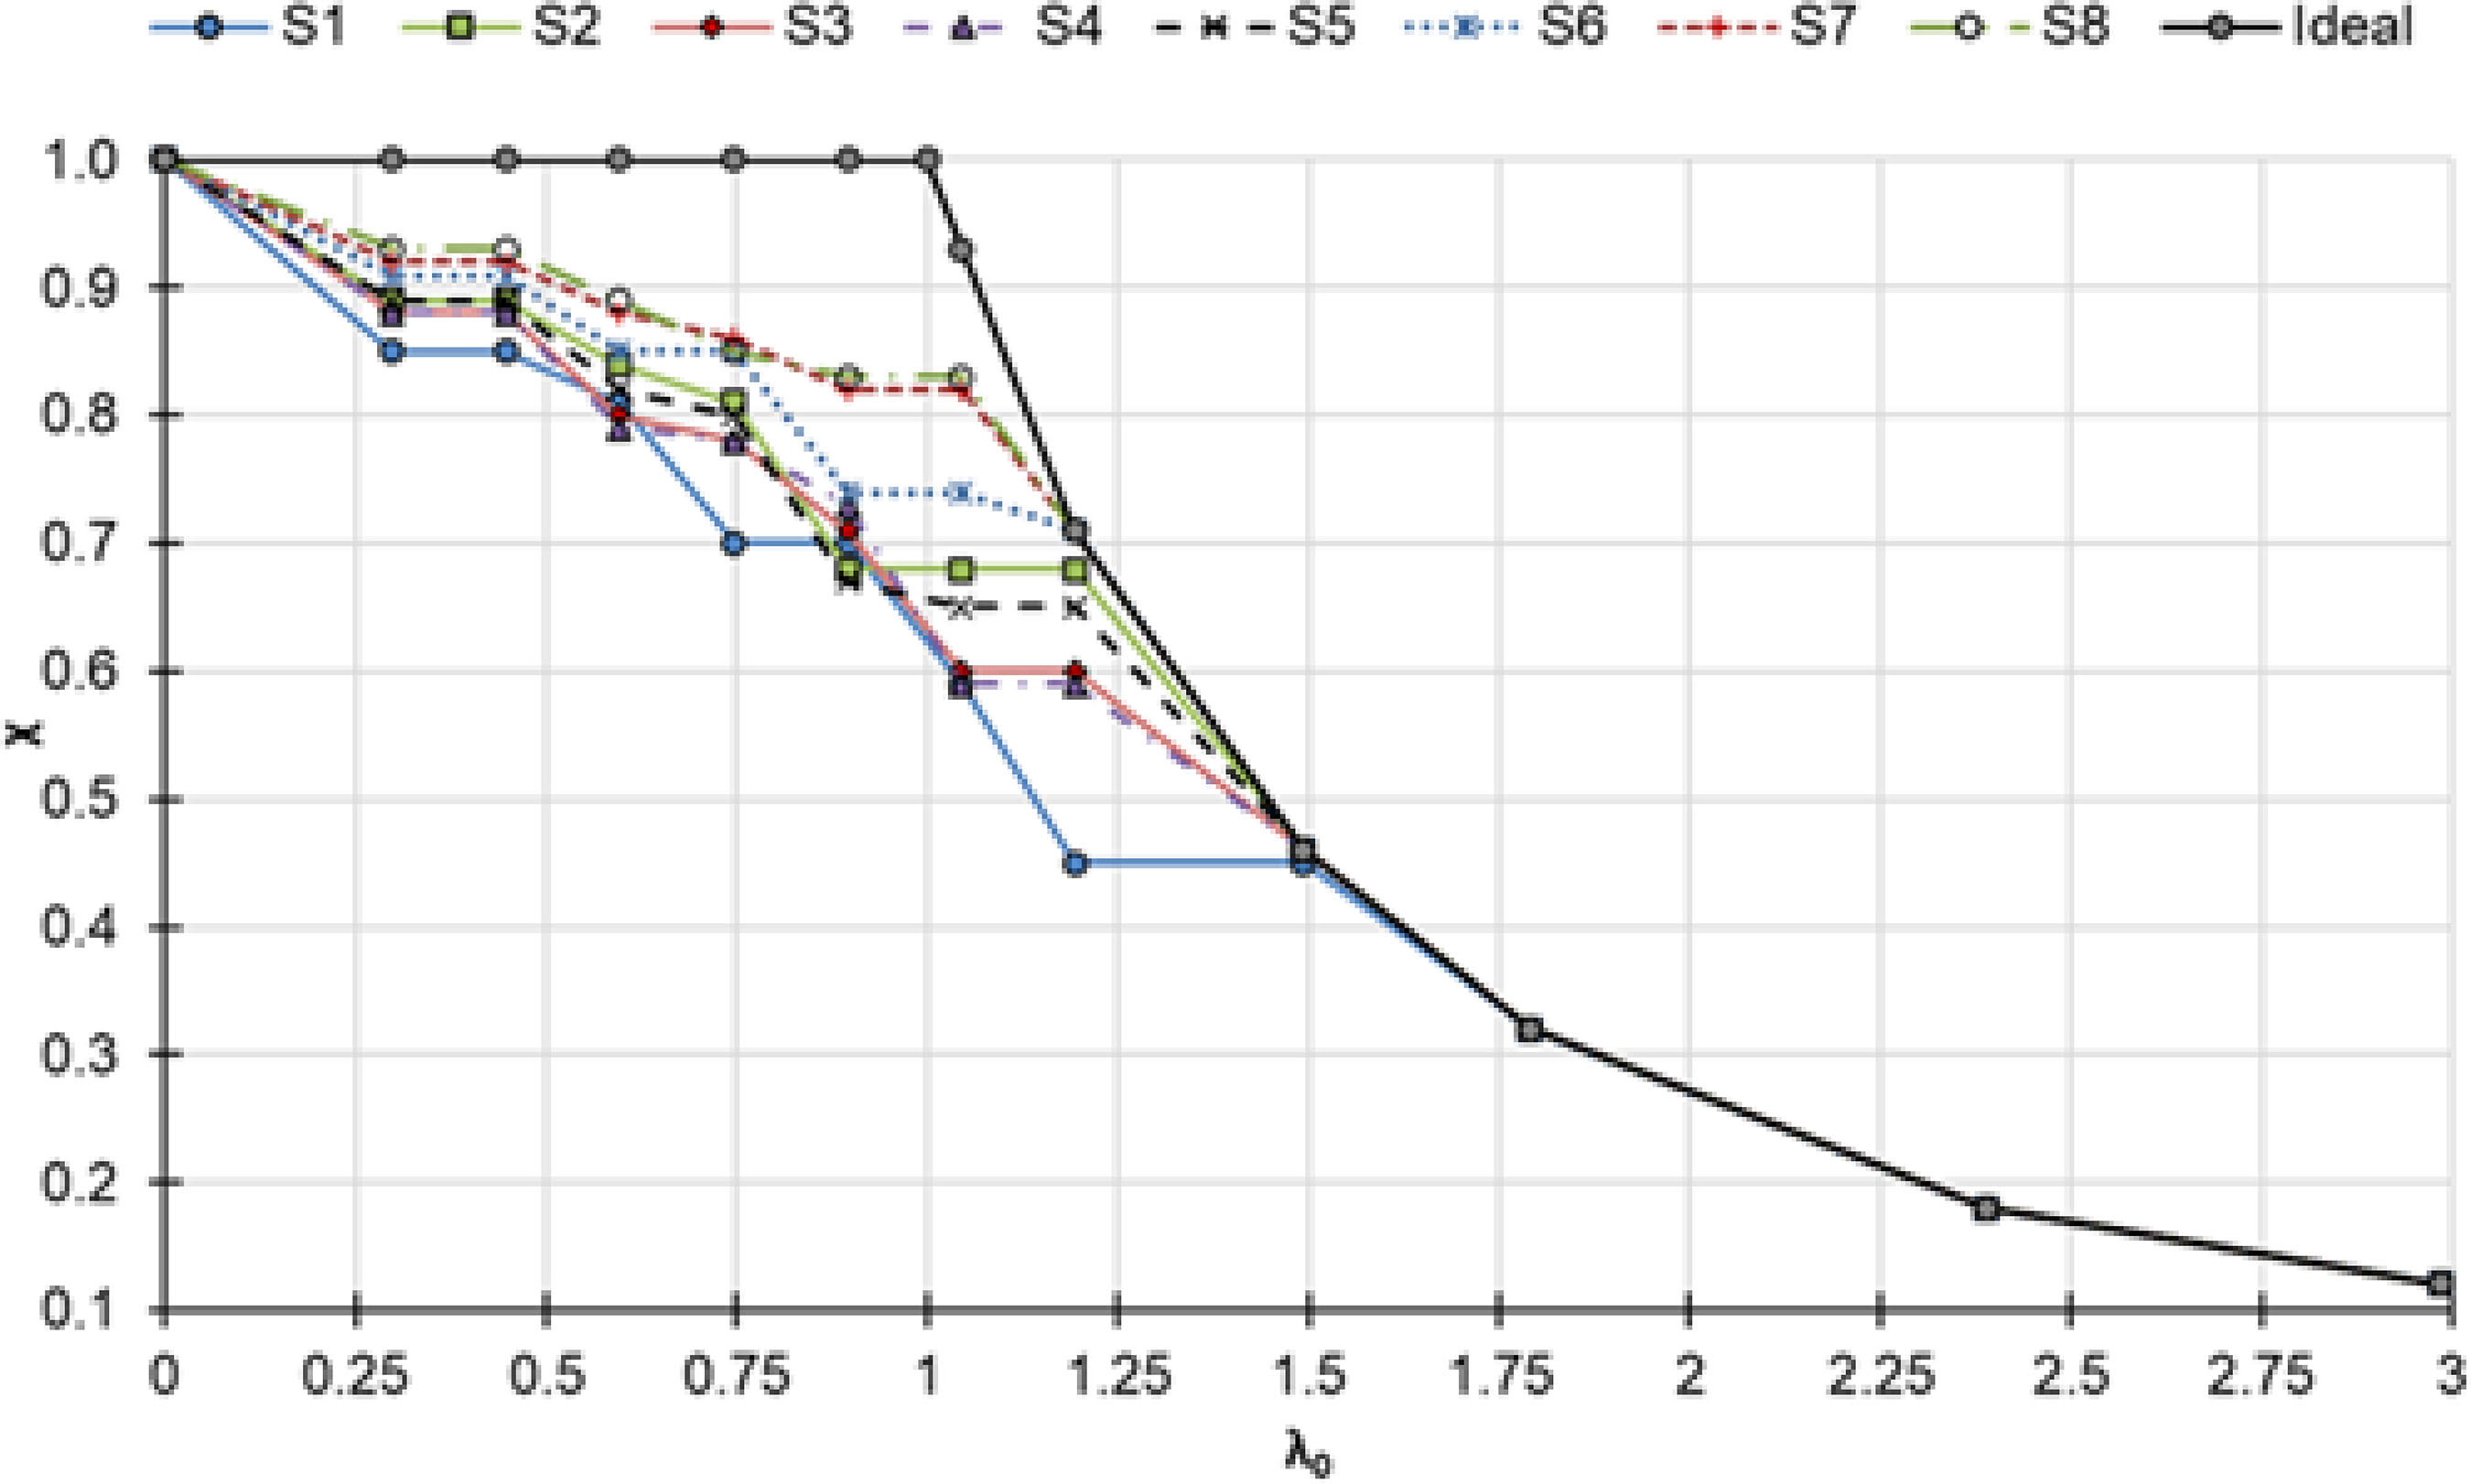
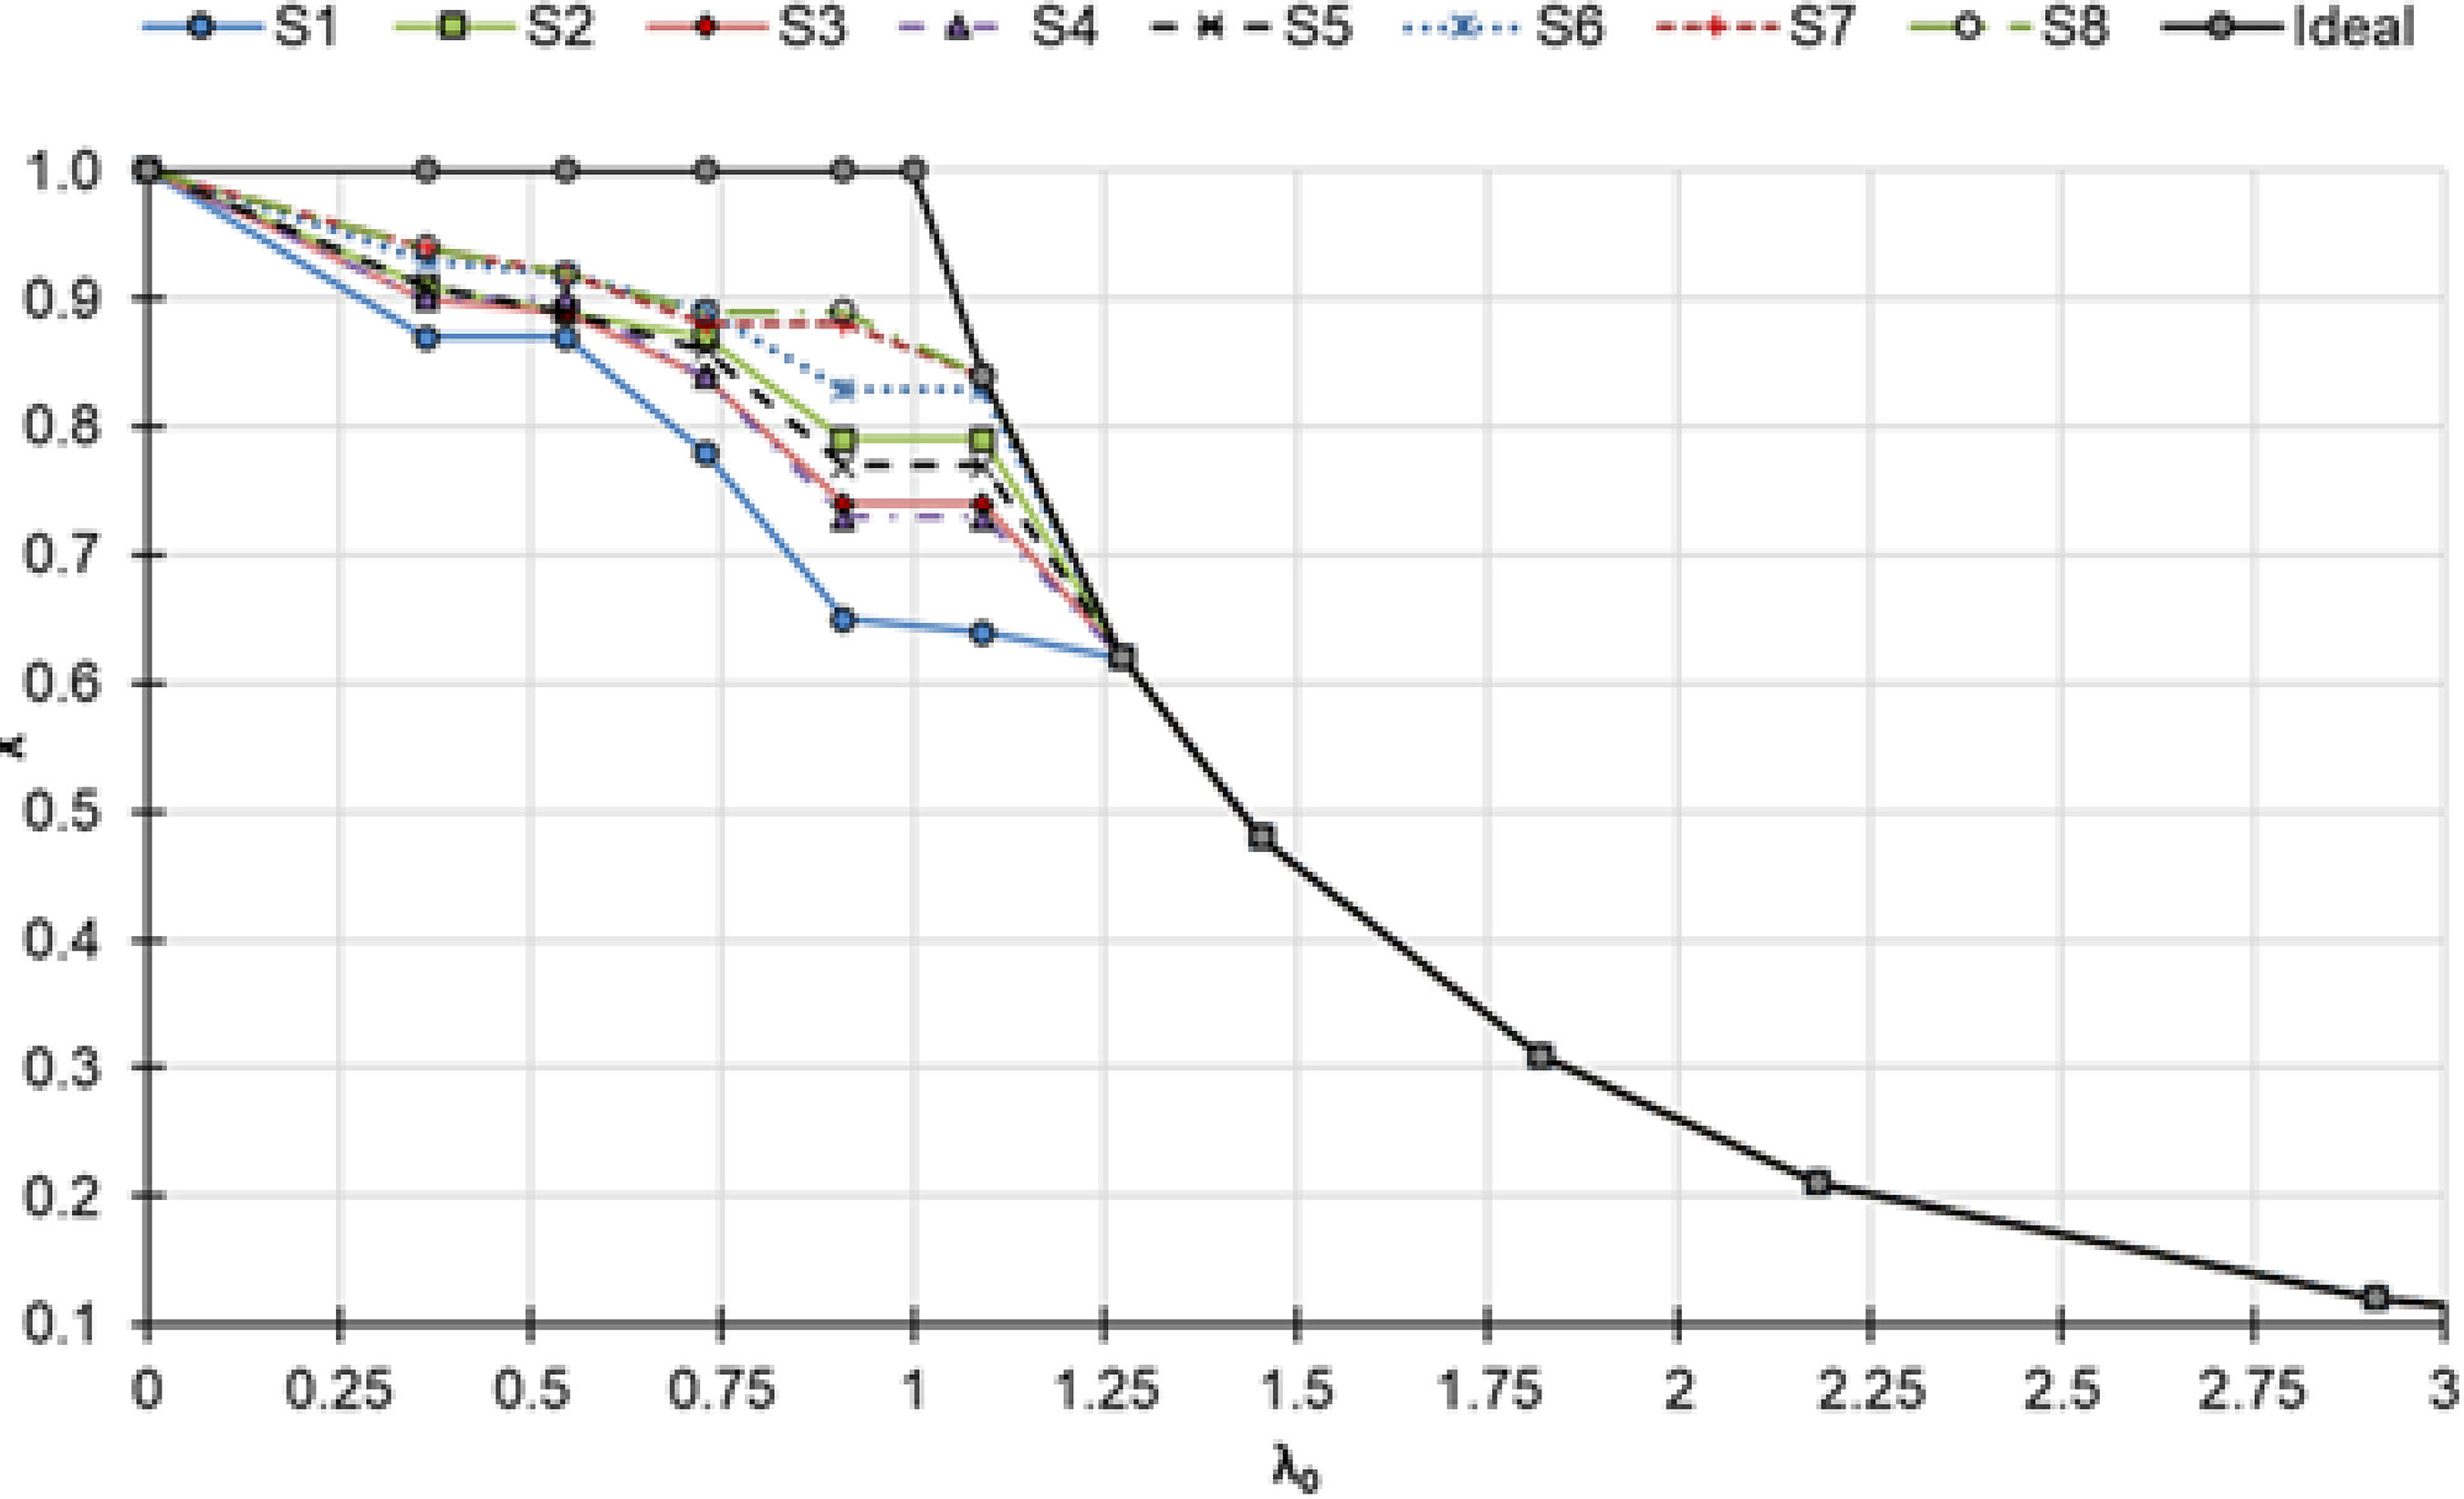
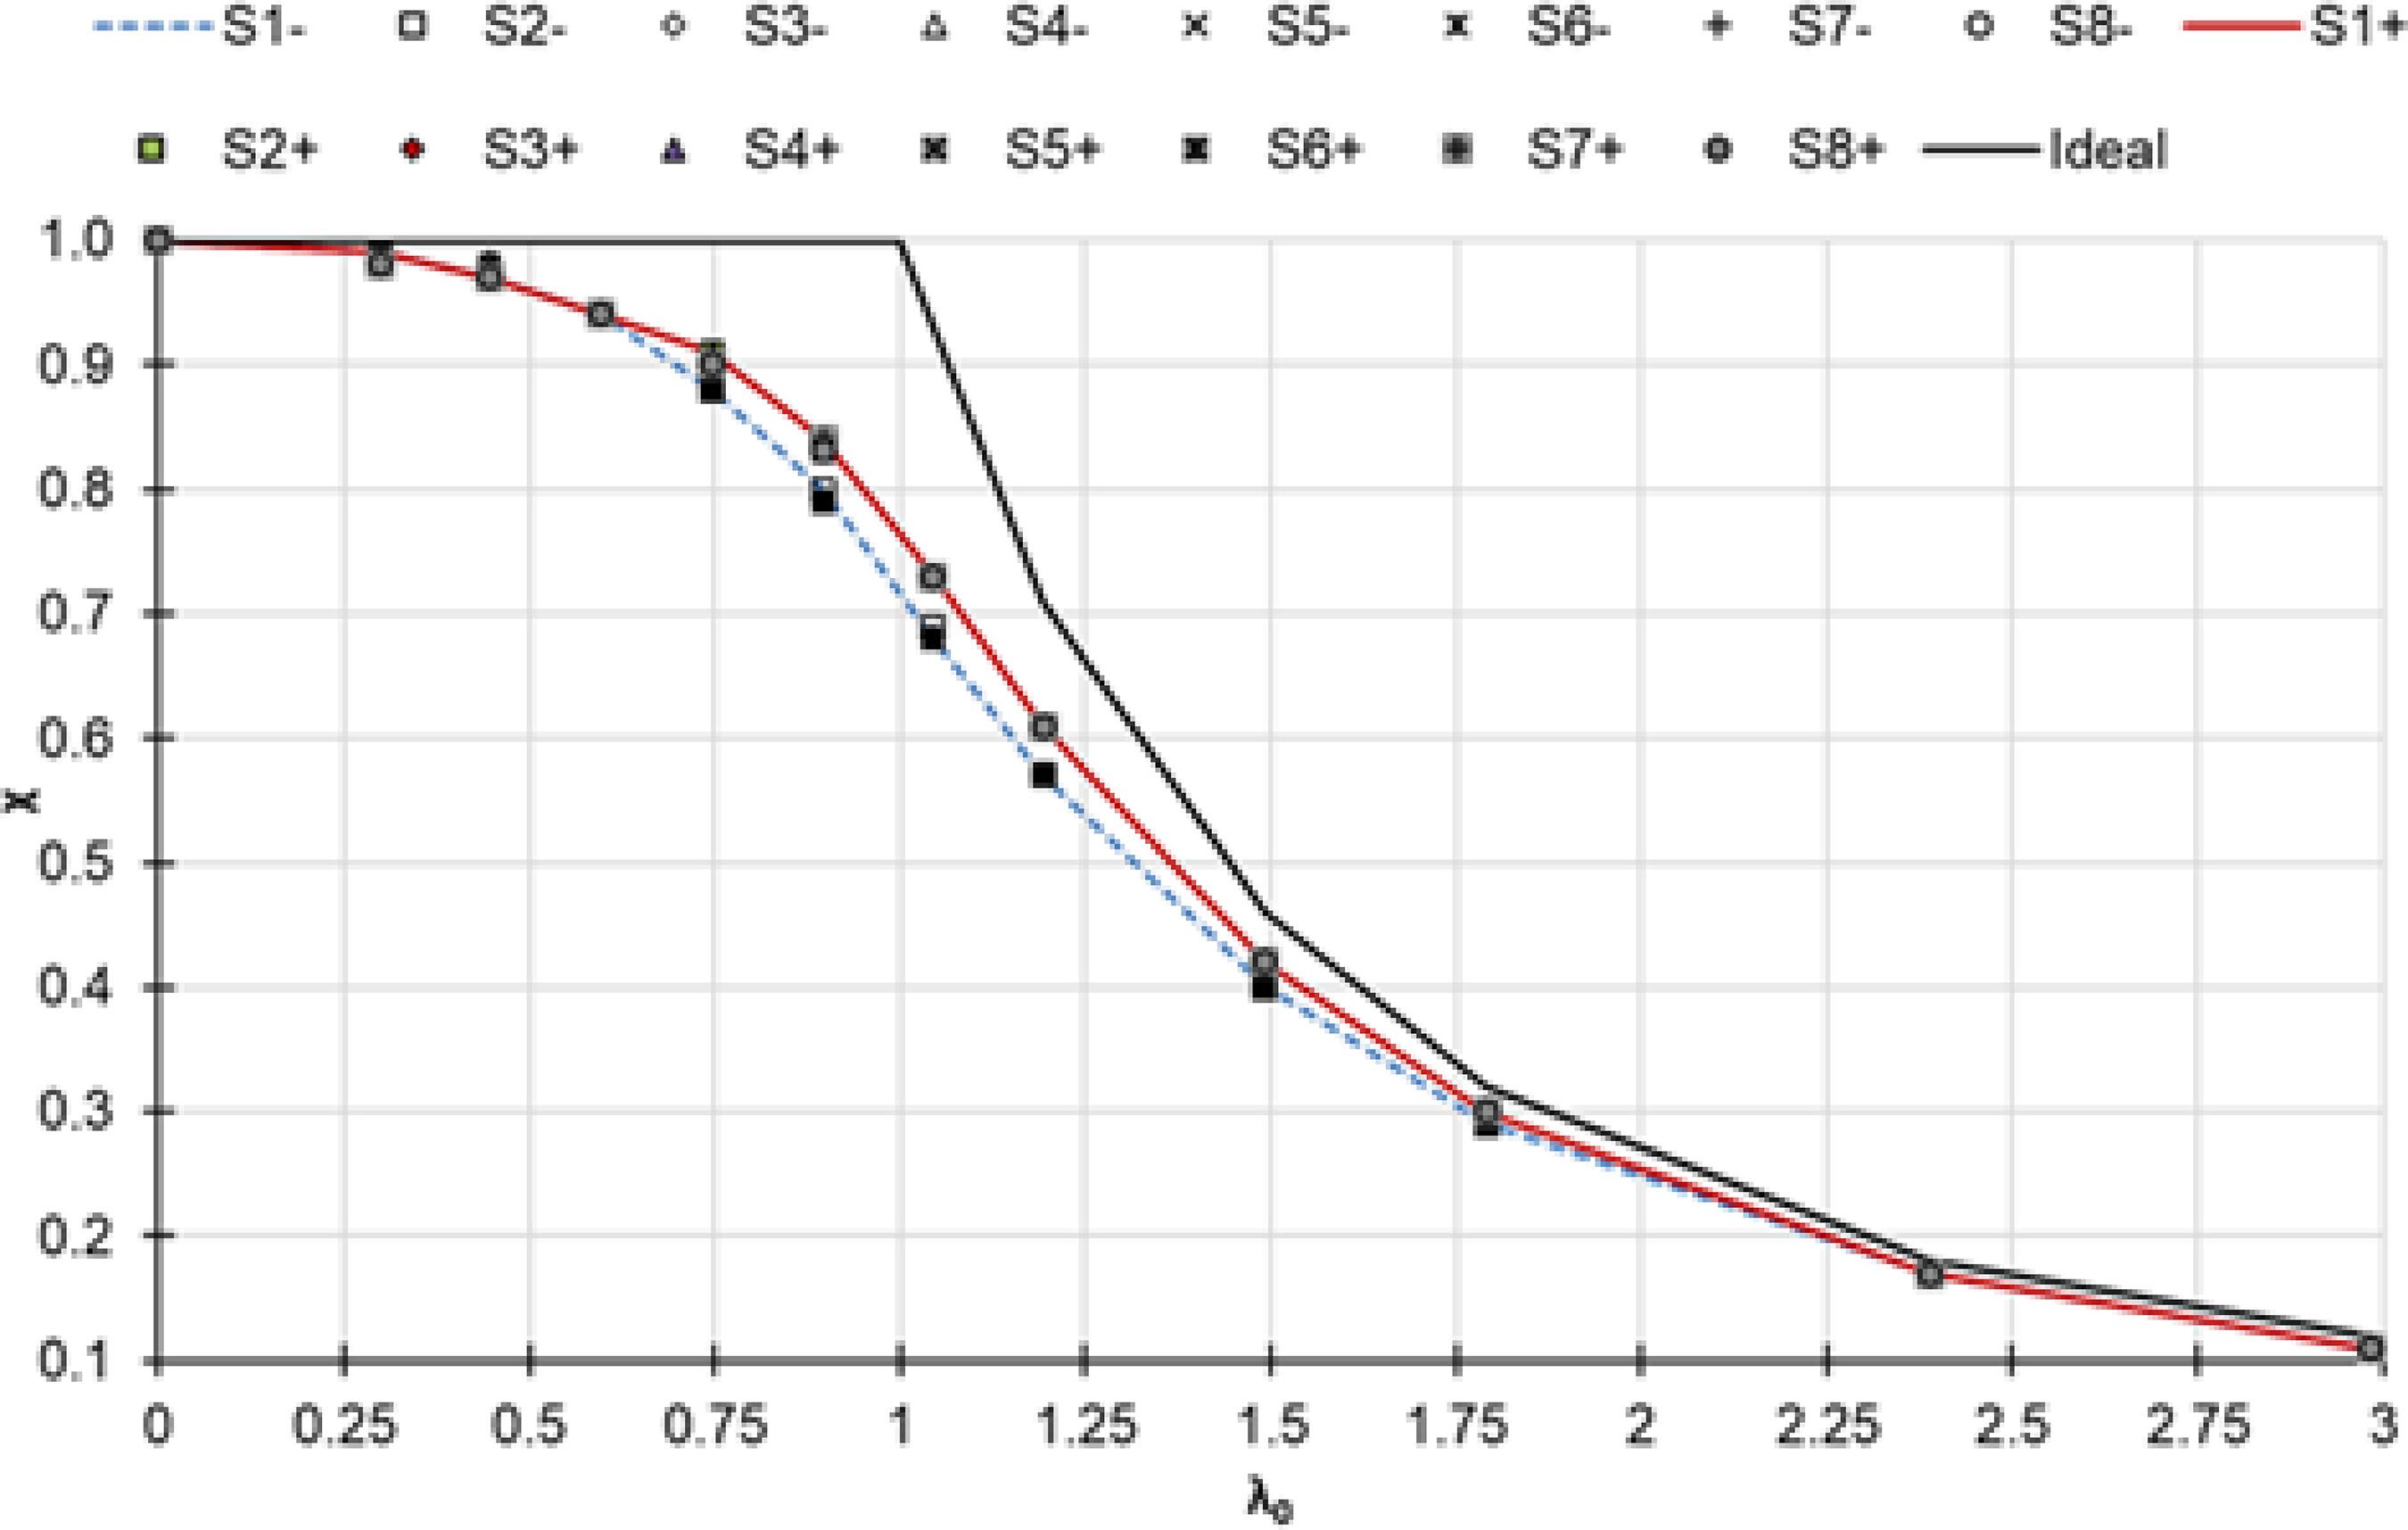
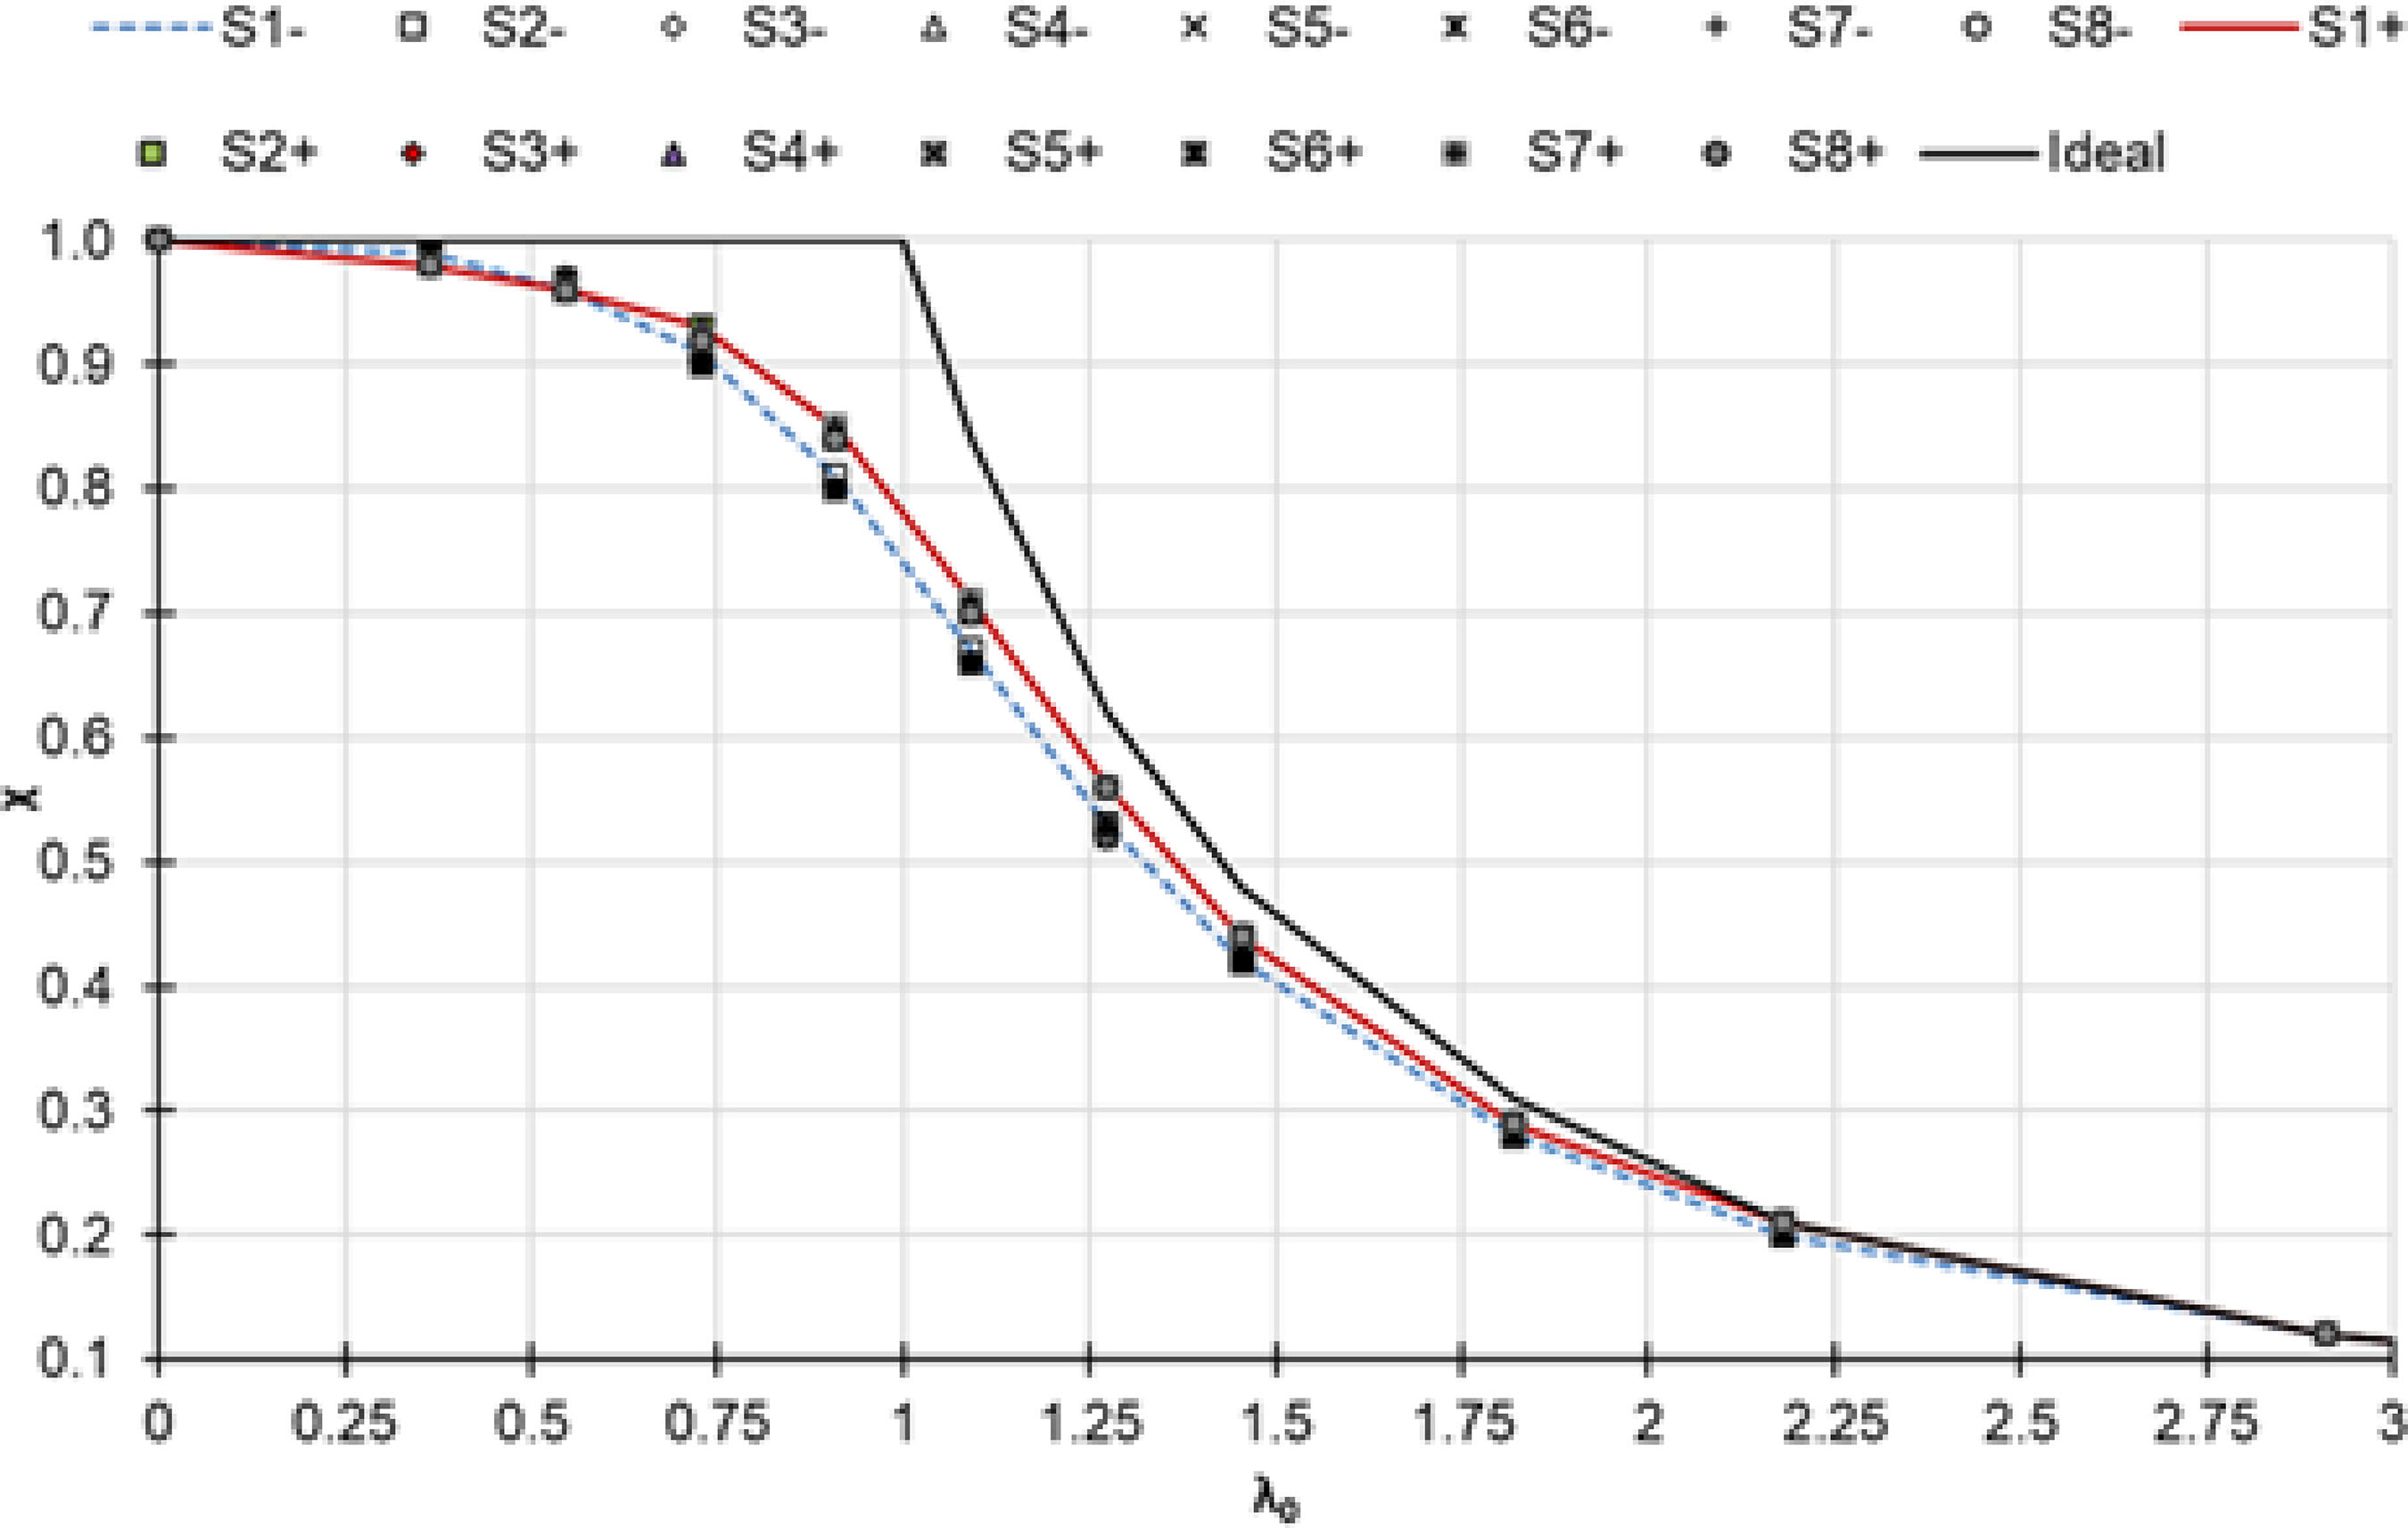
Figures 5 and 6 illustrate the influence of residual stresses on the global stability reduction factor (𝜒) as a function of the normalized slenderness ratio (𝜆0) for the weak axis. The results, shown for all cross-sections S1 to S8 and for the ideal case (without imperfections), indicate that for both steel grades (460 MPa and 690 MPa), residual stresses significantly reduce the load-bearing capacity of short to intermediate columns, while their influence becomes negligible in slender columns governed by elastic buckling. This effect is particularly pronounced in profiles with smaller cross-sectional dimensions, which tend to exhibit higher magnitudes of compressive residual stresses.
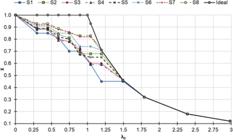

For the studied columns, the influence of residual stresses is significant up to a normalized slenderness ratio of approximately 1.5 for 460 MPa HSS columns and 1.25 for 690 MPa HSS columns, beyond which the effect effectively disappears. Additionally, when comparing both steel grades, 690 MPa columns tend to exhibit a slightly less pronounced reduction in 𝜒 due to residual stress effects.
4.3 Effect of residual stresses on stability with respect to the strong axis
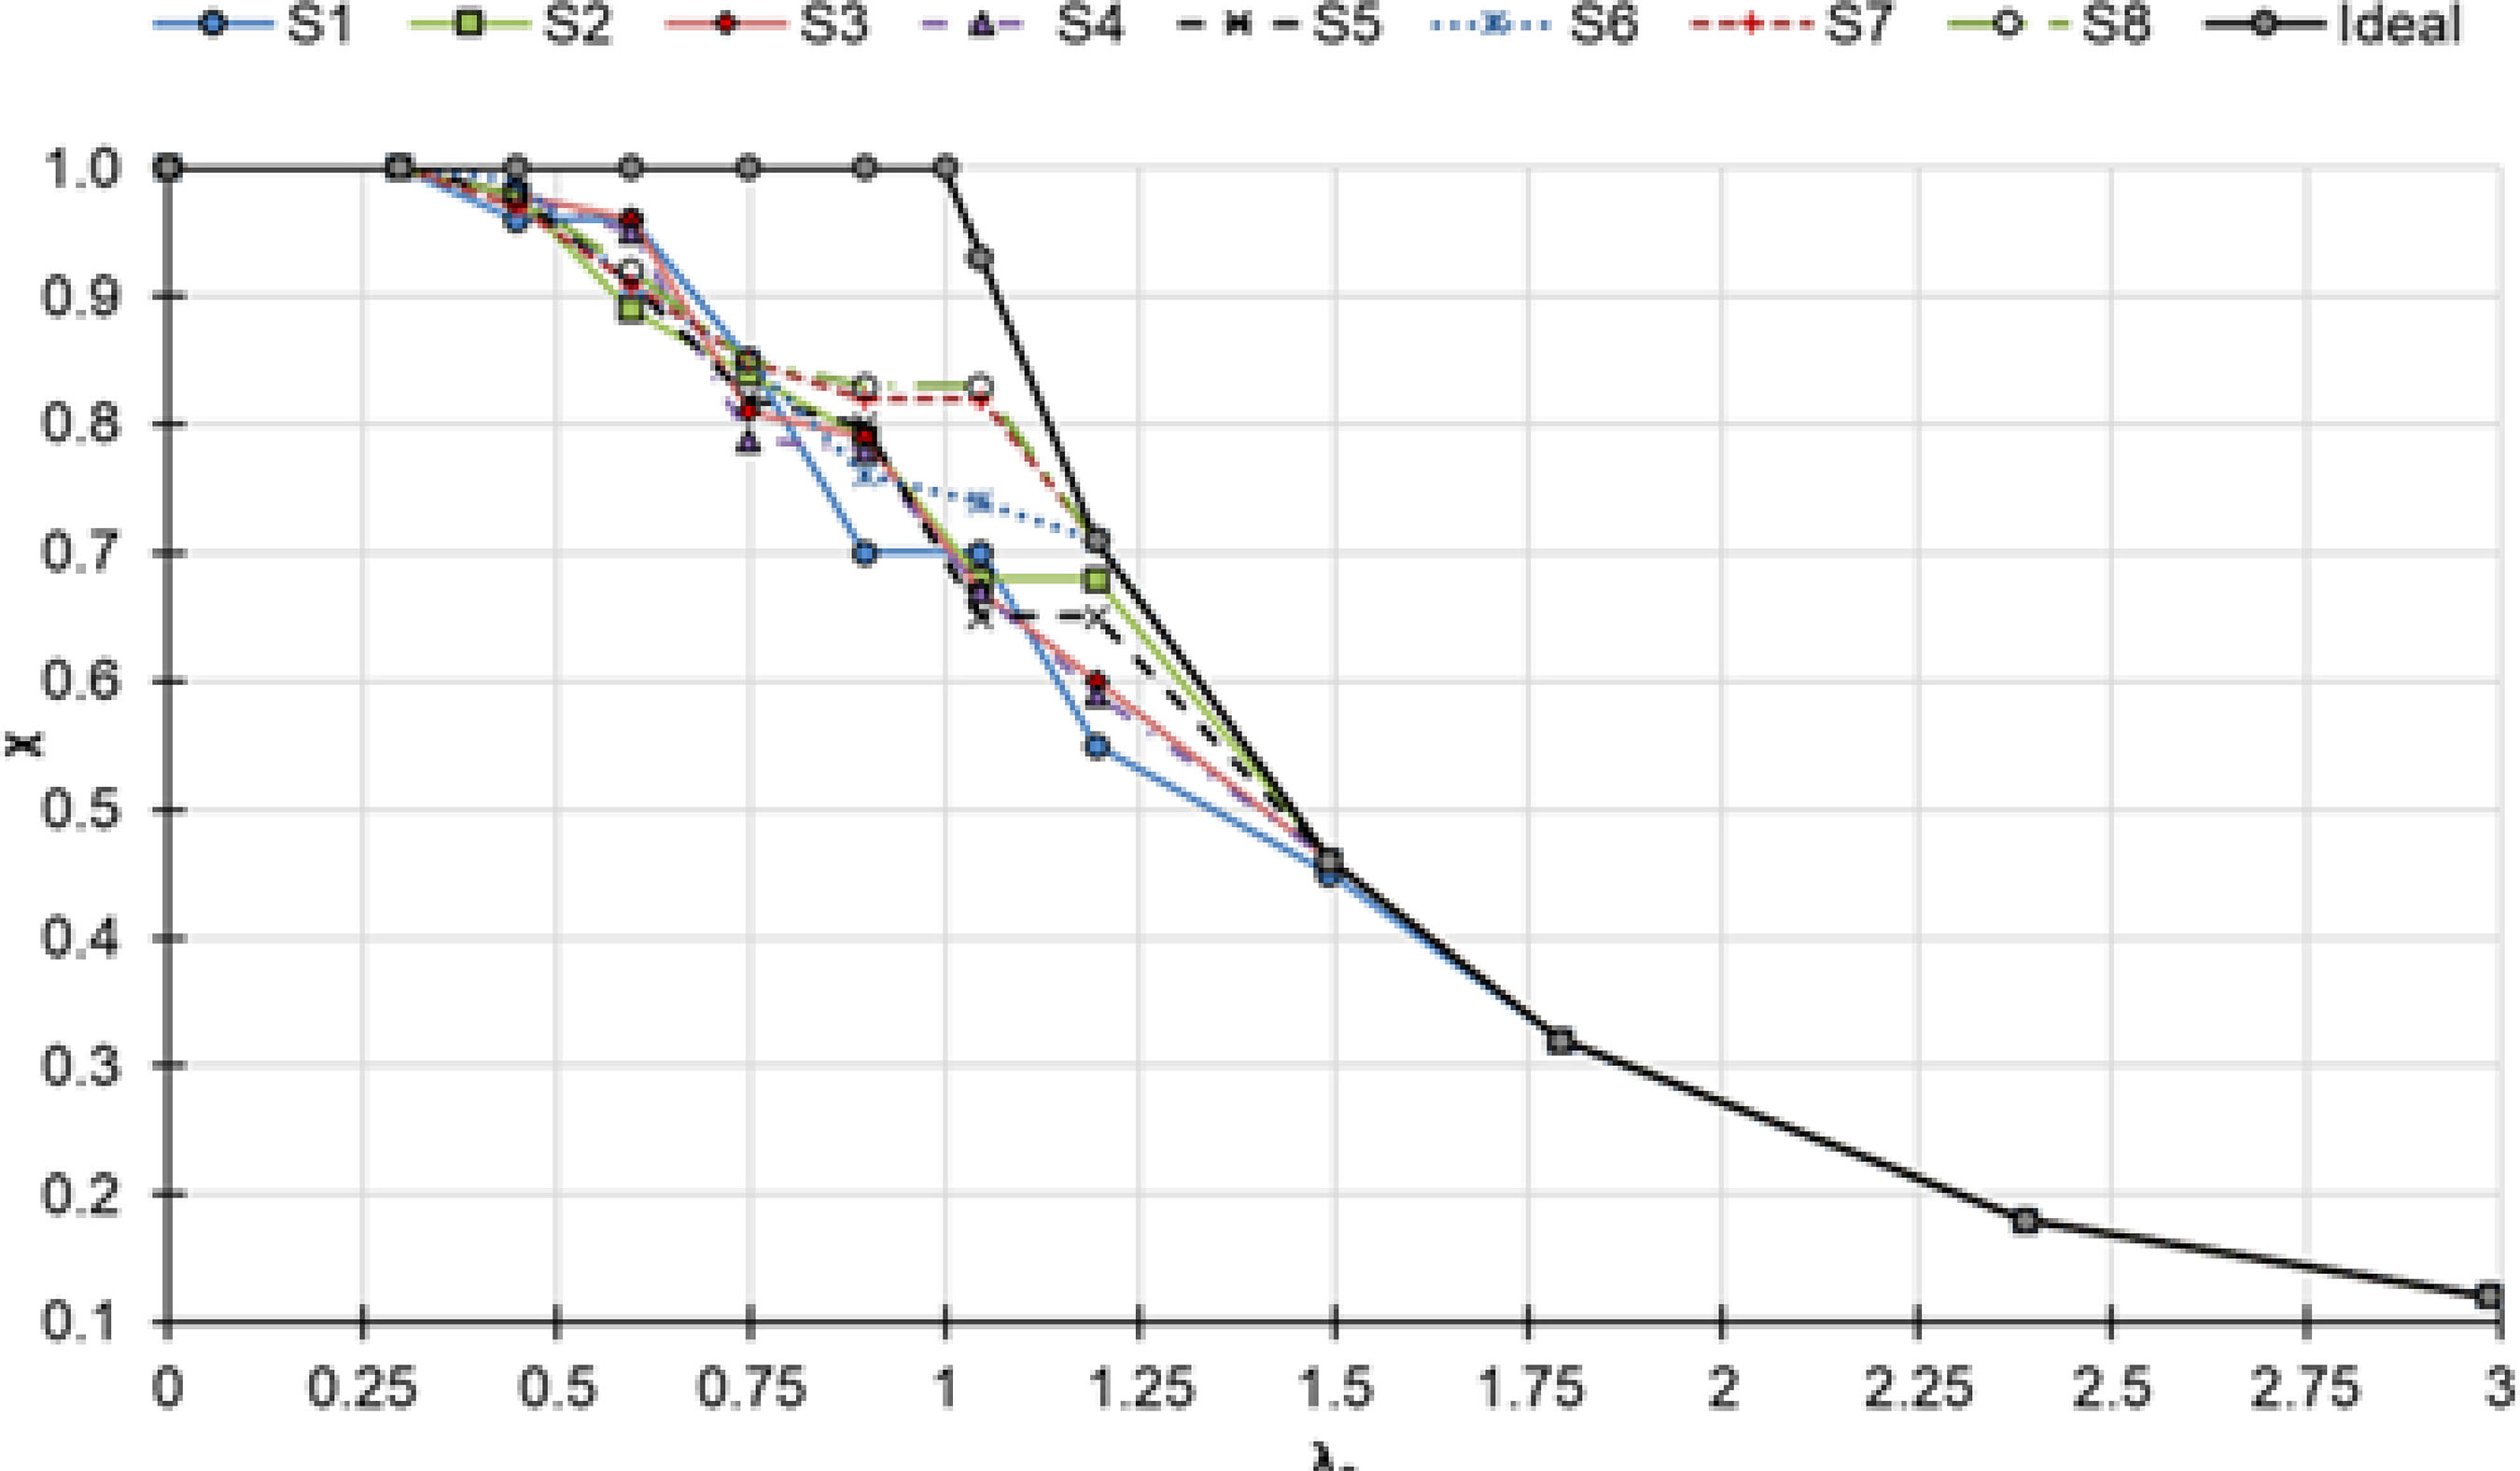
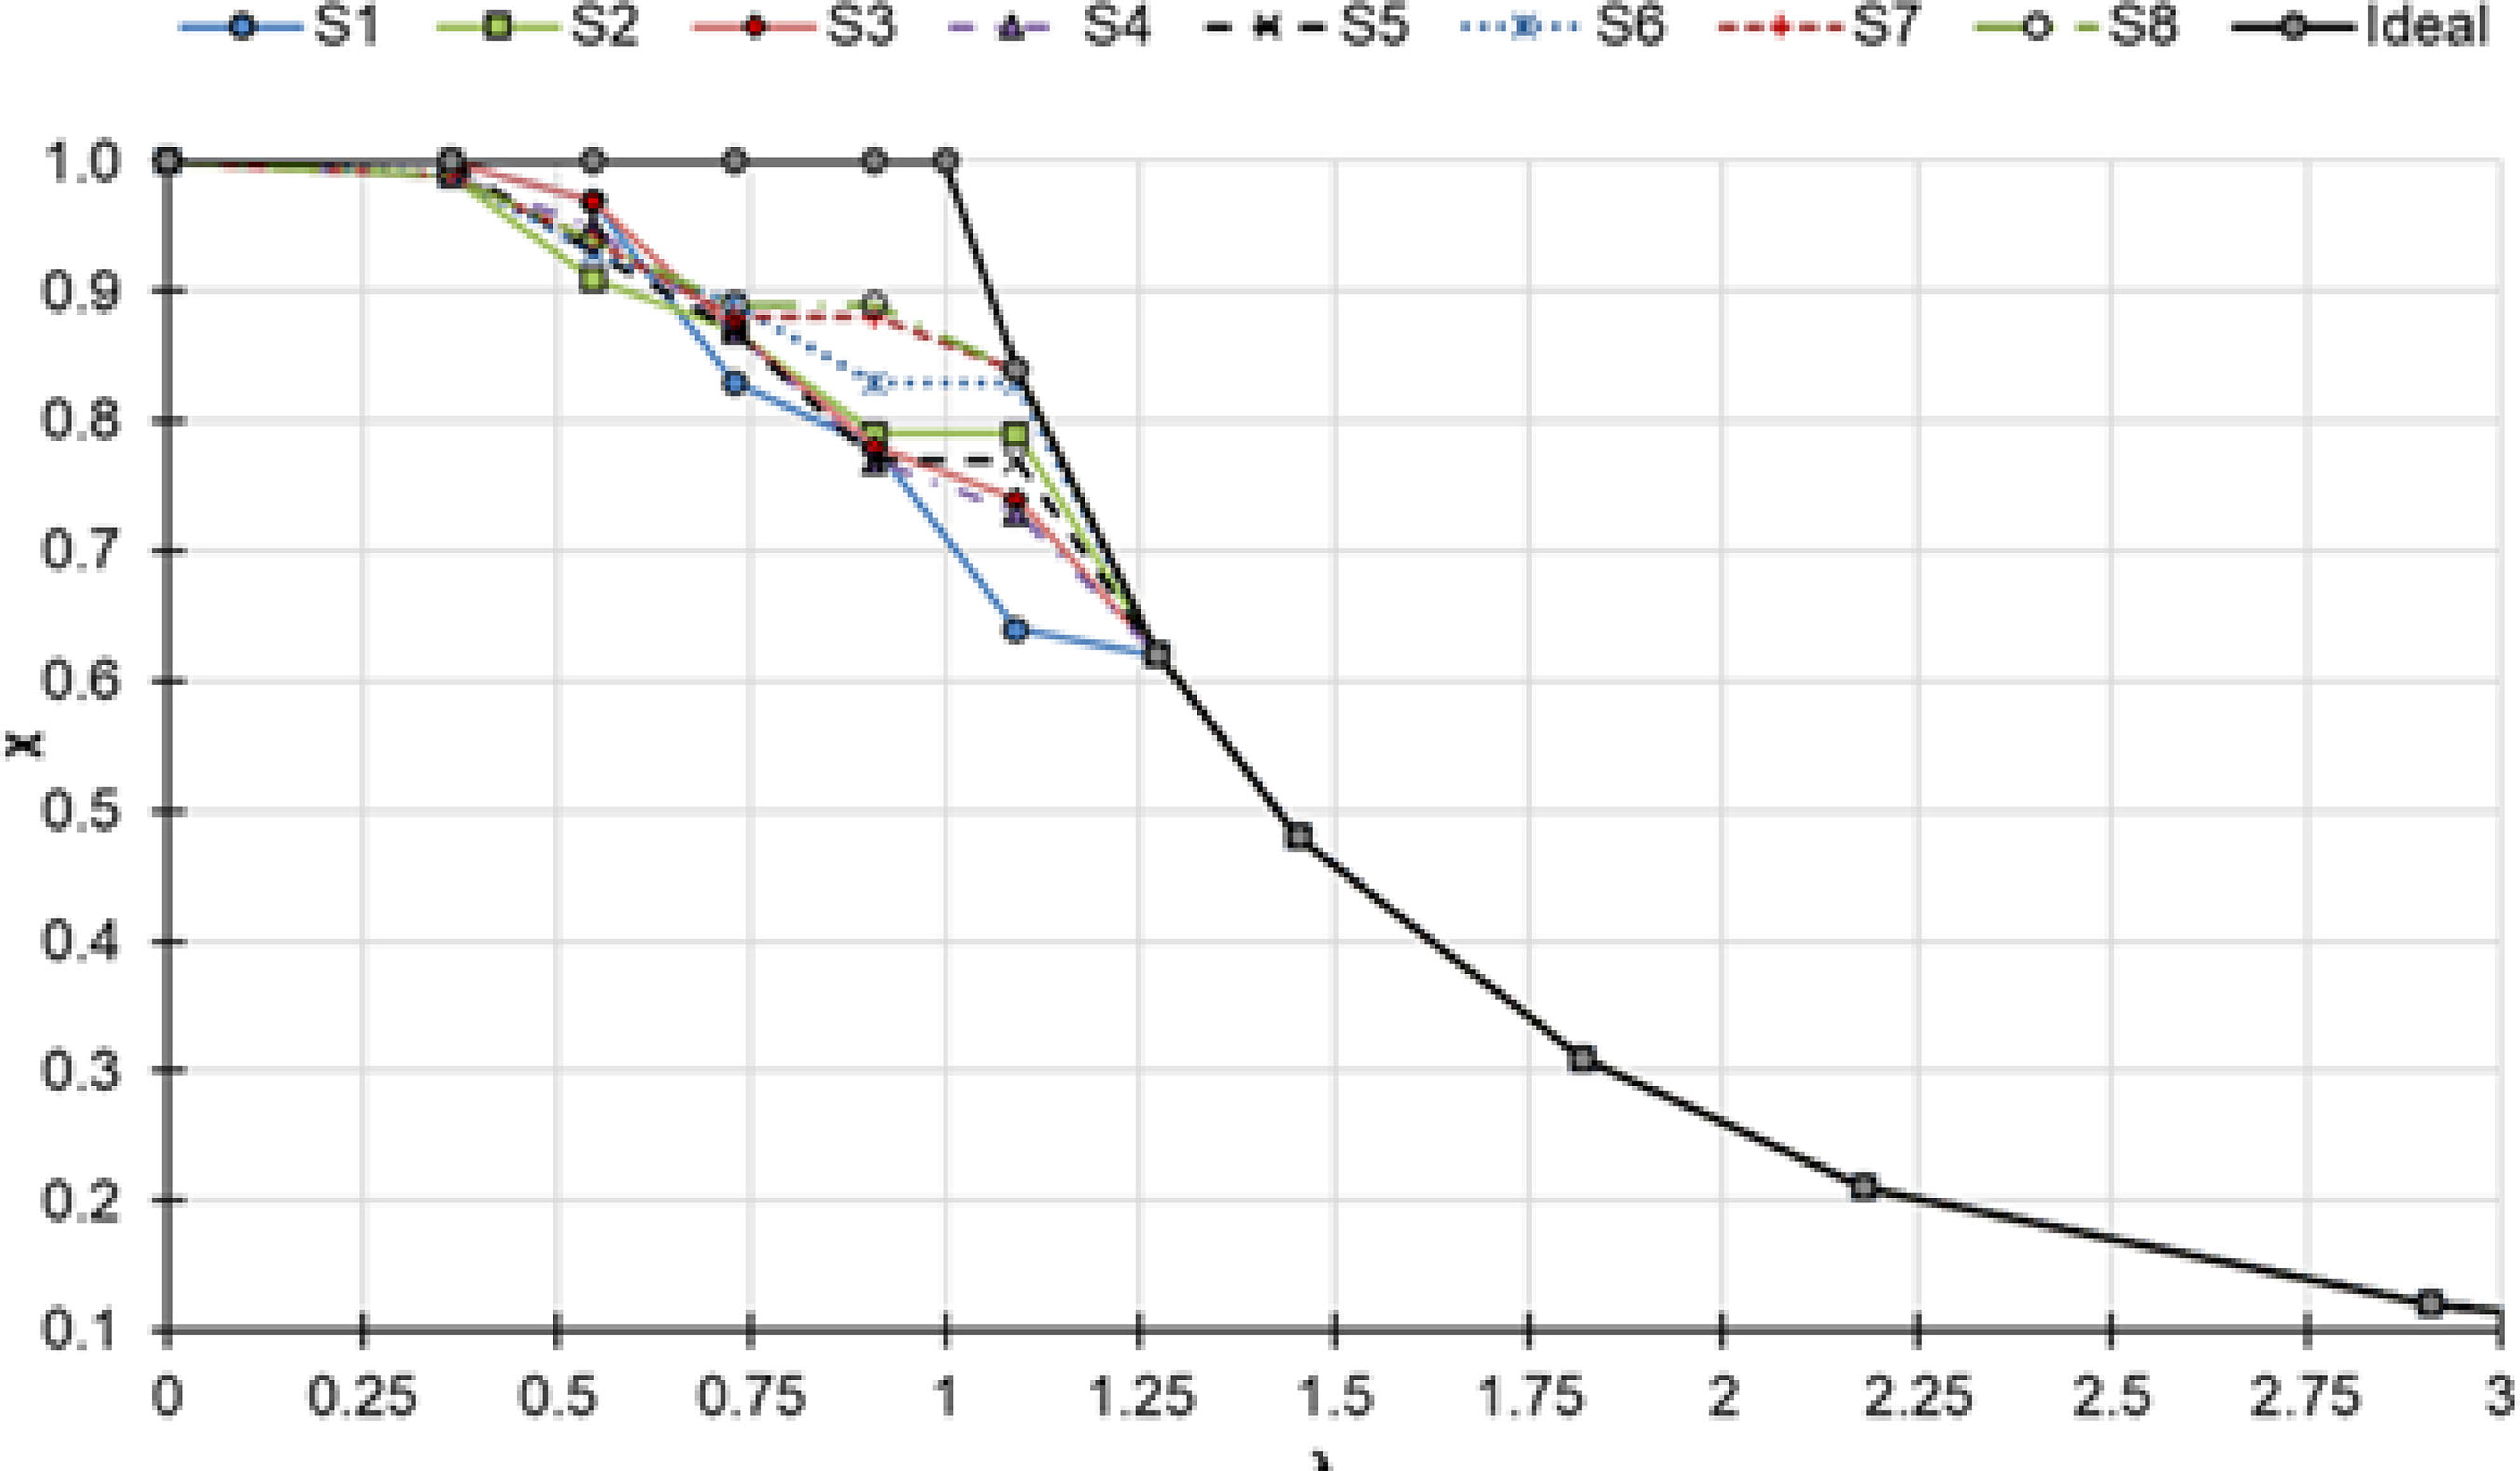
Figures 7 and 8 demonstrate similar trends for the strong axis. However, because the strong axis has a higher moment of inertia, the detrimental effect of residual stresses is less intense compared to the weak axis. Unlike buckling about the weak axis, the variation in the global buckling reduction factor among the analyzed cross-sections is less pronounced for a given normalized slenderness, especially for 𝜆0 < 0.75. In contrast, 𝜒 values for weak-axis buckling exhibit greater divergence at the same slenderness levels, reflecting the stronger influence of cross-sectional geometry in that case.

Effect of residual stresses on stability with respect to strong axis for 460 MPa HSS columns
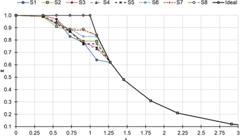
Effect of residual stresses on stability with respect to strong axis for 690 MPa HSS columns
4.5 Effect of initial geometric imperfection on stability
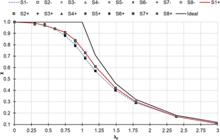
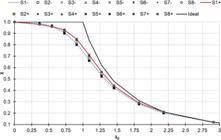
Figures 9 and 10 assess the influence of initial geometric imperfections (with amplitude equal to L/1000) on stability. It is important to note that S1+, S2+, etc., represent results for buckling about the major axis of inertia, whereas S1−, S2−, etc., correspond to buckling about the weak axis. The “ideal” case refers to columns without initial imperfections. Results confirm that imperfections significantly affect the reduction factor 𝜒, especially in intermediate slenderness regions (0.75 ≤ 𝜆0 ≤ 1.25). Although this influence is observed for both steel grades, the 460 MPa columns exhibit a more pronounced sensitivity to geometric imperfections. Interestingly, the relative drop in 𝜒 due to imperfections appears more consistent across sections and less dependent on profile geometry than in the case of residual stresses. This underscores the universal need to properly model and account for geometric imperfections regardless of section type.
4.6 Numerical results for the axis with the smallest moment of inertia
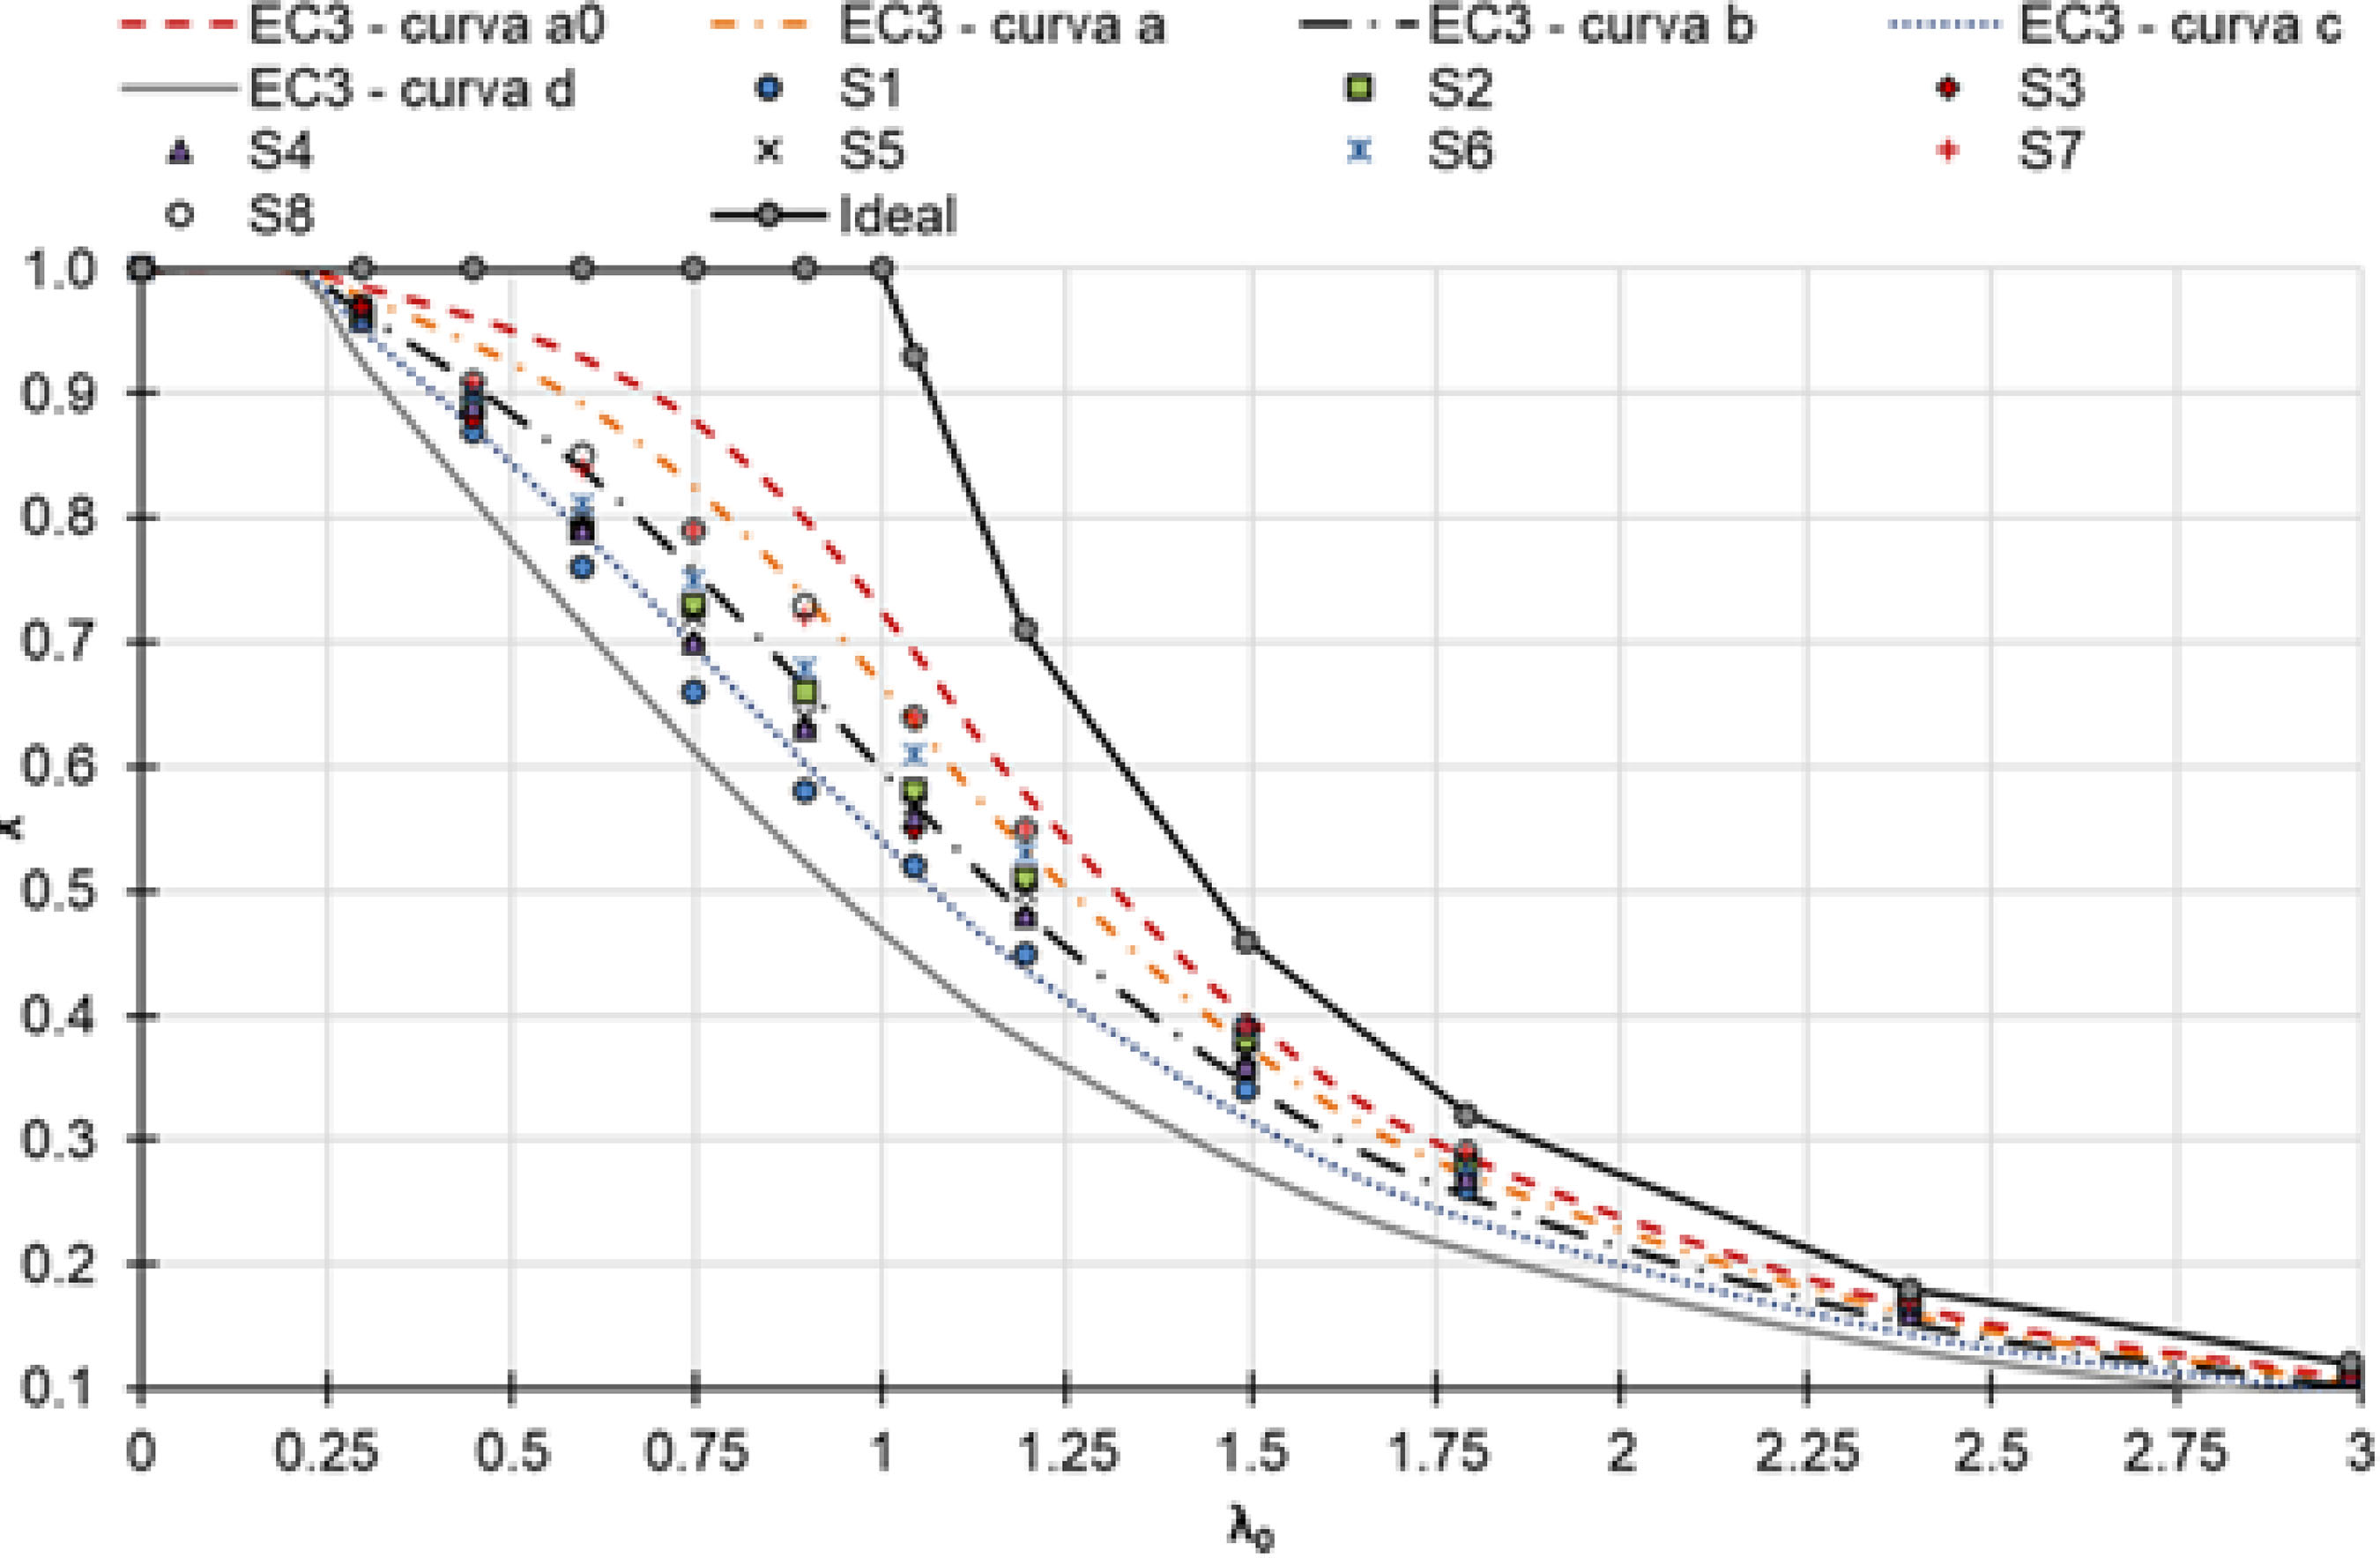
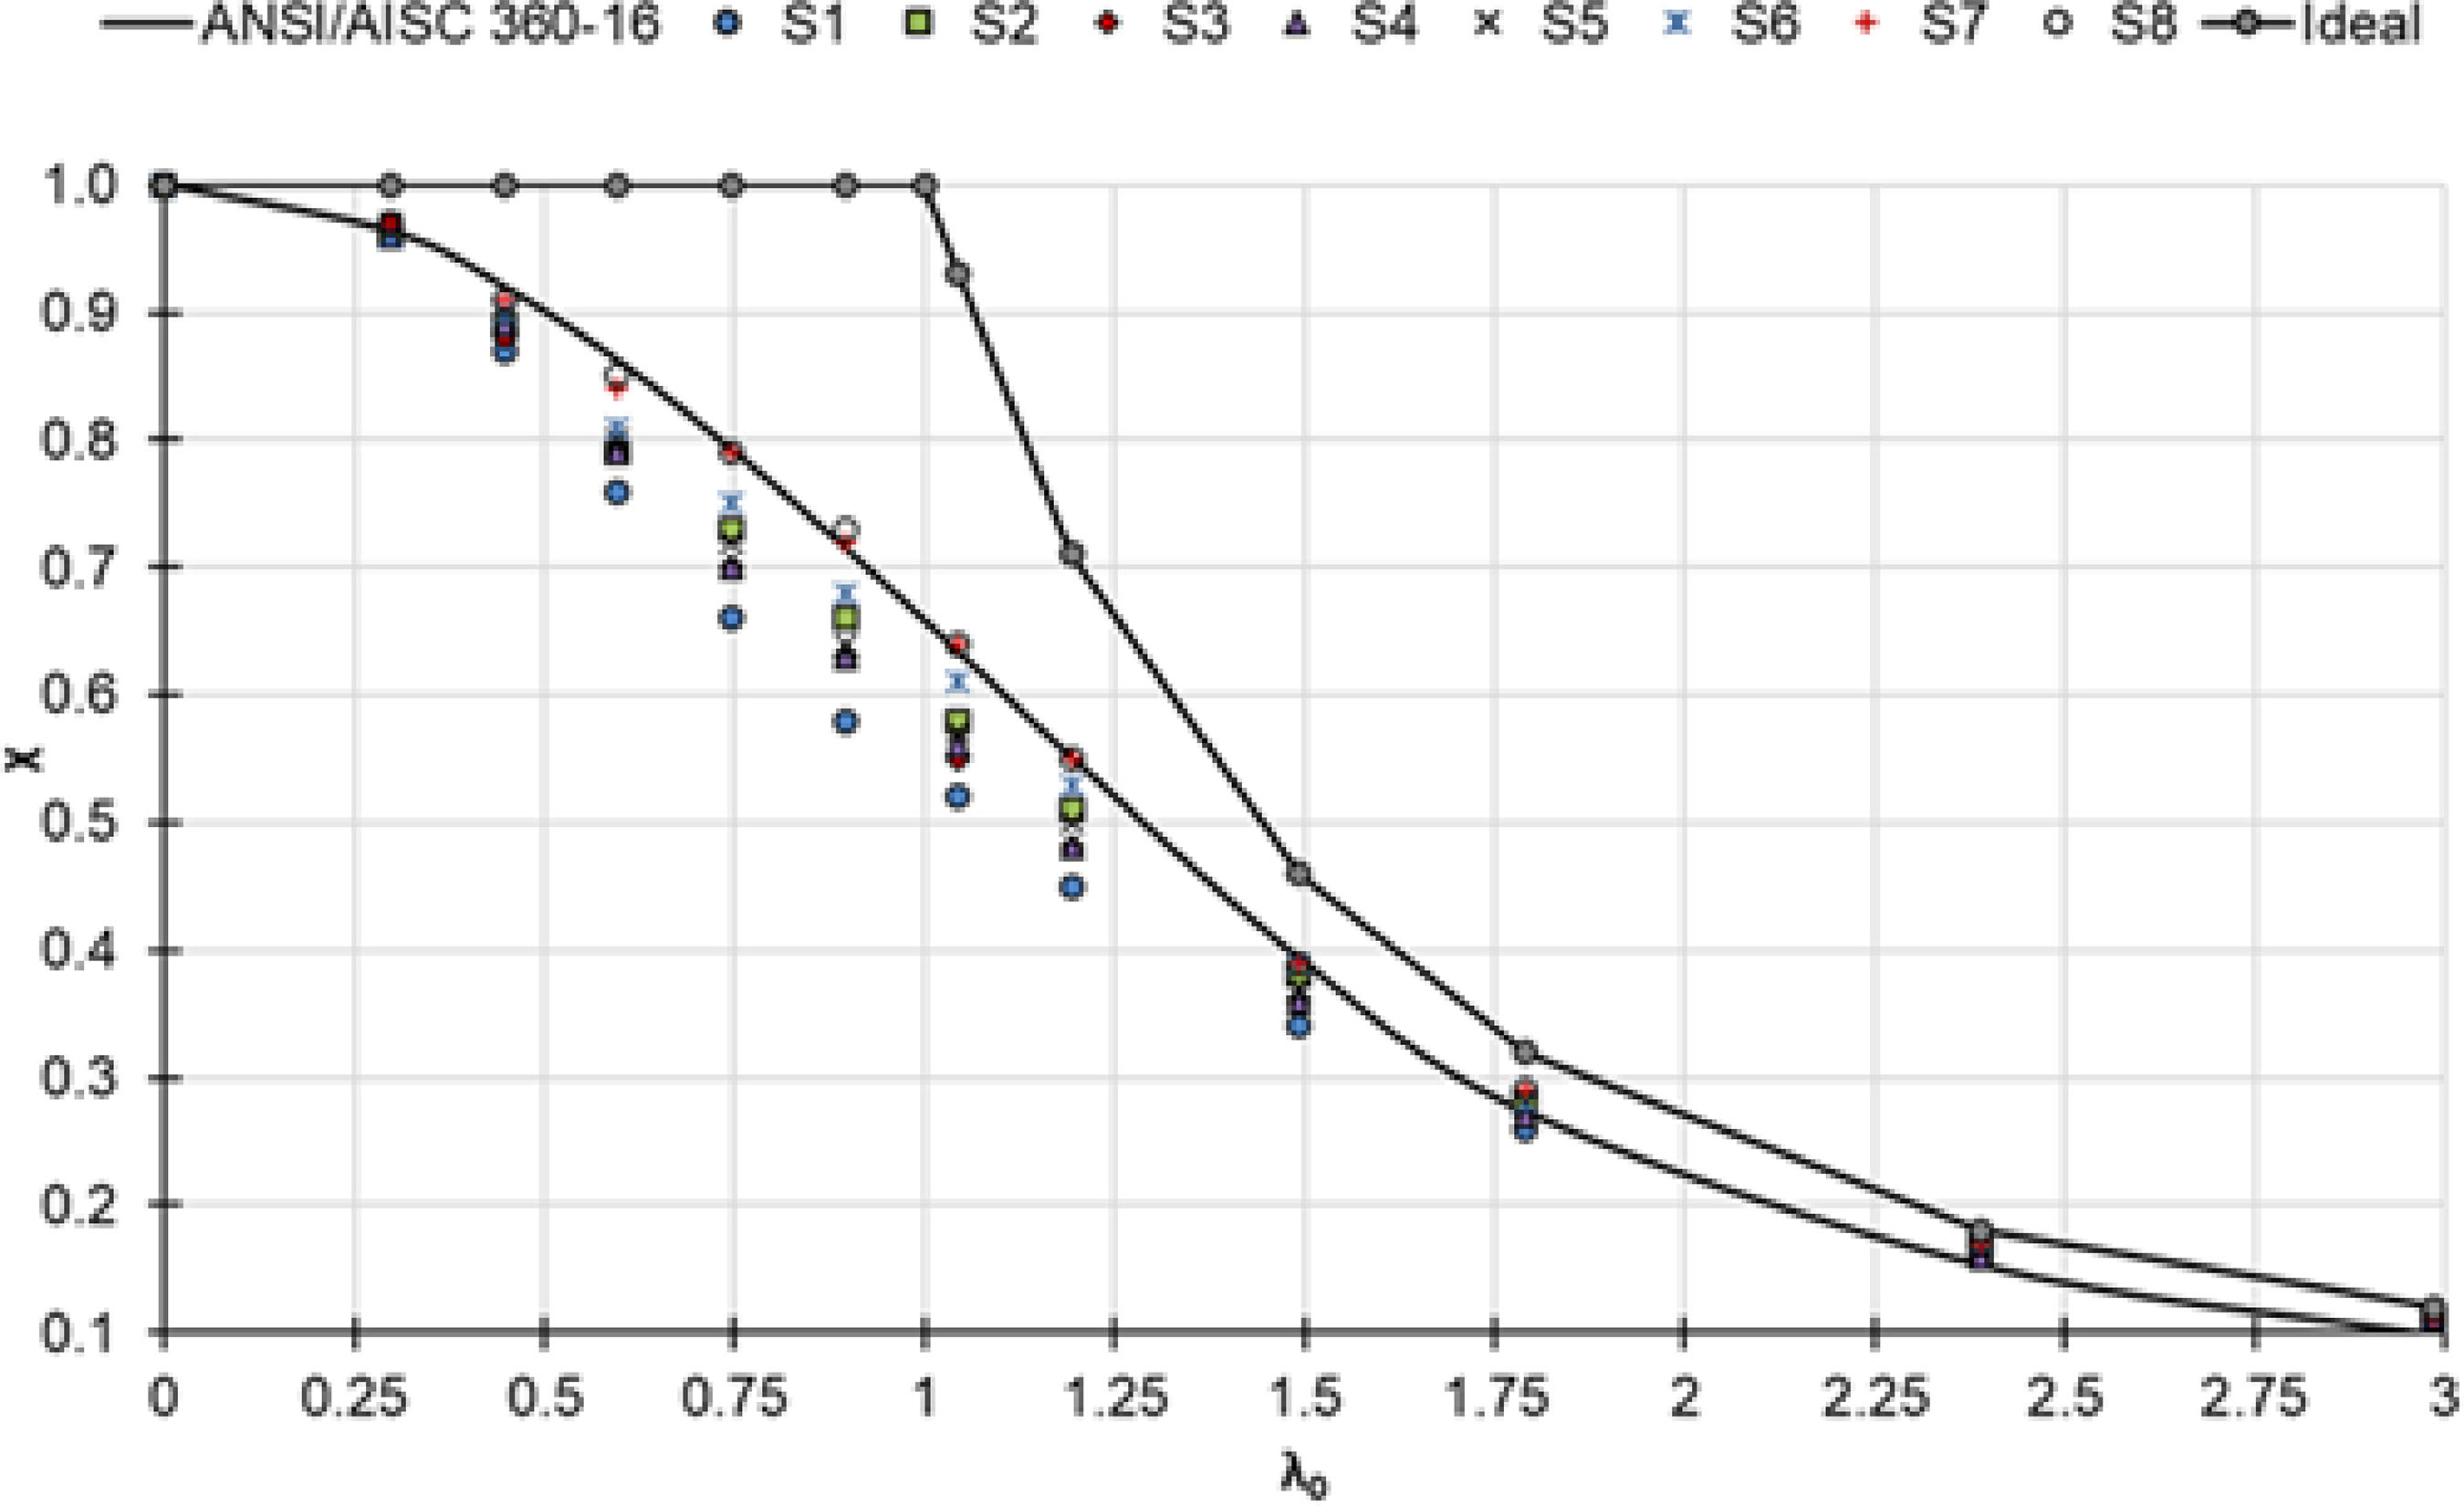
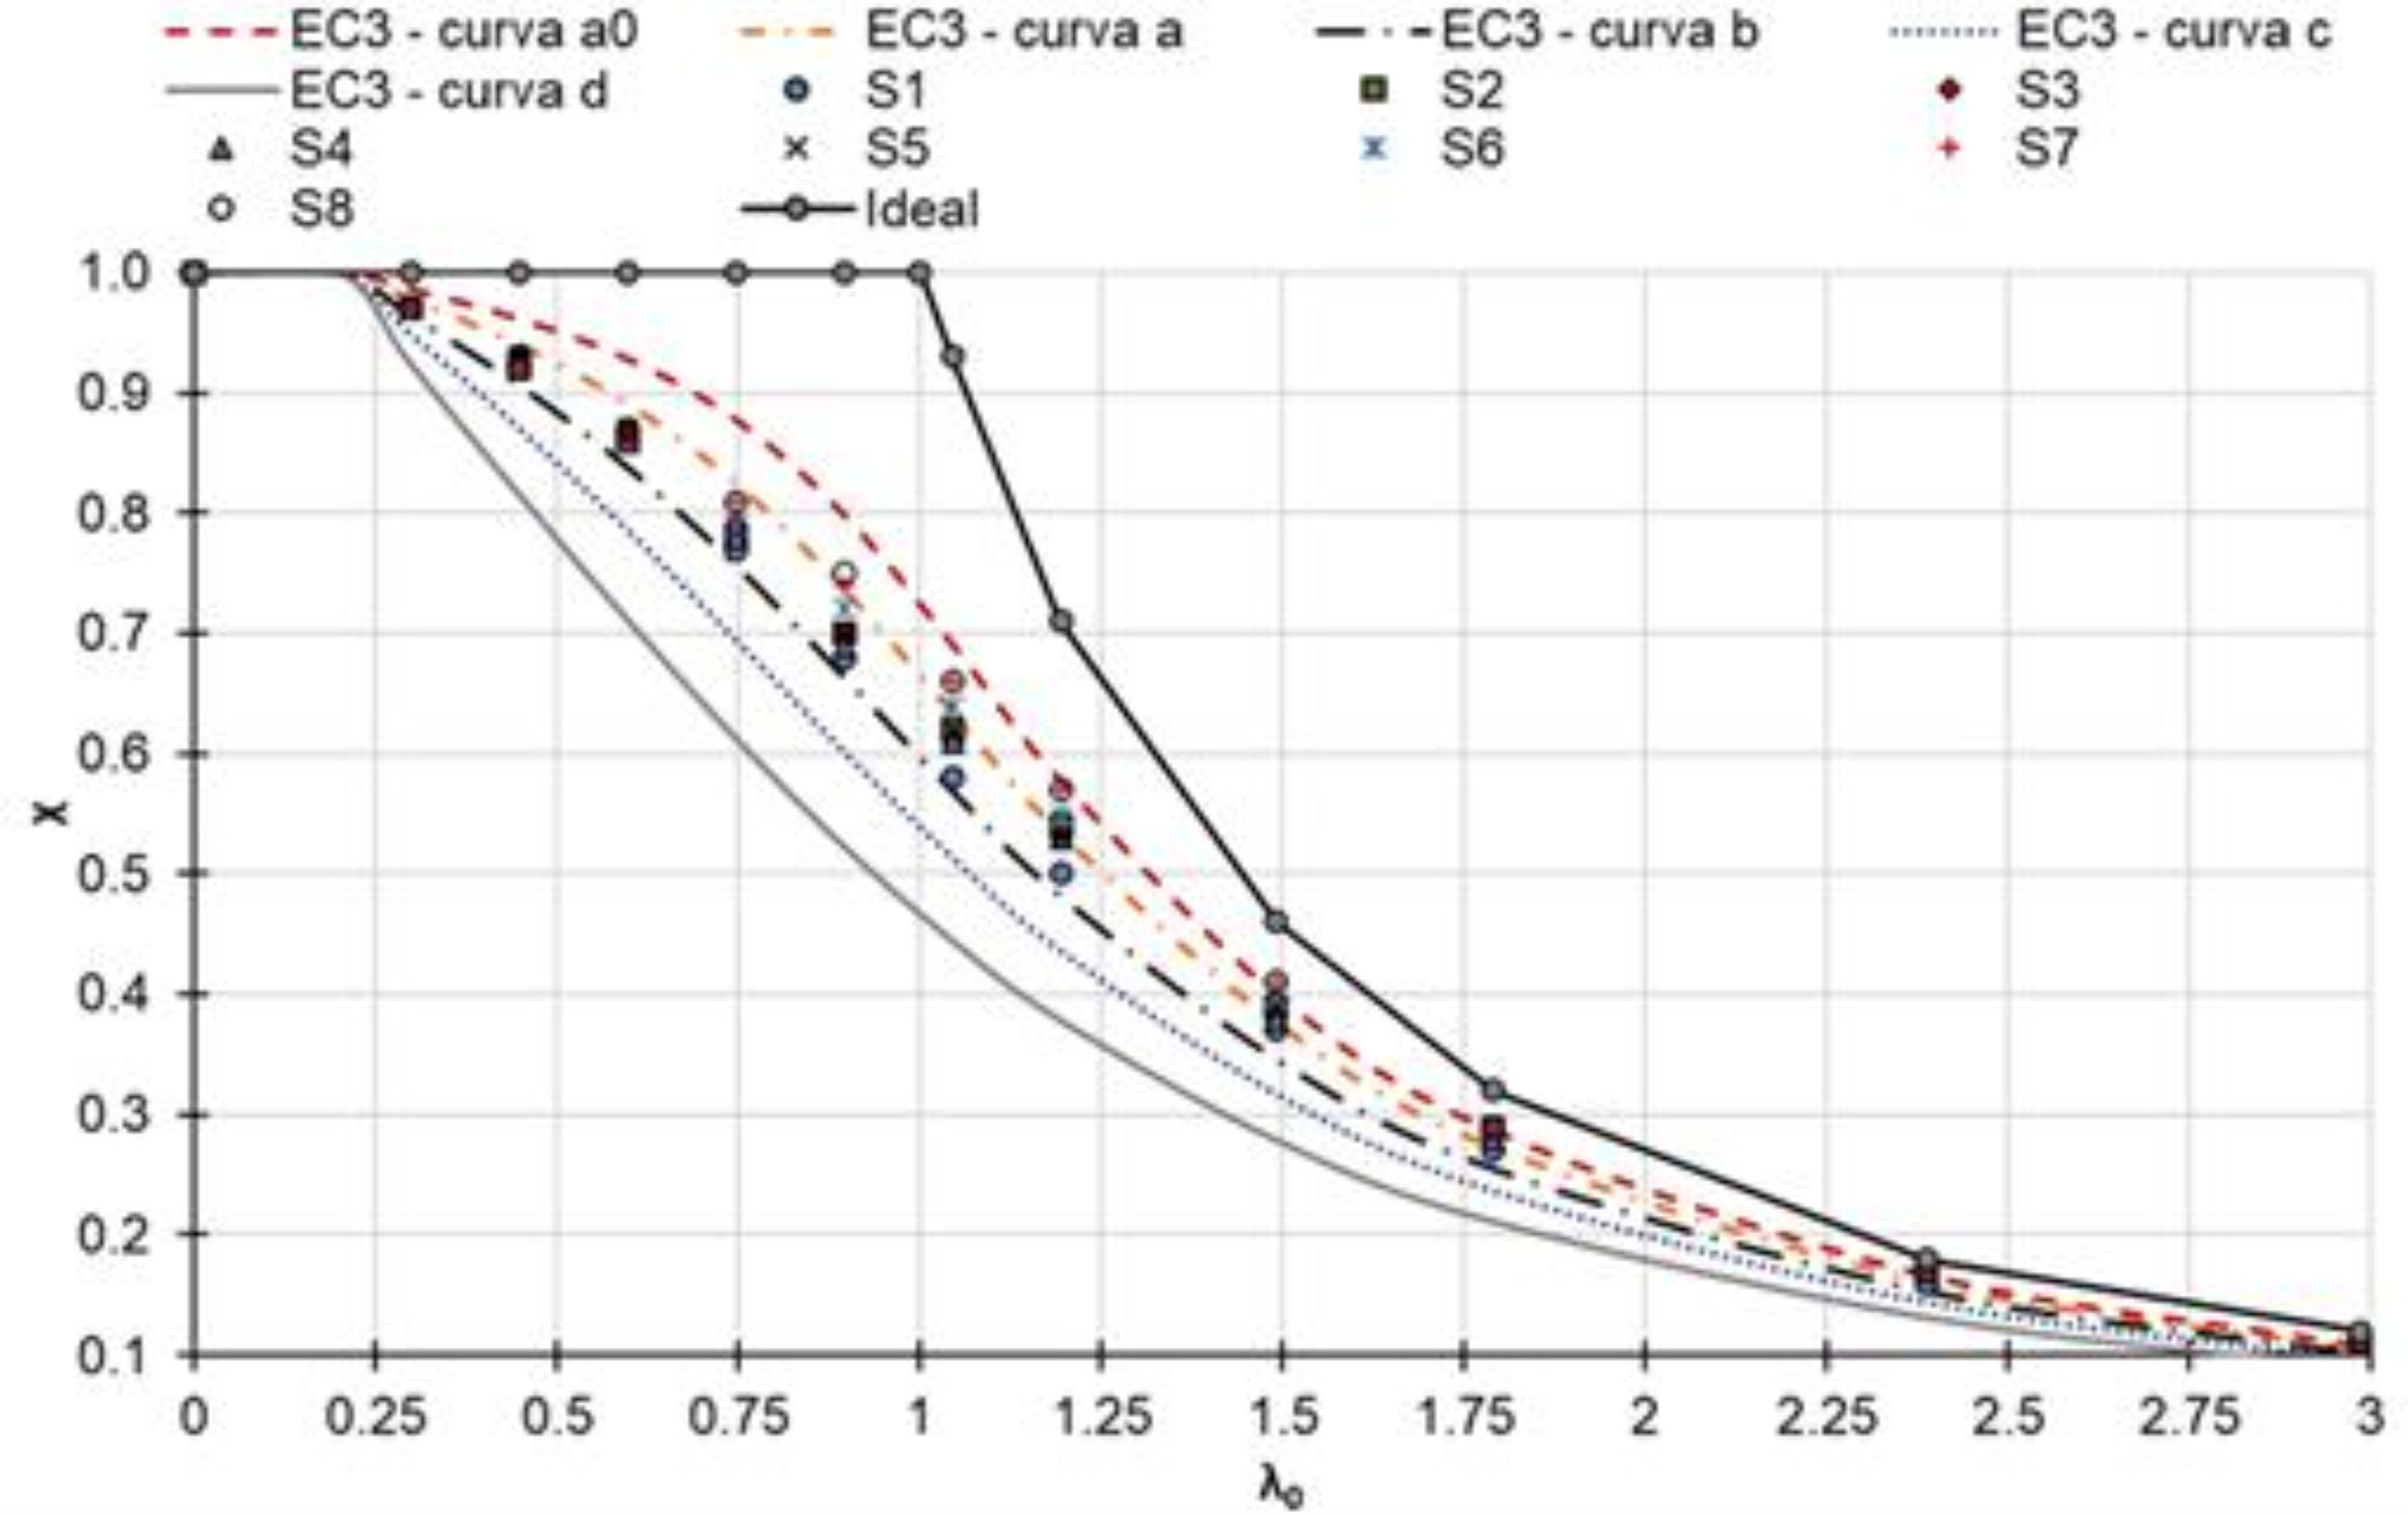
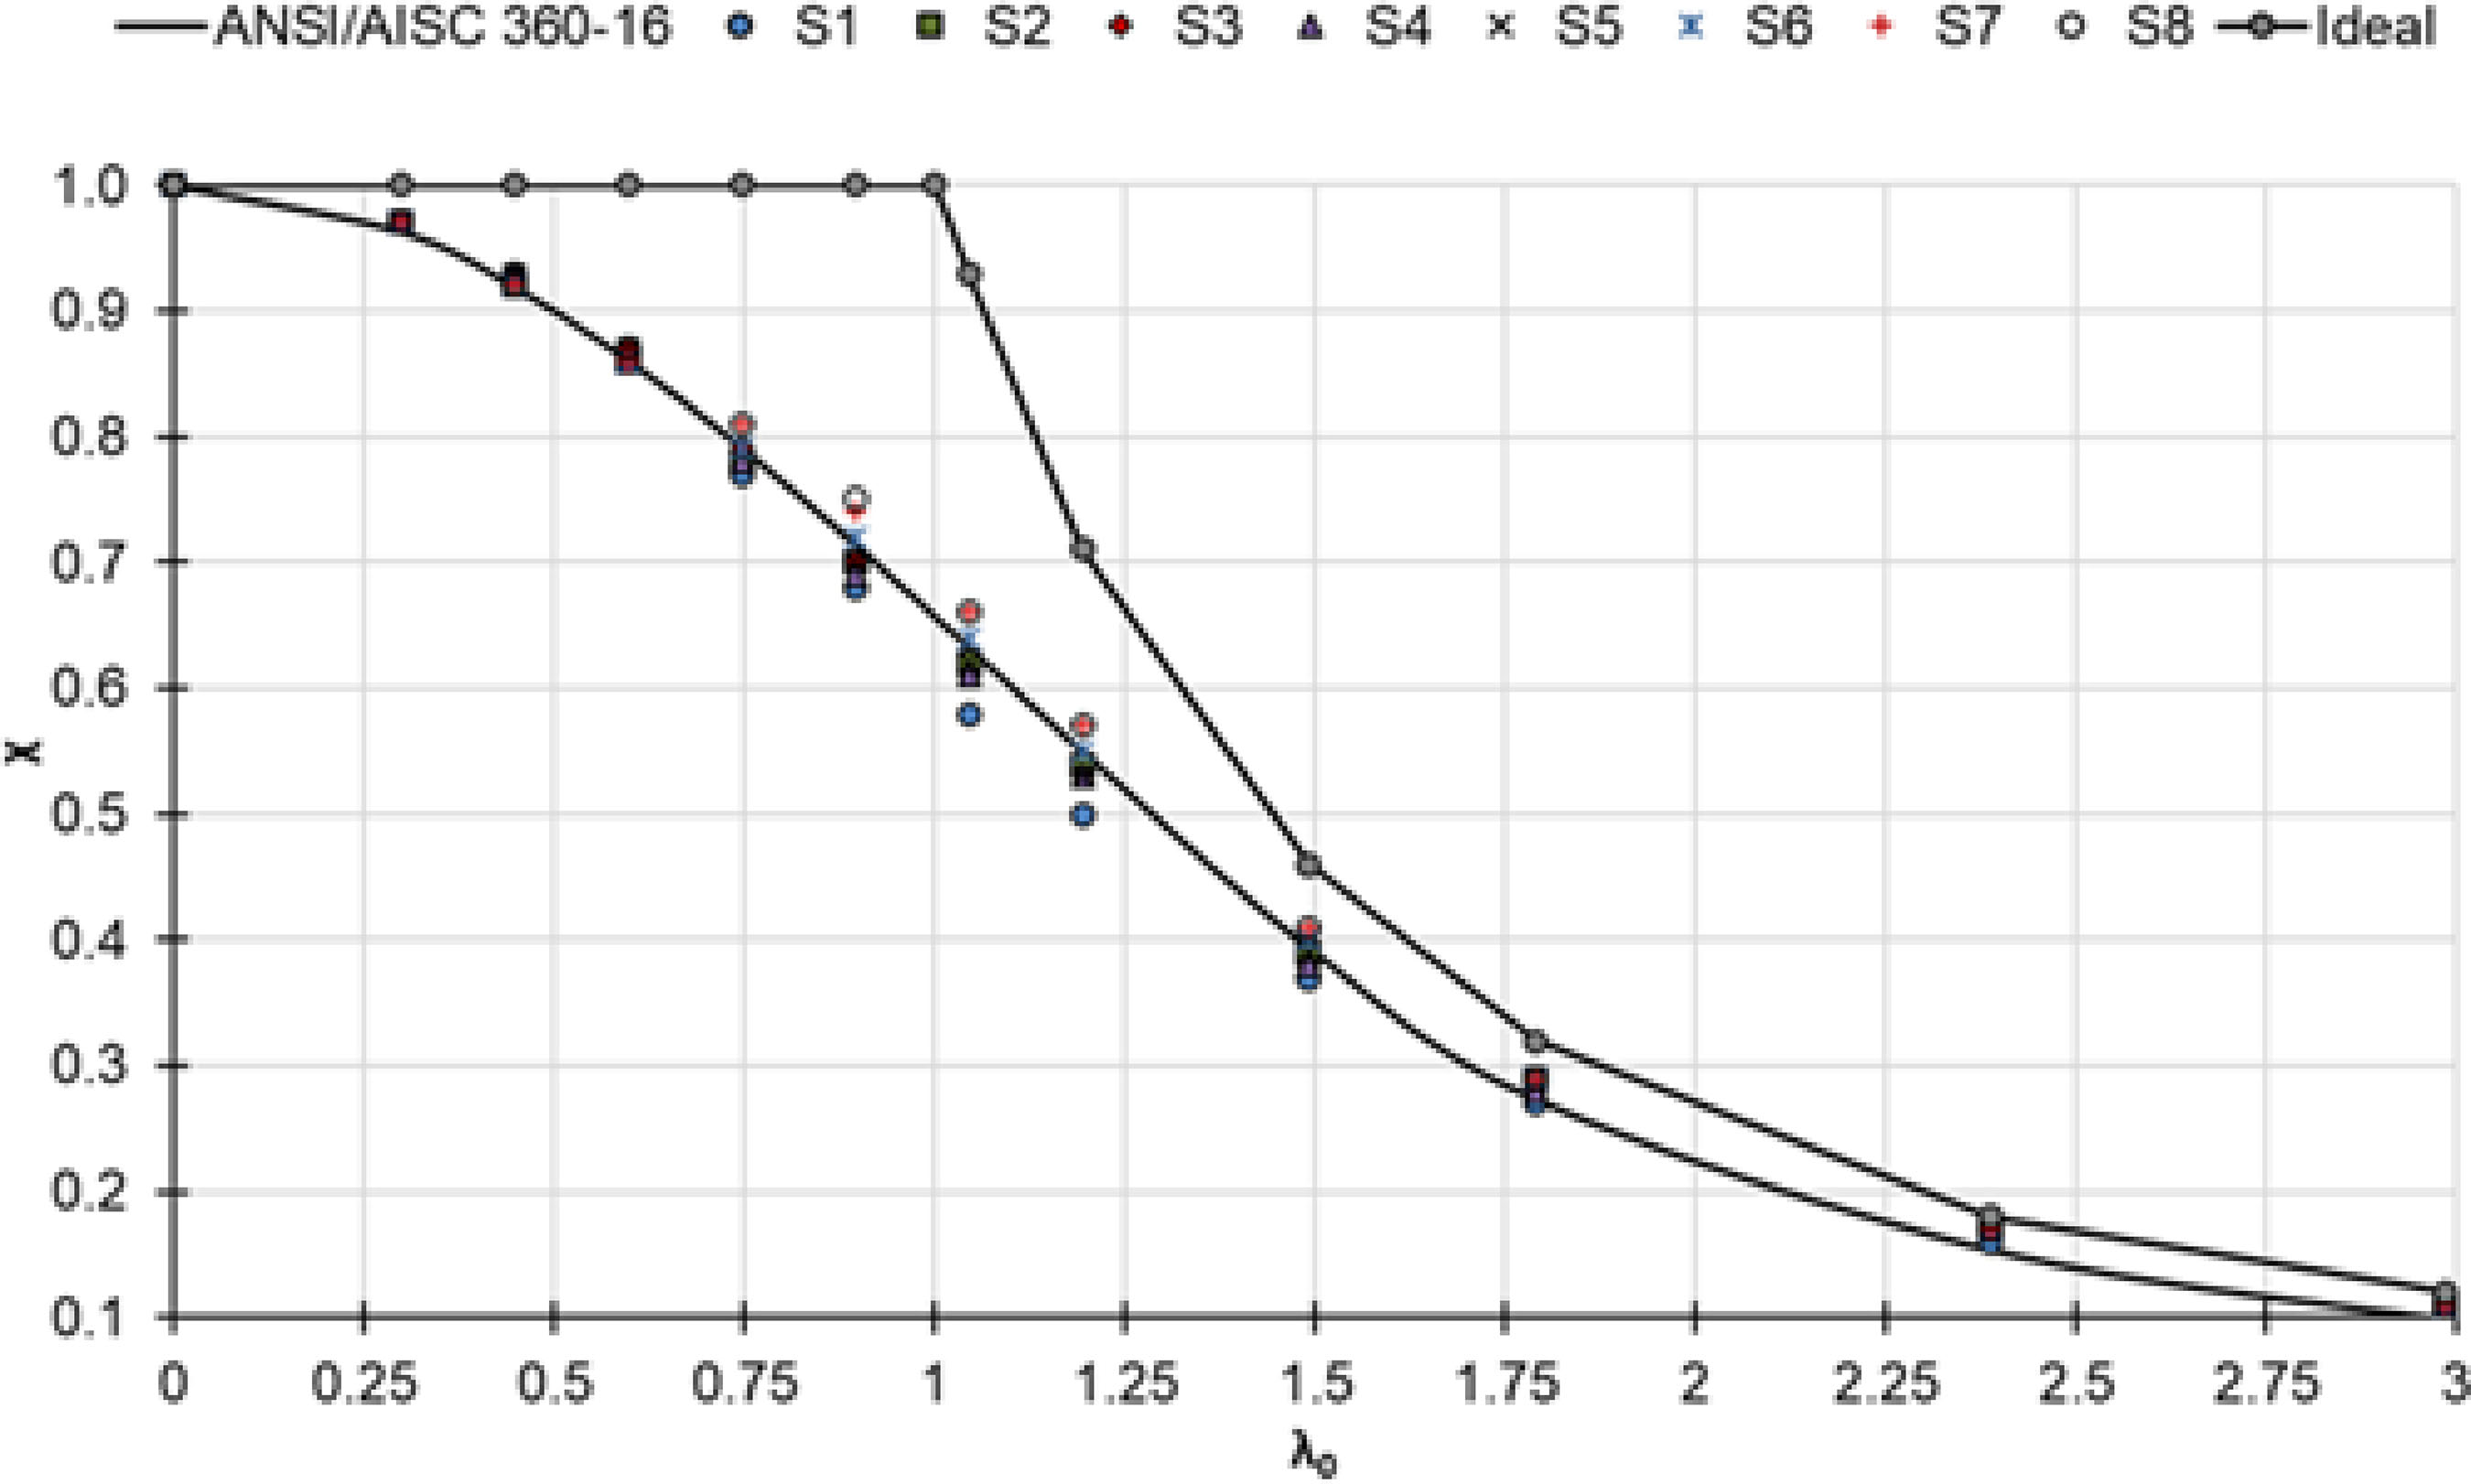
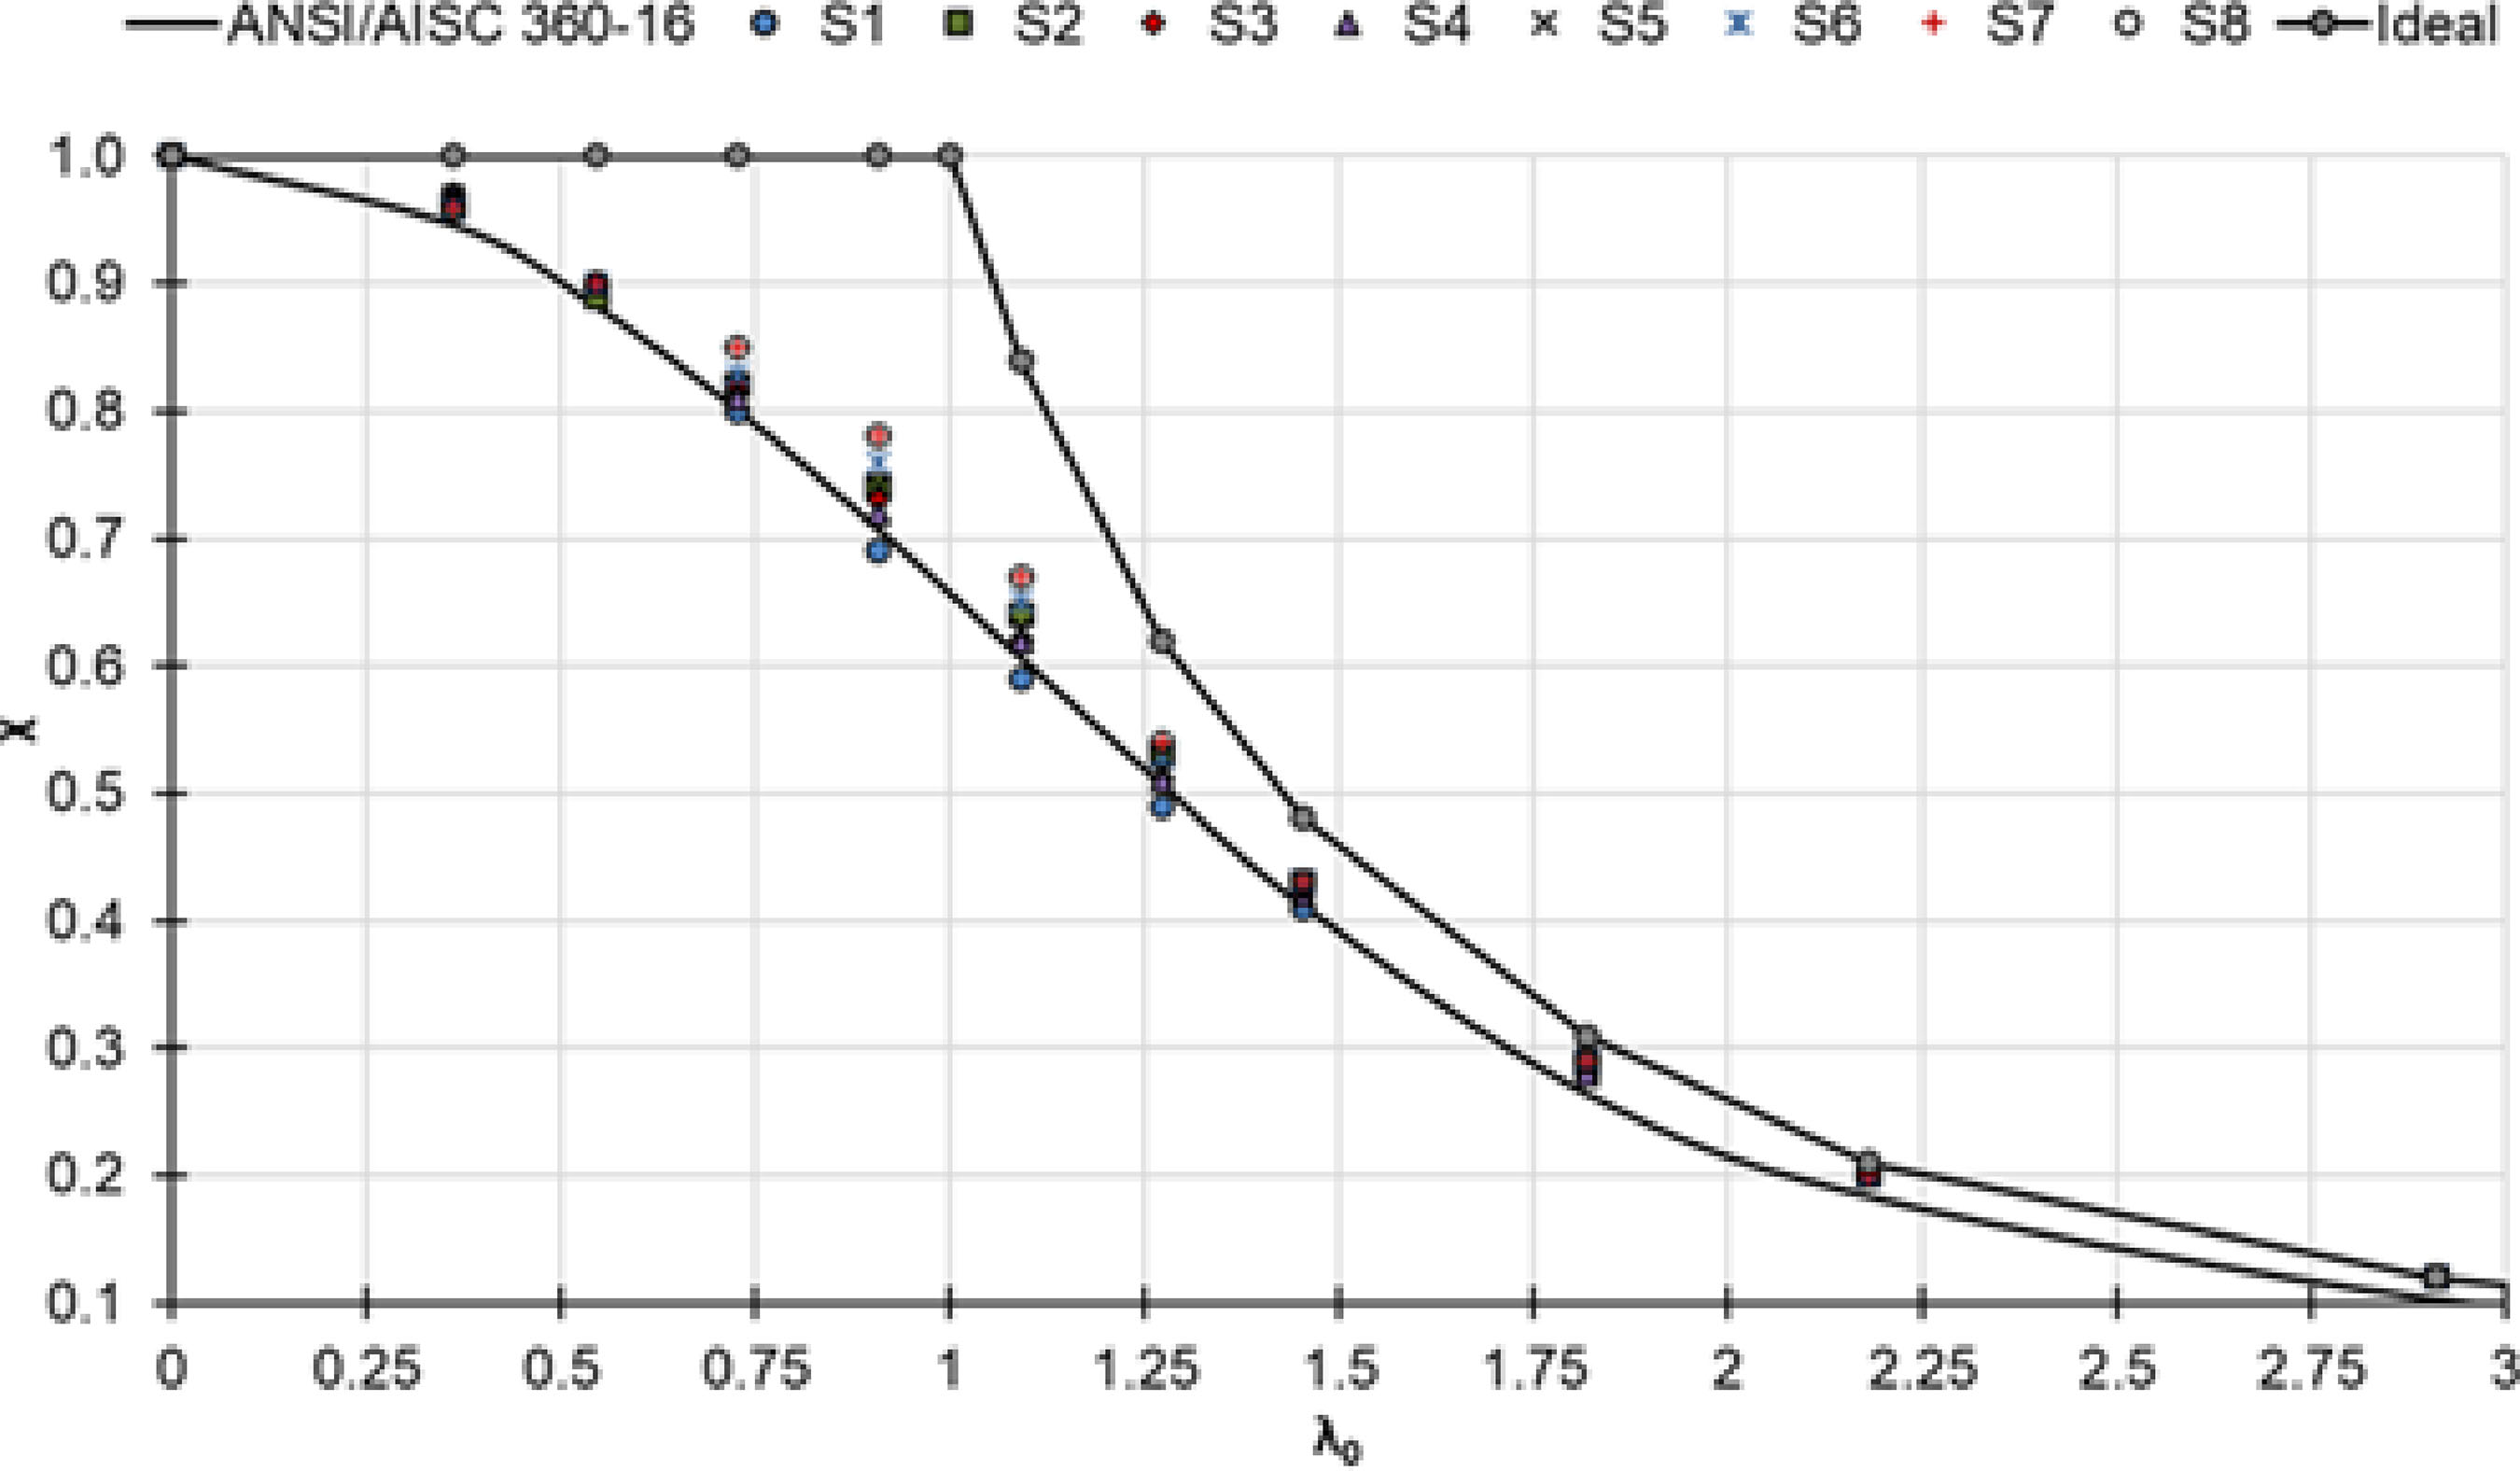
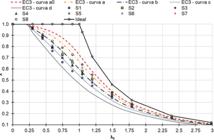
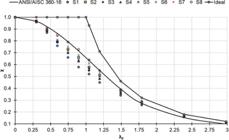
Figures 11 and 12 present comparisons between numerical results for 460 MPa columns, considering buckling around the weak axis, and the buckling curves defined by Eurocode 3 (ECS, 2005) and ANSI/AISC 360-16 (AISC, 2016). Figure 11 indicates that curve c of Eurocode 3 (EC3) (ECS, 2005), which is recommended for this case (𝑡𝑓 ≤ 40 𝑚𝑚), generally yields conservative predictions across the entire slenderness range, with the exception of section S1, likely due to its smaller cross-sectional dimensions. Furthermore, the analysis of Fig. 12 highlights the limitations of adopting a single buckling curve to represent the structural behavior of HSS columns under weak-axis buckling.
Comparison of numerical results for HSS 460 MPa with Eurocode 3 design curves for the weak axis
Comparison of numerical results for HSS 460 MPa with ANSI/AISC 360-16 design curve for the weak axis
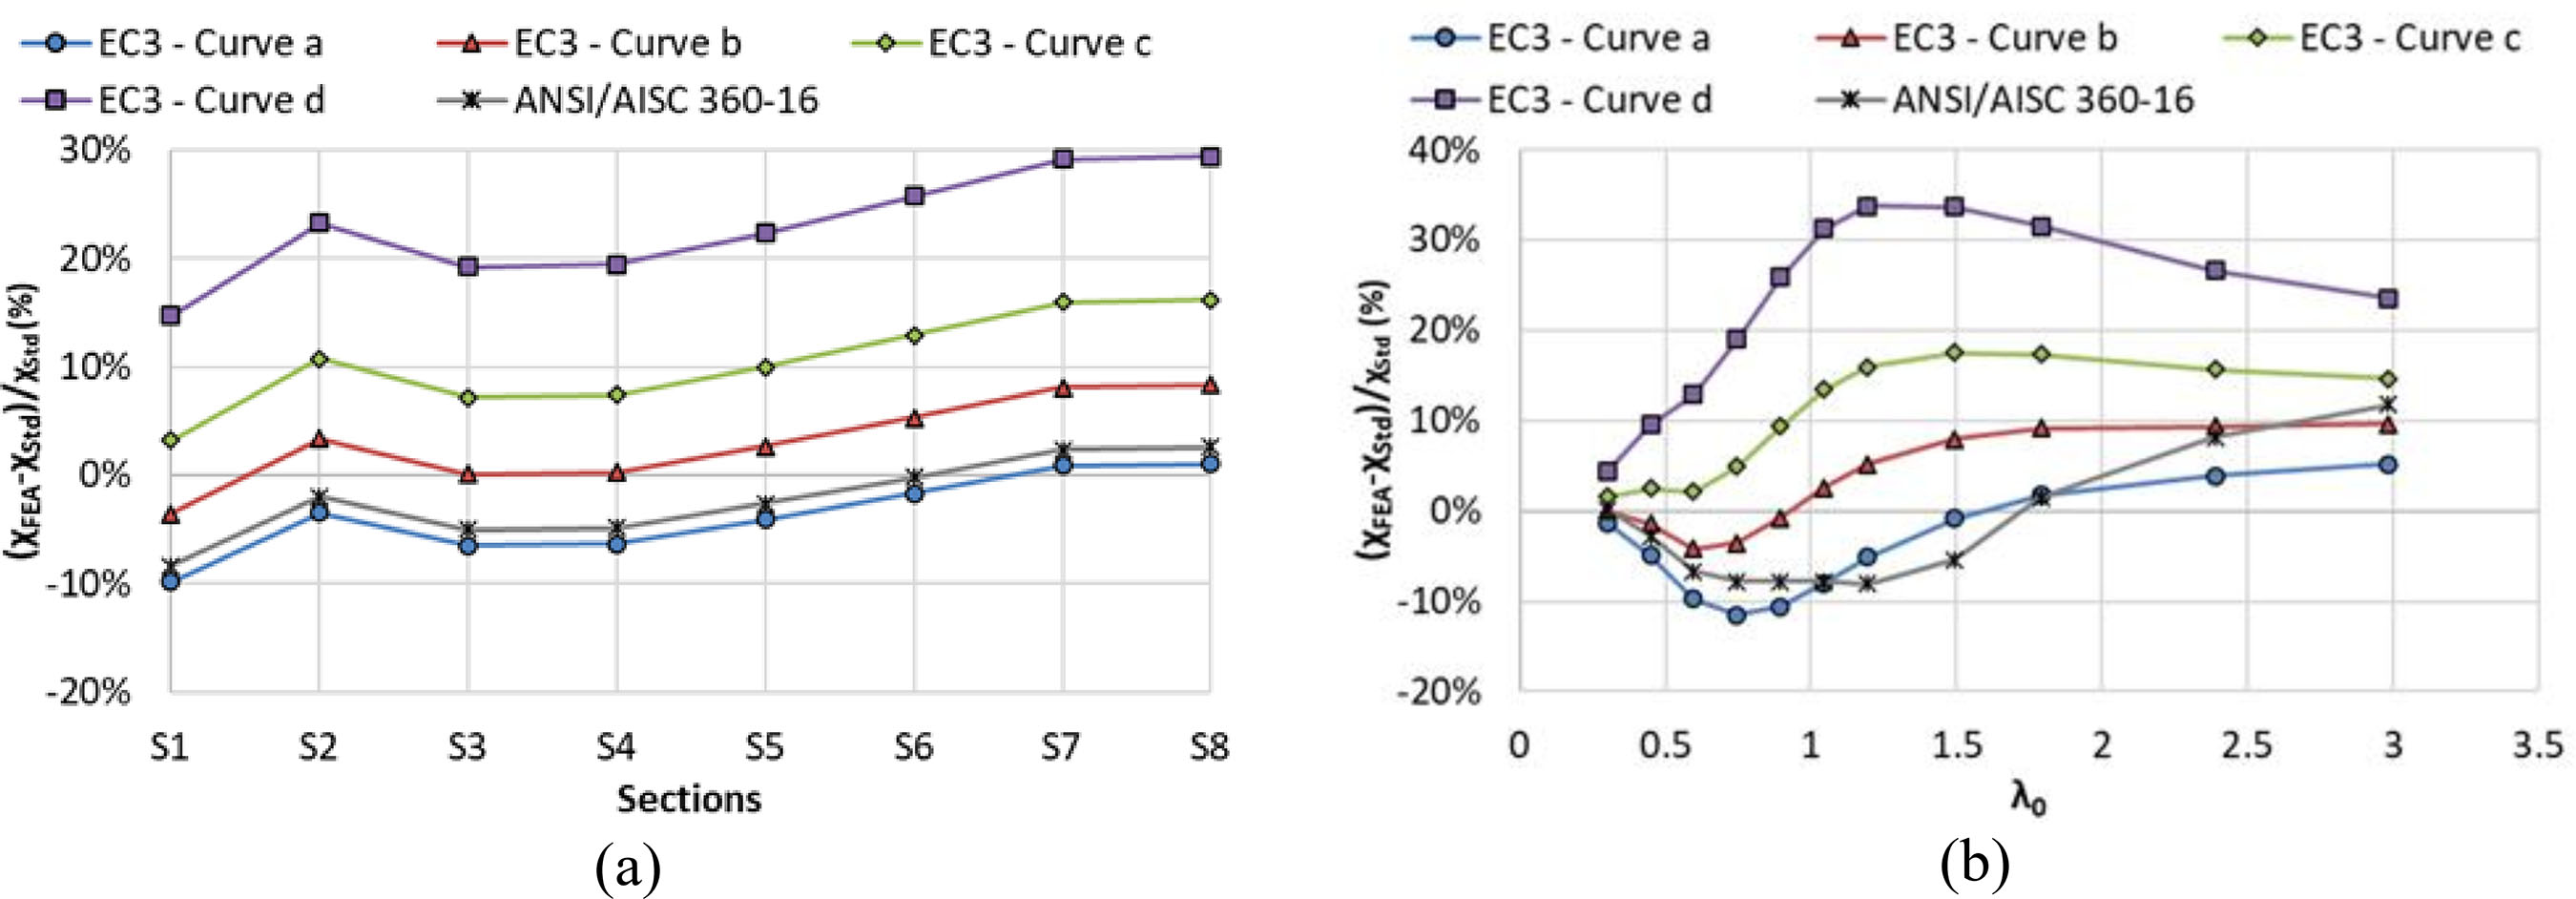
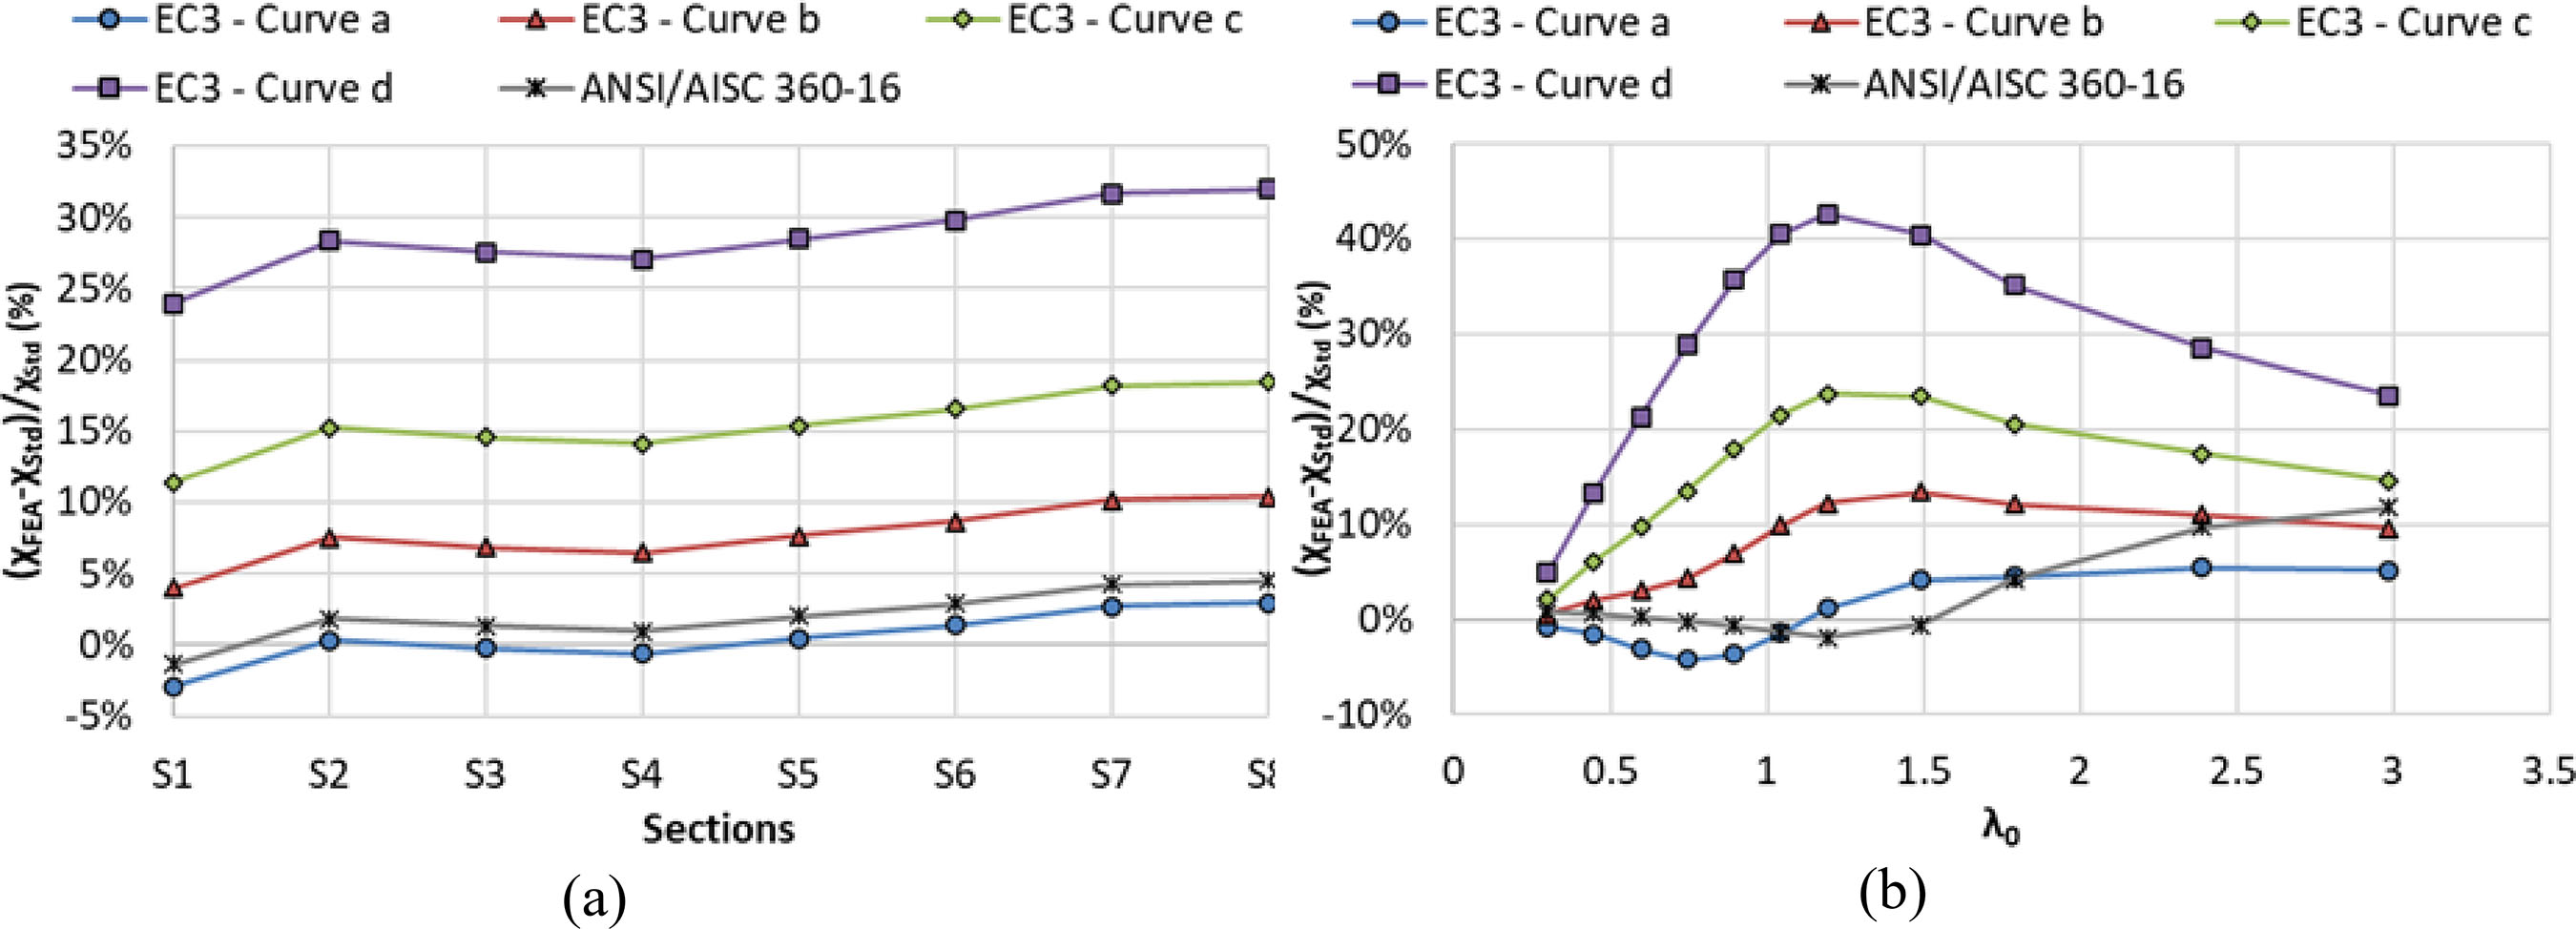
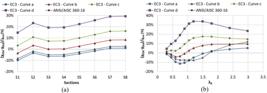
Figures 13(a) and 13(b) present the average values of the relative difference between the buckling reduction factors obtained from finite element analysis (𝜒𝐹𝐸𝐴) and those predicted by the design standards (𝜒Std), for 460 MPa steel columns, considering buckling about the weak axis. In Figure 13(a), the discrepancies are presented for various cross-sections (S1 to S8), while Figure 13(b) illustrates the relative differences as a function of the non-dimensional slenderness parameter (𝜆0). It is observed that, in most cases, the buckling reduction factors predicted by ANSI/AISC are greater than those obtained from FEA when analyzing the average values calculated for each cross-section and normalized slenderness ratio. Furthermore, the results suggest that Eurocode buckling curve b could be suitably applied to the design of the 460 MPa HSS columns with 𝜆0 > 1.0 to achieve a less conservative design approach compared to curve c, for buckling about the weak axis.
Percentage difference between FEA results for 460 MPa HSS and standard curves for the weak axis
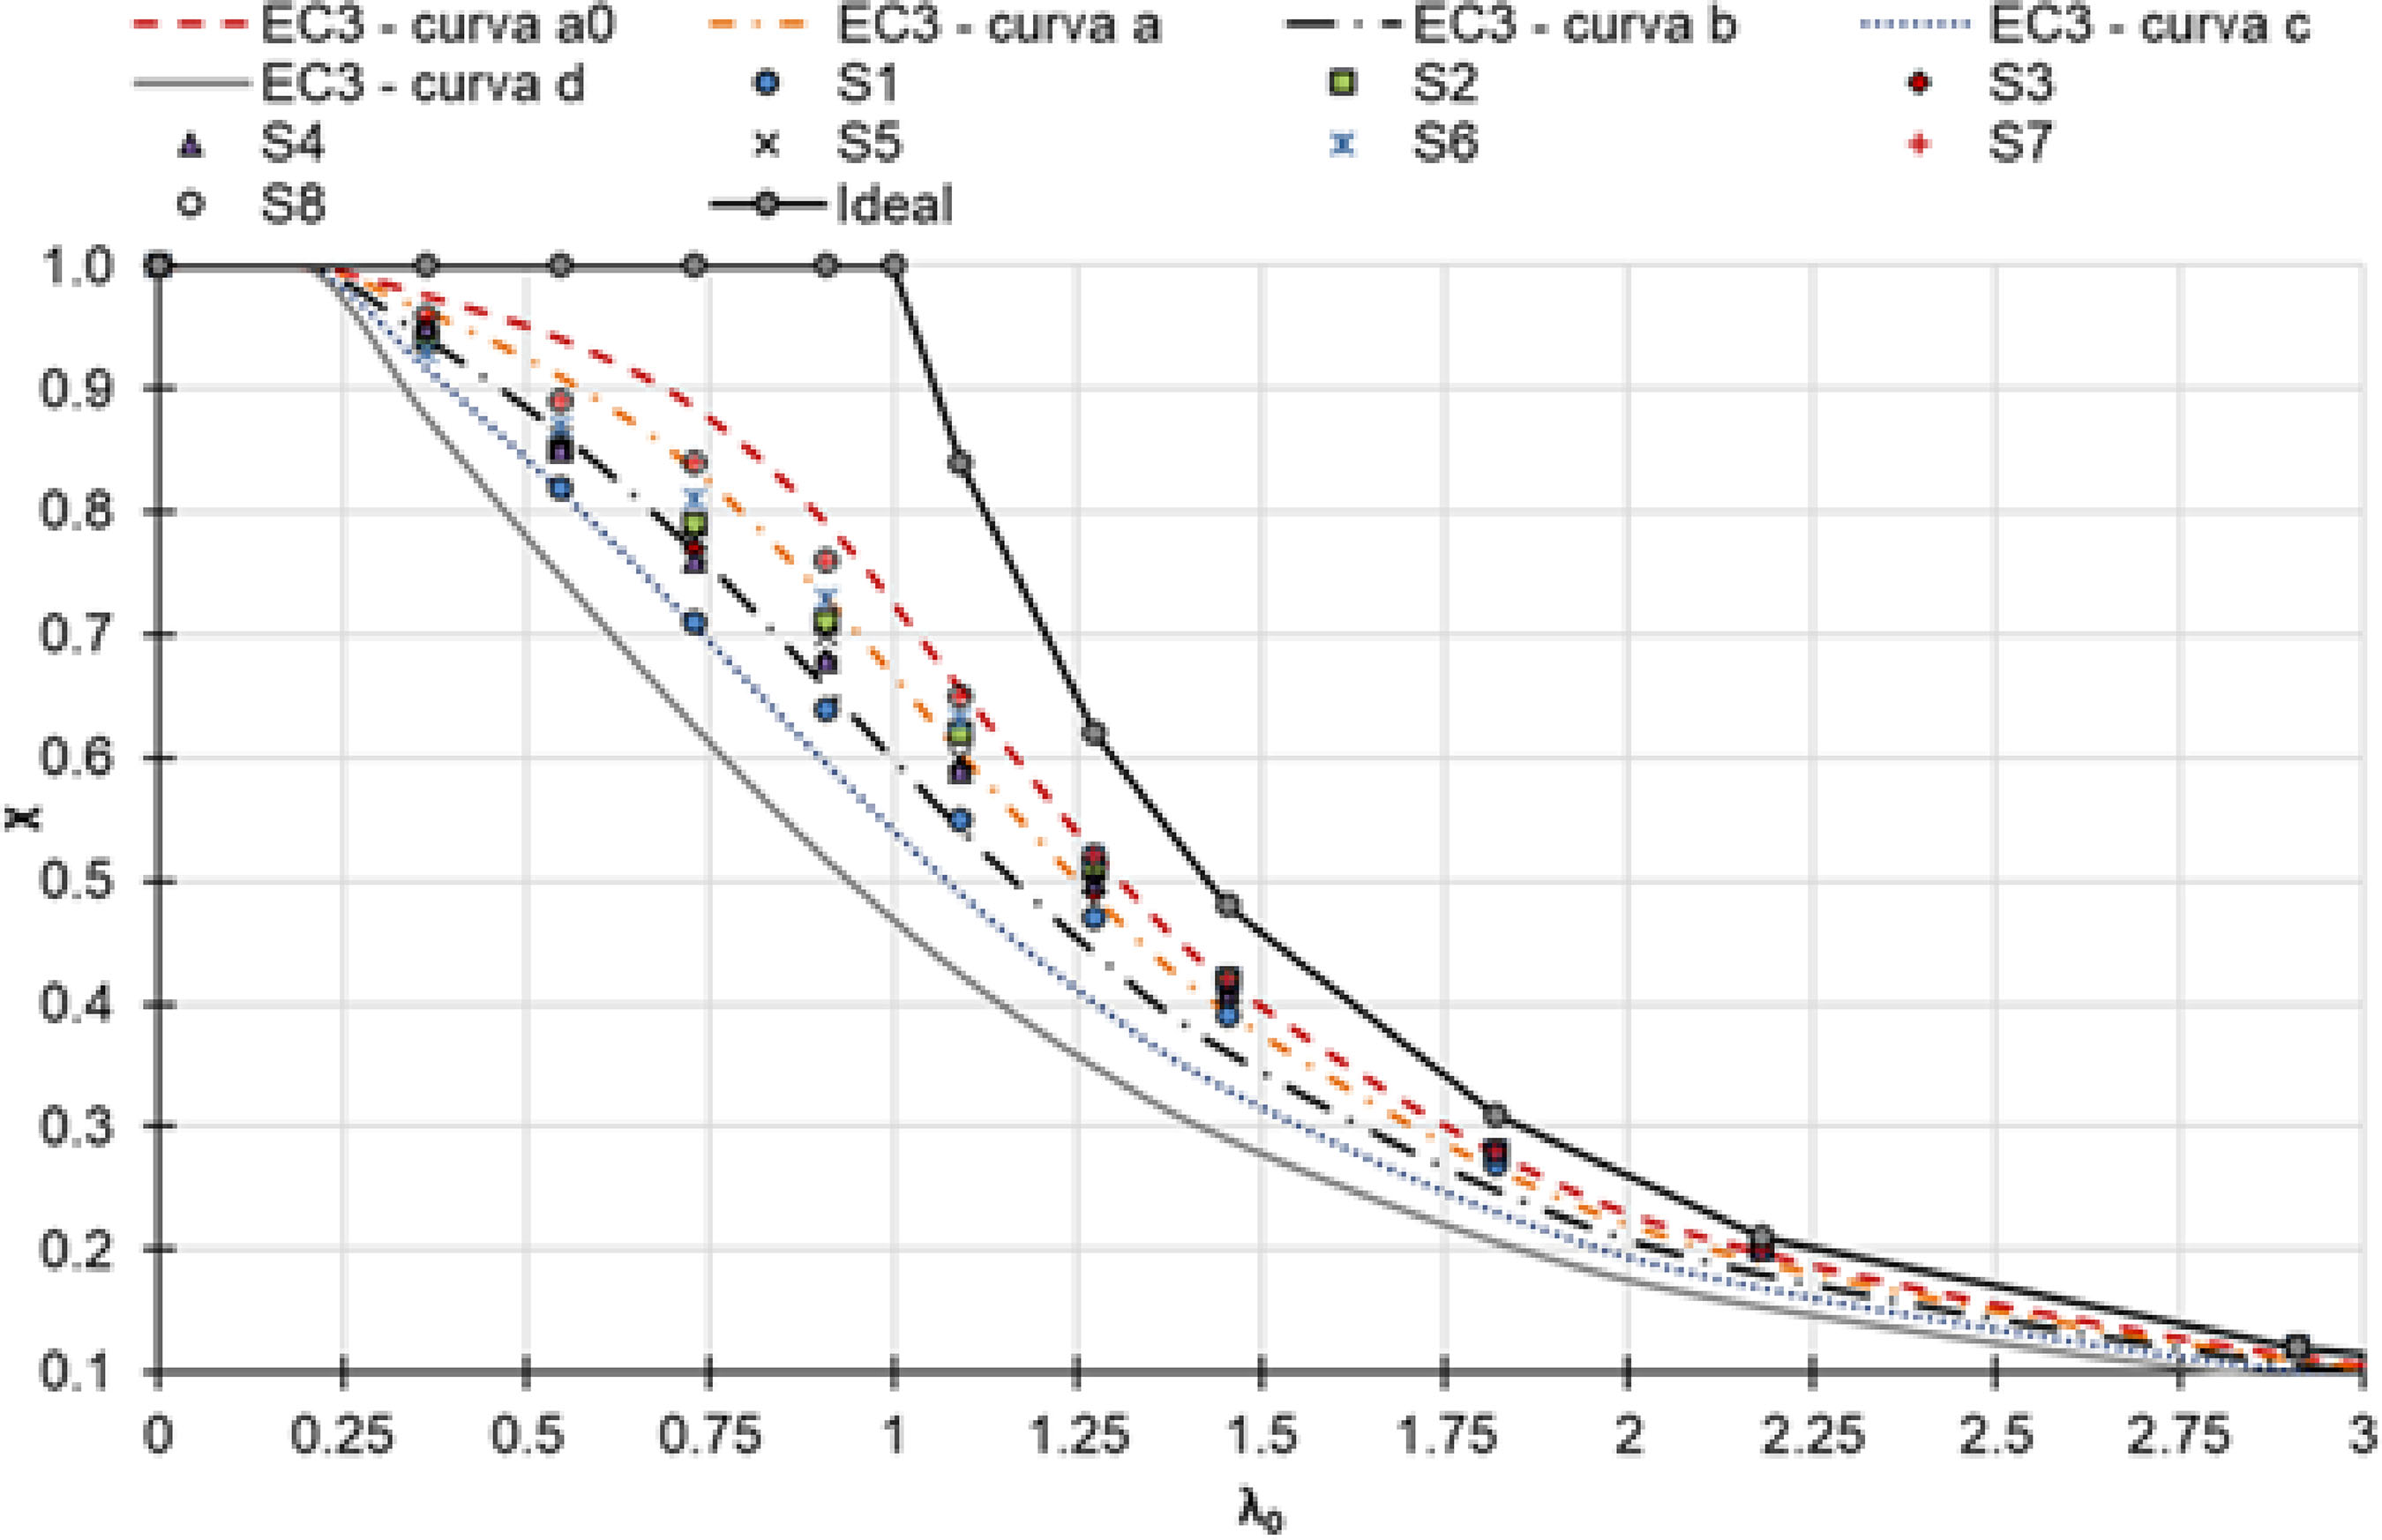
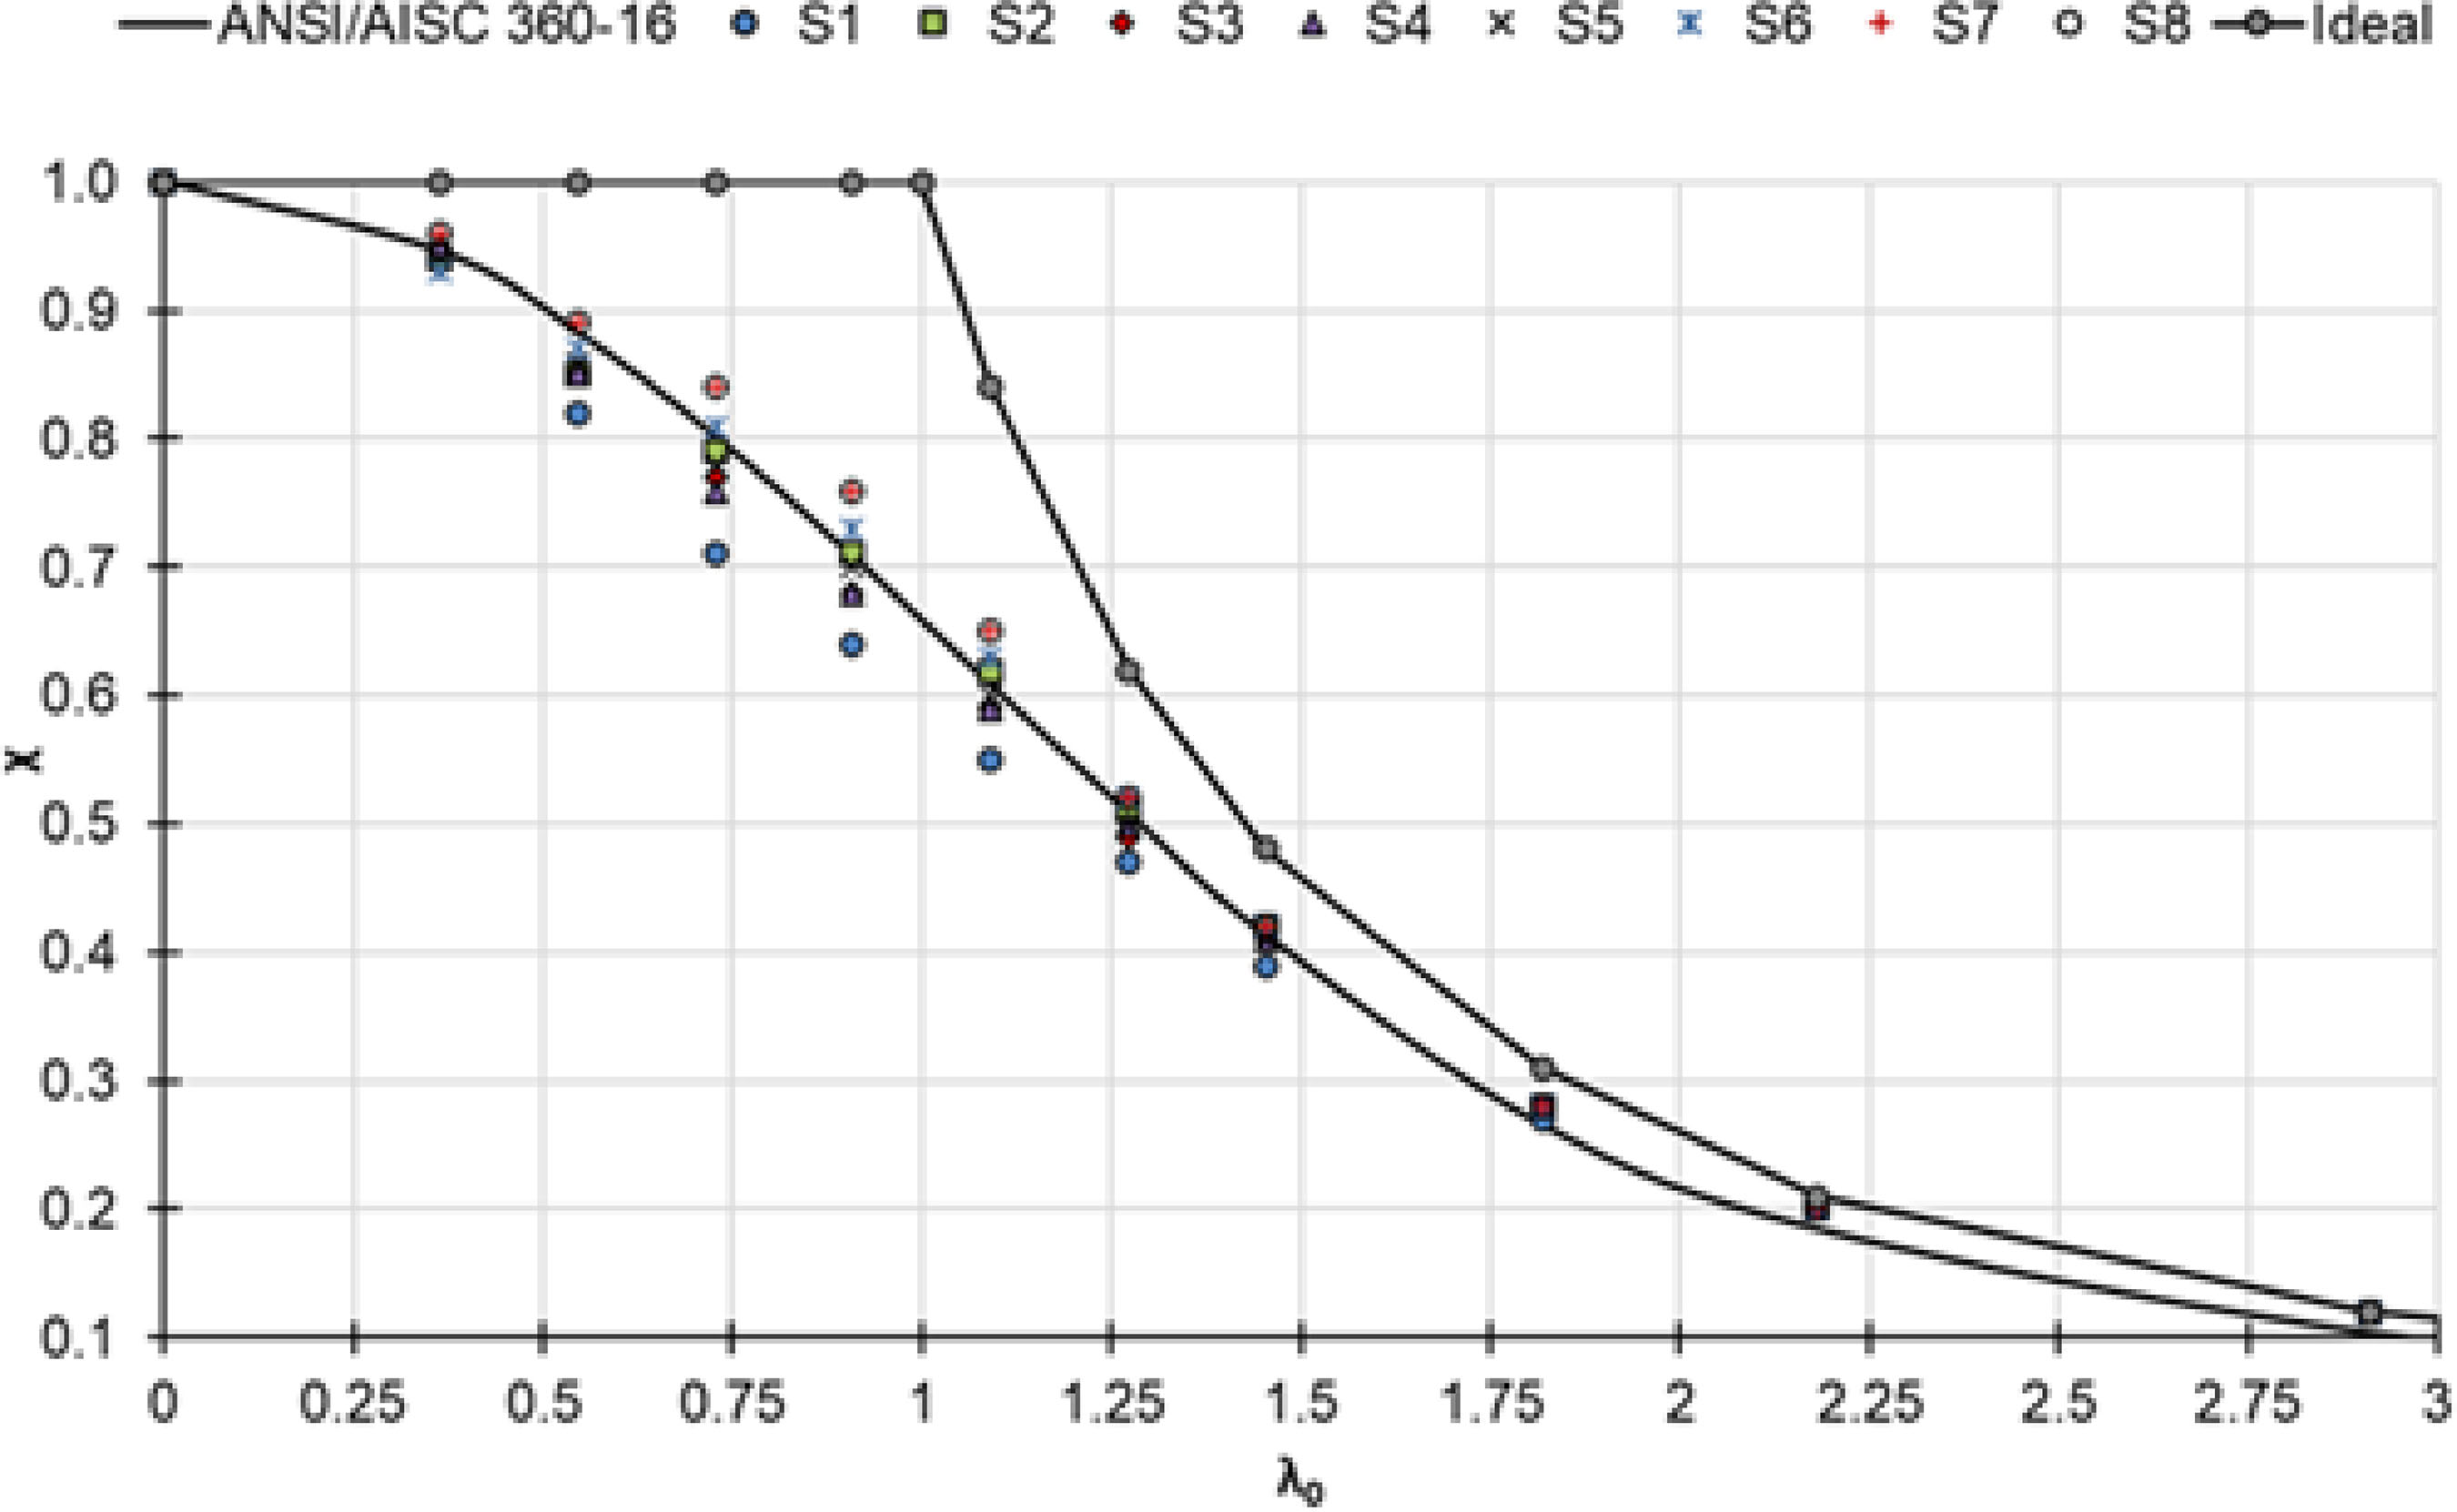
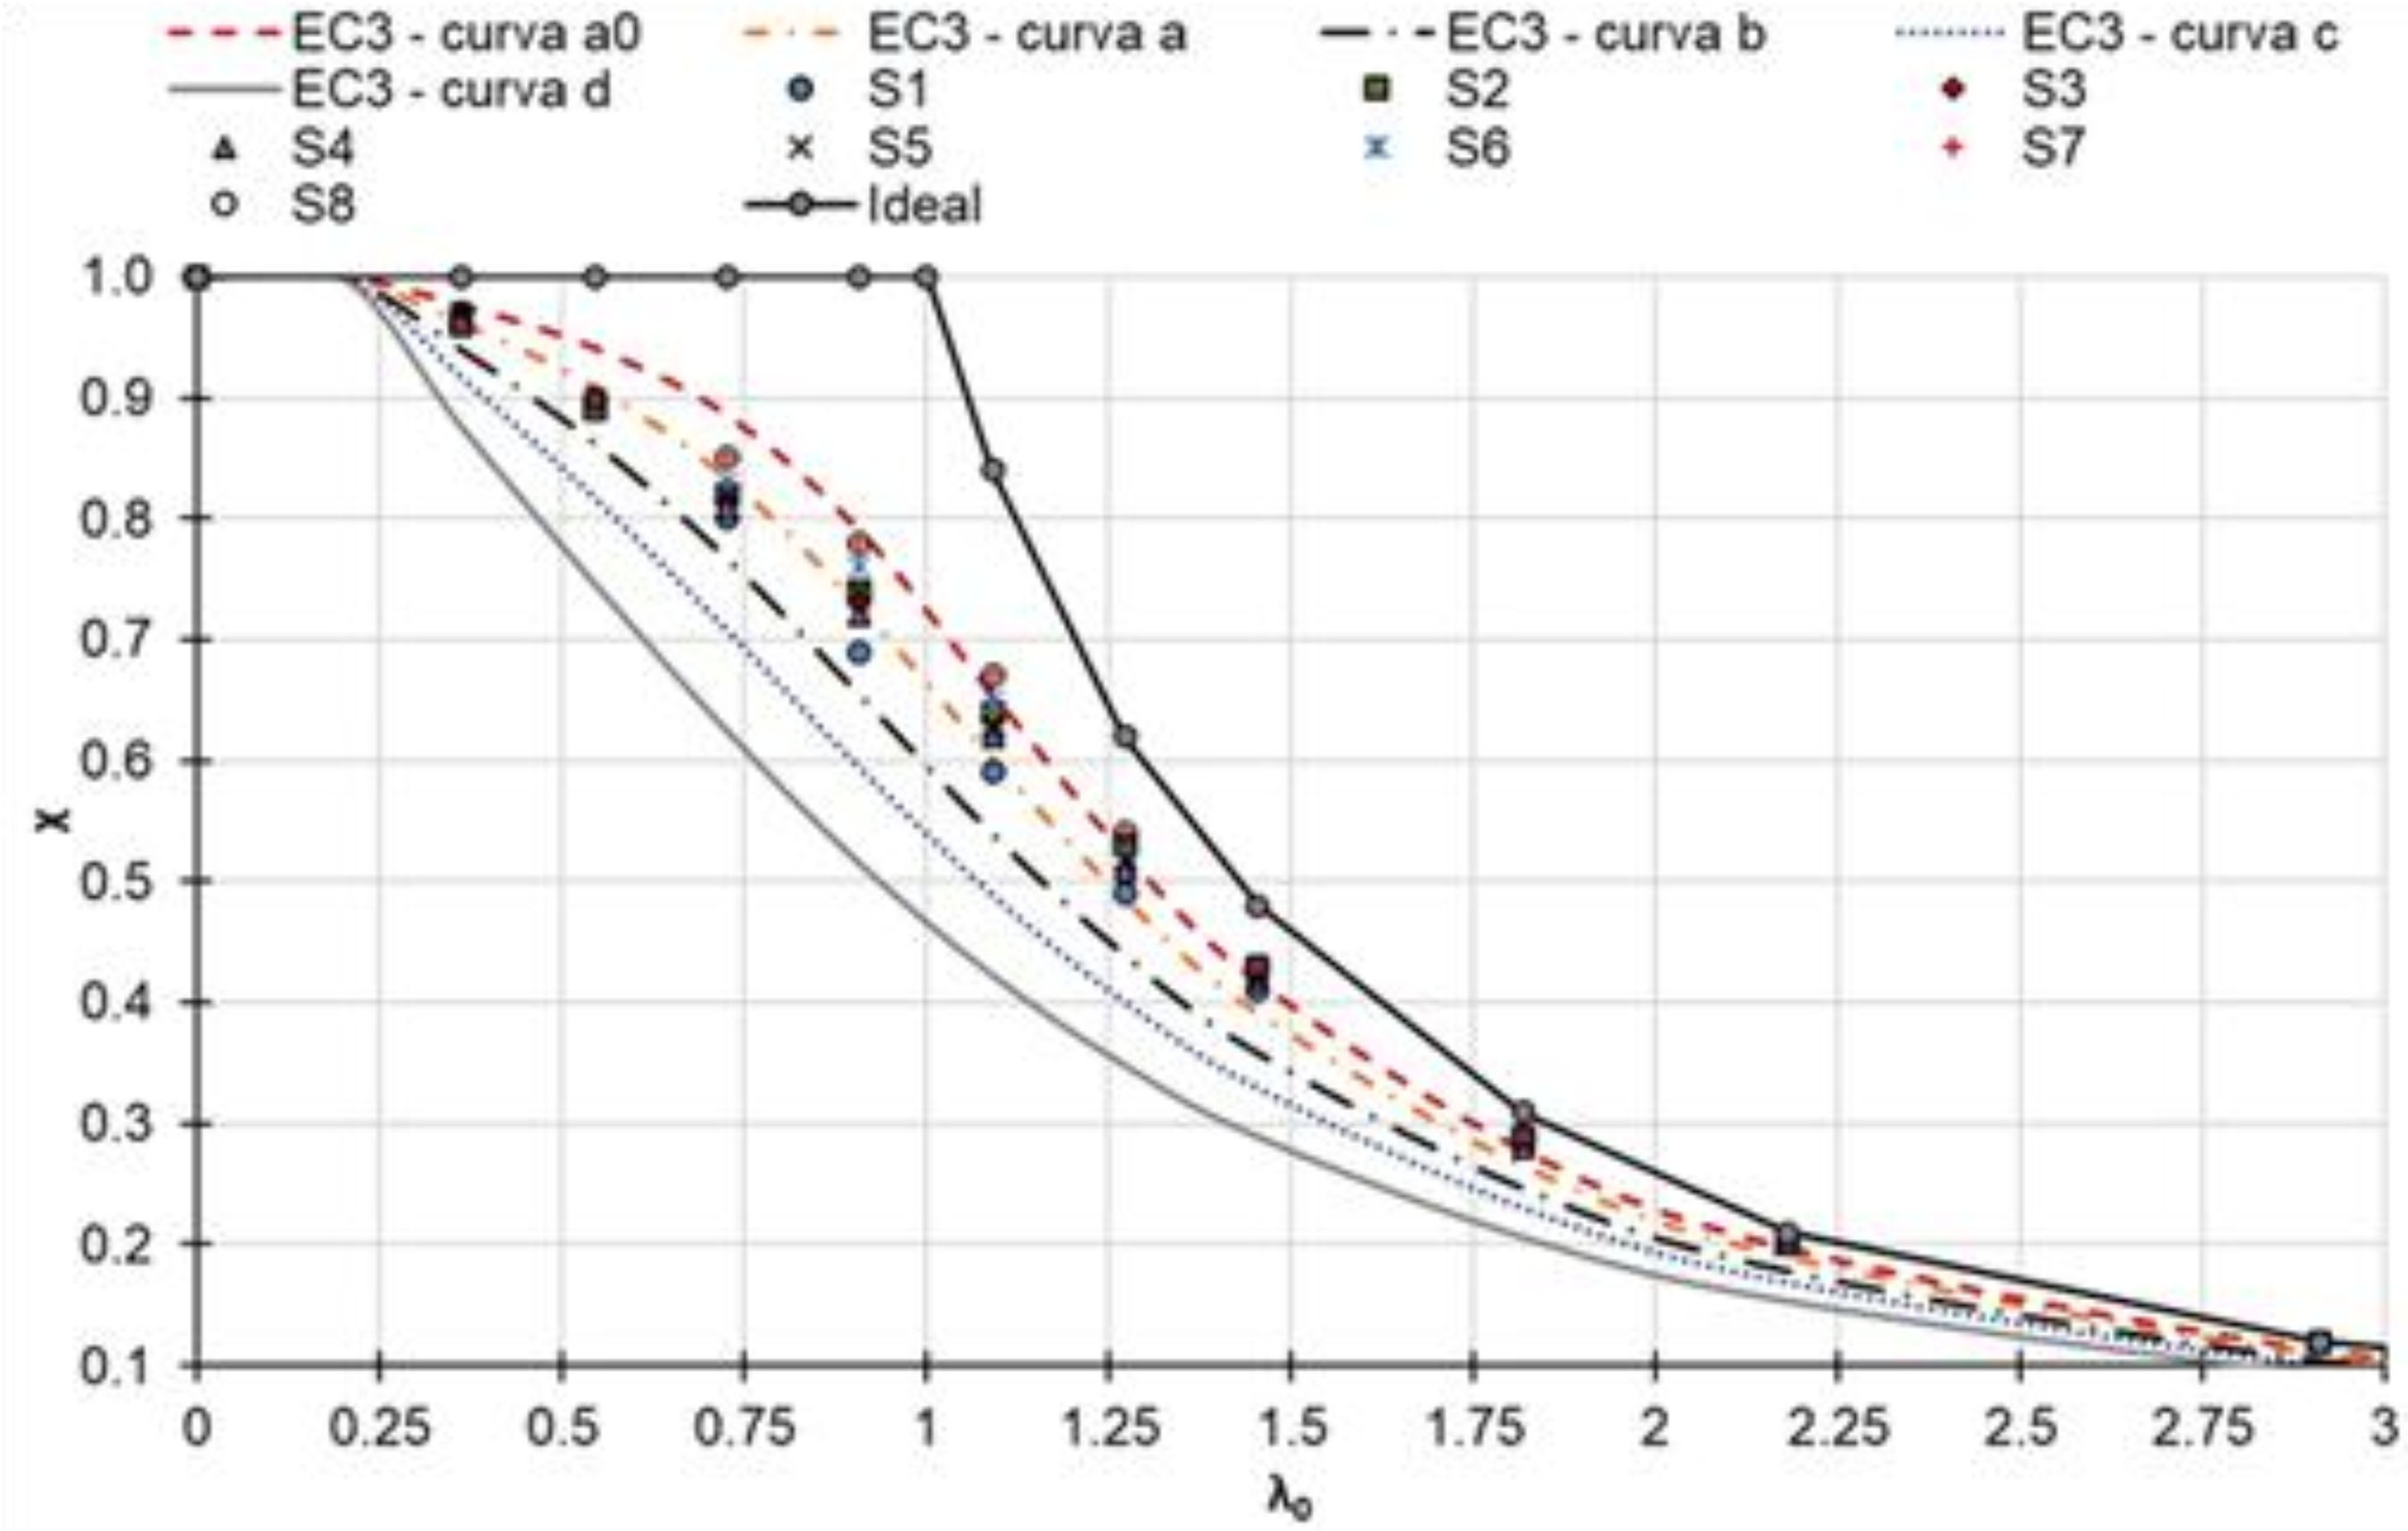
Figures 14 and 15 provide the corresponding comparison for 690 MPa steel. It is worth mention that, for welded I-section profiles made of 690 MPa yield strength steel subjected to bending about the weak axis, Eurocode 3 also recommends the use of buckling curve c for structural design (𝑡𝑓 ≤ 40 𝑚𝑚). The analysis of Figure 14 confirms that this curve behaves conservatively, indicating that its use for the evaluated profiles results in safe and adequate designs. An analysis of Figure 15 shows that the single buckling curve proposed by the American standard provides, for most of the analyzed columns, higher strength predictions than those obtained from the numerical analysis within the slenderness range of 0.25 to 1.25.
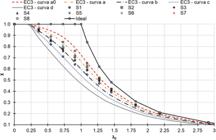
Comparison of numerical results for HSS 690 MPa with Eurocode 3 design curves for the weak axis
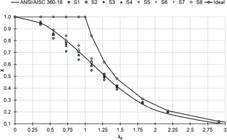
Comparison of numerical results for HSS 690 MPa with ANSI/AISC 360-16 design curve for the weak axis
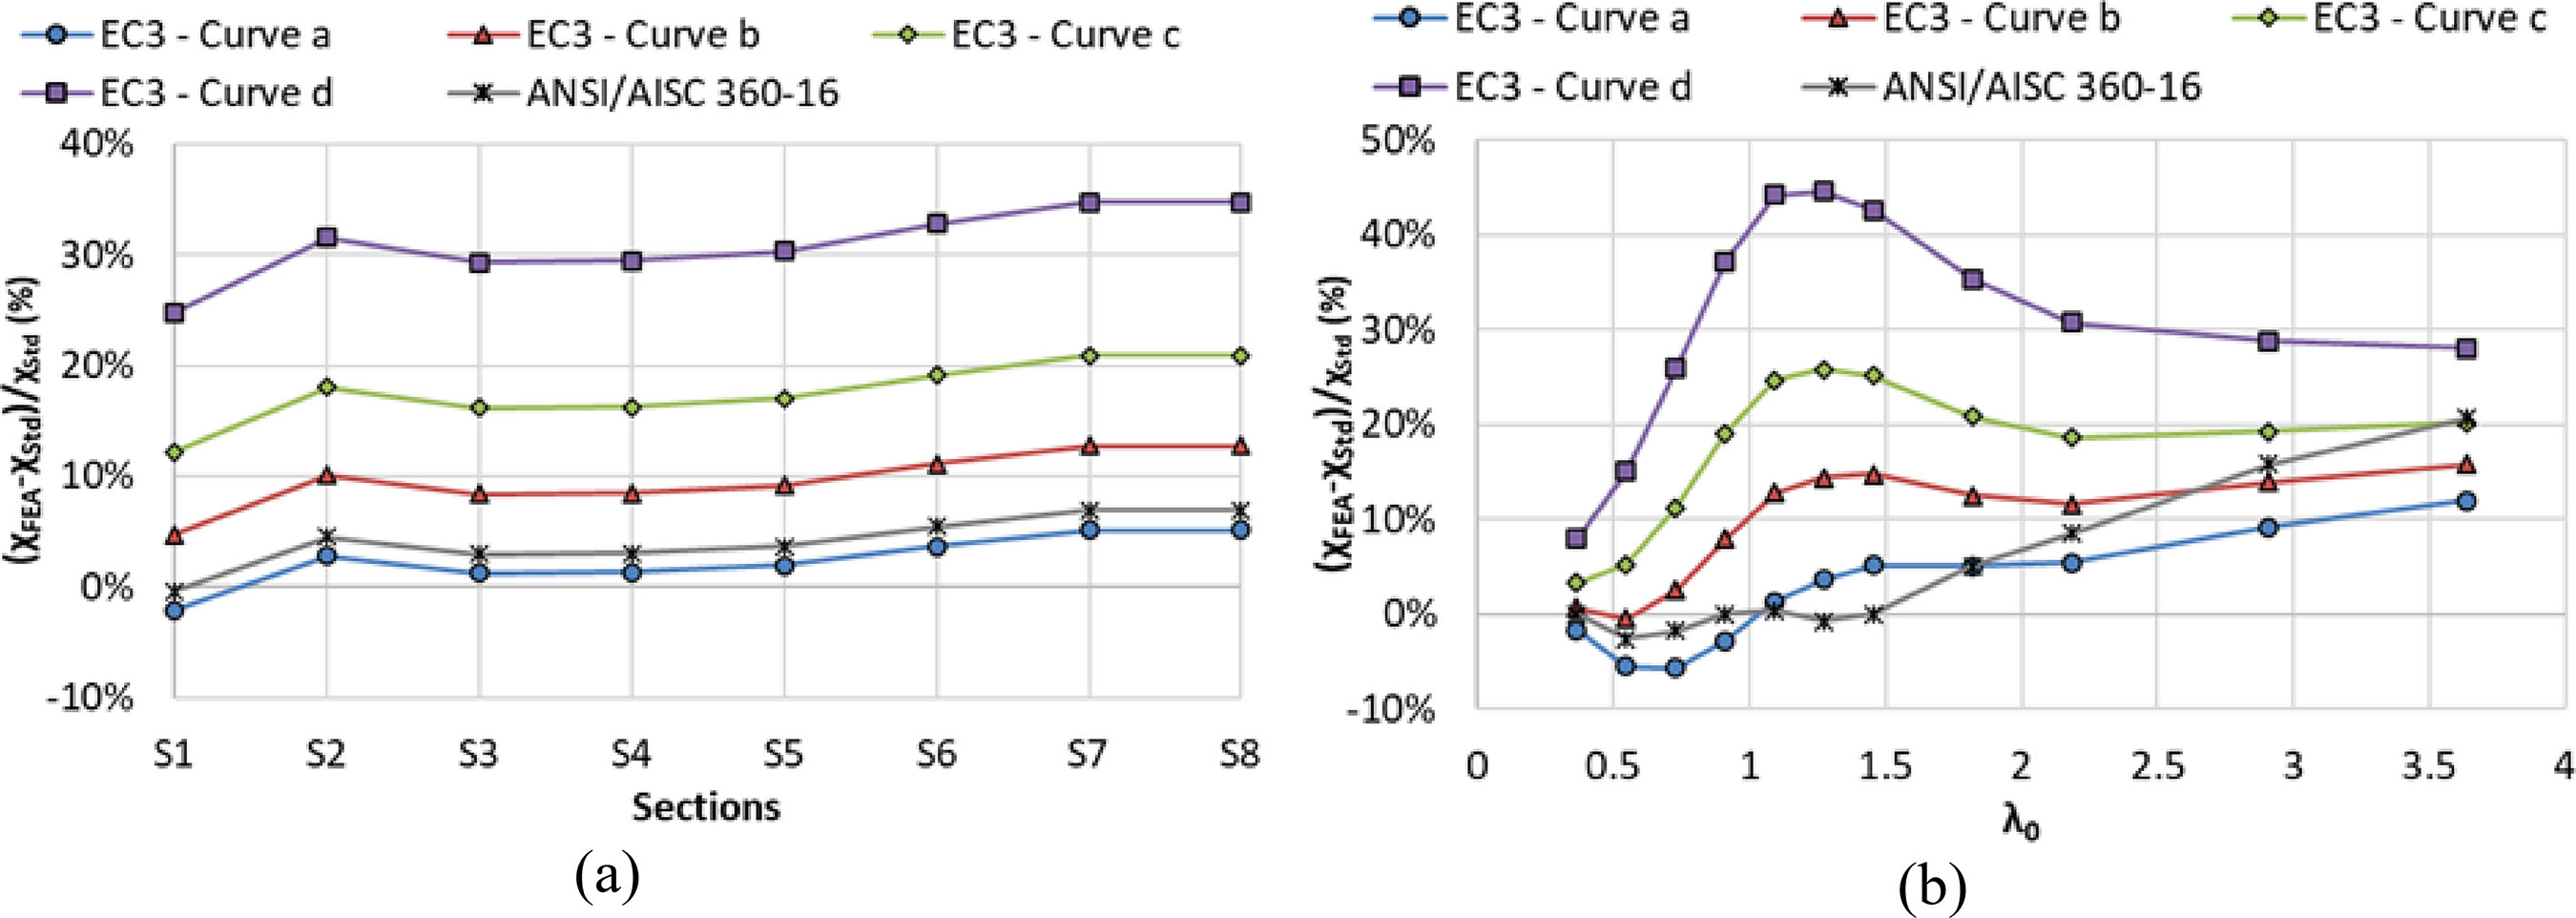
Figures 16(a) and 16(b) presents the average values of the relative difference between the buckling reduction factors obtained from finite element analysis (𝜒𝐹𝐸𝐴) and those predicted by the design standards (𝜒𝑆𝑡𝑑), for 690 MPa steel columns, considering buckling about the weak axis. The differences across cross-sections S1 to S8 are depicted in Fiure 16(a), while Figure 16(b) relates the relative discrepancies to the non-dimensional slenderness ratio (𝜆0). As shown in Figure 16(a), among all the evaluated design curves, Eurocode 3 Curve a produces the lowest average deviation from the FEA results across all cross-sections. Although ANSI/AISC 360-16 also shows good agreement, its discrepancies are slightly higher compared to Curve a.
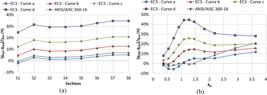
Percentage difference between FEA results for 690 MPa HSS and standard curves for the weak axis
Figure 16(b) indicates that curve b may be used as an alternative for designing 690 MPa HSS columns, providing a less conservative design approach than curve c when accounting for buckling about the weak axis. Additionally, Curve a could be adopted for the design of the analyzed columns with 𝜆0 ≥ 1.1, further reducing conservatism while maintaining safe design margins. On the other hand, the ANSI/AISC curve proves to be applicable for the analysis of steel columns with 𝑓𝑦 = 690 𝑀𝑃𝑎 subjected to buckling about the weak axis, especially for columns with 𝜆0 ≥ 1.5.
4.7 Numerical results for the axis with the greatest moment of inertia
Figures 17 and 18 present a comparison between the numerical results for 460 MPa columns subjected to buckling about the strong axis and the corresponding design curves from Eurocode 3 and ANSI/AISC. For welded I-section members made of 460 MPa high-strength steel and susceptible to buckling about the strong axis, Eurocode 3 recommends the use of buckling curve b for structural design. Based on the results shown in Figure 17, curve b provides a conservative design basis for the analyzed columns across the entire slenderness range. Furthermore, as evidenced by Figure 18, the ANSI/AISC design curve exhibits a more conservative behavior for strong-axis buckling compared to weak-axis buckling in the case of 460 MPa HSS columns.
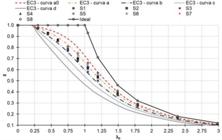
Comparison of numerical results for HSS 460 MPa with Eurocode 3 design curves for the stronger axis
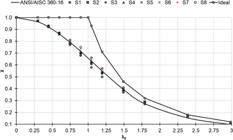
Comparison of numerical results for HSS 460 MPa with ANSI/AISC 360-16 design curve for the stronger axis
The average discrepancies between the buckling reduction factors obtained from finite element analysis (𝜒𝐹𝐸𝐴) and those predicted by the design standards (𝜒𝑆𝑡𝑑) for 460 MPa HSS columns under strong-axis buckling are illustrated in Figures 19(a) and 19(b). In Figure 19(a), the discrepancies are presented for various cross-sections (S1 to S8). Among the evaluated design curves, EC3 Curve a exhibits the smallest average discrepancies across all sections, indicating the closest agreement with the FEA results. Although ANSI/AISC 360-16 also performs well with relatively low discrepancies, it is slightly less accurate than Curve a in this comparison.
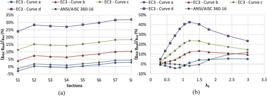
Percentage difference between FEA results for 460 MPa HSS and standard curves for the stronger axis
Figure 19(b) illustrates the discrepancies as a function of the non-dimensional slenderness parameter (𝜆0). For EC3 Curves c and d, the discrepancies increase with 𝜆0 up to approximately 1.2 and then gradually decrease. For Curve b, the peak discrepancy occurs around 𝜆0 ≈ 1.5, followed by a slight reduction. Curve a, on the other hand, demonstrates smaller discrepancies throughout. Notably, Curve a proves to be less conservative and more applicable for 460 MPa HSS columns under strong-axis buckling when 𝜆0 ≥ 1.2. By contrast, the ANSI/AISC 360-16 curve proved to be more applicable for 𝜆0 ≥ 1.5.
Figures 20 and 21 depict the buckling response of the analyzed 690 MPa HSS columns about the strong axis, evaluated with respect to the Eurocode 3 design curves. Although Eurocode 3 suggests the use of Curve b for buckling around the axis with the highest moment of inertia (𝑡𝑓 ≤ 40 𝑚𝑚), the results indicate that this choice leads to an overly conservative estimation for the analyzed sections. In contrast, the buckling curve proposed by ANSI/AISC 360-16 (AISC, 2016) yields lower global buckling reduction factors compared to the FEA results for most sections, with the exception of Section S1 within the slenderness range of 0.7 < 𝜆0 < 1.4.
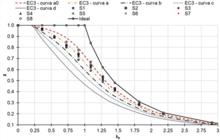
Comparison of numerical results for HSS 690 MPa with Eurocode 3 design curves for the stronger axis
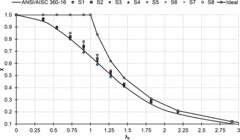
Comparison of numerical results for HSS 690 MPa with ANSI/AISC 360-16 design curve for the stronger axis
The average relative discrepancies between the buckling reduction factors derived from FEA (𝜒𝐹𝐸𝐴) and those provided by design standards (𝜒𝑆𝑡𝑑) for 690 MPa steel columns under strong-axis buckling are shown in Figures 22 (a) and 22(b). The differences across cross-sections S1 to S8 are depicted in Figure 22(a), while Figure 22(b) plots the relative discrepancies as a function of the non-dimensional slenderness parameter (𝜆0). From Figure 22(a), it can be observed that the average relative discrepancies obtained for each cross-section are positive for all the curves analyzed.

Percentage difference between FEA results for 690 MPa HSS and standard curves for the stronger axis
Based on Figure 22(b), it can be observed that Eurocode 3 Curve a could be applied in the design of 690 MPa HSS columns subjected to buckling about the major axis, aiming to achieve a less conservative design compared to Curve b recommended by the standard. The ANSI/AISC design curve demonstrated consistent applicability to the structural design of the analyzed 690 MPa HSS columns over the entire slenderness range.
4.8 Proposition of column design curves for welded 460 MPa and 690 MPa HSS I-sections
In this study, three different design curves were proposed for determining the global buckling reduction factor (𝜒) of welded I-section columns fabricated from high-strength steels with yield strengths of 460 MPa and 690 MPa. These curves were derived based on the best fit to the average buckling reduction factors obtained from finite element analysis (FEA) simulations of various cross-sections and slenderness ranges.
Curve 1 follows the Eurocode 3 formulation but uses a calibrated imperfection factor (𝛼) to better reflect the behavior of HSS columns. The 𝛼 values were adjusted so that the resulting curve yields values that are equal to or below the average FEA results, providing a conservative basis for design.
Curve 2 was developed using a rational power model of the form (Equation 15):
The model was selected due to its ability to provide a mathematically simple and continuous representation of the buckling behavior. Parameters a and b were obtained through nonlinear regression, allowing the curve to accurately reflect the reduction factor across a wide range of slenderness values.
Curve 3 was constructed using a piecewise-continuous function of the form (Equation 16):
With the constraint that both expressions yield the same value at the transition point 𝜆0 = 𝑐. This formulation ensures continuity and smoothness at the transition point, which is beneficial for both analytical and numerical applications.
Curve fitting for Curves 2 and 3 was performed in Python using SciPy’s optimization tools. The scripts were designed to minimize the deviation between the fitted expressions and the FEA results for each scenario.
Table 9 summarizes the proposed equations for the calculation of the global buckling reduction factor 𝜒. For each steel grade, curves are provided separately for buckling about the minor axis and major axis. The last category, labeled “major/minor” refers to a curve derived from the average of FEA results for buckling about the major and minor principal axes. It serves as a general-purpose representation of global buckling behavior. This approach is conceptually similar to that adopted by the AISC 360 Specification, which uses a single global buckling curve regardless of the buckling axis.
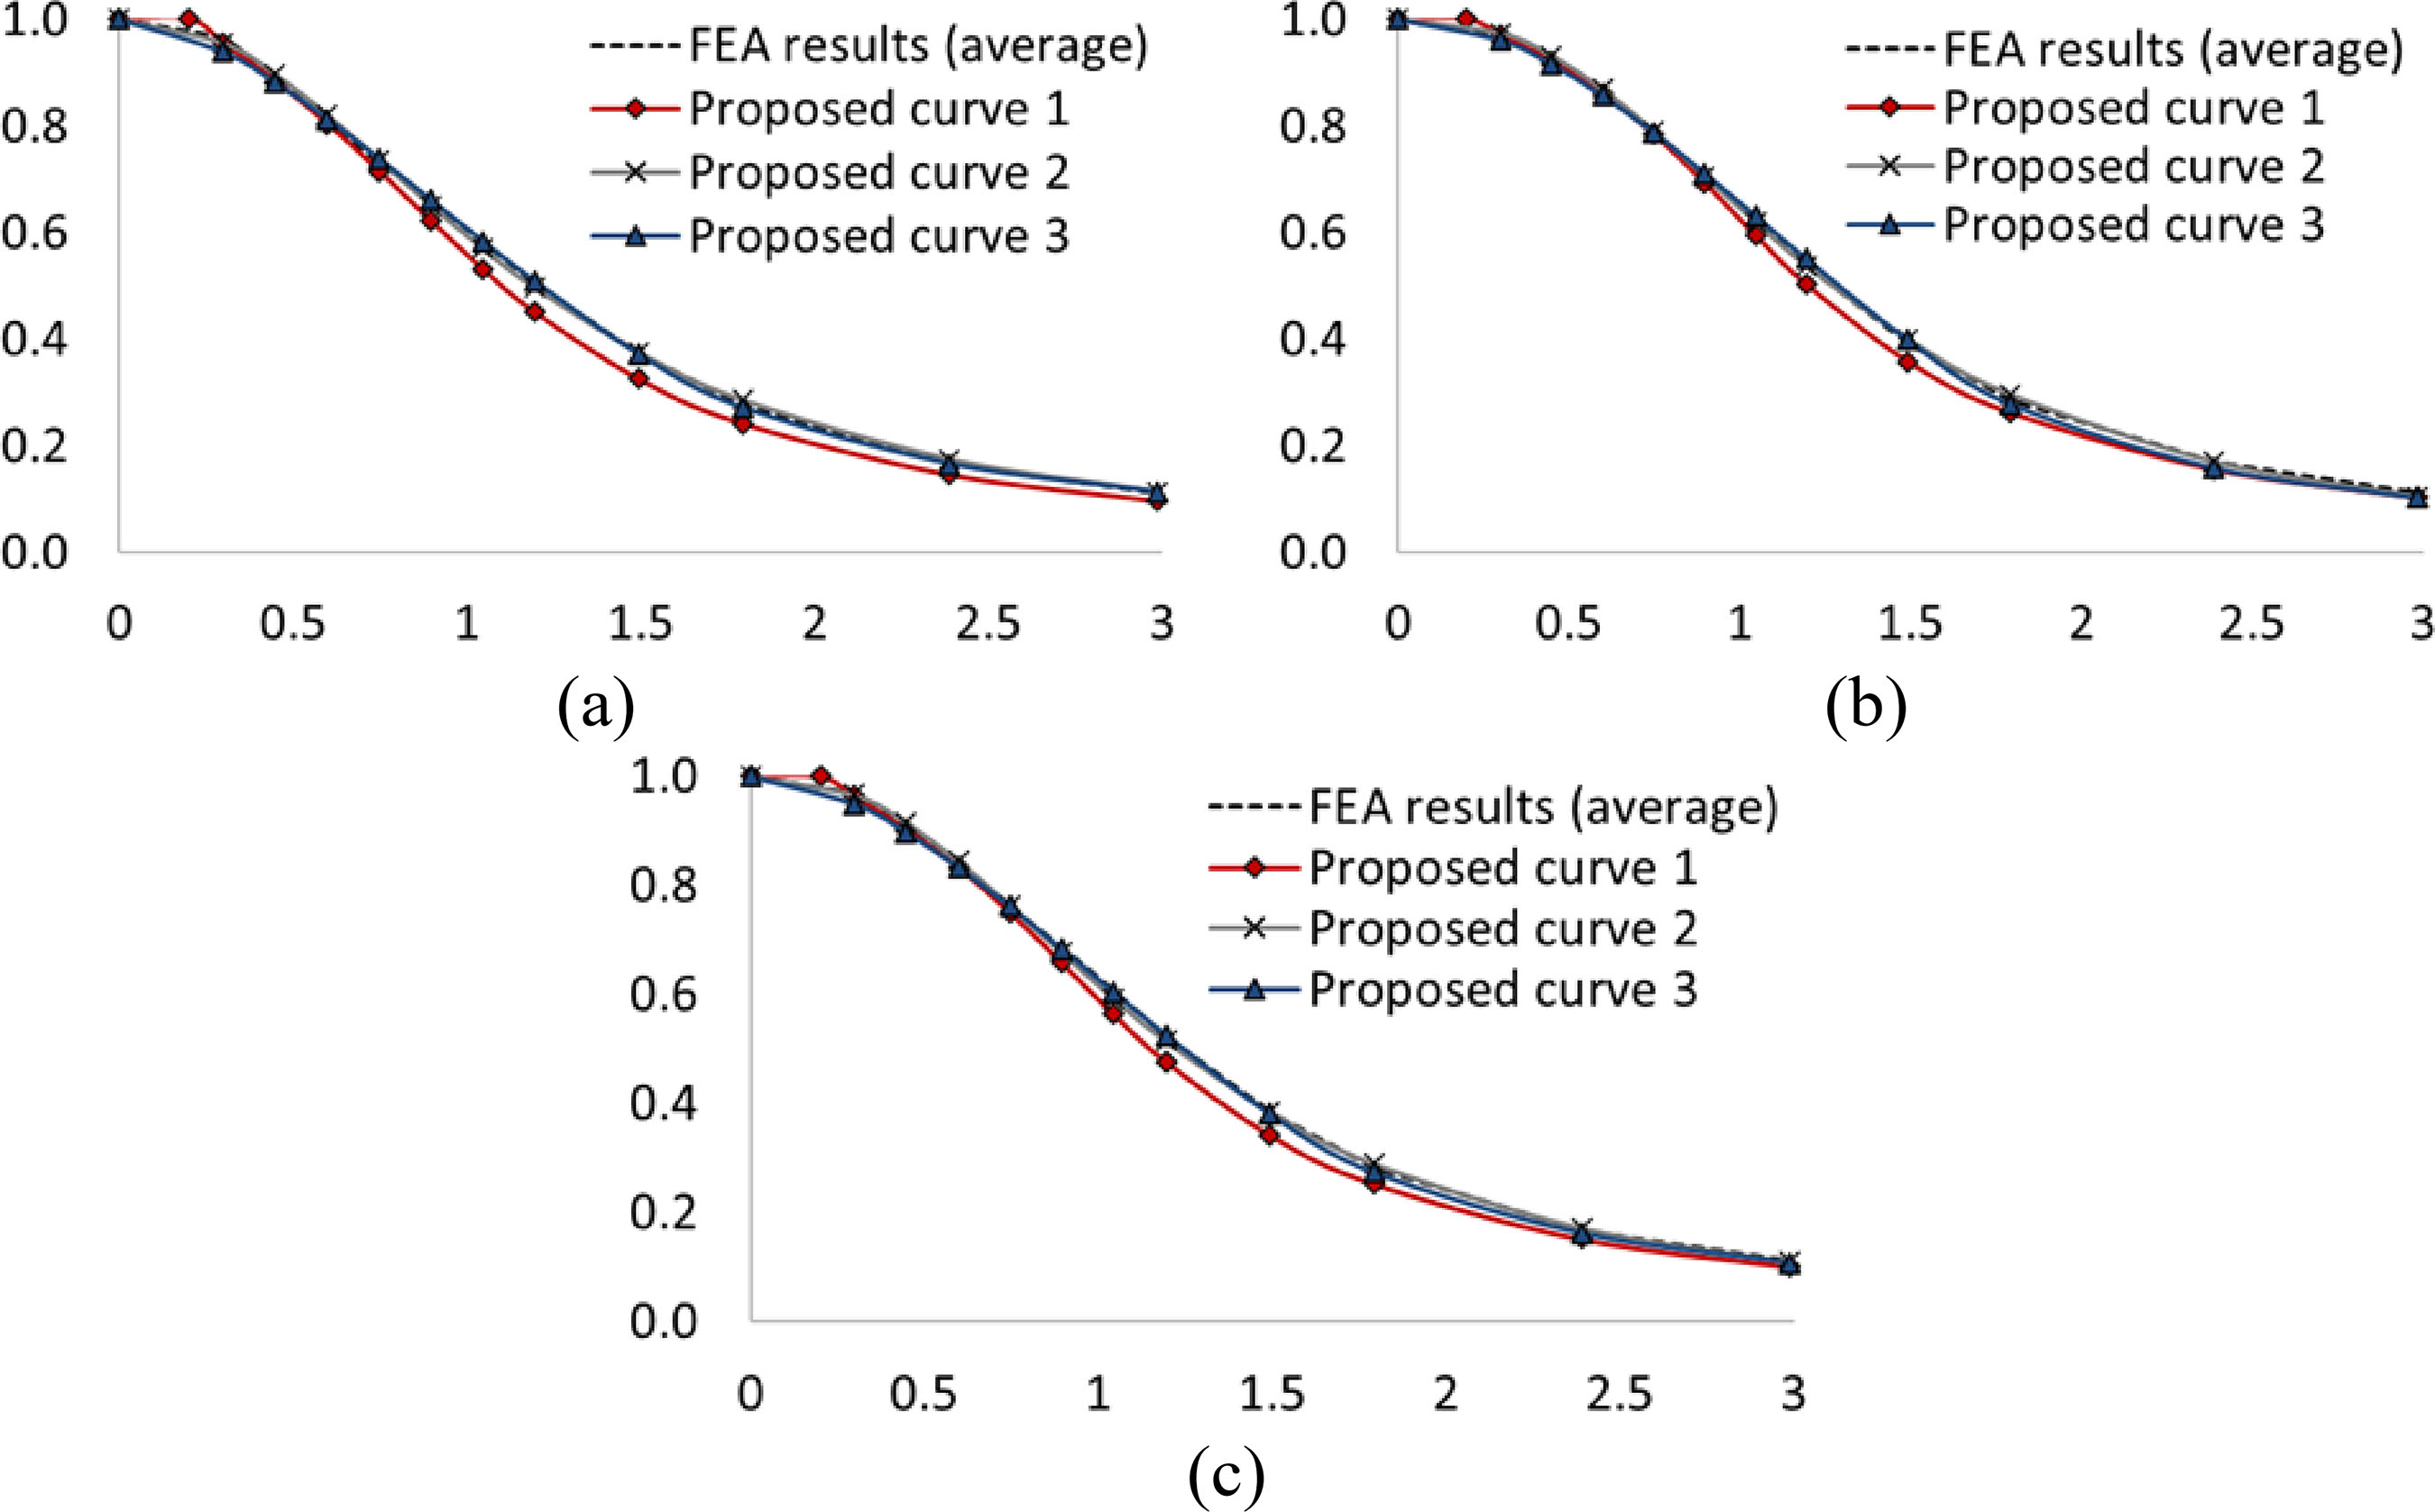
Figures 23(a)–23(c) depict the design curves proposed for 460 MPa HSS columns, derived from finite element analysis (FEA) results.
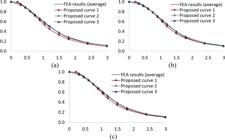
Proposed design curves based on FEA results for 460 MPa HSS columns: (a) minor axis; (b) major axis; (c) average of both axes
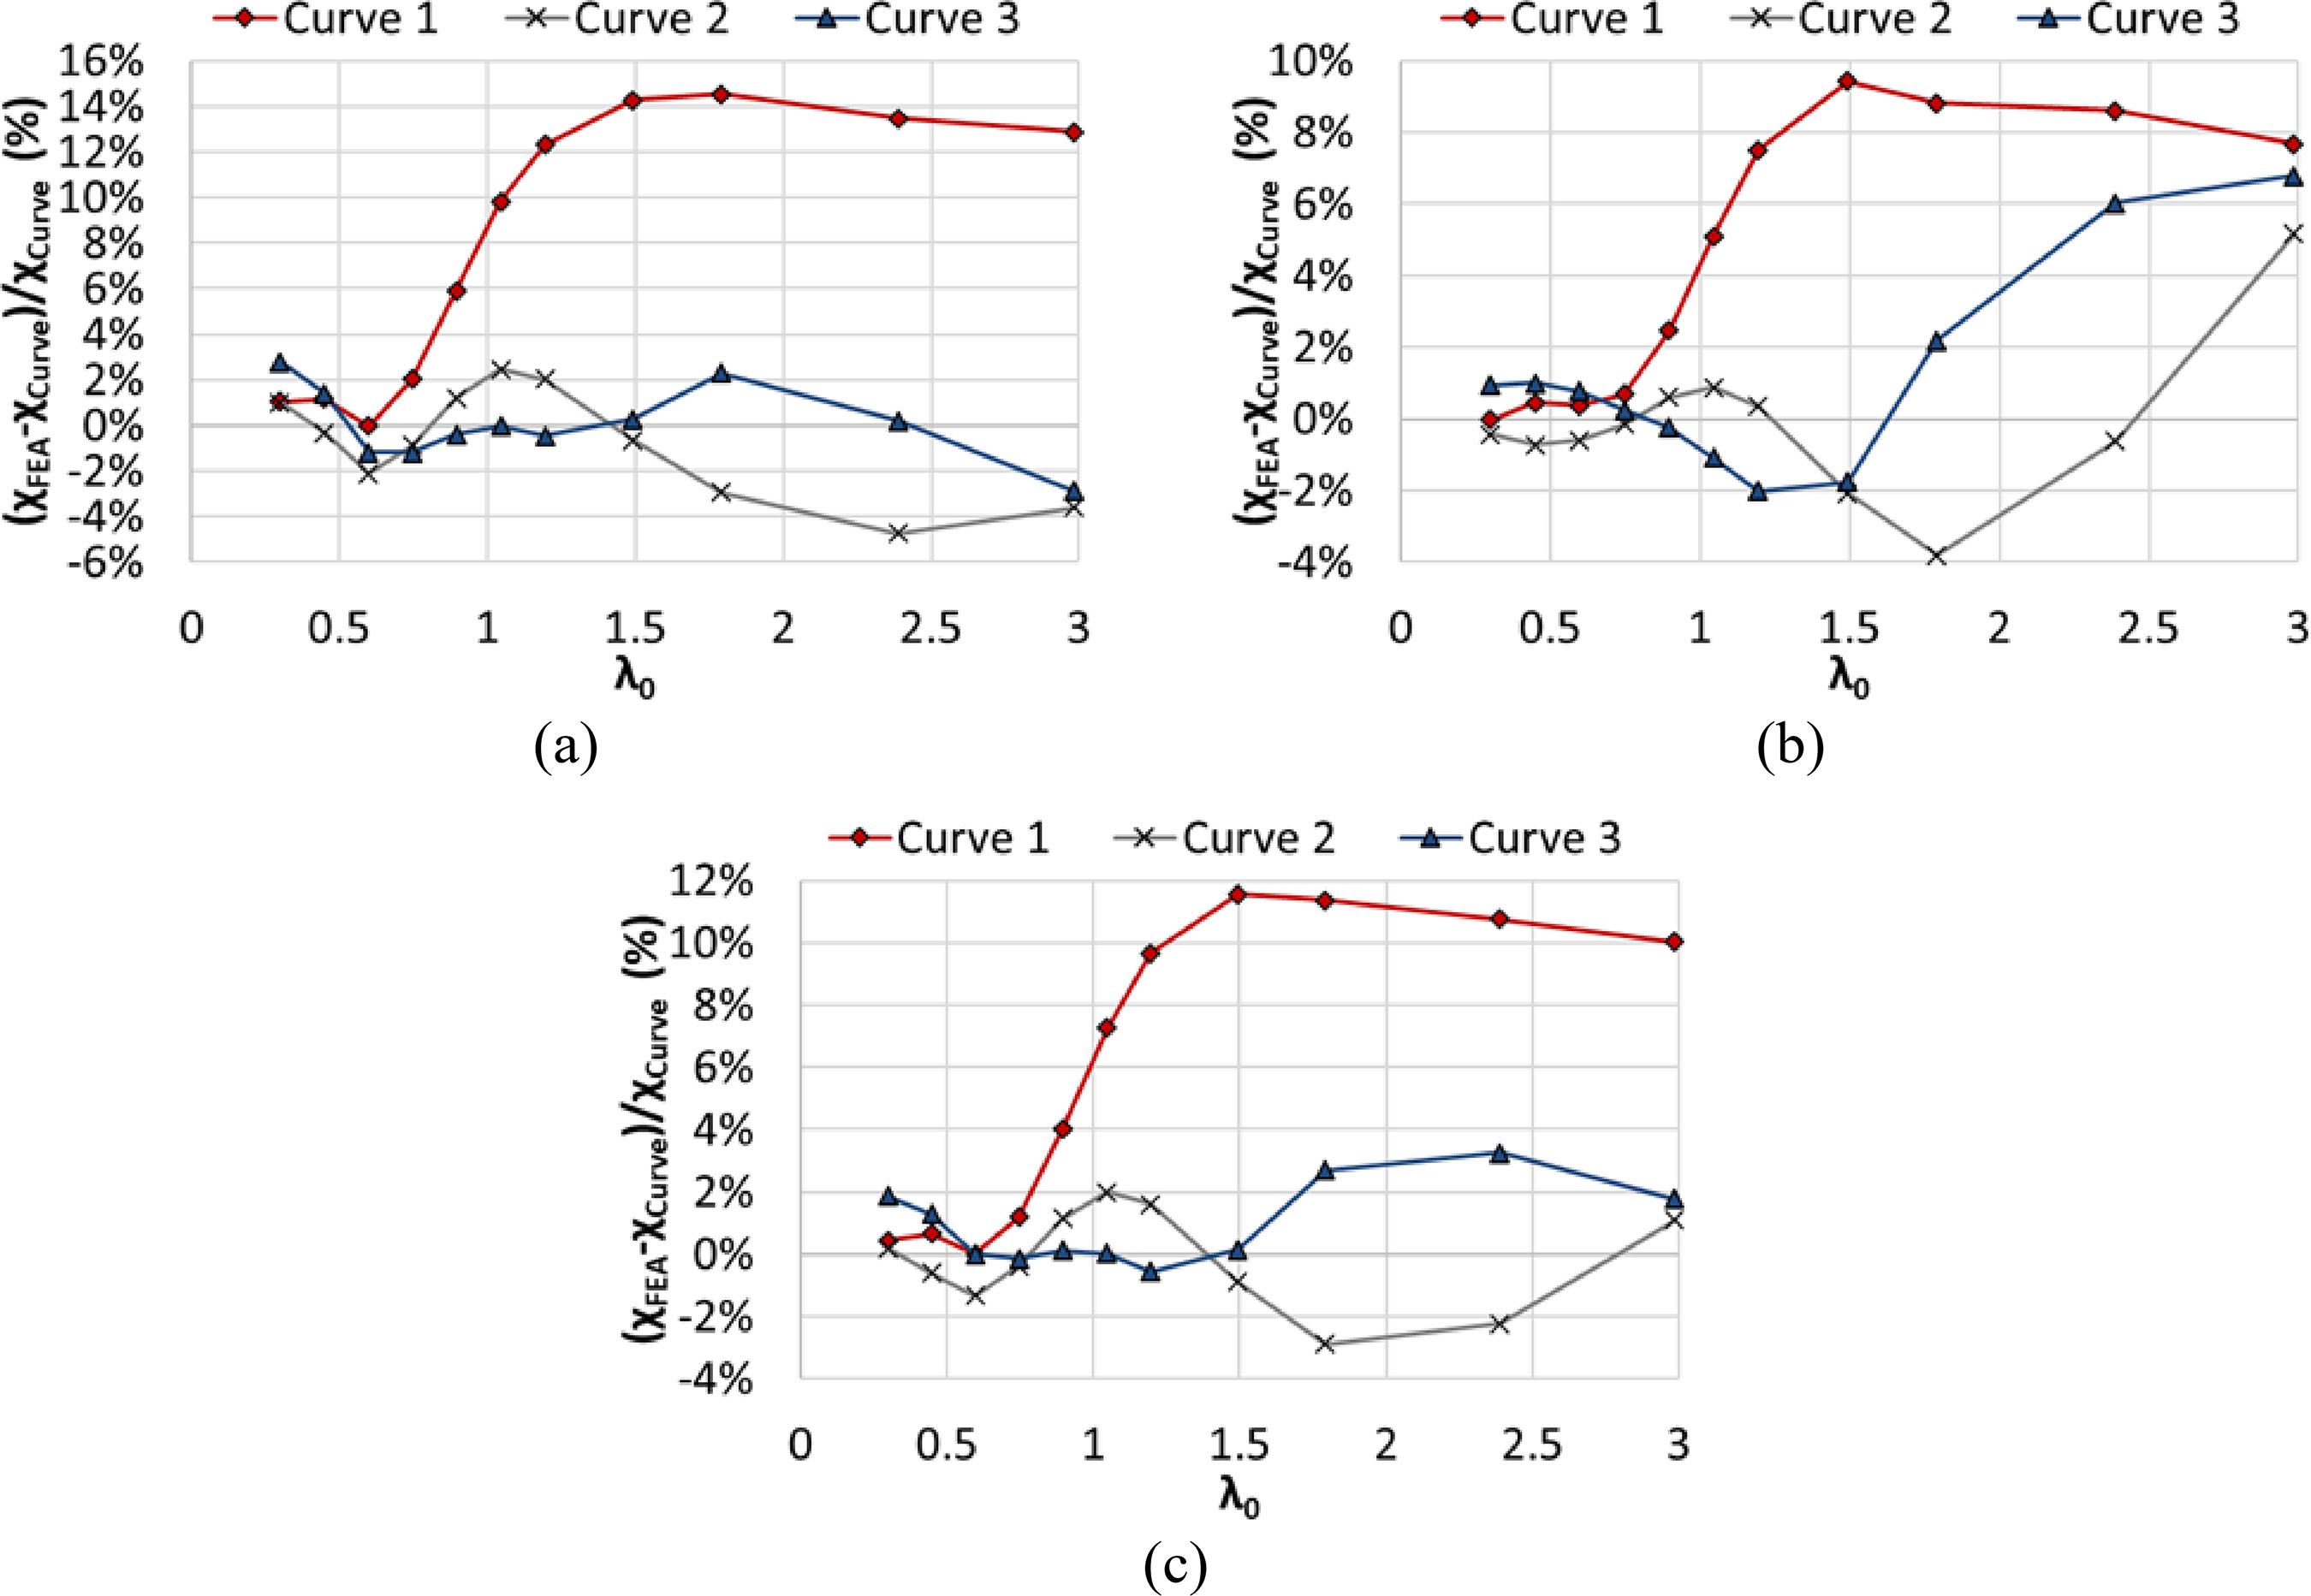
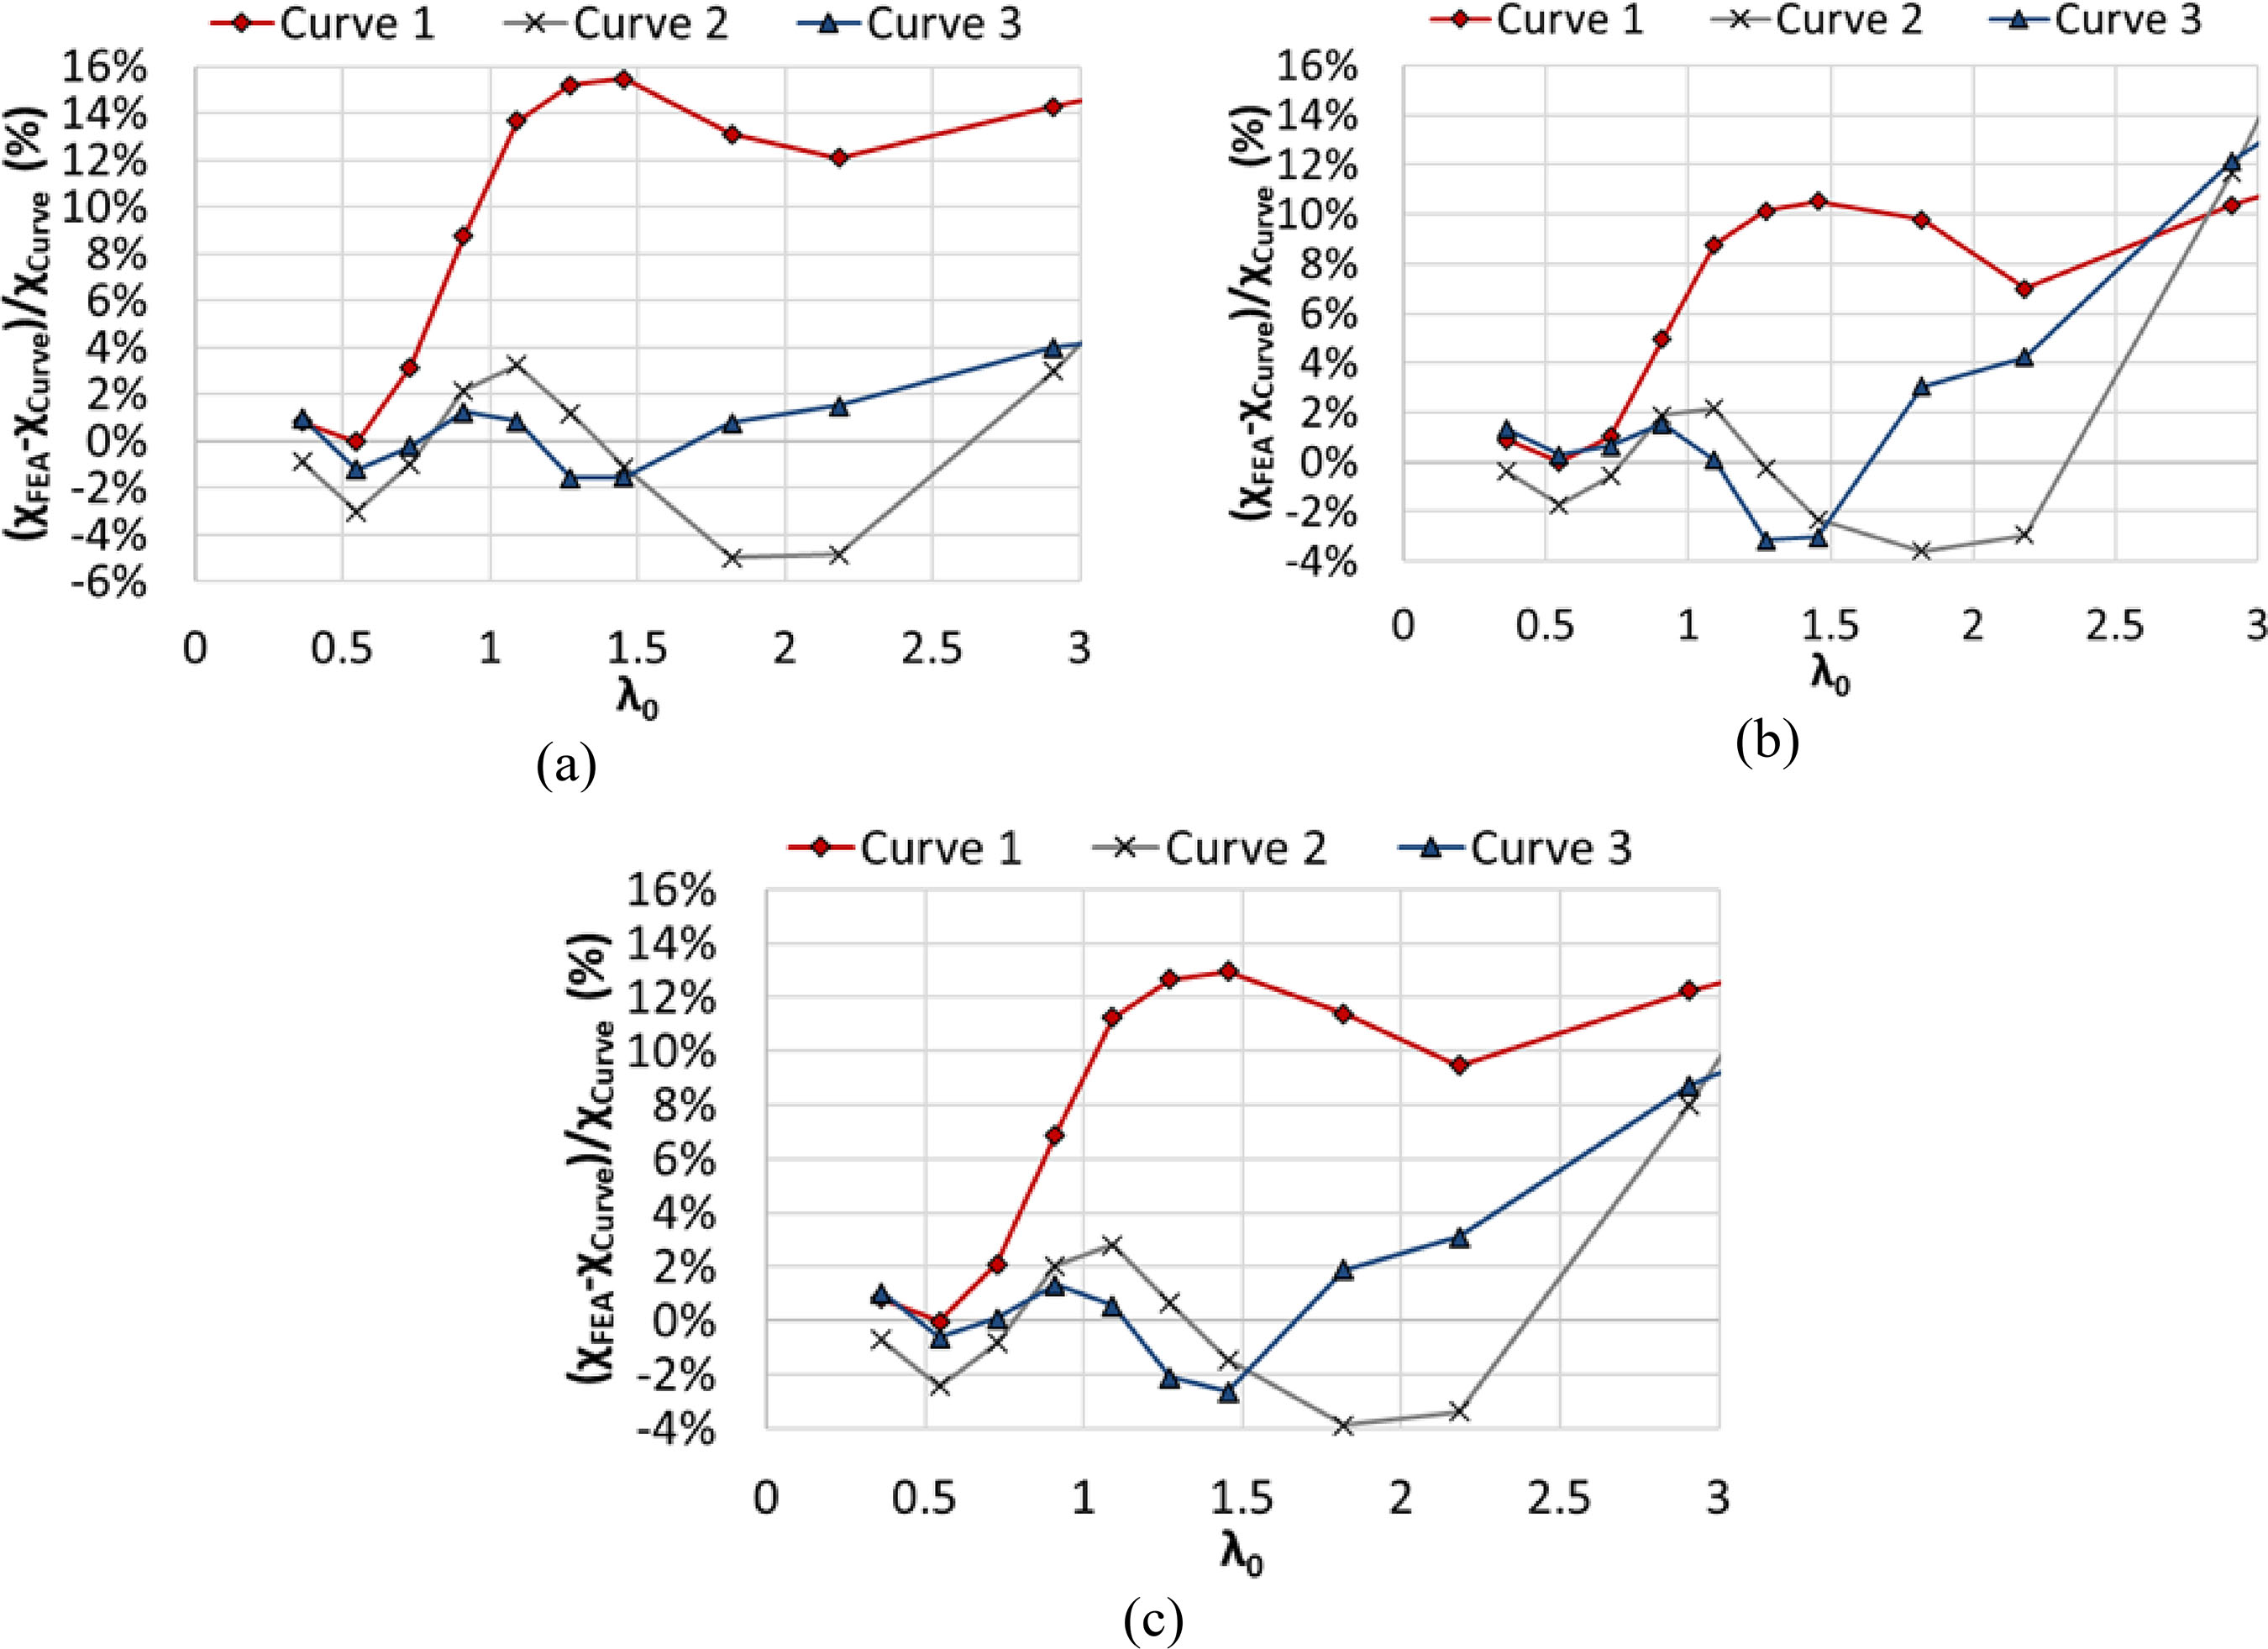
Figures 24 (a)–24(c) illustrate the percentage deviation between the reduction factors for global buckling obtained from finite element analysis (𝜒𝐹𝐸𝐴) and those predicted by the proposed curves (𝜒𝐶𝑢𝑟𝑣𝑒) for 460 MPa HSS columns. Figure 24(a) refers to average values associated with global buckling about the minor axis, while Figure 24(b) corresponds to the major axis. Figure 24(c) presents the deviations calculated using the mean of the values obtained for both axes.
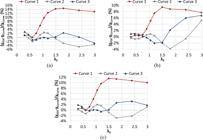
Percentage deviation between FEA results and the proposed curve for 460 MPa HSS columns: (a) minor axis; (b) major axis; (c) average of both axes
From Figures 24 (a)–24(c), it is evident that Curve 1 consistently underpredicts the buckling reduction factor of 460 MPa HSS columns compared to FEA results across most slenderness values, establishing it as the most conservative predictive model among the three proposed curves. Curve 3 demonstrates superior predictive accuracy for flexural buckling about the minor axis, whereas Curve 2 exhibits better agreement with the FEA data for major-axis buckling cases. For the major/minor case, Curves 2 and 3 display very similar performance, both closely matching the numerical results.
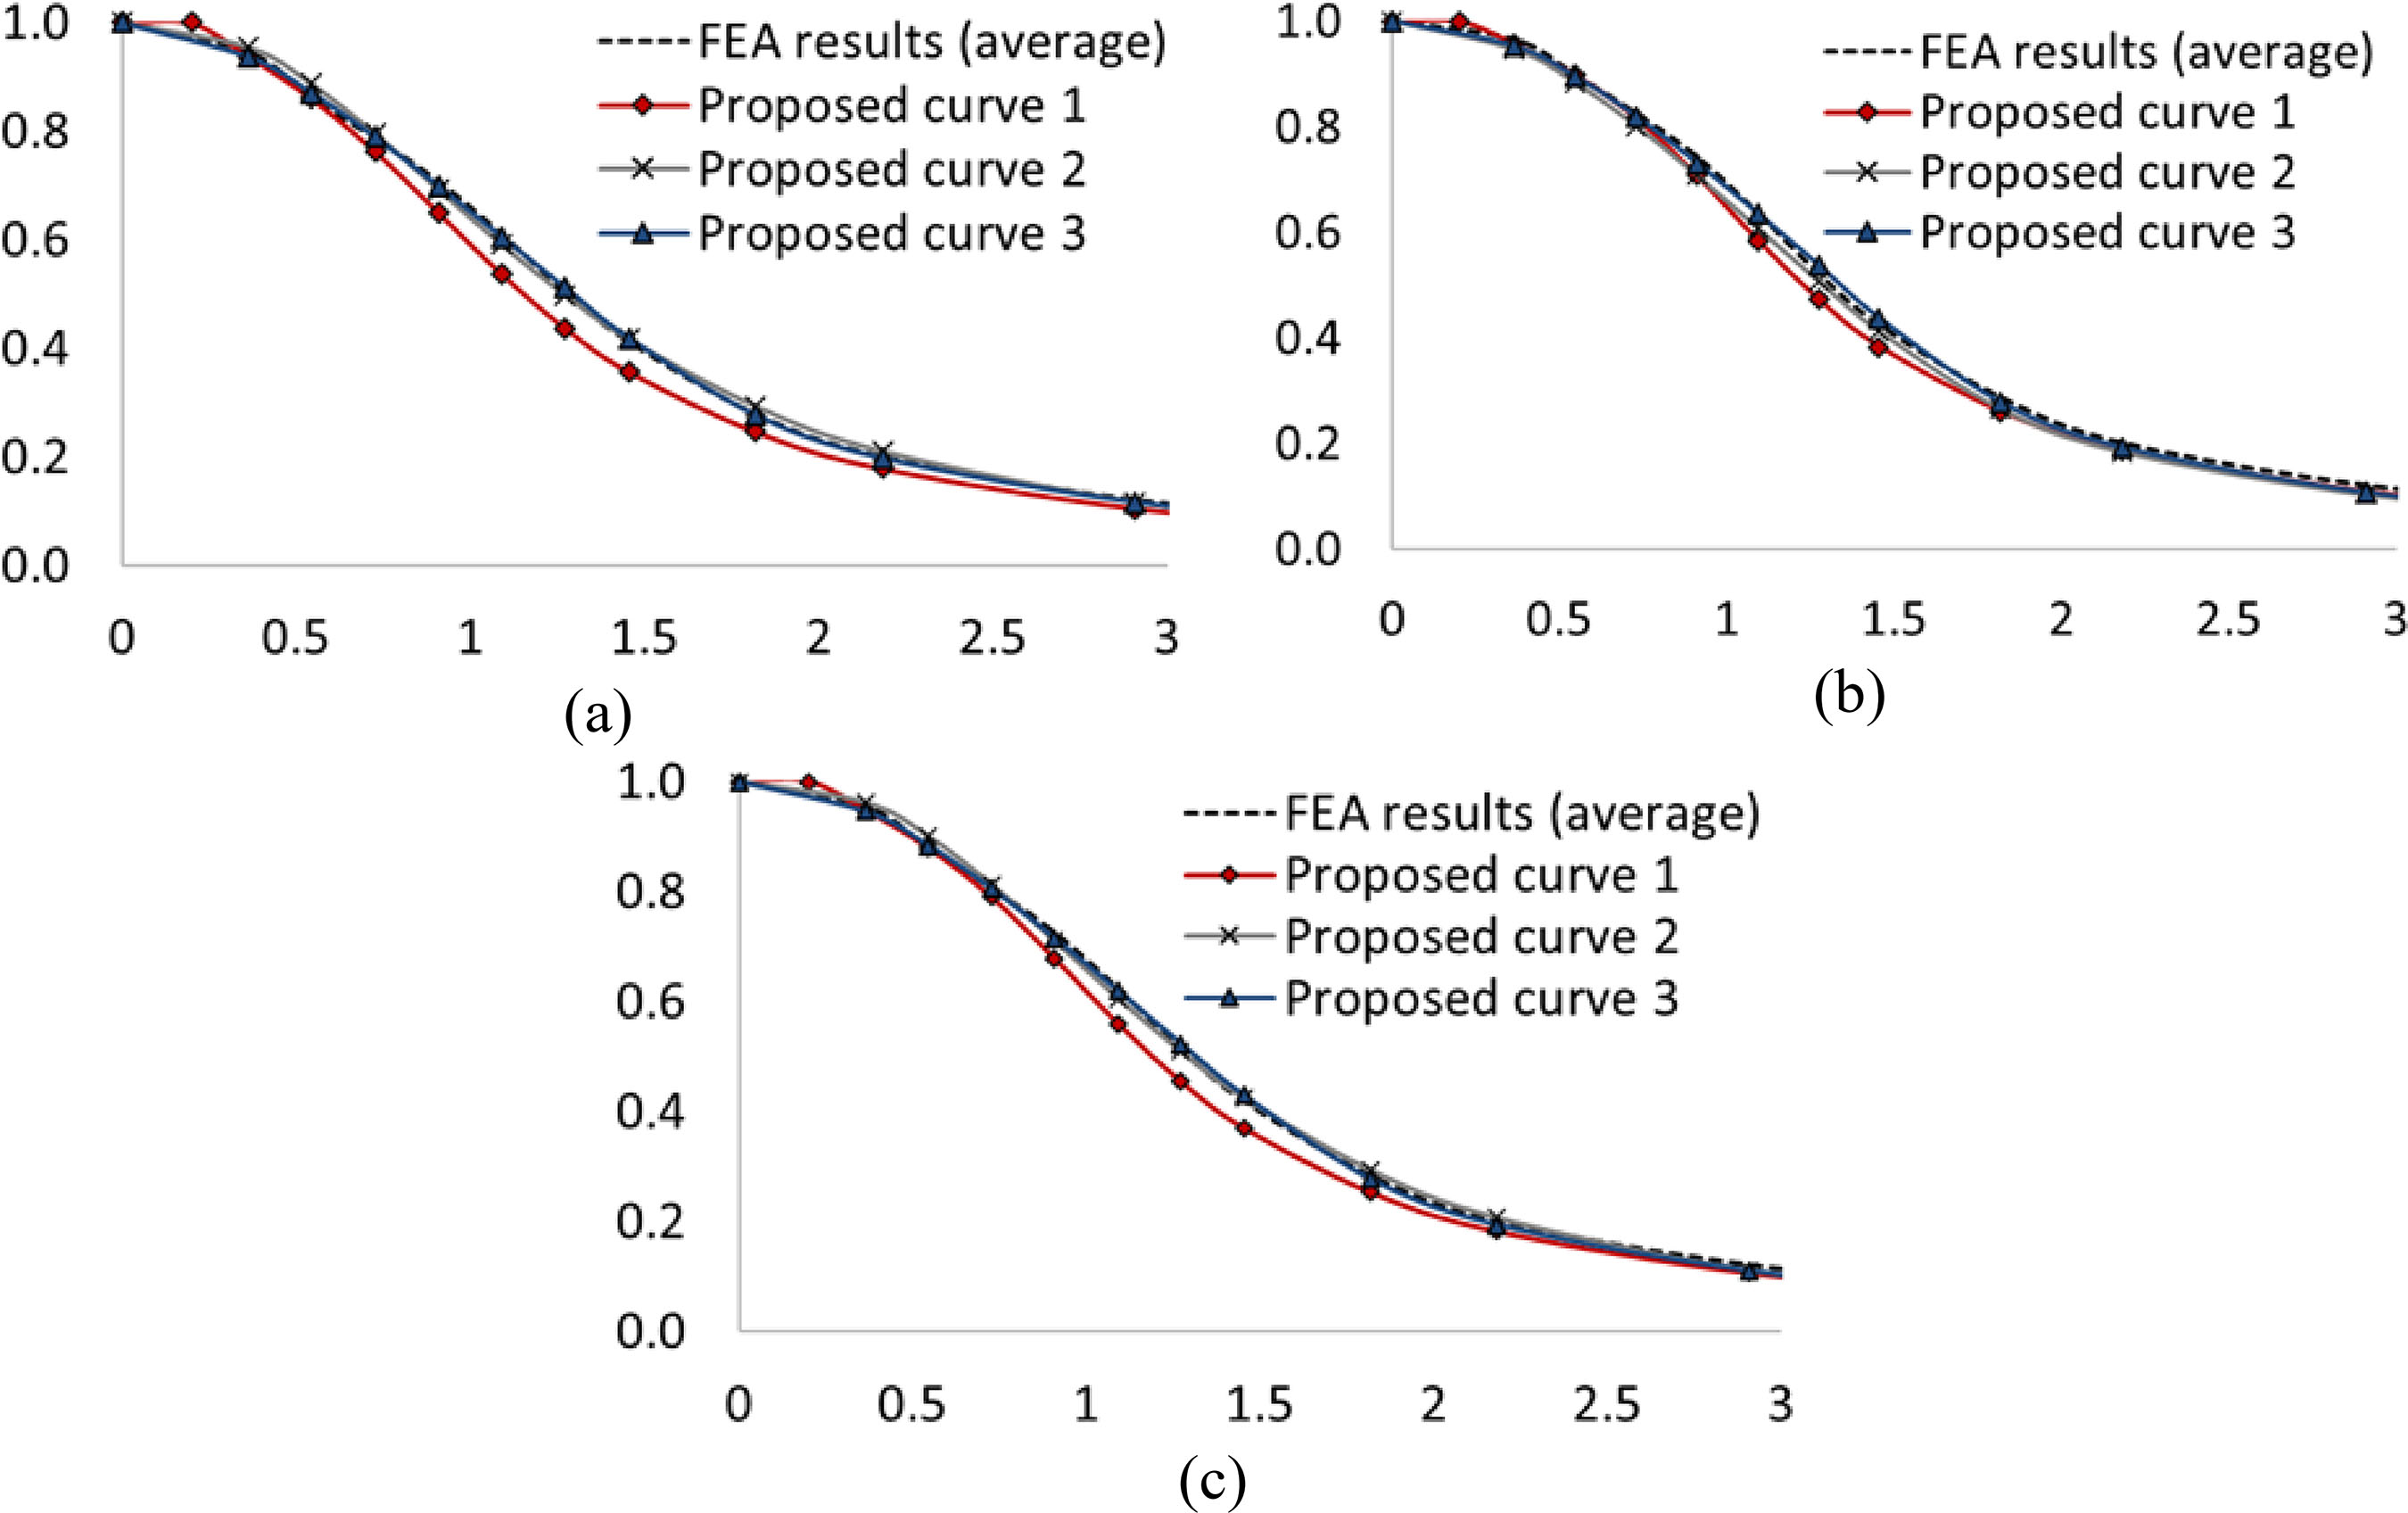
Figures 25(a)–25(c) illustrate the design curves proposed for 690 MPa HSS columns, derived from finite element analysis (FEA) results.
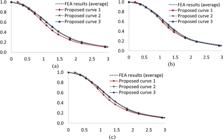
Proposed design curves based on FEA results for 690 MPa HSS columns: (a) minor axis; (b) major axis; (c) average of both axes
The percentage deviation between the reduction factors for global buckling obtained from finite element analysis (𝜒𝐹𝐸𝐴) and those predicted by the proposed curves (𝜒𝐶𝑢𝑟𝑣𝑒) for 690 MPa HSS columns is presented in Figures 26 (a)–26(c). From Figures 26(a)–26(c), a similar trend is observed for 690 MPa HSS columns. Curve 3 stands out as the most accurate predictive model for flexural buckling about the minor axis, while Curve 2 again shows better agreement with the FEA results for major-axis buckling. In the major/minor case, Curve 3 maintains its superior performance, closely aligning with the numerical results and confirming its broader applicability.
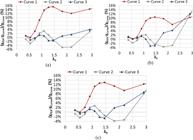
Percentage deviation between FEA results and the proposed curve for 690 MPa HSS columns: (a) minor axis; (b) major axis; (c) average of both axes
5 Conclusion
This study provided a detailed numerical investigation of the global buckling behavior of high-strength steel (HSS) columns with yield strengths of 460 MPa and 690 MPa. Welded I-section columns with flame-cut flange edges under axial compression were analyzed using a finite element model incorporating second-order effects, residual stresses, initial geometric imperfections, and material nonlinearity through a distributed plasticity approach.
The results revealed that both residual stresses and geometric imperfections significantly affect the buckling resistance of HSS columns. Residual stresses were more influential in short and intermediate-length columns and in buckling about the weak axis, while geometric imperfections had a more uniform impact across all sections and steel grades. More specifically, the effect of residual stresses remained significant up to normalized slenderness ratios of approximately 1.5 for 460 MPa steel and 1.25 for 690 MPa steel. Beyond these limits, their effect becomes negligible as elastic buckling governs the behavior.
When compared to the design curves of ANSI/AISC 360-16 (AISC, 2016) and Eurocode 3 (ECS, 2005), the numerical results showed that standard provisions tend to be conservative, especially for columns made of 690 MPa steel and for strong-axis buckling. Although the Eurocode 3 (ECS, 2005) curves provide safe predictions, they often underestimate the column strength. The ANSI/AISC 360-16 (AISC, 2016) curve, while simple, may lead to unconservative results in some scenarios, especially for 460 MPa HSS columns subjected to buckling around the weak axis.
To address these discrepancies, three new design curves were proposed for predicting the global buckling reduction factor (𝜒) of welded HSS I-section columns made from 460 MPa and 690 MPa steels. These curves were developed based on a detailed calibration against the average FEA results across a broad range of cross-sections and normalized slenderness values. Curve 1 adopts the Eurocode 3 format but employs recalibrated imperfection factors (𝛼) to better capture the behavior of high-strength steel columns. The 𝛼-values were selected to ensure the curve remains conservative by staying at or below the mean FEA results. The main parameters of Curves 2 and 3 were identified using optimization routines in Python with the SciPy library, ensuring minimal deviation from FEA predictions. Among them, Curve 3 exhibited the best overall agreement for both steel grades and buckling directions.
The findings presented in this study provide a more accurate representation of the buckling behavior of welded HSS columns and support the refinement of current design approaches. The proposed design curves offer a solid basis for updating existing standards or developing new guidelines for high-strength steels, contributing to safer and more efficient structural applications.
-
VIANA, H. F; SILVA, R. G. L. da; COSTA, R. S.; LAVALL, A. C. C.; FERREIRA, J. A.; OLIVEIRA, E. R. M. de; OLIVEIRA, M. G. de. Numerical investigation on the global stability of welded high-strength steel columns with flame-cut flange edges under axial compression. Ambiente Construído, Porto Alegre, v. 26, e150768, jan./dez. 2026. ISSN 1678-8621 Associação Nacional de Tecnologia do Ambiente Construído. http://dx.doi.org/10.1590/s1678-86212026000100942
-
Declaration of Generative AI and AI-Assisted Technologies in the Writing Process
During the preparation of this work the authors used ChatGPT in order to to check grammar issues and to improve readability. After using this tool/service, the authors reviewed and edited the content as needed and take full responsibility for the content of the publication.
-
Financial Support
The authors thank the Federal Center for Technological Education of Minas Gerais (CEFET-MG) and the Ânima Education Group for all financial support to carry out the research.
Data Availability Statement
Research data is only available upon request.
References
- AMERICAN INSTITUTE OF STEEL CONSTRUCTION. AISC 360-16: specification for structural steel buildings. Chicago, 2016.
- BAN, H.-Y; SHI, G.; SHI, Y.-J. Experimental and unified model investigations on residual stress within high strength steel welded I-sections. Engineering Mechanics, v. 31, n. 8, p. 83–91, 2014.
- BAN, H.; SHI, G. Overall buckling behaviour and design of high-strength steel welded section columns. Journal of Constructional Steel Research, v. 143, p. 180–195, 2018.
- DENG, Y. et al Buckling behaviour of Q460GJ welded H-section columns subjected to minor axis under axial compression. Structures, v. 34, p. 1416–1428, 2021.
- EUROPEAN COMMITTEE FOR STANDARDIZATION. Eurocode 3: design of steel structures: part 1-1: general rules and rules for buildings. Brussels, 2005.
- EUROPEAN COMMITTEE FOR STANDARDIZATION. Eurocode 3: design of steel structures: part 1-12: additional rules for the extension of EN 1993 up to steel grades S700. Brussels, 2007.
- EUROPEAN CONVENTION FOR CONSTRUCTIONAL STEELWORK. Manual on stability of steel structures 2nd ed. Technical Committee 8 – Structural Stability, 1976.
- EUROPEAN CONVENTION FOR CONSTRUCTIONAL STEELWORK. Ultimate limit state calculation of sway frames with rigid joints Technical Committee 8 – Structural Stability, 1984.
- FAKURY, R. H.; SILVA, A. L. R. C.; CALDAS, R. B. Dimensionamento de elementos estruturais de aço e mistos de aço e concreto São Paulo: Person Education do Brasil, 2016.
- JIANG, J. et al Flexural buckling behaviour of 690 MPa high strength steel H-section columns. Engineering Structures, v. 200, p. 109718, 2019.
- LE, T. et al. Residual stresses in welded high-strength steel I-Beams. Journal of Constructional Steel Research, v. 167, p. 105849, 2020.
- LI, D. et al Residual stresses of box and I-shaped columns fabricated from S960 ultra-high-strength steel. Journal of Constructional Steel Research, v. 166, p. 105904, 2020.
- MA, T. Structural behaviour of high strength Q690 steel welded H-sections under combined compression and bending Hong Kong, 2019. Thesis – The Hong Kong Polytechnic University, Hong Kong, 2019.
- MA, T.-Y. et al. Structural behaviour of slender columns of high strength S690 steel welded H-sections under compression. Engineering Structures, v. 157, p. 75–85, 2018.
- MACHADO, I. C. V. et al. Finite element model for advanced analysis of plane steel frames with hinged end conditions including von Mises criterion. Structures, v. 46, p. 1918–1937, 2022.
- SCHAPER, L. et al. A novel residual stress model for welded I-sections. Journal of Constructional Steel Research, v. 188, p. 107017, 2022.
- SHI, G.; CHEN, X. Research advances in HSS structures at Tsinghua University and codification of the design specification. Steel Construction, v. 11, n. 4, p. 286–293, 2018.
- SILVA, R. G. L. da et al. Formulation for second-order inelastic analysis of steel frames including shear deformation effect. Journal of Constructional Steel Research, v. 151, p. 216–227, 1 dez. 2018.
- SIMÕES, P. H. E. Análise numérica de pilares de aço em perfil soldado “H” de alta resistência submetidos à compressão e à flexocompressão Belo Horizonte, 2025. Dissertação (Mestrado em Engenharia Civil) – Centro Federal de Educação Tecnológica de Minas Gerais, Belo Horizonte, 2025.
- SIMÕES, P. et al A literature review on the structural behavior of high strength steel columns. Ambiente Construído, Porto Alegre, v. 25, p. e143746, jan./dez. 2025.
- SUN, Y. et al. Experimental and numerical investigations of S690 high-strength steel welded I-sections under combined compression and bending. Journal of Structural Engineering, v. 147, n. 5, p. 4021054, 2021.
- SUN, Y.; LIANG, Y.; ZHAO, O. Minor-axis flexural buckling behaviour and resistances of pin-ended S690 high strength steel welded I-section columns. Thin-Walled Structures, v. 156, p. 106980, 2020.
- VIANA, H. F. et al. Formulation for nonlinear dynamic analysis of steel frames considering the plastic zone method. Engineering Structures, v. 223, p. 111197, nov. 2020.
- XIONG, G. et al. Experimental and numerical studies on lateral torsional buckling of welded Q460GJ structural steel beams. Engineering Structures, v. 126, p. 1–14, 2016.
- XIONG, G. et al Lateral-torsional buckling behaviour of 690 MPa high strength steel beams. Structures, v. 33, p. 3999–4010, 2021.
- YANG, B. et al. Experimental and model investigation on residual stresses in Q460GJ thick-walled I-shaped sections. Journal of Constructional Steel Research, v. 145, p. 489–503, 2018.
- YANG, B. et al. Residual stresses in welded I-shaped sections fabricated from Q460GJ structural steel plates. Journal of Constructional Steel Research, v. 122, p. 261–273, 2016.
- ZHOU, Y. et al. Design methods of high strength steel welded H-sections under compression accounting for local–global buckling. Structures, v. 56, p. 104881, 2023.
- ZIEMIAN, R. D. Guide to stability design criteria for metal structures 6th. ed. Hoboken: John Wiley & Sons, 2010.
Edited by
-
Editor:
Marcelo Henrique Farias de Medeiros