
 Association of handgrip strength and CT-derived body composition with insulin resistance in women with prediabetes and newly diagnosed type 2 diabetes
Objective: To examine the associations of handgrip strength and CT-derived muscle and visceral fat indices with insulin resistance in middle-aged women with prediabetes and newly diagnosed type 2 diabetes.
Subjects and methods: This cross-sectional study included 44 women aged 40-60 years attending a tertiary endocrinology clinic. Participants were classified according to the American Diabetes Association (ADA, 2022) criteria as having prediabetes (n = 29) or newly diagnosed type 2 diabetes (n = 15). All participants underwent anthropometric assessment, biochemical testing, L3-level CT imaging for visceral adipose tissue (VAT) and psoas muscle measurements, and handgrip strength evaluation using a digital dynamometer. Insulin resistance was assessed using the homeostatic model assessment for insulin resistance (HOMA-IR). Multivariable linear regression analysis was performed to identify independent factors associated with HOMA-IR.
Results: Dominant-hand grip strength demonstrated an inverse association with HOMA-IR (β = -0.297, p = 0.033). VAT volume and BMI were not significantly associated with HOMA-IR after adjustment (p > 0.75). The overall model explained 28% of the variance in HOMA-IR (R2 = 0.28; adjusted R2 = 0.14). Psoas muscle thickness showed a borderline inverse relationship with HOMA-IR (p = 0.079).
Conclusion: In this cohort of women with early glucose dysregulation, handgrip strength was independently associated with insulin resistance, whereas visceral adiposity was not. These findings suggest that muscle performance may represent a clinically relevant correlation of early metabolic impairment. Longitudinal studies are needed to clarify the temporal relationships.
Keywords:
Keywords:; Handgrip strength; insulin resistance; HOMA-IR; visceral adiposity; CT imaging; prediabetes; type 2 diabetes; women
 Thumbnail
 Thumbnail
 Thumbnail
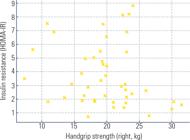
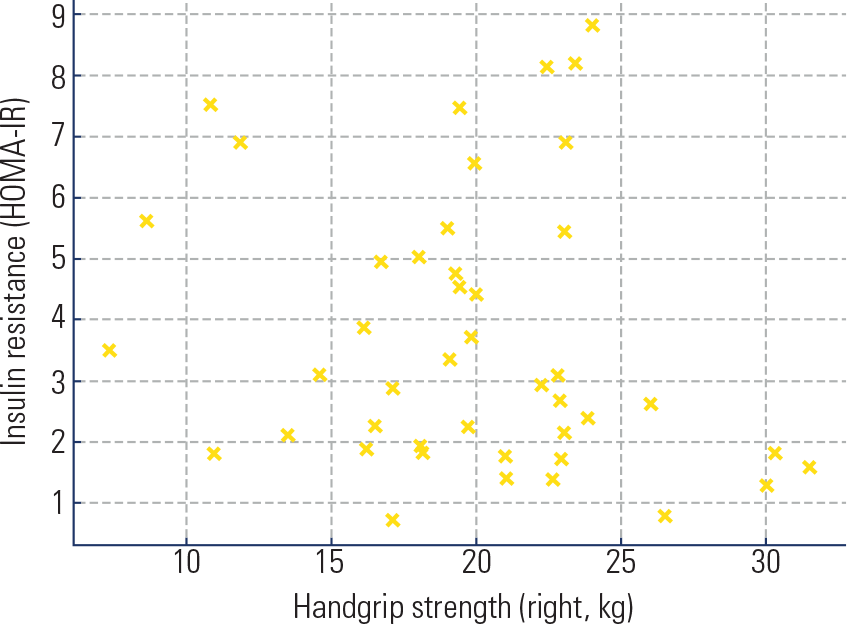 Scatter plot illustrating the inverse relationship between dominant-hand grip strength and insulin resistance (HOMA-IR). The regression line demonstrates a modest negative association (r = -0.29, p = 0.033).
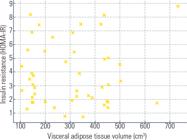
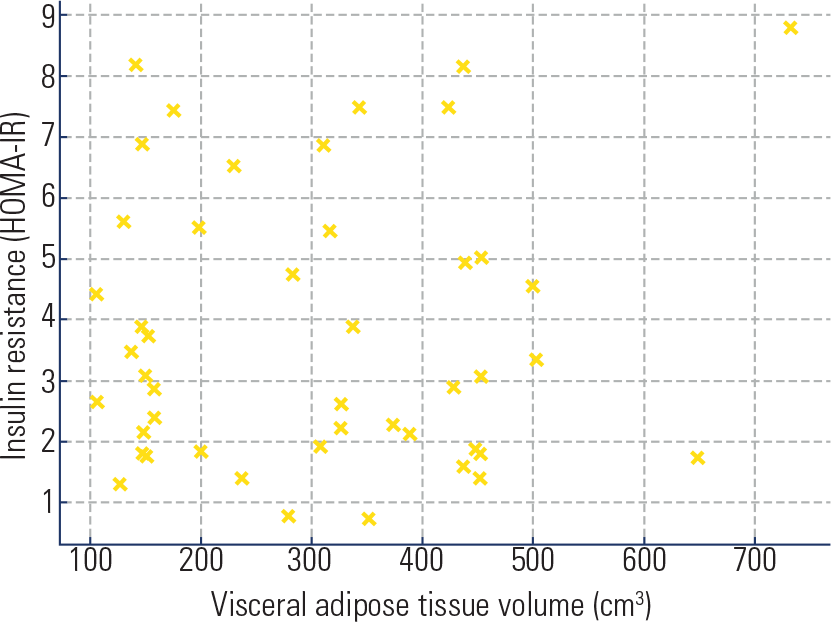 Scatter plot showing the relationship between visceral adipose tissue (VAT) volume and insulin resistance (HOMA-IR). No significant linear association was observed (r = 0.04, p = 0.81).
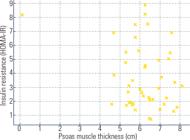
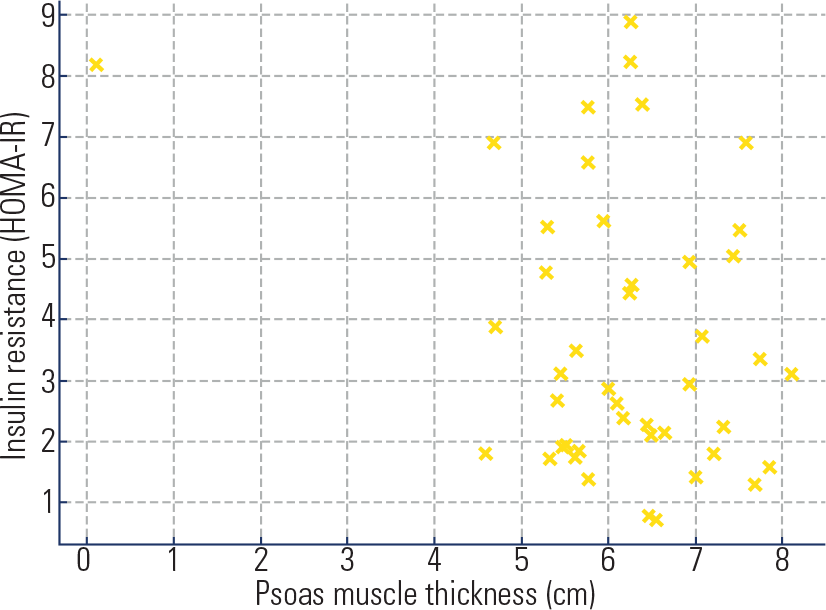 Scatter plot depicting the relationship between psoas muscle thickness (PMTH) and insulin resistance (HOMA-IR). A modest inverse trend was observed (β = -0.784, p = 0.079).