 Environmental characterization and phytoplankton community structure in a shallow mesotrophic tropical reservoir in southeastern Brazil
Abstract
Abstract
Aim The aim of the study was to characterize the temporal and spatial dynamics of the phytoplankton community structure using biomass (biovolume) data and biological indices.
Methods This study was conducted in the Biritiba Mirim Reservoir, São Paulo State, Brazil. The reservoir is used to supply water to the São Paulo Metropolitan Region. Four sampling campaigns were carried out during two distinct seasons (rainy and dry) over one year, across ten sampling stations along the reservoir. In situ parameters were measured using a multiparameter probe. Water samples were collected from the subsurface of the water column for physicochemical variable determination and phytoplankton laboratory analysis. The phytoplankton community was characterized based on biovolume and diversity indices. Exploratory and correlation analyses were performed to identify patterns and potential relationships between environmental variables and changes in community structure.
Results The reservoir was classified as mesotrophic in terms of trophic status. A total of 184 taxa were identified, distributed across 15 classes, with Chlorophyceae and Cyanobacteria being the most species-rich (42 and 29 taxa, respectively). During the dry season, longer water residence times and higher phytoplankton biomass were observed, correlating with increased nutrient concentrations. In the rainy season, shorter water residence times were recorded, with limnological variables significantly influencing phytoplankton community composition and distribution.
Conclusions These results highlight the importance of considering both seasonality and hydrological dynamics in the management and conservation of aquatic ecosystems such as the Biritiba Mirim Reservoir.
Keywords:
phytoplankton; water quality; reservoir; mesotrophic; seasonality
Resumo
Resumo
Objetivo O objetivo do estudo foi caracterizar a dinâmica temporal e espacial da estrutura da comunidade fitoplanctônica utilizando dados de biomassa (biovolume) e índices biológicos.
Métodos Este estudo foi desenvolvido no reservatório Biritiba Mirim, Estado de São Paulo, Brasil. O reservatório é utilizado para abastecimento de água da Região Metropolitana de São Paulo. Foram realizadas quatro coletas em duas épocas distintas (chuva e seca) durante um ano, em dez estações de amostragem ao longo da extensão do reservatório. Em campo, foram mensurados parâmetros utilizando uma sonda multiparâmetros. Amostras de água foram coletadas na sub-superficie da coluna d’água para a determinação das variáveis físico-químicas e para a análise do fitoplâncton em laboratório. A caracterização da comunidade fitoplanctônica foi feita por meio do biovolume e pelos índices de diversidade. Análises exploratórias e de correlação foram realizadas para verificar padrões e possíveis relações entre as variáveis ambientais e mudança na estrutura da comunidade.
Resultados O reservatório foi classificado, quanto à trofia, como mesotrófico. Foram identificados 184 táxons, distribuídos em 16 classes: Chlorophyceae e Cyanobacteria foram as classes com maior riqueza, sendo 42 e 29 táxons, respectivamente. Durante o período seco, verificou-se um maior tempo de residência da água e maior biomassa fitoplanctônica, correlacionados com as maiores concentrações de nutrientes. No período chuvoso foram registrados os menores tempos de residência da água e com as variáveis limnológicas exercendo influência significativa na composição e distribuição da comunidade fitoplanctônica.
Conclusões Estes resultados sublinham a importância de considerar tanto a sazonalidade quanto a dinâmica hidrológica na gestão e conservação de ecossistemas aquáticos como o reservatório Biritiba Mirim.
Palavras-chave:
fitoplâncton; qualidade da água; reservatório; mesotrófico; sazonalidade
1. Introduction
Phytoplankton is an essential component of the food chain, playing a fundamental role in the circulation of materials and energy flow in fluvial or aquatic ecosystems. Due to the high diversity of species, each with distinct environmental preferences (Kutlu et al., 2020), and high sensitivity to environmental factors and rapid response to environmental conditions (Goshtasbi et al., 2021), the community is of great importance in environmental monitoring studies of water bodies (Bilous et al., 2016), being widely recognized as a bioindicator of water quality (e.g., Atazadeh et al., 2007; Wu et al., 2017; Chun et al., 2018). Monitoring phytoplankton populations can provide information about ecosystem conditions (Chandel et al., 2023). Thus, understanding the mechanisms that affect phytoplankton assemblages is essential for the management and conservation of aquatic environments (Lv et al., 2013).
Water supply reservoirs play vital roles in water security and biodiversity maintenance (Tundisi & Matsumura-Tundisi, 2003). However, they are subject to various environmental and operational pressures (Xu et al., 2019), which cause changes in hydrological dynamics and water quality (Tundisi, 2018) and therefore affect the stability and diversity of the ecosystem (Angelini et al., 2005; Tundisi, 2006, 2018). The hydrodynamics of aquatic systems play a crucial role in nutrient dispersion and availability, directly influencing algal communities (Cardoso & Marques, 2009; Smits et al., 2023). Factors such as water residence time - WRT (Rangel et al., 2012; Londe et al., 2016), morphometry (Calijuri et al., 2002), and hydrology (Kalff, 2002) significantly affect phytoplankton dynamics in reservoirs.
Water flow events, for instance, have been shown to impact phytoplankton distribution in these environments (Yang et al., 2018; Ishikawa et al., 2022). Nutrient input, combined with hydrological conditions, creates gradients that extend throughout the reservoir, affecting the characteristics and composition of the phytoplankton community (Bilous et al., 2016; Liu et al., 2024; Ishikawa et al., 2022). Notably, the hydrological regime and WRT can be as decisive as nutrient availability in determining community structure (Liu et al., 2024), which makes it essential to understand aquatic hydrodynamics to predict and manage changes in algal communities, contributing to more effective conservation and management strategies for aquatic ecosystems.
In Amazonian lakes, for example, the rainy season generates unstable conditions, with abrupt changes in the community and high phytoplankton biovolume, while the dry season, with longer WRT, favors the hydrodynamic stability of the water column and the dominance of cyanobacteria (Passarinho et al., 2013). In fact, environments with lower WRT and higher flow tend to inhibit algal blooms. This occurs because the lower WRT directly impacts hydrodynamic stability by promoting vertical mixing (Barroso et al., 2016; Zhao et al., 2022), which, in turn, alters the redistribution of nutrients and light in the water column (Rakhuba, 2020), reducing nutrient uptake by algae and inhibiting their metabolism (Huang et al., 2023). On the other hand, longer WRT favors the accumulation of nutrients, promoting phytoplankton and the dominance of species adapted to stable conditions, such as cyanobacteria (Romo et al., 2012; Londe et al., 2016). Therefore, some cities seek to increase flow or select lakes and reservoirs with shorter WRT as sources of drinking water (Huang et al., 2023). In other cases, WRT can be managed to balance the need for water storage during the dry season while maintaining water quality standards (Londe et al., 2016).
The Metropolitan Region of São Paulo (RMSP), with more than 21 million people, is the most populous urban agglomeration in Brazil (IBGE, 2022). Meeting the water demand of this population is a major challenge for managers. The Alto Tietê Water Supply System (SPAT) is one of the systems used to supply the RMSP. Under normal operation, it provides 15.6 m3/s of water, contributing to the supply of 4.5 million people in the RMSP (SABESP, 2022). The SPAT is composed of five reservoirs, among them the Biritiba Mirim reservoir, which has 65% of its area covered by forest and the remaining areas consisting of anthropized classes, such as agricultural regions and rural properties, which influence the water quality of the reservoir (Fermoseli Júnior et al., 2023).
Indeed, land-use types can influence reservoir water quality (Taniwaki et al., 2013), but they also directly affect phytoplankton species diversity and productivity (Zhang et al., 2020; Sánchez et al., 2021). Thus, both spatial processes, such as land use, and temporal processes, such as WRT, within aquatic environments are closely linked to phytoplankton community structure and beta diversity (Zhang et al., 2018).
Therefore, in this study we assumed that phytoplankton structure and dynamics are determined by the interaction between land use and water residence time, so that preserved areas with longer WRT show greater stability and community complexity, while anthropized areas with shorter WRT show lower diversity and predominance of species adapted to unstable conditions. This study aimed to investigate temporal and spatial changes in phytoplankton structure and dynamics in a preserved area (riparian forest) and a non-preserved area (agricultural zone) of this reservoir, identifying the factors that influence its organization and assessing: i) whether species distribution in the reservoir is homogeneous or heterogeneous; ii) whether there was a difference in total phytoplankton biomass between preserved and non-preserved areas during the study period; iii) whether there are spatial differences in phytoplankton diversity and richness.
2. Materials and Methods
2.1. Study area and sampling stations
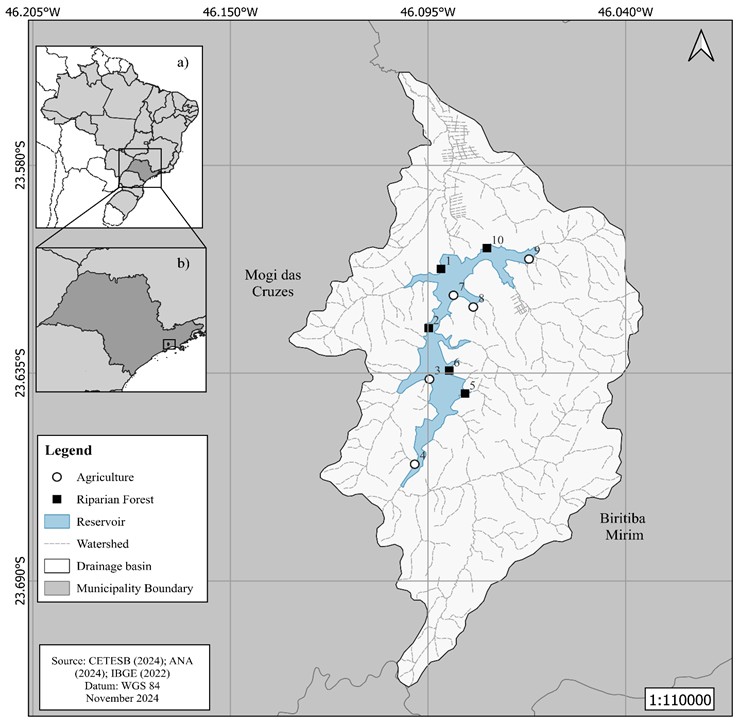
The Biritiba Mirim reservoir is a mesotrophic system (Fermoseli Júnior et al., 2023) intended for water supply, located between the municipalities of Mogi das Cruzes and Biritiba Mirim, in the eastern portion of the Metropolitan Region of São Paulo (RMSP), at coordinates 23°36'12.144"S, 46°5'13.653"W, in southeastern Brazil (Figure 1). In the surrounding area of the reservoir, land use and occupation correspond to 65.01% forested area (native or planted) versus 24.5% of areas occupied by some type of agricultural anthropogenic activity (Fermoseli Júnior et al., 2023). According to DAEE (2006), the reservoir has the following characteristics: maximum height of 26 m, length of 535 m, width of 10 m, useful volume of 34.76 million m3, and flow rate of 1.75 m3 s−1.
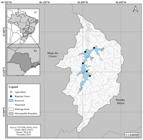
Location of the study reservoir (Biritiba Mirim) within its drainage area (Biritiba Mirim Basin), showing the sampling stations. a) Location of the Biritiba Mirim Basin in Brazil. b) Location of the Biritiba Mirim Basin within the state of São Paulo. Units 3, 4, 7, 8 and 9 in white circles represent sampling stations in non-preserved areas (Agricultural Zone), and units 1, 2, 5, 6 and 10 in black squares represent sampling stations in preserved areas (Riparian Forest).
2.2. Sampling design
Samples were collected from the subsurface of the water column along the reservoir at 10 previously established sampling stations during the dry season (August 2019 and May 2020) and the rainy season (November 2019 and February 2020). The sampling stations are distributed as follows: 5 stations are located near the Riparian Forest (RF), and 5 are near the agricultural zone (AZ) (Figure 1, Table 1).
Codes of the 10 sampling stations, their respective geographic coordinates, surrounding area characteristics, and depths in the Biritiba Mirim reservoir.
2.3. Analyzed variables
Precipitation data were obtained from the database of the Water Production Systems, made available online by SABESP (2022), which collects daily data from the reservoirs comprising the system.
The abiotic variables measured included water temperature (°C), total dissolved solids (g L-1), dissolved oxygen (mg L−1), pH, electrical conductivity (µS cm−1), and turbidity (NTU), measured using a Horiba multiparameter probe, Model U22. Water transparency was estimated by measuring the depth at which the Secchi disk disappeared (m). Other variables such as total nitrogen and total phosphorus (Valderrama, 1981), nitrite and nitrate (Mackereth et al., 1978), ammonium ion (Solorzano, 1969), orthophosphate (Strickland & Parsons, 1960), alkalinity (Golterman & Clymo, 1971) and chlorophyll-a (Sartory & Grobbelaar, 1984) were collected, preserved, and analyzed according to APHA (2012). The dissolved inorganic nitrogen (DIN) was calculated as the sum of nitrate, nitrite, and ammonium. The Nitrogen: Phosphorus Molar Ratio (N:P molar ratio) was calculated to determine the limiting nutrient. The results were compared with the Redfield Ratio (Redfield, 1958; Redfield et al., 1963), which establishes that if the N:P molar ratio of the system is less than 16:1, the system is considered nitrogen-limited (N-limited); if it is greater than 16:1, it is considered phosphorus-limited (P-limited) (Vidal et al., 2003). Water residence time (WRT) was estimated for the study period. The WRT calculation was based on the ratio between the volume of water stored in the reservoir and its outflow (Rueda et al., 2006) during the sampling months, using data from the SABESP (2022) water monitoring station; the result was expressed in days.
2.4. Phytoplankton community sampling and analysis
Samples for the taxonomic analysis of the phytoplankton community were collected using a plankton net with a mesh opening of 20 µm and preserved in 4% formalin. Taxonomic analysis was performed using a Zeiss Axioplan 2 light microscope.
Samples for the quantitative analysis of the phytoplankton community were collected directly from the subsurface using glass flasks and preserved with 1% Acetic Lugol's solution. Quantitative analysis followed the Utermöhl method (1958), using a Zeiss Axiovert 25 inverted microscope and sedimentation chambers of 5 mL or 25 mL, with a sedimentation time of three hours per centimeter of chamber height (Lund et al., 1958). A counting limit was established through a taxon rarefaction curve and the counting of either 100 individuals of the most common taxon or 400 individuals in total. Every coenobium, colony, cell, or filament was considered an individual.
Phytoplankton biomass was estimated based on biovolume (mm3 L−1), which was converted to biomass where mm3 L−1 = mg L−1 (Wetzel & Likens, 2000). The biovolume values of the species were obtained from specialized literature (Fonseca et al., 2014). For taxa without available biovolume information, the cell volume was calculated and then multiplied by the density of each taxon. The volume of each cell was estimated using geometric shapes, or a combination of shapes, that best approximated the morphology of the individuals, according to Hillebrand et al. (1999), Sun & Liu (2003), Vadrucci et al. (2007), Fonseca et al. (2014), and then multiplied by the average number of cells.
Descriptor species of the community were those with relative biovolume values above 1% and collectively accounted for more than 80% of the total sample biovolume. Additionally, biological indices, based on biovolume, were estimated to describe the structure of the phytoplankton community: Dominance Index (D’) (Simpson, 1949), Diversity Index (H’) (Shannon & Weaver, 1963), Evenness Index (U’) (Pielou, 1966), and specific richness (total number of taxa in the sample).
2.5. Statistical analysis
To assess spatial dependence between sampling stations and limnological variables, the Global Moran's Index (I) (Moran, 1950) was applied. The results indicated no spatial dependence among the sampling points, based on the index values. This analysis was performed using ArcGIS software version 10.1 (ESRI, 2001). To determine the variability of environmental data over the study period, Principal Component Analysis (PCA) was used. Canonical Correspondence Analysis (CCA) was employed to relate abiotic variables with biotic variables (descriptor species). The selection of the biotic matrix for the CCA was based on the PCA results. The choice of analysis was based on Detrended Correspondence Analysis (DCA) (Hill & Gauch Junior, 1980), in which the data were pre-tested to select the most appropriate method. For these analyses, a covariance matrix was used, and both biotic and abiotic data (except pH) were transformed using range normalization [(x - xmin) / (xmax - xmin)]. These analyses were performed using PC-ORD version 6.0 for Windows (McCune & Mefford, 2011). Spearman correlation analysis was conducted to investigate the relationship between biovolume values and the analyzed limnological and climatological variables. A Kruskal-Wallis test was performed to detect statistically significant differences between biological indices and descriptor species in relation to temporal and spatial factors, with a significance level set at p<0.05. Other graphs were generated using GraphPad Prism version 9.0.0 for Windows (GraphPad Software Inc., 2020).
3. Results
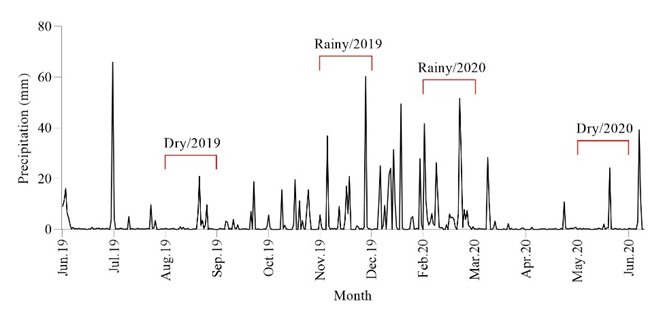
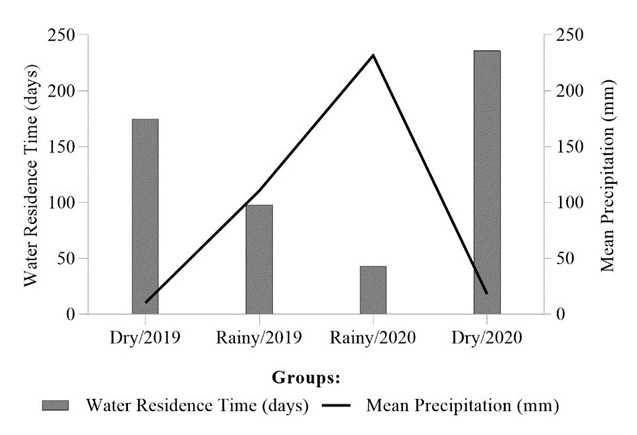
Average precipitation reached a maximum value of 231.8 mm (rainy season/2020) and a minimum of 10.2 mm (dry season/2019) (Figures 2 and 3). The dry season presented the highest water residence times (236 days in 2020 and 175 days in 2019), while the rainy season had the lowest values (98 days in 2019 and 43 days in 2020) (Figure 3). The overall average for the study period was 92 days.
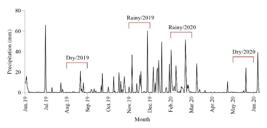
Monthly variation in precipitation (mm) from June 2019 to June 2020 for the Biritiba Mirim reservoir during the study period.
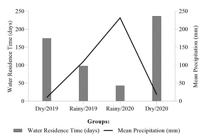
Annual variation of water residence time (days) and mean monthly precipitation during the study period in the Biritiba Mirim Reservoir.
Little spatial and temporal variation was observed in the environmental parameters analyzed throughout the study period and among sampling stations, such as total nitrogen concentrations (RF: 298,9 ± 79,1 µg L-1 to 436,4 ± 35,2 µg L-1; AZ: 320,7 ± 13,4 µg L-1 to 487,9 ± 61,4 µg L-1), chlorophyll-a (RF: 1,84 ± 0,11 µg L-1 to 2,26 ± 0,36 µg L-1;AZ: 2,38 ± 0,4 µg L-1 to 3,04 ± 1,01 µg L-1), and water transparency (RF: 1,35 ± 0,04 m a 1,5 ± 0,7 m; AZ: 1,26 ± 0,2 m a 1,69 ± 0,1 m). Spatial variation influenced nutrient limitation, the system was phosphorus-limited (RF: 24,66 ± 2,63 to 43,5 ± 2,7; AZ: 31,3 ± 5,6 to 51,8 ± 12,1). The values of the other variables analyzed over the study period are also presented in Table 2.
Mean, minimum, and maximum values of the physical, chemical, and biological variables analyzed at the sampling units during the study period.
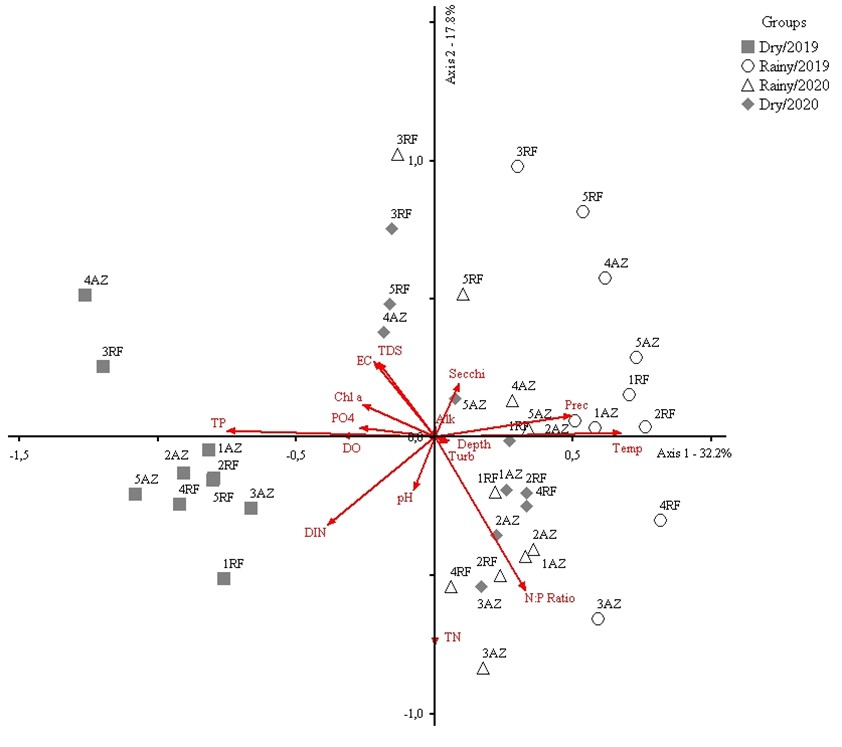
The Principal Component Analysis (PCA) (Figure 4) explained 53.2% of the total data variability in the first two axes, suggesting that temporal variation (seasonality) was the main factor related to abiotic changes during the study. Sampling units were heterogeneously distributed in the PCA plot, with no evident groupings.
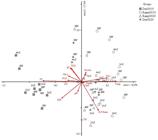
Biplot ordination by PCA of the sampling units and the sixteen abiotic variables analyzed. Abiotic variables: Alkalinity (Alk), Chlorophyll a (Chl a), Electrical Conductivity (EC), Total Phosphorus (TP), Dissolved Inorganic Nitrogen (DIN), Total Nitrogen (TN), Dissolved Oxygen (DO), Orthophosphate (PO4), Hydrogen Potential (pH), Precipitation (Prec), Depth, N:P Molar Ratio (N:P Ratio), Total Dissolved Solids (TDS), Temperature (Temp.), Water Transparency (Secchi), and Turbidity (Turb). Sampling units were identified according to land use and cover around the study site, being Riparian Forest (1RF to 5RF) and Agricultural Zone (1AZ to 5AZ). The numbers in front of the sampling units, from 1 to 5, correspond to the sampling point locations.
On axis 1, stations during the rainy periods (2019 and 2020) were associated with high temperature and precipitation (r = 0.8 and r = 0.7, respectively), while the dry seasons (2019 and 2020) were associated with dissolved oxygen (r = -0.6), total phosphorus (r = -0.8), orthophosphate (r = 0.5), and dissolved inorganic nitrogen (r = -0.9). On axis 2, total dissolved solids (r = 0.5) and electrical conductivity (r = 0.5) were positively associated with both seasons. On the negative side of axis 2, total nitrogen (r = -0.8), dissolved inorganic nitrogen (r = -0.5), and the TN:TP ratio (r = -0.8) were the most representative variables (Figure 4).
A total of 184 taxa were identified during the qualitative analysis, distributed across 16 classes: Chlorophyceae (42), Cyanobacteria (29), Trebouxiophyceae (22), Cryptophyceae (18), Euglenophyceae (17), Chrysophyceae (12), Zygnematophyceae (12), Bacillariophyceae (8), Coscinodiscophyceae (7), Chlamydophyceae (6), Xanthophyceae (4), Klebsomidiophyceae (2), Prasinophyceae (2), Fragillariophyceae (1), Mediophyceae (1), and Dinophyceae (1).
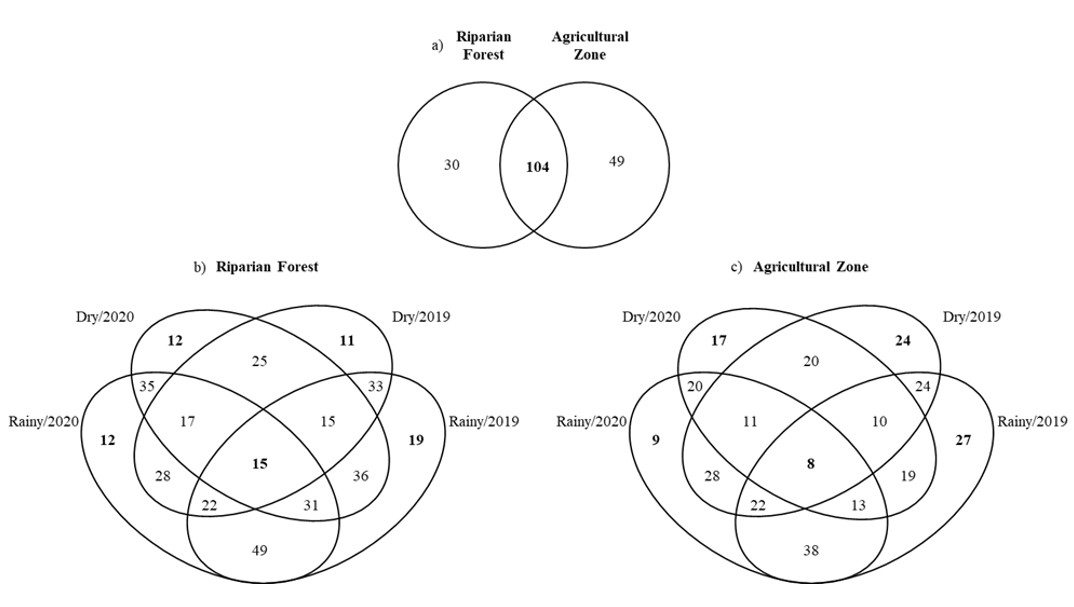
The Venn diagram (Figure 5) refers to the distribution of taxa among sampling units and revealed no significant spatial or temporal variation (p > 0.05); however, differences in taxon richness between the two periods were observed (p < 0.001). Of the 183 taxa, 104 were common among all sampling units, 30 were exclusive to RF, and 49 were exclusive to AZ (Figure 5a). Regarding temporal variation, 64 taxa were exclusive to the dry season (2019 and 2020), and 67 taxa were exclusive to the rainy season (2019 and 2020) (Figures 5bc). Values highlighted on the periphery of Figures 55c represent taxa exclusive to each individual sampling event.

Venn diagram showing the occurrence of phytoplankton taxa among sampling stations and study periods in the Biritiba Mirim reservoir, São Paulo. a) Distribution based on shared taxa representing spatial differences between Riparian Forest and Agricultural Zone stations. b) Distribution based on shared taxa among Riparian Forest sampling stations between rainy and dry periods. c) Species distribution based on shared taxa in Agricultural Zone sampling stations between rainy and dry periods. The number of unique and common taxa in each area/period is highlighted in bold.
In the quantitative analysis of the community, 20 taxa were classified as descriptors, together with contributing 89% of the total biovolume (Table 3).
Descriptor taxa, abbreviation (ID), taxonomic class, and percentage contribution to the total biovolume.
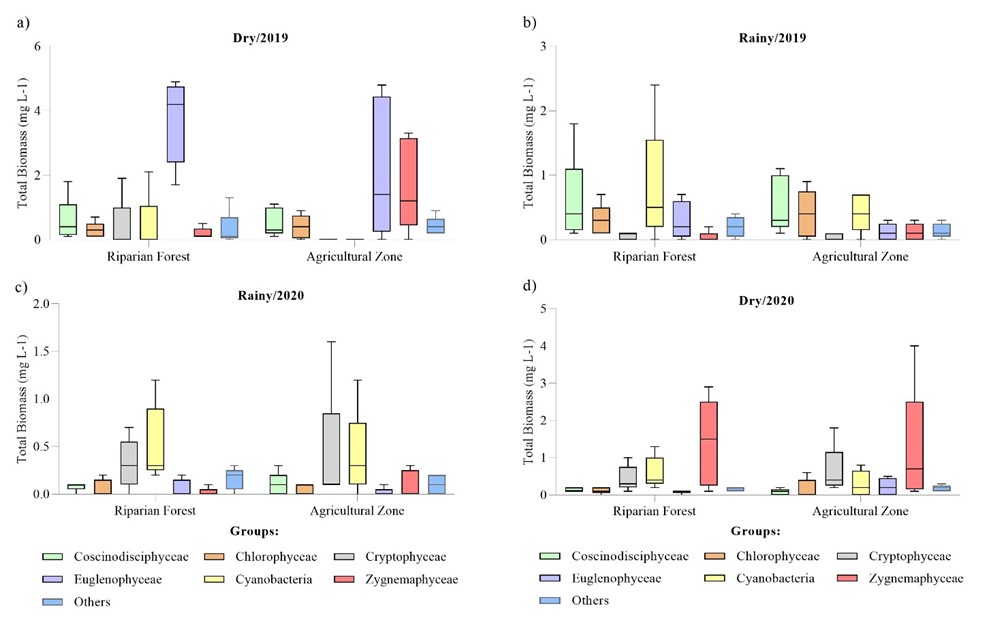
There was an alternation in class dominance across the study periods. The highest biovolume values were observed during the dry season of 2019 (station 1RF – 11.2 mg L−1), mainly due to the contribution of Trachelomonas volvocinopsis (Euglenophyceae), also recorded in most stations during that dry season. During the dry season of 2020, Mougeotia sp. (Zygnematophyceae) and Cryptomonas tetrapyrenoidosa (Cryptophyceae) increased in contribution (Figure 6). The lowest total biovolume values were observed in the rainy season of 2020 (station 2AZ – 0.3 mg L−1). In the rainy periods of 2019 and 2020, Cyanobacteria was the most dominant group due to the prevalence of Dolichospermum planctonicum and Chroococcus dispersus, respectively (Figure 6).
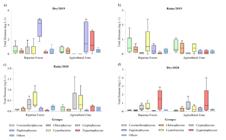
Total biomass (mg L−1) of phytoplankton classes at each sampling station during the study period: a) Dry/2019, b) Rainy/2019, c) Rainy/2020, d) Dry/2020. Charts with distinct scales.
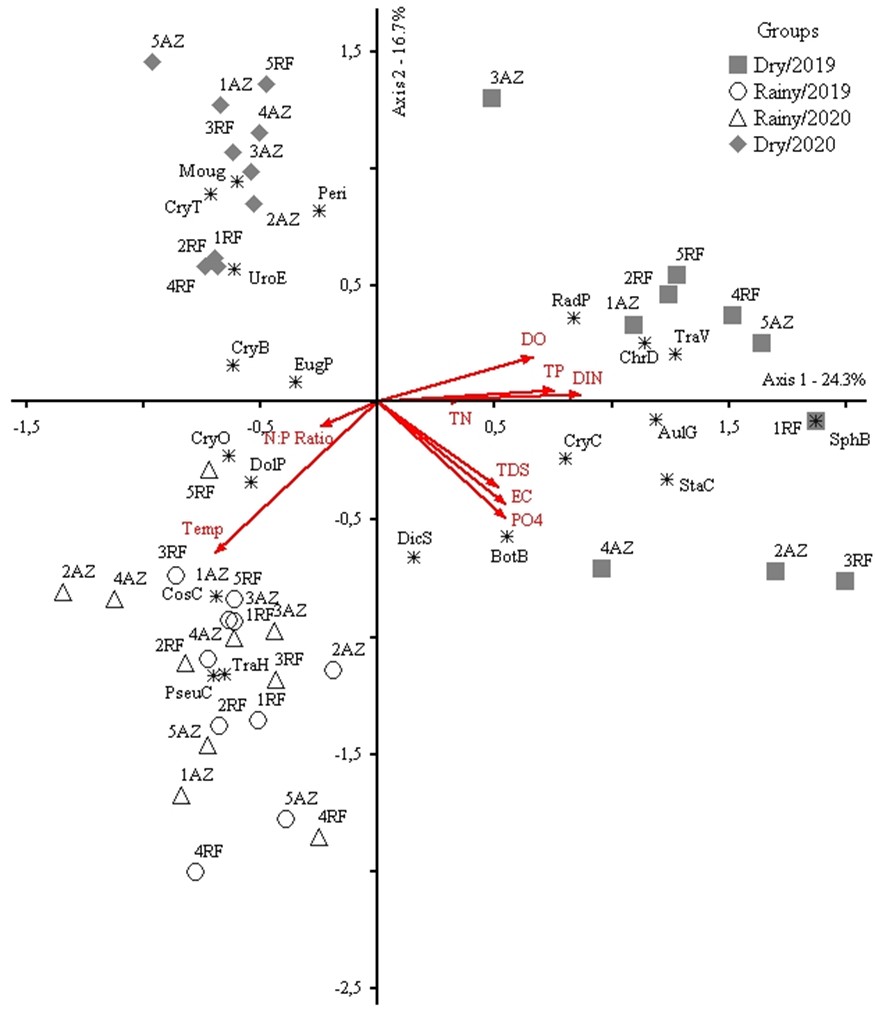
The Canonical Correspondence Analysis (CCA), performed with 20 descriptor species and 9 environmental variables, explained 41% of the total variability in the first two axes, both statistically significant (p = 0.001). The species–environment correlation was high and significant for axes 1 and 2 (p = 0.001). Intra-set correlations and canonical coefficients indicated that total phosphorus, dissolved oxygen, dissolved inorganic nitrogen, total dissolved solids, electrical conductivity, and orthophosphate were the most influential variables on axis 1, whereas temperature was the main driver on axis 2 (Figure 7).
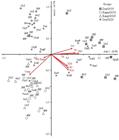
Ordination by CCA of the sampling units generated from twenty system descriptor species and 9 abiotic variables. Sampling units were identified according to land use and cover around the research site, being Riparian Forest (1RF to 5RF) and Agricultural Zone (1AZ to 5AZ). Abiotic variables: Electrical Conductivity (EC), Dissolved Oxygen (DO), Temperature (Temp.), Total Nitrogen (TN), Total Phosphorus (TP), Dissolved Inorganic Nitrogen (DIN), N:P Molar Ratio (N:P Ratio), Total Dissolved Solids (TDS) and Orthophosphate (PO4). For species abbreviations, see Table 3.
The CCA ordination highlighted the influence of the temporal factor, with the formation of distinct clusters according to hydrological periods. Samples from the dry season of 2019, located on the positive side of axis 1, were associated with Aulacoseira granulata, Radiococcus polycoccus, Trachelomonas volvocinopsis, Chroococcus dispersus, and Staurodesmus cf. cuspidatus (r = 0.5 for all), and were also correlated with DO, TP, DIN, TDS, EC, and PO4. On the negative side of axis 1, two distinct clusters were observed: one corresponding to the dry season of 2020 and the other to the rainy season of 2019 and 2020. In this axis, sampling units were associated with the high biovolume of Cryptomonas brasiliensis (r = –0.5). Regarding axis 2, samples from the dry season of 2020 were positioned on the positive side, correlated with the high biovolume of Urosolenia eriensis (r = 0.5), Cryptomonas tetrapyrenoidosa (r = 0.5), Peridinium sp. (r = 0.7), and Mougeotia sp. (r = 0.5). In contrast, samples from the rainy season of 2019 and 2020, located on the negative side of the axis, were associated with higher temperatures (r = –0.7) and with the high biovolume of Trachelomonas hispida (r = –0.6) and Dolichospermum planctonicum (r = –0.5) (Figure 7).
The Spearman correlation test (Table 4) between the analyzed variables and phytoplankton community structure revealed several significant correlations between biotic and abiotic parameters. The main parameters strongly associated with biovolume were water residence time (ρ = 0.79), precipitation (ρ = -0.75), total phosphorus (ρ = 0.64), TN:TP ratio (ρ = -0.64), and electrical conductivity (ρ = 0.61). Among the biological indices, no strong correlation was found for dominance and richness; however, evenness was strongly correlated with temperature (ρ = -0.67) and TN:TP ratio (ρ = -0.70). The diversity index also showed a strong negative correlation with TN:TP ratio (ρ = -0.70).
Spearman correlation between algal biovolume, biological indices, and environmental variables during the study period in the Biritiba Mirim Reservoir.
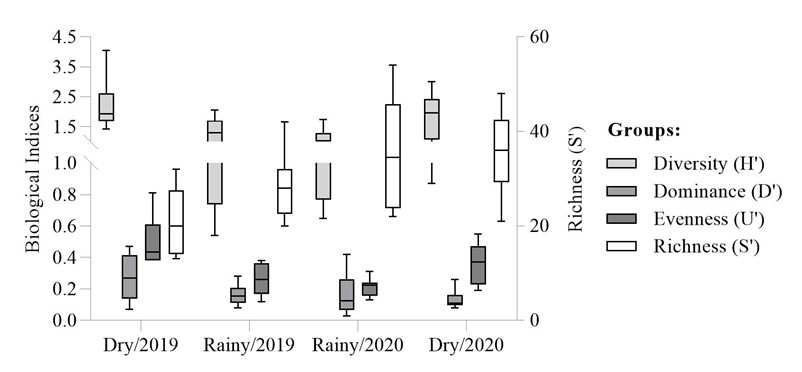
Regarding the temporal variation of biological indices, a statistically significant difference was detected between the indices (p < 0.001). Richness was higher during the rainy seasons (2019 and 2020) than during the dry season of 2019. It is noteworthy that the increase in richness during the dry season of 2020 led to a significant increase in diversity for the same period. As for dominance (only in dry/2019), evenness, and diversity, values were generally higher during the dry season (Figure 8).
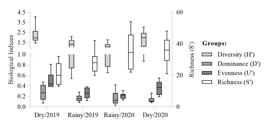
Boxplot of the temporal variation of biological indices, based on biovolume, and species richness (white boxes, secondary y-axis) in the ten sampling units of the Biritiba Mirim Reservoir during two distinct periods
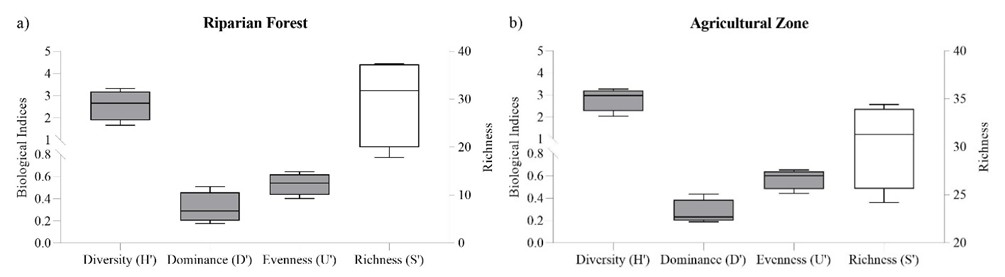
No significant spatial differences were detected (p > 0.05) for the diversity, dominance, evenness, and richness indices or their means (Figure 9).
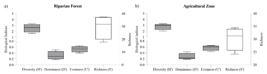
Boxplot of biological indices (gray boxes), based on biovolume, and species richness (white boxes, secondary y-axis) representing data variability across sampling stations for different land use types surrounding the Biritiba Mirim reservoir, SP. a) Sampling stations located in preserved areas (Riparian Forest) and b) Sampling stations located in non-preserved areas (Agricultural Zone).
4. Discussion
4.1. Influence of land use and seasonality
The results of this study demonstrated the seasonal variations, modulated by the physicochemical conditions of the environment, such as temperature and nutrient concentration, were the main drivers of phytoplankton structure, composition, and dynamics, whereas spatial differences related to land use (riparian forest or agricultural) did not significantly affect these characteristics. According to statistical tests, the key predictors associated with phytoplankton growth and composition were total phosphorus, dissolved inorganic nitrogen, temperature, total dissolved solids, electrical conductivity, and dissolved oxygen.
Indeed, many studies have highlighted the positive effect of these variables on algal growth (i.e.Bonansea et al., 2016; Acuña-Alonso et al., 2022; Oliveira et al., 2025), as will be further discussed. However, the influence of other factors, such as precipitation and water residence time (WRT), on the community during the study period cannot be disregarded.
In this study, biovolume was negatively correlated with precipitation, and rainy periods exhibited lower values compared to dry periods. This pattern can be attributed to the negative influence of precipitation on nutrient concentration, which may affect nutrient availability and consequently impact phytoplankton structure. Precipitation events, depending on their frequency and intensity (Liu et al., 2024), can alter abiotic parameters such as nutrients, light, and temperature (Stockwell et al., 2020). These changes can affect nutrient loading in the system before they are utilized by phytoplankton (Ho & Michalak, 2019), limiting their growth and proliferation (Paerl & Huisman, 2008).
Associated with precipitation, the morphometric and hydrodynamic characteristics of the Biritiba Mirim Reservoir, such as water residence time, were strongly related to biovolume fluctuations and changes in community structure, as evidenced by correlation tests. Studies by Rangel et al. (2012) and Magalhães et al. (2020) support that hydrodynamics is a significant factor capable of altering phytoplankton community structure. The highest water residence time in the Biritiba Mirim Reservoir was recorded during the dry period, associated with lower precipitation. These conditions likely favored nutrient accumulation, promoting increased phytoplankton biomass across all sampling sites. Water renewal rates directly affect nutrient cycling and accumulation in the water column (Schindler, 2006), influencing phytoplankton growth, macrophytes, and the trophic state of the reservoir (Straškraba, 1999; Beaver et al., 2015). Other studies have documented the influence of water renewal rates on phytoplankton biovolume (Mac Donagh et al., 2009; Rangel et al., 2012; Beaver et al., 2015; Londe et al., 2016).
Water supply reservoirs, such as the studied system, are subject to fluctuations in water volume, particularly depending on land use, making the management of WRT a critical factor. Given the risks associated with prolonged WRT (e.g., algal blooms), some cities seek to increase flow or select lakes and reservoirs with shorter WRT as sources of drinking water (Huang et al., 2023). In other cases, WRT can be managed to balance the need for water storage during the dry season while maintaining water quality standards (Londe et al., 2016).
The management of hydrological regimes influences both biotic and abiotic limnological characteristics (Wetzel, 1990). In the context of the studied system, the predominant land use, particularly agricultural activities, contributes to diffuse pollution, increasing the input of nutrients (nitrogen and phosphorus) and suspended solids into the reservoir. Although nutrient concentration variations are strong determinants of phytoplankton structure, they also appear to be influenced by hydrodynamics (Tong et al., 2019), demonstrating a strong interaction between disturbances in the watershed and the processes that occur within the reservoir. This interaction becomes even more pronounced when combined with temperature (Cha et al., 2017; Nazeer et al., 2018), which is a key predictor of community structure. Temperature is a fundamental ecological factor that modulates phytoplankton dynamics through both direct effects, such as physiological responses and growth rates, given that many species exhibit higher metabolic activity at elevated temperatures, and indirect effects arising from environmental regulation associated with water column mixing, stratification processes, and nutrient availability (Xiao et al., 2025).
Consequently, the observed changes in this study are attributed to a combined effect: the external pressures from land use (nutrient load) and the internal physical factors (ambient temperature and WRT) that modulate nutrient availability and physical conditions. This combined effect impacts the structure, dynamics, and composition of the phytoplankton community, as corroborated by statistical tests.
4.2. Phytoplankton community composition and biological indices
The combined effect of water residence time and seasonal climatic conditions (such as precipitation and temperature) was also evident regarding species dominance for each studied period. In this study, biological indices were applied to summarize complex information on composition and abundance into comparable metrics across areas and periods. Qualitatively, Chlorophyceae and Cyanobacteria were the classes contributing most to the total number of taxa, as also observed in other mesotrophic reservoirs (Borges et al., 2008; Adloff et al., 2018; Mabrouk et al., 2021). Quantitatively, in terms of biovolume, Cyanobacteria and Euglenophyceae were the most representative classes, consistent with Chellappa et al. (2008).
During the dry period of 2019, characterized by a relatively stable subsurface water column, high water residence time, and low precipitation, conditions favored increased nutrient concentration and Euglenophyceae biovolume, particularly Trachelomonas volvocinopsis. Euglenophyceae are documented in environments with high concentrations of organic matter, nitrogen, and phosphorus (Round, 1973; Alves-da-Silva & Bridi, 2004) and in waters ranging from acidic to slightly alkaline (Alves-da-Silva et al., 2013). In this study, according to the CCA, T. volvocinopsis was associated with high values of total phosphorus (TP), dissolved inorganic nitrogen (DIN), and dissolved oxygen (DO). Reynolds et al. (2002) report that this species occurs in mesotrophic environments, such as the study area. In contrast, Grabowska & Wołowski (2014) highlight the occurrence of the group in shallow and highly eutrophic reservoir, where it is frequently associated with the formation of Planktothrix agardhii blooms. This suggests that relatively high nutrient concentrations do not appear to be limiting to the development of this group, a pattern consistent with the observations in this study and similar occurrences reported elsewhere (Alves-da-Silva et al., 2013; Kufner & Giani, 2017).
The highest biovolume values, recorded during the dry period of 2020, were attributed to Zygnematophyceae (Mougeotia sp.). Zygnematophyceae species are considered environmental indicators of eutrophication (Silva et al., 2018), being widely recorded across diverse trophic contexts, from eutrophic environments (Futatsugi et al., 2025) to oligo-mesotrophic environments (Pacheco et al., 2010; Santana et al., 2018; Oliveira et al., 2020), being particularly favored under conditions of P-limitation (Tapolczai et al., 2015) and variable pH (Graham et al., 1996). In our study, this genus was observed during a period with low nutrient availability, P-limitation, slightly acidic to neutral pH, high water residence time, and low precipitation.
Beyond the increase in biovolume and changes in community composition, biological indices were higher during the dry period, indicating a balanced and stable distribution among taxa, without dominance by any group. Diversity depends on fundamental ecological processes, and alterations in these processes can affect species uniformity (Effendi et al., 2016). Mechanical stress, such as water column mixing, can reduce the influence of dominant species and increase community evenness (Bicudo et al., 1999; Xiao et al., 2025). In this study, the dry period was characterized by partial water column mixing, more pronounced in 2019 than in 2020, paralleling biological indices and species richness. Chellappa et al. (2008) attributed high diversity as an indicator of stability, maintaining multispecific phytoplankton throughout the annual cycle and low cyanobacterial dominance. Our findings corroborate this, as high diversity, especially among intermediate groups, was observed alongside high evenness and low cyanobacterial dominance.
During the rainy periods (2019/2020), cyanobacterial presence raises concern, as the study area is a drinking water reservoir. Many genera can produce toxic blooms, such as Dolichospermum, identified in this study, with records worldwide (Buratti et al., 2017; Kaur et al., 2021). Overall, this period was characterized by dominance of D. planctonicum, C. dispersus, and S. brasiliensis, associated with high precipitation and temperature and lower nutrient availability compared to the dry period. Numerous studies indicate that nutrient conditions, combined with temperature and light availability, stimulate the growth of this group, which is commonly used to explain seasonal dynamics in aquatic ecosystems (Llope et al., 2009; Ward et al., 2011).
Experimental studies have demonstrated that temperature effects favor cyanobacteria over other phytoplankton groups (Mesquita et al., 2019), acting as both direct and indirect predictors of community biomass (Beaulieu et al., 2013). In our study, water temperature ranged from 20 to 23 °C, which, according to statistical analyses, may have favored cyanobacterial dominance, as observed by Islam et al. (2012) and Ma & Yu (2013). Robarts & Zohary (1987) reported that bloom-forming species have optimal growth rates above 25 °C, although dominance is more strongly determined by nutrient-mediated indirect effects. The influence of temperature rather than nutrients may be explained by the trophic state of the system. Cyanobacterial sensitivity to temperature, residence time, and phosphorus varies among different lake types (Richardson et al., 2018). In mesotrophic environments, such as the focus of this study, temperature has a greater influence on cyanobacteria than in oligotrophic or eutrophic temperate lakes (Rigosi et al., 2014).
Cyanobacterial presence during the rainy period was reflected in lower biological index values, indicating reduced diversity and evenness. This result aligns with environmental changes that may have caused disturbance, favoring resistance and opportunistic taxa. Ferrari et al. (2020) demonstrated that filamentous cyanobacteria dominate advanced succession stages, particularly after disturbances such as intense rainfall, characteristic of the rainy period. Moreover, cyanobacteria have been associated with reduced phytoplankton diversity (Bockwoldt et al., 2017). In our study, a reduction of approximately 30% in diversity and richness was observed between rainy and dry periods, likely due to an increase in opportunistic groups, especially cyanobacteria.
This study investigated the interaction between environmental dynamics, nutrient availability, and phytoplankton community structure in a mesotrophic drinking water reservoir. The results indicated that the spatial distribution of phytoplankton was essentially homogeneous, with no significant differences in community structure, biomass, diversity, or richness between the conserved area (riparian forest) and the agricultural area. In contrast, temporal variation was pronounced: biomass was significantly higher during the dry season, whereas diversity declined in the rainy season, a period characterized by an increased contribution of potentially bloom-forming cyanobacteria. Overall, the set of environmental variables, modulated by seasonality, reservoir morphometry, and water residence time, was identified as the main factor shaping phytoplankton community organization. Furthermore, because this is a drinking water reservoir, these findings can support more effective management and monitoring strategies, contributing to water quality protection and the sustainable management of such ecosystems.
Acknowledgements
The authors would like to thank CAPES (Coordenação de Aperfeiçoamento de Pessoal de Ensino Superior) for granting a master’s scholarship to the first author, D.D.P.; and FAPESP (Fundação de Amparo à Pesquisa de São Paulo), grant number 17/21641-5, for funding the project.
Data availability
Research data analyzed in this study is not publicly available by any means.
-
Cite as:
Pontes, D.D. et al. Environmental characterization and phytoplankton community structure in a shallow mesotrophic tropical reservoir in southeastern Brazil. Acta Limnologica Brasiliensia, 2026, vol. 38, e6. https://doi.org/10.1590/S2179-975X5325
References
-
Acuña-Alonso, C., Álvarez, X., Valero, E., & Pacheco, F.A.L., 2022. Modelling of threats that affect Cyano-HABs in an eutrophicated reservoir: first phase towards water security and environmental governance in watersheds. Sci. Total Environ. 809, 152155. PMid:34890658. https://doi.org/10.1016/j.scitotenv.2021.152155
» https://doi.org/10.1016/j.scitotenv.2021.152155 -
Adloff, C.T., Bem, C.C., Reichert, G., & Azevedo, J.C.R.D., 2018. Analysis of the phytoplankton community emphasizing cyanobacteria in four cascade reservoirs system of the Iguazu River, Paraná, Brazil. RBRH 23(0), e6. https://doi.org/10.1590/2318-0331.0318170050
» https://doi.org/10.1590/2318-0331.0318170050 -
Alves-da-Silva, S.M., & Bridi, F.C., 2004. Euglenophyta in the Jacui Delta State Park, Rio Grande do Sul State, Southern Brazil. 3. The genus Strombomonas Deflandre. Acta Bot. Bras. 18(3), 555-572. https://doi.org/10.1590/S0102-33062004000300014
» https://doi.org/10.1590/S0102-33062004000300014 -
Alves-da-Silva, S.M., Cabreira, J.C., Voos, J.G., & Lobo, E.A., 2013. Species richness of the genera Trachelomonas and Strombomonas (pigmented Euglenophyceae) in a subtropical urban lake in the Porto Alegre Botanical Garden, RS, Brazil. Acta Bot. Bras. 27(3), 526-536. https://doi.org/10.1590/S0102-33062013000300010
» https://doi.org/10.1590/S0102-33062013000300010 - American Public Health Association – APHA, 2012. Standard methods for the examination of water and wastewater. Washington: American Public Health Association Pub.
- Angelini, R., Agostinho, A.A., Gomes, L.C., Costa, R.S., & Litini, J.D., 2005. Análise Ecossistêmica de Reservatórios. In: Rodrigues, L., Thomaz, S.M., Agostinho, A.A. & Gomes L.C., eds. Biocenoses em Reservatórios: padrões espaciais e temporais. São Carlos: RiMa, 311- 321.
-
Atazadeh, I., Sharifi, M., & Kelly, M., 2007. Evaluation of the Trophic Diatom Index for assessing water quality in River Gharasou Western Iran. Hydrobiologia 589(1), 165-173. https://doi.org/10.1007/s10750-007-0736-0
» https://doi.org/10.1007/s10750-007-0736-0 -
Barroso, H.D.S., Becker, H., & Melo, V.M.M., 2016. Influence of river discharge on phytoplankton structure and nutrient concentrations in four tropical semiarid estuaries. Braz. J. Oceanogr. 64(1), 37-48. https://doi.org/10.1590/S1679-87592016101406401
» https://doi.org/10.1590/S1679-87592016101406401 -
Beaulieu, M., Pick, F., & Gregory-Eaves, I., 2013. Nutrients and water temperature are significant predictors of cyanobacterial biomass in a 1147 lakes data set. Limnol. Oceanogr. 58(5), 1736-1746. https://doi.org/10.4319/lo.2013.58.5.1736
» https://doi.org/10.4319/lo.2013.58.5.1736 -
Beaver, J.R., Scotese, K.C., Manis, E.E., Juul, S.T.J., Carroll, J., & Renicker, T.R., 2015. Variation in water residence time is the primary determinant of phytoplankton and zooplankton composition in a Pacific Northwest reservoir ecosystem (Lower Snake River, USA). River Syst. 21(4), 241-255. https://doi.org/10.1127/rs/2015/0100
» https://doi.org/10.1127/rs/2015/0100 - Bicudo, C.E.M., Ramirez, J.J., & Tucci, A., 1999. Dinâmica de populações fitoplanctônica em ambiente eutrofizado: Lago das Garças, São Paulo. In: Henry, M., ed. Ecologia de Reservatórios. Botucatu: Fundibio, 449-508.
-
Bilous, O.P., Barinova, S.S., Ivanova, N.O., & Huliaieva, O.A., 2016. The use of phytoplankton as an indicator of internal hydrodynamics of a large seaside reservoir – case of the Sasyk Reservoir, Ukraine. Ecohydrol. Hydrobiol. 16(3), 160-174. https://doi.org/10.1016/j.ecohyd.2016.08.002
» https://doi.org/10.1016/j.ecohyd.2016.08.002 -
Bockwoldt, K.A., Nodine, E.R., Mihuc, T.B., Shambaugh, A.D., & Stockwell, J.D., 2017. Reduced phytoplankton and zooplankton diversity associated with increased cyanobacteria in Lake Champlain, USA. J. Contemp. Water Res. Educ. 160(1), 100-118. https://doi.org/10.1111/j.1936-704X.2017.03243.x
» https://doi.org/10.1111/j.1936-704X.2017.03243.x -
Bonansea, M., Ledesma, C., & Rodriguez, M.C., 2016. Assessing the impact of land use and land cover on water quality in the watershed of a reservoir. Appl. Ecol. Environ. Res. 14(2), 447-456. https://doi.org/10.15666/aeer/1402_447456
» https://doi.org/10.15666/aeer/1402_447456 -
Borges, P.A.F., Train, S., & Rodrigues, L.C., 2008. Spatial and temporal variation of phytoplankton in two subtropical Brazilian reservoirs. Hydrobiologia 607(1), 63-74. https://doi.org/10.1007/s10750-008-9367-3
» https://doi.org/10.1007/s10750-008-9367-3 -
Buratti, F.M., Manganelli, M., Vichi, S., Stefanelli, M., Scardala, S., Testai, E., & Funari, E., 2017. Cyanotoxins: producing organisms, occurrence, toxicity, mechanism of action and human health toxicological risk evaluation. Arch. Toxicol. 91(3), 1049-1130. PMid:28110405. https://doi.org/10.1007/s00204-016-1913-6
» https://doi.org/10.1007/s00204-016-1913-6 -
Calijuri, M.C., Santos, A.C.A.D., & Jati, S., 2002. Temporal changes in the phytoplankton community structure in a tropical and eutrophic reservoir (Barra Bonita, SP - Brazil). J. Plankton Res. 24(7), 617-634. https://doi.org/10.1093/plankt/24.7.617
» https://doi.org/10.1093/plankt/24.7.617 -
Cardoso, L.S., & Marques, D.M., 2009. Hydrodynamics-driven plankton community in a shallow lake. Aquat. Ecol. 43(1), 73-84. https://doi.org/10.1007/s10452-007-9151-x
» https://doi.org/10.1007/s10452-007-9151-x -
Cha, Y., Cho, K.H., Lee, H., Kang, T., & Kim, J.H., 2017. The relative importance of water temperature and residence time in predicting cyanobacteria abundance in regulated rivers. Water Res. 124, 11-19. PMid:28734958. https://doi.org/10.1016/j.watres.2017.07.040
» https://doi.org/10.1016/j.watres.2017.07.040 -
Chandel, P., Mahajan, D., Thakur, K., Kumar, R., Kumar, S., Brar, B., Sharma, D., & Sharma, A.K., 2023. A review on plankton as a bioindicator: a promising tool for monitoring water quality. World Water Policy 10(1), 213-232. https://doi.org/10.1002/wwp2.12137
» https://doi.org/10.1002/wwp2.12137 -
Chellappa, N.T., Borba, J.M., & Rocha, O., 2008. Phytoplankton community and physical-chemical characteristics of water in the public reservoir of Cruzeta, RN, Brazil. Braz. J. Biol. 68(3), 477-494. PMid:18833468. https://doi.org/10.1590/S1519-69842008000300004
» https://doi.org/10.1590/S1519-69842008000300004 -
Chun, S.J., Cui, Y., Ahn, C.Y., & Oh, H.M., 2018. Improving water quality using settleable microalga Ettlia sp. and the bacterial community in freshwater recirculating aquaculture system of Danio rerio. Water Res. 135, 112-121. PMid:29459117. https://doi.org/10.1016/j.watres.2018.02.007
» https://doi.org/10.1016/j.watres.2018.02.007 -
Companhia de Saneamento Básico do Estado de São Paulo – SABESP, 2022. Portal dos Mananciais SABESP. Dados Sistemas produtores [online]. São Paulo: SABESP. Retrieved in 2022, April 26, from https://mananciais.sabesp.com.br/HistoricoSistemas?SistemaId=1
» https://mananciais.sabesp.com.br/HistoricoSistemas?SistemaId=1 -
Departamento de Águas e Energia Elétrica do Governo de São Paulo – DAEE, 2006. Sistema produtor Alto Tietê [online]. São Paulo: DAEE. Retrieved in 2020, May 15, from http://www.daee.sp.gov.br/site/sistema-produtor-alto-tiete/
» http://www.daee.sp.gov.br/site/sistema-produtor-alto-tiete/ -
Effendi, H., Kawaroe, M., Lestari, D.F., Mursalin, & Permadi, T., 2016. Distribution of phytoplankton diversity and abundance in Mahakam Delta, East Kalimantan. Procedia Environ. Sci. 33, 496-504. https://doi.org/10.1016/j.proenv.2016.03.102
» https://doi.org/10.1016/j.proenv.2016.03.102 - ESRI, 2001. Using ArcGIS Geostatistical Analyst. Redlands: ESRI Press.
-
Fermoseli Júnior, J.A., Rosini, E.F., Tucci, A., Araújo Costa, R.C., & Osti, J.S., 2023. Influência do uso e ocupação do solo na qualidade da água do reservatório Biritiba Mirim (Sistema Produtor Alto-Tietê/SP). Rev. Ambient. Água 19(4), e3778. https://doi.org/10.17271/1980082719420233778
» https://doi.org/10.17271/1980082719420233778 -
Ferrari, F., Rosa, F.M.C., & Paim, P.M., 2020. Dinâmica sucessional das classes taxonômicas e grupos funcionais ficoperifíticos em uma represa subtropical. Luminaria 21(1), e2647. https://doi.org/10.33871/23594373.2019.21.01.2647
» https://doi.org/10.33871/23594373.2019.21.01.2647 -
Fonseca, B.M., Ferragut, C., Tucci, A., Crossetti, L.O., Ferrari, F., Bicudo, D.C., Sant’Anna, C.L., & Bicudo, C.E.M., 2014. Biovolume de cianobactérias e algas de reservatórios tropicais do Brasil com diferentes estados tróficos. Hoehnea 41(1), 9-30. https://doi.org/10.1590/S2236-89062014000100002
» https://doi.org/10.1590/S2236-89062014000100002 -
Futatsugi, N., Miyabara, Y., Kagami, M., & Park, H.-D., 2025. Environmental factors affecting the development of the green algae Mougeotia and cyanobacteria Dolichospermum in Lake Suwa. Limnol. 27, 165-176. https://doi.org/10.1007/s10201-025-00802-y
» https://doi.org/10.1007/s10201-025-00802-y - Golterman, H.L., & Clymo, R.S., 1971. Methods for chemical analysis of freshwaters. Oxford: Blackwell Scientific Publications, International Biological Program.
-
Goshtasbi, H., Atazadeh, E., Fathi, M., & Movafeghi, A., 2021. Using physicochemical and biological parameters for the evaluation of water quality and environmental conditions in international wetlands on the southern part of Lake Urmia, Iran. Environ. Sci. Pollut. Res. Int. 29(13), 18805-18819. PMid:34704226. https://doi.org/10.1007/s11356-021-17057-6
» https://doi.org/10.1007/s11356-021-17057-6 -
Grabowska, M., & Wołowski, K., 2014. Development of Trachelomonas species (Euglenophyta) during blooming of Planktothrix agardhii (Cyanoprokaryota). Ann. Limnol. 50(1), 49-57. https://doi.org/10.1051/limn/2013070
» https://doi.org/10.1051/limn/2013070 -
Graham, J.M., Arancibia-Avila, P., & Graham, L.E., 1996. Physiological ecology of a species of the filamentous green alga Mougeotia under acidic conditions: light and temperature effects on photosynthesis and respiration. Limnol. Oceanogr. 41(2), 253-262. https://doi.org/10.4319/lo.1996.41.2.0253
» https://doi.org/10.4319/lo.1996.41.2.0253 - GraphPad Software Inc., 2020. GraphPad Prism version 9.0.0. San Diego: GraphPad Software Inc. Retrieved in 2025, June 30, from www.graphpad.com
-
Hill, M.O., & Gauch Junior, H.G., 1980. Detrended Correspondence Analysis: an improved ordination technique. Vegetatio 42(1-3), 47-58. https://doi.org/10.1007/BF00048870
» https://doi.org/10.1007/BF00048870 -
Hillebrand, H., Dürselen, C.D., Kirschtel, D., Pollingher, U., & Zohary, T., 1999. Biovolume calculation for pelagic and benthic microalgae. J. Phycol. 35(2), 403-424. https://doi.org/10.1046/j.1529-8817.1999.3520403.x
» https://doi.org/10.1046/j.1529-8817.1999.3520403.x -
Ho, J.C., & Michalak, A.M., 2019. Exploring temperature and precipitation impacts on harmful algal blooms across continental U.S. lakes. Limnol. Oceanogr. 65(5), 992-1009. https://doi.org/10.1002/lno.11365
» https://doi.org/10.1002/lno.11365 -
Huang, Y., Fu, M., Chen, G., Zhang, J., Xu, P., Pan, L., Zhang, X., & Chen, X., 2023. Reducing the water residence time is inadequate to limit the algal proliferation in eutrophic lakes. J. Environ. Manage. 330, 117177. PMid:36603259. https://doi.org/10.1016/j.jenvman.2022.117177
» https://doi.org/10.1016/j.jenvman.2022.117177 -
Instituto Brasileiro de Geografia e Estatística – IBGE, 2022. Panorama – São Paulo [online]. Retrieved in 2024, October 14, from https://cidades.ibge.gov.br/brasil/sp/sao-paulo/panorama
» https://cidades.ibge.gov.br/brasil/sp/sao-paulo/panorama -
Ishikawa, M., Gurski, L., Bleninger, T., Rohr, H., Wolf, N., & Lorke, A., 2022. Hydrodynamic drivers of nutrient and phytoplankton dynamics in a subtropical reservoir. Water 14(10), 1544. https://doi.org/10.3390/w14101544
» https://doi.org/10.3390/w14101544 -
Islam, M.N., Kitazawa, D., & Park, H.D., 2012. Numerical modeling on toxin produced by predominant species of cyanobacteria within the ecosystem of Lake Kasumigaura, Japan. Procedia Environ. Sci. 13, 166-193. https://doi.org/10.1016/j.proenv.2012.01.017
» https://doi.org/10.1016/j.proenv.2012.01.017 - Kalff, J. 2002. Limnology: inland water ecosystems. Upper Saddle River: Prentice Hall.
-
Kaur, S., Srivastava, A., Ahluwalia, A.S., & Mishra, Y., 2021. Cyanobacterial blooms and cyanotoxins: occurrence and detection. In Mandotra, S.K., Upadhyay, A.K. & Ahluwalia, A.S., eds. Algae – multifarius applications for a sustainable world. Singapore: Springer, 339–352. https://doi.org/10.1007/978-981-15-7518-1_15
» https://doi.org/10.1007/978-981-15-7518-1_15 -
Kufner, D.C.L., & Giani, A., 2017. Euglenophyta de lagoas da região da Nhecolândia, Pantanal Sul-Matogrossense, Brasil. Hoehnea 44(2), 277-294. https://doi.org/10.1590/2236-8906-21/2017
» https://doi.org/10.1590/2236-8906-21/2017 -
Kutlu, B., Aydin, R., Danabas, D., & Serdar, O., 2020. Temporal and seasonal variations in phytoplankton community structure in Uzuncayir Dam Lake (Tunceli, Turkey). Environ. Monit. Assess. 192(2), 105. PMid:31915937. https://doi.org/10.1007/s10661-019-8046-3
» https://doi.org/10.1007/s10661-019-8046-3 -
Liu, F., Zhang, H., Wang, Y., Yu, J., He, Y., & Wang, D., 2024. Hysteresis analysis reveals how phytoplankton assemblage shifts with the nutrient dynamics during and between precipitation patterns. Water Res. 251, 121099. PMid:38184914. https://doi.org/10.1016/j.watres.2023.121099
» https://doi.org/10.1016/j.watres.2023.121099 -
Llope, M., Chan, K.S., Ciannelli, L.R.P.C., Stige, L.C., & Stenseth, N.C., 2009. Effects of environmental conditions on the seasonal distribution of phytoplankton biomass in the North Sea. Limnol. Oceanogr. 54(2), 512-524. https://doi.org/10.4319/lo.2009.54.2.0512
» https://doi.org/10.4319/lo.2009.54.2.0512 -
Londe, L.R., Novo, E.M.L.M., Barbosa, C., & Araujo, C.A.S., 2016. Water residence time affecting phytoplankton blooms: study case in Ibitinga Reservoir (São Paulo, Brazil) using Landsat/TM images. Braz. J. Biol. 76(3), 664-672. PMid:27143058. https://doi.org/10.1590/1519-6984.23814
» https://doi.org/10.1590/1519-6984.23814 -
Lund, J.W.G., Kipling, C., & Lecren, E.D., 1958. The invert microscope method of estimating algal numbers and the statistical basis of estimations by counting. Hydrobiologia 11(2), 143-170. https://doi.org/10.1007/BF00007865
» https://doi.org/10.1007/BF00007865 -
Lv, H., Yang, J., & Liu, L., 2013. Temporal pattern prevails over spatial variability in phytoplankton communities from a subtropical water supply reservoir. Oceanol. Hydrobiol. Stud. 42(4), 420-430. https://doi.org/10.2478/s13545-013-0098-3
» https://doi.org/10.2478/s13545-013-0098-3 -
Ma, C., & Yu, H., 2013. Phytoplankton community structure in reservoirs of different trophic status. Chin. J. Oceanol. Limnol. 31(3), 471-481. https://doi.org/10.1007/s00343-013-1264-6
» https://doi.org/10.1007/s00343-013-1264-6 -
Mabrouk, L., Hamza, A., & Mansour, H.B., 2021. Factors controlling phytoplankton dynamics in an arid reservoir in Tunisia (case of Sidi Saad dam). Environ. Monit. Assess. 193(6), 354. PMid:34028619. https://doi.org/10.1007/s10661-021-09125-8
» https://doi.org/10.1007/s10661-021-09125-8 -
Mac Donagh, M.E., Casco, M.A., & Claps, M.C., 2009. Plankton relationships under small water level fluctuations in a subtropical reservoir. Aquat. Ecol. 43(2), 371-381. https://doi.org/10.1007/s10452-008-9197-4
» https://doi.org/10.1007/s10452-008-9197-4 - Mackereth, F.J.H., Heron, J., & Talling, J.F., 1978. Water analysis: some revised methods for limnologists. Kendal: Titus Wilson and Son Ltda.
-
Magalhães, L., Rangel, L.M., de Melo Rocha, A., Cardoso, S.J., & Sampaio da Silva, L.H., 2020. Responses of morphology-based phytoplankton functional groups to spatial variation in two tropical reservoirs with long water-residence time. Inland Waters 11(1), 29-43. https://doi.org/10.1080/20442041.2020.1745007
» https://doi.org/10.1080/20442041.2020.1745007 - McCune, B., & Mefford, J.J., 2011. PC-ORD: multivariate analysis of ecological data, version 3.0. Oregon: MjM Software Design.
-
Mesquita, M.C., Prestes, A.C.C., Gomes, A.M.A., & Marinho, M.M., 2019. Direct effects of temperature on growth of different tropical phytoplankton species. Microb. Ecol. 79(1), 1-11. PMid:31111178. https://doi.org/10.1007/s00248-019-01384-w
» https://doi.org/10.1007/s00248-019-01384-w -
Moran, P.A.P., 1950. Notes on continuous stochastic phenomena. Biometrika 37(1-2), 17-23. PMid:15420245. https://doi.org/10.1093/biomet/37.1-2.17
» https://doi.org/10.1093/biomet/37.1-2.17 -
Nazeer, S., Khan, M.U., & Malik, R.N., 2018. Phytoplankton spatio-temporal dynamics and its relation to nutrients and water retention time in multi-trophic system of Soan River, Pakistan. Environ. Technol. Innov. 9, 38-50. https://doi.org/10.1016/j.eti.2017.10.005
» https://doi.org/10.1016/j.eti.2017.10.005 -
Oliveira, A.S., Ferragut, C., & Bicudo, C.E.M., 2020. Relationship between phytoplankton structure and environmental variables in tropical reservoirs with different trophic states. Acta Bot. Bras. 34(1), 83-93. https://doi.org/10.1590/0102-33062019abb0207
» https://doi.org/10.1590/0102-33062019abb0207 -
Oliveira, F.G., Dos Santos, L.D., & Palmeiro, A.S., 2025. Assessment of surface water quality based on physical and chemical parameters in a GIS, for three rivers in southern Brazil. Environ. Pollut. 375, 126295. PMid:40280267. https://doi.org/10.1016/j.envpol.2025.126295
» https://doi.org/10.1016/j.envpol.2025.126295 -
Pacheco, J.P., Iglesias, C., Meerhoff, M., Fosalba, C., Goyenola, G., Teixeira de Mello, F., García, S., Gelós, M., & García-Rodríguez, F., 2010. Phytoplankton community structure in five subtropical shallow lakes with different trophic status (Uruguay): a morphology-based approach. Hydrobiologia 646(1), 187-197. https://doi.org/10.1007/s10750-010-0180-4
» https://doi.org/10.1007/s10750-010-0180-4 -
Paerl, H.W., & Huisman, J., 2008. Blooms like it hot. Science 320(5872), 57-58. PMid:18388279. https://doi.org/10.1126/science.1155398
» https://doi.org/10.1126/science.1155398 -
Passarinho, K.N., Lopes, M.R.M., & Train, S., 2013. Diel responses of phytoplankton of an Amazon floodplain lake at the two main hydrological phases. Acta Limnol. Bras. 25(4), e0002. https://doi.org/10.1590/S2179-975X2013000400002
» https://doi.org/10.1590/S2179-975X2013000400002 -
Pielou, E.C., 1966. Species diversity and pattern diversity in the study of ecological succession. J. Theor. Biol. 10(2), 370-383. PMid:5964400. https://doi.org/10.1016/0022-5193(66)90133-0
» https://doi.org/10.1016/0022-5193(66)90133-0 -
Rakhuba, A.V., 2020. Assessment of the influence exercised by the hydrodynamic regime on the phytoplankton development and the water quality of the Kuibyshev Reservoir. J. Water Resource Prot. 3(3), 430-444. https://doi.org/10.26907/2542-064X.2020.3.430-444
» https://doi.org/10.26907/2542-064X.2020.3.430-444 -
Rangel, L.M., Silva, L.H.S., Rosa, P., Roland, F., & Huszar, V.L.M., 2012. Phytoplankton biomass is mainly controlled by hydrology and phosphorus concentrations in tropical hydroelectric reservoirs. Hydrobiologia 693(1), 13-28. https://doi.org/10.1007/s10750-012-1083-3
» https://doi.org/10.1007/s10750-012-1083-3 - Redfield, A., 1958. The biological control of chemical factors in the environment. Am. Sci. 46(3), 205-221.
- Redfield, A.C., Ketchum, B.H., & Richards, F.A., 1963. The influence of organisms on the composition of sea-water. In: Hill, M.N., ed. The composition of seawater: comparative and descriptive oceanography. The sea: ideas and observations on progress in the study of the seas. New York: Interscience Pub, 2nd ed., 26-77.
-
Reynolds, C.S., Huszar, V., Kruk, C., Naselli-Flores, L., & Melo, S., 2002. Towards a functional classification of the freshwater phytoplankton. J. Plankton Res. 24(5), 417-428. https://doi.org/10.1093/plankt/24.5.417
» https://doi.org/10.1093/plankt/24.5.417 -
Richardson, J., Miller, C., Maberly, S.C., Taylor, P., Globevnik, L., Hunter, P., Jeppesen, E., Mischke, U., Moe, S.J., Pasztaleniec, A., Søndergaard, M., & Carvalho, L., 2018. Effects of multiple stressors on cyanobacteria abundance vary with lake type. Glob. Change Biol. 24(11), 5044-5055. PMid:30005138. https://doi.org/10.1111/gcb.14396
» https://doi.org/10.1111/gcb.14396 -
Rigosi, A., Carey, C.C., Ibelings, B.W., & Brookes, J.D., 2014. The interaction between climate warming and eutrophication to promote cyanobacteria is dependent on trophic state and varies among taxa. Limnol. Oceanogr. 59(1), 99-114. https://doi.org/10.4319/lo.2014.59.1.0099
» https://doi.org/10.4319/lo.2014.59.1.0099 -
Robarts, R.D., & Zohary, T., 1987. Temperature effects on photosynthetic capacity, respiration, and growth rates of bloom‐forming cyanobacteria. N. Z. J. Mar. Freshw. Res. 21(3), 391-399. https://doi.org/10.1080/00288330.1987.9516235
» https://doi.org/10.1080/00288330.1987.9516235 -
Romo, S., Soria, J., Fernández, F., Ouahid, Y., & Barón-Solá, Á., 2012. Water residence time and the dynamics of toxic cyanobacteria. Freshw. Biol. 58(3), 513-522. https://doi.org/10.1111/j.1365-2427.2012.02734.x
» https://doi.org/10.1111/j.1365-2427.2012.02734.x - Round, F.E., 1973. The biology of the algae. Londres: Edward Arnold Publishers, 2nd ed., 278 p.
-
Rueda, F., Moreno-Ostos, E., & Armengol, J., 2006. The residence time of river water in reservoirs. Ecol. Modell. 191(2), 260-274. https://doi.org/10.1016/j.ecolmodel.2005.04.030
» https://doi.org/10.1016/j.ecolmodel.2005.04.030 -
Sánchez, M.L., Schiaffino, M.R., Graziano, M., Huber, P., Lagomarsino, L., Minotti, P., Zagarese, H., & Izaguirre, I., 2021. Effect of land use on the phytoplankton community of Pampean shallow lakes of the Salado River basin (Buenos Aires Province, Argentina). Aquat. Ecol. 55(2), 417-435. https://doi.org/10.1007/s10452-021-09835-8
» https://doi.org/10.1007/s10452-021-09835-8 -
Santana, L.M., Nabout, J.C., & Ferragut, C., 2018. Taxonomic and functional classifications of phytoplankton in tropical reservoirs with different trophic states. Rev. Bras. Bot. 41(1), 91-102. https://doi.org/10.1007/s40415-017-0428-6
» https://doi.org/10.1007/s40415-017-0428-6 -
Sartory, D.P., & Grobbelaar, J.U., 1984. Extraction of chlorophyll a from freshwater phytoplankton for spectrophotometric analysis. Hydrobiologia 114(3), 177-187. https://doi.org/10.1007/BF00031869
» https://doi.org/10.1007/BF00031869 -
Schindler, D.W., 2006. Recent advances in the understanding and management of eutrophication. Limnol. Oceanogr. 51(1–2), 356-363. https://doi.org/10.4319/lo.2006.51.1_part_2.0356
» https://doi.org/10.4319/lo.2006.51.1_part_2.0356 - Shannon, C.E., & Weaver, W.W., 1963. The mathematical theory of communications. Urbana: University of Illinois Press.
-
Silva, F.K.L., Fonseca, B.M., & Felisberto, S.A., 2018. Community structure of periphytic Zygnematophyceae (Streptophyta) in urban eutrophic ponds from central Brazil (Goiânia, GO). Acta Limnol. Bras. 30(0), e5117. https://doi.org/10.1590/s2179-975x5117
» https://doi.org/10.1590/s2179-975x5117 -
Simpson, E.H., 1949. Measurement of diversity. Nature 163(4148), 688. https://doi.org/10.1038/163688a0
» https://doi.org/10.1038/163688a0 -
Smits, A.P., Loken, L.C., Van Nieuwenhuyse, E.E., Young, M.J., Stumpner, P., Lenoch, L.E.K., Burau, J.R., Dahlgren, R.A., Brown, & Sadro, S., 2023. Hydrodynamics structure plankton communities and interactions in a freshwater tidal estuary. Ecol. Monogr. 93(2), e1567. https://doi.org/10.1002/ecm.1567
» https://doi.org/10.1002/ecm.1567 - Solorzano, L., 1969. Determination of ammonia in natural waters by the phenol-hypochlorite method. Limnol. Oceanogr. 14, 799-801.
-
Stockwell, J.D., Doubek, J.P., Adrian, R., Anneville, O., Carey, C.C., Carvalho, L., De Senerpont Domis, L.N., Dur, G., Frassl, M.A., Grossart, H.-P., Ibelings, B.W., Lajeunesse, M.J., Lewandowska, A.M., Llames, M.E., Matsuzaki, S.-I.S., Nodine, E.R., Noges, P., Patil, V.P., Pomati, F., Rinke, K., Rudstam, L.G., Rusak, J.A., Salmaso, N., Seltmann, C.T., Straile, D., Thackeray, S.J., Thiery, W., Urrutia-Cordero, P., Venail, P., Verburg, P., Woolway, R.I., Zohary, T., Andersen, M.R., Bhattacharya, R., Hejzlar, J., Janatian, N., Kpodonu, A.T.N.K., Williamson, T.J., & Wilson, H.L., 2020. Storm impacts on phytoplankton community dynamics in lakes. Glob. Change Biol. 26(5), 2756-2784. PMid:32133744. https://doi.org/10.1111/gcb.15033
» https://doi.org/10.1111/gcb.15033 - Straškraba, M. 1999. Retention time as a key variable of reservoir limnology. In Tundisi, J.G., & Straškraba, M., eds. Theoretical reservoir ecology and its applications. São Carlos: International Institute of Ecology, Brazilian Academy of Sciences, Backhuys Publishers, 385–410.
- Strickland, J.D.H., & Parsons, T.R., 1960. A manual of seawater analysis. Bull. Fish. Res. Board Can. 125, 1-185.
-
Sun, J., & Liu, D., 2003. Geometric models for calculating cell biovolume and surface area for phytoplankton. J. Plankton Res. 25(11), 1331-1346. https://doi.org/10.1093/plankt/fbg096
» https://doi.org/10.1093/plankt/fbg096 - Taniwaki, R.H., Rosa, A.H., Lima, R., Maruyama, C.R., Secchin, L.F., Calijuri, M.C., & Moschini-Carlos, V., 2013. A influência do uso e ocupação do solo na qualidade e genotoxicidade da água no reservatório de Itupararanga, São Paulo, Brasil. Interciencia 38(3), 164-170.
-
Tapolczai, K., Anneville, O., Padisák, J., Salmaso, N., Morabito, G., Zohary, T., Tadonléké, R.D., & Rimet, F., 2015. Occurrence and mass development of Mougeotia spp. (Zygnemataceae) in large, deep lakes. Hydrobiologia 745(1), 17-29. https://doi.org/10.1007/s10750-014-2086-z
» https://doi.org/10.1007/s10750-014-2086-z -
Tong, Y., Li, J., Qi, M., Zhang, X., Wang, M., Liu, X., Zhang, W., Wang, X., Lu, Y., & Lin, Y., 2019. Impacts of water residence time on nitrogen budget of lakes and reservoirs. Sci. Total Environ. 646, 75-83. PMid:30055503. https://doi.org/10.1016/j.scitotenv.2018.07.255
» https://doi.org/10.1016/j.scitotenv.2018.07.255 - Tundisi, J.G. 2006. Gerenciamento integrado de bacias hidrográficas e reservatórios – estudo de caso e perspectivas. In Nogueira, M.G., Henry, R., & Jorcin, A., eds. Ecologia de reservatórios, 2nd ed. São Carlos: RiMa, 1–22.
-
Tundisi, J.G., & Matsumura-Tundisi, T., 2003. Integration of research and management in optimizing multiple uses of reservoirs: the experience in South America and Brazilian case studies. Hydrobiologia 500(1-3), 231-242. https://doi.org/10.1023/A:1024617102056
» https://doi.org/10.1023/A:1024617102056 -
Tundisi, J.G., 2018. Reservoirs: new challenges for ecosystem studies and environmental management. Water Secur. 4–5, 1-7. https://doi.org/10.1016/j.wasec.2018.09.001
» https://doi.org/10.1016/j.wasec.2018.09.001 - Vadrucci, M.R., Cabrini, M., & Basset, A., 2007. Biovolume determination of phytoplankton guilds in transitional water ecosystems of Mediterranean ecoregion. Transit. Waters Bull. 2, 83-102.
-
Valderrama, G.C., 1981. The simultaneous analysis of total nitrogen and total phosphorus in natural waters. Mar. Chem. 10(2), 109-112. https://doi.org/10.1016/0304-4203(81)90027-X
» https://doi.org/10.1016/0304-4203(81)90027-X -
Vidal, M., Duarte, C.M., Agusti, S., Gasol, J.M., & Vaque, D., 2003. Alkaline phosphatase activities in the central Atlantic Ocean indicate large areas with phosphorus deficiency. Mar. Ecol. Prog. Ser. 262, 43-53. https://doi.org/10.3354/meps262043
» https://doi.org/10.3354/meps262043 -
Ward, B.B., Rees, A.P., Somerfield, E.P.J., & Joint, I., 2011. Linking phytoplankton community composition to seasonal changes in f-ratio. ISME J. 5(11), 1759-1770. PMid:21544101. https://doi.org/10.1038/ismej.2011.50
» https://doi.org/10.1038/ismej.2011.50 - Wetzel, R.G. 1990. Reservoir ecosystems: conclusions and speculations. In Thornton, K.W., Kimmel, B.L. & Payne, F.E., eds. Reservoir limnology: ecological perspectives. New York: John Wiley & Sons, p. 227–238.
-
Wetzel, R.G., & Likens, G.E., 2000. Limnological analysis. Berlin: Springer. https://doi.org/10.1007/978-1-4757-3250-4
» https://doi.org/10.1007/978-1-4757-3250-4 -
Wu, N., Dong, X., Liu, Y., Wang, C., Baattrup-Pedersen, A., & Riis, T., 2017. Using river microalgae as indicators for freshwater biomonitoring: review of published research and future directions. Ecol. Indic. 81, 124-131. https://doi.org/10.1016/j.ecolind.2017.05.066
» https://doi.org/10.1016/j.ecolind.2017.05.066 -
Xiao, L.J., Jiang, Y., Yang, S., Korneva, L., Mineeva, N., Lin, Q., Jin, H., & Zhang, X., 2025. Indirect effects of temperature driven seasonal succession of phytoplankton communities in a tropical reservoir. Ecol. Indic. 179, 114270. https://doi.org/10.1016/j.ecolind.2025.114270
» https://doi.org/10.1016/j.ecolind.2025.114270 -
Xu, Z., Cai, X., Yin, X., Su, M., Wu, Y., & Yang, Z., 2019. Is water shortage risk decreased at the expense of deteriorating water quality in a large water supply reservoir? Water Res. 165, 114984. PMid:31465997. https://doi.org/10.1016/j.watres.2019.114984
» https://doi.org/10.1016/j.watres.2019.114984 -
Yang, Y., Niu, H., Xiao, L., Lin, Q., Han, B.-P., & Naselli-Flores, L., 2018. Spatial heterogeneity of spring phytoplankton in a large tropical reservoir: could mass effect homogenize the heterogeneity by species sorting? Hydrobiologia 819(1), 109-122. https://doi.org/10.1007/s10750-018-3651-7
» https://doi.org/10.1007/s10750-018-3651-7 -
Zhang, Y., Peng, C., Huang, S., Wang, J., Xiong, X., & Li, D., 2018. The relative role of spatial and environmental processes on seasonal variations of phytoplankton beta diversity along different anthropogenic disturbances of subtropical rivers in China. Environ. Sci. Pollut. Res. Int. 26(2), 1422-1434. PMid:30426374. https://doi.org/10.1007/s11356-018-3632-4
» https://doi.org/10.1007/s11356-018-3632-4 -
Zhang, Z., Gao, J., & Cai, Y., 2020. The direct and indirect effects of land use and water quality on phytoplankton communities in a basin dominated by agriculture. Environ. Monit. Assess. 192(12), 760. PMid:33184779. https://doi.org/10.1007/s10661-020-08728-x
» https://doi.org/10.1007/s10661-020-08728-x -
Zhao, F., Zhan, X., Xu, H., Zhu, G., Zou, W., Zhu, M., Kang, L., Guo, Y., Zhao, X., Wang, Z., & Tang, W., 2022. New insights into eutrophication management: importance of temperature and water residence time. J. Environ. Sci. (China) 111, 229-239. PMid:34949352. https://doi.org/10.1016/j.jes.2021.02.033
» https://doi.org/10.1016/j.jes.2021.02.033
Edited by
-
Associate Editor:
Bárbara Dunck Oliveira.