 Food web structure and robustness of fish assemblages in the Uberabinha River, Upper Paraná Basin
Abstract:
Aim We modeled and analyzed the topological structure of the fish food web of the Uberabinha River (Upper Paraná Basin) to characterize its connectance, trophic levels, modularity, and robustness.
Methods The network was constructed from a meta-web of 36 fish species and seven basal resource categories, based on diet data from FishBase and peer-reviewed literature. Analyses were performed on a directed binary network using standard ecological network metrics and simulations of random and targeted species extinction.
Results The food web showed low connectance (C=0.114), compressed trophic levels (range: 2.0–2.88), and weak modularity (Q=0.113), indicating limited functional compartmentalization. Robustness simulations revealed high tolerance to random species loss (R50=12) but sharp vulnerability to targeted removal of highly connected species (R50=6).
Conclusions Network stability appears to be sustained primarily by generalist redundancy while remaining critically dependent on a small set of hub species and top predators, reflecting the functional simplification typical of impacted Neotropical river ecosystems. Conservation strategies should prioritize the maintenance of key trophic interactions over species richness alone.
Keywords:
food webs; ecological networks; robustness; modularity; ichthyofauna; Upper Paraná Basin
Resumo:
Objetivo Modelamos e analisamos a estrutura topológica da teia trófica da ictiofauna do Rio Uberabinha (Bacia do Alto Paraná), caracterizando seus padrões de conectividade, níveis tróficos, modularidade e robustez.
Métodos A rede foi construída a partir de uma meta-web com 36 espécies de peixes e sete categorias de recursos basais, com base em dados de dieta obtidos do FishBase e da literatura especializada. As análises foram conduzidas em uma rede binária direcionada, utilizando métricas clássicas de redes ecológicas e simulações de extinção aleatória e direcionada.
Resultados A teia trófica apresentou baixa conectividade (C=0,114), níveis tróficos comprimidos (intervalo: 2,0–2,88) e modularidade fraca (Q=0,113), indicando compartimentação funcional limitada. As simulações de robustez revelaram alta tolerância à perda aleatória de espécies (R50=12), mas vulnerabilidade acentuada à remoção direcionada de espécies altamente conectadas (R50=6).
Conclusões A estabilidade da rede parece ser sustentada principalmente pela redundância de espécies generalistas, permanecendo criticamente dependente de um pequeno conjunto de nós-hub e predadores de topo, refletindo a simplificação funcional típica de ecossistemas fluviais neotropicais impactados. Estratégias de conservação devem priorizar a manutenção das interações tróficas-chave em detrimento exclusivo da riqueza de espécies.
Palavras-chave:
teias tróficas; redes ecológicas; robustez; modularidade; ictiofauna; Bacia do Alto Paraná
1. Introduction
Food webs represent the fundamental architecture of biodiversity, describing the complex feeding interactions that govern energy flow and the stability of aquatic ecosystems (Dunne et al., 2002a; Montoya et al., 2006). The structure of these networks is not random; rather, it follows universal organizational patterns, such as link distribution and module formation, which determine the community's capacity to withstand external disturbances (Krause et al., 2003; Newman, 2006). Understanding the topology of these interactions is essential for predicting how species loss can trigger secondary extinction cascades, compromising the functional integrity of freshwater environments (Pace et al., 1999; Memmott et al., 2004).
Neotropical river ecosystems face a biodiversity crisis driven by habitat fragmentation, dam construction, and the introduction of non-native species (Agostinho et al., 2008; Pelicice & Agostinho, 2009; Azevedo-Santos et al., 2011). These anthropogenic pressures tend to simplify food webs, reducing connectivity and homogenizing ecological functions, making rivers more vulnerable to functional collapse (Olden et al., 2004; Tylianakis et al., 2008; Winemiller et al., 2016). In the Upper Paraná River basin, one of the most impacted in South America, changes in hydrological regimes have altered fish assemblage composition, favoring generalist species at the expense of specialists (Hoeinghaus et al., 2008; Cassatti et al., 2009; Arantes et al., 2019).
The Uberabinha River, a major left-bank tributary of the Paranaíba River in the Triângulo Mineiro region, reflects this scenario of intense anthropogenic pressure. The basin is affected by urbanization, damming for energy generation (SHPs), and agricultural activities that degrade water quality and physical habitat structure (Sampaio et al., 2012). Although recent studies have described the taxonomic composition of the local ichthyofauna (Sampaio et al., 2012) and biological aspects of specific populations, such as Rhamdia quelen (Guilherme, 2005), little is known about how these species interact within a network context.
The lack of information on the functional structure and food web topology of the Uberabinha River represents a significant gap for conservation efforts. Traditional species inventories, while necessary, capture neither the complexity of predator-prey interactions nor community resilience to future extinctions (Layer et al., 2010). In a system where exotic species invasion and habitat loss are ongoing threats, understanding the functional architecture of feeding interactions is essential for identifying which ecological functions are most at risk.
Therefore, this study aims to model and analyze the topological structure of the fish food web of the Uberabinha River. Specifically, we seek to: (i) describe the structural properties of the network, such as connectance and trophic levels; (ii) identify the degree of compartmentalization (modularity) in the community; and (iii) simulate network robustness against random and targeted species loss.
2. Methodology
2.1. Study area and data acquisition
The study focused on the ichthyofauna of the Uberabinha River, located in the municipality of Uberlândia, Triângulo Mineiro region, state of Minas Gerais, Brazil. The river is a direct tributary of the Paranaíba River and flows through areas of intense urban and agricultural activity, being subject to damming by Small Hydroelectric Plants (SHPs). The species list used to construct the network was obtained from the inventory conducted by Sampaio et al. (2012), who recorded 36 fish species distributed across various orders and families, ranging from small characids to large migratory siluriforms.
2.2. Construction of the Adjacency Matrix (Meta-web)
To model the food web, we constructed a binary adjacency matrix (S×S), where S represents the total number of nodes (fish species plus basal resources). The decision to model the network as binary (unweighted) rather than quantitative (weighted) was deliberate and theoretically grounded. Weighted food web analyses require reliable estimates of interaction frequency or energy flux for each species pair, data not currently available for the Uberabinha River at the community level. Binary networks, while unable to capture interaction strength heterogeneity, provide a robust first-order characterization of network topology and represent the standard approach in comparative food web analyses (Dunne et al., 2002a, b; Memmott et al., 2004). Their use is particularly appropriate when research questions concern structural properties such as connectance, modularity, and topological robustness, as in the present study.
Trophic interactions ("who eats whom") were inferred using a two-tiered literature protocol. As a primary source, we consulted the FishBase database (Froese & Pauly, 2024), which provides standardized diet records derived from published stomach-content analyses. As a secondary source, we performed systematic searches in peer-reviewed literature focused on the diet of Neotropical fishes from the Upper Paraná basin and ecologically comparable systems (Peretti & Andrian, 2004). For species with no local diet records, taxonomic and functional analogy was applied: congeners or confamilials from similar river systems were used as dietary surrogates, a procedure documented in meta-web construction approaches (Dunne et al., 2002a). When conflicting records were found across sources, the broadest documented prey range was adopted to avoid underestimating potential interactions, producing a conservative and inclusive network topology. A link (aij=1) was defined when species j (prey) was recorded as a food item for species i (predator) in at least one validated source; otherwise, the interaction was considered absent (aij=0). In addition to the 36 fish species, seven basal resource nodes were included to represent the main energy entry points documented for Neotropical river systems (Vannote et al., 1980; Lowe-McConnell, 1987): Detritus, Allochthonous Plant Material, Terrestrial Insects, Aquatic Insects, Zooplankton, Phytoplankton, and Macrophytes. Each consumer species was linked to a basal node when that resource category was recorded as a dietary item in the source literature. Basal nodes were assigned a fixed trophic level of 1.0 and were excluded from removal in robustness simulations, in accordance with standard procedures for food web stability analyses (Dunne et al., 2002a; Memmott et al., 2004).
2.3. Analysis of topological properties
The structural metrics were used to characterize the organization, complexity, and interaction patterns of the food web, allowing for inferences about its internal structure and ecological functioning.
2.3.1. Network connectance
Connectance (C) was used as a measure of interaction density, reflecting the degree of structural complexity of the food web. This metric was calculated as the ratio between the number of observed interactions (L) and the total number of theoretically possible interactions (S2) (Dunne et al., 2002b). Connectance provides a summary estimate of the interdependence among species and has been associated with system complexity (May, 1972; Dunne et al., 2002b). Networks with higher connectance tend to show greater interaction redundancy and more alternative pathways for energy flow, which may influence their stability and response to disturbances (McCann, 2000; Dunne et al., 2002a). Conversely, lower connectance values indicate sparser systems, where the loss of key interactions may increase structural and functional vulnerability (Allesina & Pascual, 2009).
2.3.2. Fractional trophic level
The fractional trophic level of each species was estimated based on the mean shortest path length between each consumer and the network's basal resources. Primary producers and detritus were assigned a value of 1.0, and consumer levels were calculated as 1 plus the mean path length in the directed matrix (Williams & Martinez, 2004). Unlike traditional trophic classifications, this metric allows a continuous representation of trophic position, capturing the complexity of systems characterized by omnivory and multiple indirect energy flows (Polis & Strong, 1996; Williams & Martinez, 2004). Fractional trophic level estimation enables the vertical ordering of the assemblage and provides information on the network's trophic architecture, including the effective length of food chains and species distribution along the trophic gradient (Layman et al., 2007; Post, 2002; Thompson et al., 2007). This approach has been used in food web analyses to support more realistic inferences about the functional organization of ecological systems and its implications for community dynamics and stability (Rooney et al., 2006).
2.3.3. Network modularity
The modular structure of the network was evaluated through modularity analysis (Q) to identify compartments composed of species that interact more intensely with each other than with the rest of the network. The Walktrap algorithm (Pons & Latapy, 2005) was applied to the directed network. Interaction directionality was maintained to preserve the logic of energy flow among trophic levels in the definition of modules. Although algorithms such as Infomap are widely used, Walktrap proved suitable for capturing trophic grouping patterns consistent with the expected functional organization of the ichthyofauna while preserving interaction directionality.
Modularity is a key structural property of ecological networks, associated with functional compartmentalization and the containment of disturbance propagation within the system (Krause et al., 2003; Newman, 2006). More modular networks tend to show greater resilience to cascading extinctions, as the effects of local disturbances may remain confined to specific modules (Thébault & Fontaine, 2010; Stouffer & Bascompte, 2011). Identifying modules therefore allows inferences about internal organization patterns, functional trophic groups, and structural mechanisms that contribute to network stability and persistence over time (Stouffer & Bascompte, 2011).
2.4. Robustness and attack tolerance analysis
Food web stability was assessed through two extinction simulation scenarios. In both cases, basal resource nodes were kept fixed, restricting removals to fish species only. In the first scenario (Random Removal), stochastic biodiversity loss was simulated through the sequential removal of randomly chosen consumer nodes. This procedure was repeated in 100 independent iterations to ensure statistical stability, and the mean connectivity decay curve was calculated. In the second scenario (Targeted Removal), the species with the highest total degree (ktot), defined as the sum of in-degree and out-degree, was removed at each step. For both scenarios, network integrity was monitored by recalculating the proportion of remaining trophic connections after each removal event. The quantitative criterion used was the R50 index (Robustness 50%), defined as the number of removed species required to cause a loss of 50% of the network's total interactions (Dunne et al., 2002a; Memmott et al., 2004).
2.5. Computing tools
All analyses were performed in R version 4.3.x (R Core Team, 2024). Network construction, topological metrics, and robustness simulations were implemented using the igraph package (Csardi & Nepusz, 2006). Specifically: connectance was calculated as the ratio L/S2 applied directly to the adjacency matrix; fractional trophic levels were estimated using the shortest_paths function on the directed graph, with basal nodes assigned a fixed value of 1.0; modular structure was identified using the Walktrap community detection algorithm (Pons & Latapy, 2005), based on short random walks within the directed network; and robustness simulations were executed as sequential node-removal procedures, with the random removal scenario repeated across 100 independent iterations using a fixed random seed (set.seed(42)) to ensure computational reproducibility. Network visualization was produced using the Fruchterman-Reingold layout algorithm, also implemented in igraph. To support full reproducibility, the complete binary adjacency matrix (43×43) is available as Table S2, alongside Table S1 (species list with trophic levels and feeding guilds), deposited in the SciELO Data Dataverse (2026) repository.
3. Results
3.1. Network structure and connectance
The reconstruction of the Uberabinha River ichthyofauna food web resulted in a directed binary adjacency matrix composed of 43 nodes, comprising 36 consumer fish species and 7 basal resource categories. A total of 211 direct trophic interactions (L) were recorded among the biotic components of the network (Table 1). The distribution of these links was not uniform, revealing a clear asymmetry between the in-degree and out-degree of nodes. Basal resources presented only out-degrees, functioning as energy donors, while fish nodes presented variable in-degrees correlated with the breadth of their dietary spectra in the modeled matrix.
Global topological properties of the fish food web of the Uberabinha River, Upper Paraná Basin, Brazil.
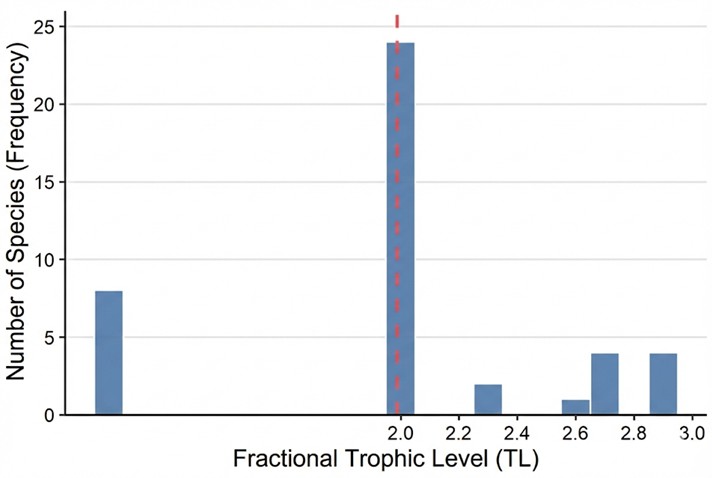
The connectance index (C) was 0.1141, indicating that approximately 11.4% of the 1,849 theoretically possible interactions in the matrix (S2, where S=43) were effectively realized. The network showed a structure in which most nodes maintain few connections, while a small subset of generalist nodes concentrates a large proportion of interactions (Figure 1). This configuration produced a link density sufficient to maintain global network cohesion and prevent fragmentation into disconnected subnetworks.

Frequency distribution of Trophic Levels (TL) of the 36 fish species of the Uberabinha River. Blue bars represent the number of species in each trophic level interval. The red dashed line indicates the community's mean trophic level. Note the concentration of species at the base of the chain (TL = 2.0), a characteristic of networks with high omnivory and basal redundancy.
3.2. Fractional trophic levels
The vertical ordering of the community revealed a continuous trophic gradient ranging from a minimum of 2.00 to a maximum of 2.88. The frequency distribution of trophic levels showed a strong concentration of species at the base of the food chain (Figure 1). Detailed values for each species are available in Table S1 (SciELO Data Dataverse, 2026).
A total of 13 species (36.1% of the fish richness) were assigned the basal value of 2.00 (Table S1; SciELO Data Dataverse, 2026). This lower stratum was composed mostly of species with diets restricted to primary resources, including representatives of the genera Hypostomus, Steindachnerina, Prochilodus, and Hisonotus, whose path lengths in the network indicated direct consumption of basal nodes. Moving up the trophic hierarchy, a gradual spread of fractional values was observed, with the intermediate stratum (levels 2.10 to 2.50) containing the largest share of remaining diversity, including genera such as Astyanax and Rhamdia. At the top of the food web, species frequency decreased sharply. Only four species reached trophic level values above 2.80. Pinirampus pirinampu and Pseudoplatystoma corruscans shared the highest calculated position of 2.88, followed closely by Serrasalmus marginatus and Hoplias intermedius (both with 2.86), representing the nodes with the greatest mean energy flow distance from the base.
3.3. Modularity and compartmentalization
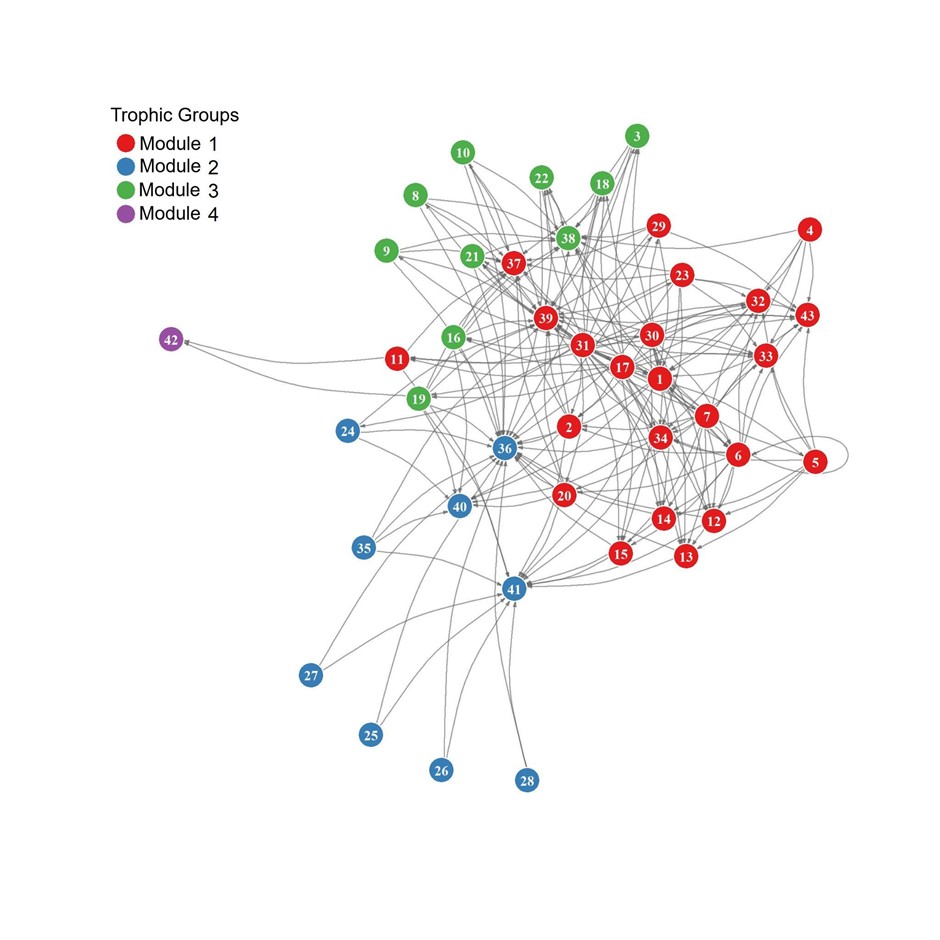
The Walktrap algorithm detected substructures in the network, yielding a modularity index (Q) of 0.1126 (Table 1). The analysis partitioned the food web into four discrete modules, defined by a higher density of internal connections than connections between groups. The network visualization (Figure 2), generated using the Fruchterman-Reingold algorithm, confirmed this partitioning by spatially grouping nodes with similar trophic interaction patterns. Module composition was not homogeneous in size, suggesting an internal organization in which specific basal resources preferentially support specific consumer guilds.

Representation of the modular structure of the ichthyofauna food web of the Uberabinha River. Nodes represent fish species and basal resources, and edges indicate energy flow (predator-prey interactions). Colors differentiate the four functional modules identified by the Walktrap algorithm (Q=0.1126), revealing groups of species that interact more intensely with each other than with the rest of the network.
The Q value close to 0.1, however, indicates weak-to-moderate compartmentalization. Although the four groups are detectable, module boundaries are permeable. A considerable number of inter-modular links connect nodes from different compartments, preventing complete topological isolation of the groups. Species with generalist and omnivorous diets acted as connector nodes, bridging modules and maintaining network cohesion as a single integrated structure rather than a set of independent subnetworks.
3.4. Robustness and structural vulnerability
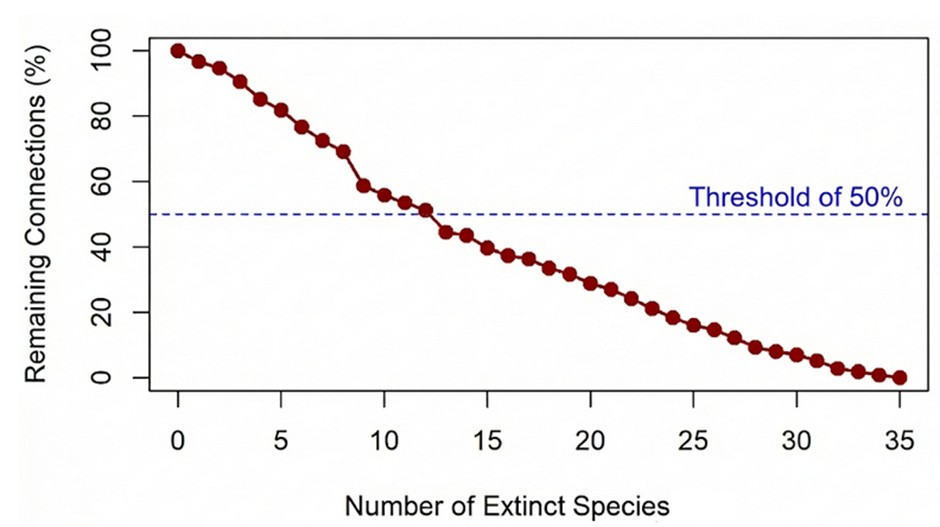
The robustness analysis revealed contrasting responses to species loss under the two scenarios (Figure 3). Under the Random Removal scenario, the network showed high resilience, maintaining functional integrity even after moderate biodiversity loss. The R50 threshold was 12 species, meaning that approximately 33% of the fish community would need to be removed for the network to lose half of its trophic connections. The smooth decay curve suggested high functional redundancy.
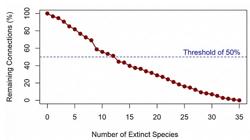
Robustness curve of the Uberabinha River food web under the random extinction scenario (Error Tolerance). The continuous line represents the decay of network connectivity as fish species are sequentially removed at random. The blue dashed line demarcates the critical threshold of 50% remaining connections (R50), which is reached after the accumulated removal of 12 species.
During the initial removal steps (0 to 5 species), the rate of connection loss remained low, indicating that link redundancy buffered the impact of individual node loss. The decay curve steepened only after removal of more than one-third of the nodes, suggesting that the main energy flow pathways are preserved under moderate reductions in species richness.
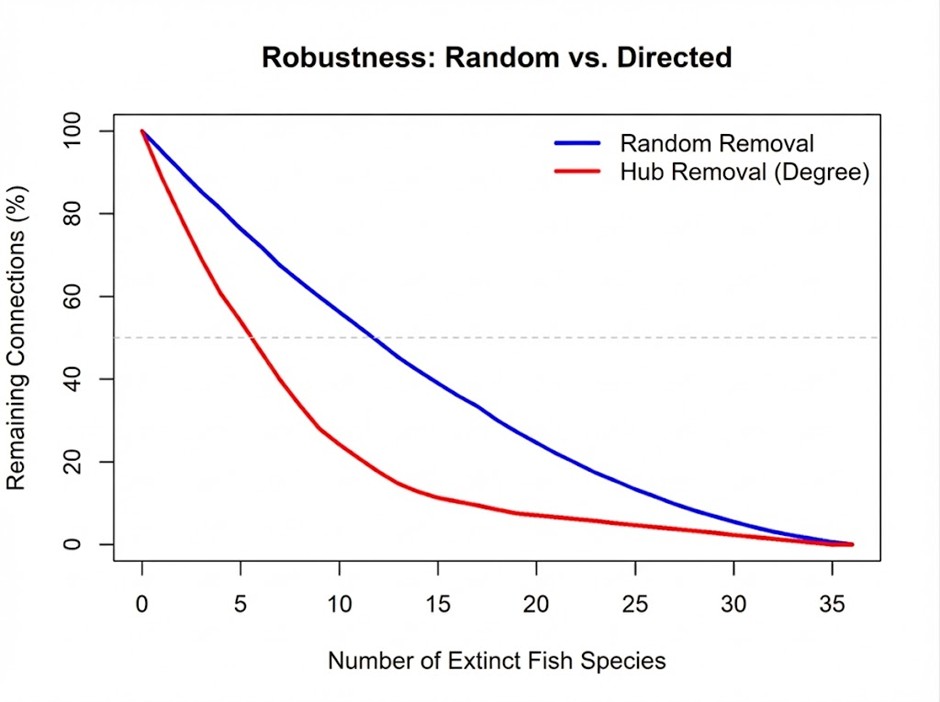
In contrast, the Targeted Removal scenario revealed a clear structural fragility. The sequential removal of the most connected species caused rapid network collapse, with the R50 index reduced to only 6 species. The loss of hub nodes led to the rapid disintegration of the food web (Figure 4), showing that system stability depends heavily on a small set of highly connected generalist species.
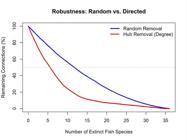
Robustness curves of the Uberabinha River food web under two extinction scenarios. The blue line represents the mean of 100 random removal simulations (Error Tolerance), while the red line represents the targeted removal of highest-degree nodes (Attack Tolerance). The dashed line indicates the threshold of 50% remaining connections.
4. Discussion
The topological modeling of the Uberabinha River fish food web described a network with low connectance, compressed trophic levels, and weak modularity, sustained primarily by generalist species with broad dietary breadths. The robustness simulations further revealed contrasting responses to random and targeted species loss, indicating structural dependence on a small number of highly connected nodes. These patterns are consistent with those documented for other Neotropical fish assemblages analyzed under similar meta-web approaches (Agostinho et al., 2008; Winemiller et al., 2016), and their interpretation here is restricted to the topological properties of the binary network as constructed.
4.1. Structural complexity and connectance
The connectance value obtained (C = 0.1141) falls within the 0.08–0.15 range described for stable aquatic food webs in comparative topological studies (Dunne et al., 2002b). In network theory, lower connectance is associated with sparser interaction architectures in which most species maintain few links and a small number of generalist nodes concentrates the majority of interactions (May, 1972; Dunne et al., 2002a). The degree distribution observed here conforms to this expectation: of the 1,849 theoretically possible interactions in the 43-node matrix, only 11.4% were realized, and the distribution was strongly asymmetric. This configuration is consistent with the architectural pattern reported for Neotropical rivers, where link density tends to decrease as network size increases (Winemiller, 1990).
It should be noted, however, that the connectance value obtained here is subject to the inherent limitations of the meta-web approach. Because dietary interactions were compiled from published records rather than from direct field observations in the Uberabinha River, the realized interaction set may differ from the potential interaction set represented in the adjacency matrix. The meta-web method tends to overestimate the number of active links at any given time (Dunne et al., 2002a), which means that the true connectance of the local food web may be lower than the value reported. Interpretations of connectance magnitude should therefore be understood as characterizing the structural potential of the assembled network rather than its instantaneous empirical state.
Within the network, species of the genera Astyanax and Rhamdia occupied intermediate positions in the degree distribution and contributed substantially to inter-module connectivity, consistent with their documented broad dietary breadths in Upper Paraná tributaries (Hahn et al., 2004; Loureiro-Crippa & Hahn, 2006). Their structural position as connector nodes is an interpretable feature of the binary topology; the ecological mechanisms underlying this pattern, however, cannot be determined from the present data alone.
4.2. Vertical structure and trophic levels
The fractional trophic level distribution revealed a compressed food chain, spanning a narrow range from 2.0 to 2.88. A total of 13 species (36.1%) were assigned the minimum consumer value of 2.0, indicating direct links to basal resource nodes in the adjacency matrix, while the intermediate stratum (TL 2.10–2.50) contained the largest share of species richness. Top positions (TL > 2.80) were occupied by only four species: Pinirampus pirinampu and Pseudoplatystoma corruscans (TL = 2.88), followed by Serrasalmus marginatus and Hoplias intermedius (TL = 2.86).
The compression of trophic levels observed here, with top positions well below values above 3.5 reported for apex predators in food webs with longer chains (Jepsen & Winemiller, 2002; Vander Zanden & Fetzer, 2007), is a direct consequence of the high frequency of omnivory in the assembled network. Species assigned TL = 2.0 consume basal resources directly, while the prevalence of omnivory throughout the intermediate stratum shortens mean path lengths from consumers to basal nodes, producing fractional values clustered near the base of the trophic gradient. This compression has been documented in empirical and model food webs where omnivory is widespread (Post et al., 2000; Thompson et al., 2007) and is a recognized topological property of networks with multiple direct basal links rather than an indicator of ecosystem condition per se.
The four species occupying the highest trophic positions represent nodes with the greatest mean distance from basal resources in the directed network. Their structural position as top nodes is directly linked to the vulnerability pattern identified in the robustness simulations: because highly connected species and top predators overlap in this network, their targeted removal disproportionately accelerates connectivity loss (R50 = 6 under targeted removal vs. R50 = 12 under random removal). This differential response is a structural property of the topology and does not require additional ecological inference.
4.3. Functional compartmentalization and modularity
The Walktrap algorithm partitioned the food web into four modules (Q = 0.1126), each defined by a higher density of internal connections than connections between groups. This Q value is within the weak-to-moderate range, indicating that the four modules, while detectable, are not functionally isolated. A considerable number of inter-modular links connect nodes across compartments, and multiple species occupy boundary positions that bridge modules, a pattern visible in the network visualization (Figure 2).
The modular structure detected is broadly consistent with the resource-based partitioning expected in riverine systems, where benthic and pelagic energy channels tend to support distinct consumer guilds (Rooney et al., 2006; Lowe-McConnell, 1987). In this network, species associated with Detritus and Allochthonous Plant Material nodes, notably detritivorous Loricariidae, tended to cluster separately from omnivorous and insectivorous Characiformes linked to Aquatic and Terrestrial Insect nodes. This grouping reflects the dietary data compiled during meta-web construction and is interpretable as a topological feature of the assembled matrix.
The low Q value indicates, however, that module boundaries are highly permeable. Generalist species with dietary records spanning multiple resource categories act as inter-modular connectors, reducing topological compartmentalization. It is important to note that, in the meta-web framework used here, interaction breadth is the primary determinant of inter-modular connectivity; the same species might occupy more restricted structural positions under a weighted or temporally resolved network. The degree to which the observed permeability reflects a realized ecological pattern versus an artifact of the broad dietary records used in the meta-web cannot be determined from binary topology alone.
4.4. Robustness and redundancy hypothesis
The robustness analysis revealed contrasting responses under the two extinction scenarios. Under random removal, the network maintained more than 50% of its trophic connections until 12 species had been removed (R50 = 12), representing approximately 33% of the fish community. The gradual decay curve, particularly the low rate of connection loss during the first five removals, is consistent with high link redundancy among basal and intermediate consumers in the adjacency matrix. Under targeted removal of the highest-degree nodes, the R50 threshold was reached after only 6 species, indicating that connectivity loss accelerates twofold when removals are concentrated on hub nodes.
This differential response, high tolerance to random loss, sharp vulnerability to targeted removal, is a structural property of heterogeneous networks in which a small number of nodes concentrates a large proportion of interactions (Albert et al., 2000; Dunne et al., 2002a). In the present network, hub nodes are generalist species that contribute disproportionately to both intra- and inter-modular connectivity; their removal rapidly fragments the interaction structure. The R50 values reported here are topological approximations derived from the binary meta-web and should be interpreted as relative measures of structural sensitivity rather than as predictions of extinction thresholds under real-world conditions.
A further interpretive constraint concerns the nature of the random removal simulation. Stochastic removal of nodes with equal probability does not replicate the structure of real anthropogenic disturbances, which tend to be non-random and size- or trophic-level-selective (Zavaleta et al., 2010). The targeted removal scenario, by removing the highest-degree nodes sequentially, provides an upper bound on structural vulnerability under systematic perturbation, but neither scenario captures the coupled effects of habitat loss, flow alteration, or species interactions with non-native taxa. The robustness results therefore characterize the internal topology of the constructed network and do not constitute predictions of ecosystem response to specific management scenarios.
4.5. Methodological limitations and scope of inference
Several methodological constraints must be considered when interpreting the results of this study. First, the food web was constructed using a meta-web approach, in which trophic interactions were inferred from published diet records and the FishBase database rather than from direct field observation of predator-prey interactions in the Uberabinha River. This introduces potential biases: dietary plasticity, the well-documented tendency of Neotropical fishes to shift their diets in response to resource availability and seasonal hydrological variation (Winemiller, 1990; Hahn et al., 2004; Corrêa et al., 2011), means that the realized interaction set in the field may differ from the potential interaction set compiled here. As a result, the meta-web likely overestimates the number of active links at any given time, a known limitation of this method that may inflate connectance estimates and underestimate true modularity (Dunne et al., 2002a). Second, the network was treated as binary and unweighted, meaning that interaction frequency and energetic importance were not considered. Weighted representations have been shown to affect robustness outcomes by highlighting the disproportionate contribution of strong interactions to network stability (McCann et al., 1998). Third, the species list was derived from a single inventory (Sampaio et al., 2012), and sampling completeness was not formally assessed; rare or cryptic species absent from that inventory are therefore also absent from our network. These limitations do not invalidate the topological patterns identified, which are consistent with theoretical predictions and comparable empirical systems, but they indicate that the quantitative results, particularly the absolute values of connectance, modularity, and R50, should be interpreted as theoretical approximations of the network's structural potential rather than as precise empirical measurements of the current ecological state of the Uberabinha River.
5. Conclusion
The topological analysis of the Uberabinha River fish food web revealed a network characterized by low connectance, compressed trophic levels, and weak modularity, sustained primarily by the functional redundancy of generalist and omnivorous species. While this configuration confers significant theoretical robustness against random species loss (R50=12), it also conceals a critical structural vulnerability: the targeted removal of only six highly connected species is sufficient to collapse half of the network's trophic interactions (R50=6). This robust-yet-fragile pattern reflects a functionally simplified community shaped by decades of anthropogenic pressure in the Upper Paraná Basin. These findings indicate that effective conservation and management of this system must go beyond the protection of species richness to explicitly safeguard key trophic interactions and hub species, particularly top predators and benthic-channel specialists, that sustain the functional integrity of the food web.
-
Cite as:
Ranuzi, M., Palavicini, I. and Pazeto, V. Food web structure and robustness of fish assemblages in the Uberabinha River, Upper Paraná Basin. Acta Limnologica Brasiliensia, 2026, vol. 38, e15. https://doi.org/10.1590/S2179-975X0626
Data availabity
All research data analyzed in this study are available in the SciELO Data Dataverse repository (Acta Limnologica Brasiliensia Dataverse). Access is open. The dataset can be accessed at https://doi.org/10.48331/SCIELODATA.UNMR9R
References
-
Agostinho, A.A., Pelicice, F.M., & Gomes, L.C., 2008. Dams and the fish fauna of the Neotropical region: impacts and management related to diversity and fisheries. Braz. J. Biol. 68(4, Suppl.), 1119-1132. PMid:19197482. https://doi.org/10.1590/S1519-69842008000500019
» https://doi.org/10.1590/S1519-69842008000500019 -
Albert, R., Jeong, H., & Barabási, A.L., 2000. Error and attack tolerance of complex networks. Nature 406(6794), 378-382. PMid:10935628. https://doi.org/10.1038/35019019
» https://doi.org/10.1038/35019019 -
Allesina, S., & Pascual, M., 2009. Googling food webs: can an eigenvector measure species’ importance for coextinctions? PLOS Comput. Biol. 5(9), e1000494. PMid:19730676. https://doi.org/10.1371/journal.pcbi.1000494
» https://doi.org/10.1371/journal.pcbi.1000494 -
Arantes, C.C., Fitzgerald, D.B., Hoeinghaus, D.J., & Winemiller, K.O., 2019. Impacts of hydroelectric dams on fishes and fisheries in tropical rivers through the lens of functional traits. Curr. Opin. Environ. Sustain. 37, 28-40. https://doi.org/10.1016/j.cosust.2019.04.009
» https://doi.org/10.1016/j.cosust.2019.04.009 -
Azevedo-Santos, V.M., Rigolin-Sá, O., & Pelicice, F.M., 2011. Growing, losing or introducing? Cage aquaculture as a vector for the introduction of non-native fish in Furnas Reservoir, Minas Gerais, Brazil. Neotrop. Ichthyol. 9(4), 723-728. https://doi.org/10.1590/S1679-62252011000400024
» https://doi.org/10.1590/S1679-62252011000400024 -
Casatti, L., Ferreira, C.P., & Carvalho, F.R., 2009. Grass-dominated stream sites exhibit low fish species diversity and dominance by guppies: an assessment of two tropical pasture river basins. Hydrobiologia 632(1), 273-283. https://doi.org/10.1007/s10750-009-9849-y
» https://doi.org/10.1007/s10750-009-9849-y -
Corrêa, C.E., Albrecht, M.P., & Hahn, N.S., 2011. Patterns of niche breadth and feeding overlap of the fish fauna in the seasonal Brazilian Pantanal, Cuiabá River basin. Neotrop. Ichthyol. 9(3), 637-646. https://doi.org/10.1590/S1679-62252011000300017
» https://doi.org/10.1590/S1679-62252011000300017 -
Csardi, G., & Nepusz, T., 2006. The igraph software package for complex network research. Retrieved in 2026, January 26, from https://www.researchgate.net/publication/221995787_The_Igraph_Software_Package_for_Complex_Network_Research
» https://www.researchgate.net/publication/221995787_The_Igraph_Software_Package_for_Complex_Network_Research -
Dunne, J.A., Williams, R.J., & Martinez, N.D., 2002a. Network structure and biodiversity loss in food webs: robustness increases with connectance. Ecol. Lett. 5(4), 558-567. https://doi.org/10.1046/j.1461-0248.2002.00354.x
» https://doi.org/10.1046/j.1461-0248.2002.00354.x -
Dunne, J.A., Williams, R.J., & Martinez, N.D., 2002b. Food-web structure and network theory: the role of connectance and size. Proc. Natl. Acad. Sci. USA 99(20), 12917-12922. PMid:12235364. https://doi.org/10.1073/pnas.192407699
» https://doi.org/10.1073/pnas.192407699 -
Froese, R., & Pauly, D., 2024. FishBase. Retrieved in 2026, January 26, from www.fishbase.org
» www.fishbase.org - Guilherme, L.C., 2005. Estudos reprodutivos e citogenéticos na população de Rhamdia quelen (Pisces, Rhamdiidae) do rio Uberabinha no município de Uberlândia - MG [PhD Thesis in in Genetics and Biochemistry]. Uberlândia: Universidade Federal de Uberlândia.
- Hahn, N.S., Fugi, R., & Peretti, D., 2004. Trophic plasticity of the fish fauna: A comparison between lotic and lentic environments in the upper Paraná River basin. In: Agostinho, A.A., Rodrigues, L., Gomes, L. C., Thomaz, S. M. & Miranda, L. E., eds. Ecology and management of resources in reservoirs. Maringá, Brazil: EDUEM, 1-43.
- Hoeinghaus, D.J., Winemiller, K.O., & Agostinho, A.A., 2008. Hydrogeomorphology and river impoundment affect food-web structure of tropical floodplain lakes. Am. Nat. 171, 515-527.
-
Jepsen, D.B., & Winemiller, K.O., 2002. Structure of tropical river food webs revealed by stable isotope ratios. Oikos 96(1), 46-55. https://doi.org/10.1034/j.1600-0706.2002.960105.x
» https://doi.org/10.1034/j.1600-0706.2002.960105.x -
Krause, A.E., Frank, K.A., Mason, D.M., Ulanowicz, R.E., & Taylor, W.W., 2003. Compartments revealed in food-web structure. Nature 426(6964), 282-285. PMid:14628050. https://doi.org/10.1038/nature02115
» https://doi.org/10.1038/nature02115 -
Layer, K., Riede, J.O., Hildrew, A.G., & Woodward, G., 2010. Food web structure and stability in 20 streams across a wide pH gradient. Adv. Ecol. Res. 42, 265-299. https://doi.org/10.1016/B978-0-12-381363-3.00005-8
» https://doi.org/10.1016/B978-0-12-381363-3.00005-8 -
Layman, C.A., Arrington, D.A., Montaña, C.G., & Post, D.M., 2007. Can stable isotope ratios provide for community-wide measures of trophic structure? Ecology 88(1), 42-48. PMid:17489452. https://doi.org/10.1890/0012-9658(2007)88[42:CSIRPF]2.0.CO;2
» https://doi.org/10.1890/0012-9658(2007)88[42:CSIRPF]2.0.CO;2 -
Loureiro-Crippa, V.E., & Hahn, N.S., 2006. Use of food resources by the fish fauna of a small reservoir (Rio Jordão, Brazil) before and after its formation. Neotrop. Ichthyol. 4(3), 367-376. https://doi.org/10.1590/S1679-62252006000300007
» https://doi.org/10.1590/S1679-62252006000300007 -
Lowe-McConnell, R.H. 1987. Ecological studies in tropical fish communities. Cambridge: Cambridge University Press. https://doi.org/10.1017/CBO9780511721892
» https://doi.org/10.1017/CBO9780511721892 -
May, R.M., 1972. Will a large complex system be stable? Nature 238(5364), 413-414. PMid:4559589. https://doi.org/10.1038/238413a0
» https://doi.org/10.1038/238413a0 -
McCann, K., Hastings, A., & Huxel, G.R., 1998. Weak trophic interactions and the balance of nature. Nature 395(6704), 794-798. https://doi.org/10.1038/27427
» https://doi.org/10.1038/27427 -
McCann, K.S., 2000. The diversity-stability debate. Nature 405(6783), 228-233. PMid:10821283. https://doi.org/10.1038/35012234
» https://doi.org/10.1038/35012234 -
Memmott, J., Waser, N.M., & Price, M.V., 2004. Tolerance of pollination networks to species extinctions. Proc. Biol. Sci. 271(1557), 2605-2611. PMid:15615687. https://doi.org/10.1098/rspb.2004.2909
» https://doi.org/10.1098/rspb.2004.2909 -
Montoya, J.M., Pimm, S.L., & Solé, R.V., 2006. Ecological networks and their fragility. Nature 442(7100), 259-264. PMid:16855581. https://doi.org/10.1038/nature04927
» https://doi.org/10.1038/nature04927 -
Newman, M.E.J., 2006. Modularity and community structure in networks. Proc. Natl. Acad. Sci. USA 103(23), 8577-8582. PMid:16723398. https://doi.org/10.1073/pnas.0601602103
» https://doi.org/10.1073/pnas.0601602103 -
Olden, J.D., Poff, N.L., Douglas, M.R., Douglas, M.E., & Fausch, K.D., 2004. Ecological and evolutionary consequences of biotic homogenization. Trends Ecol. Evol. 19(1), 18-24. PMid:16701221. https://doi.org/10.1016/j.tree.2003.09.010
» https://doi.org/10.1016/j.tree.2003.09.010 -
Pace, M.L., Cole, J.J., Carpenter, S.R., & Kitchell, J.F., 1999. Trophic cascades revealed in diverse ecosystems. Trends Ecol. Evol. 14(12), 483-488. PMid:10542455. https://doi.org/10.1016/S0169-5347(99)01723-1
» https://doi.org/10.1016/S0169-5347(99)01723-1 -
Pelicice, F.M., & Agostinho, A.A., 2009. Fish fauna destruction after the introduction of a non-native predator (Cichla kelberi) in a Neotropical reservoir. Biol. Invasions 11(8), 1789-1801. https://doi.org/10.1007/s10530-008-9358-3
» https://doi.org/10.1007/s10530-008-9358-3 -
Peretti, D., & Andrian, I.F., 2004. Trophic structure of fish assemblages in five permanent lagoons of the High Paraná River Floodplain, Brazil. Environ. Biol. Fishes 71(1), 95-103. https://doi.org/10.1023/B:EBFI.0000043155.76741.a1
» https://doi.org/10.1023/B:EBFI.0000043155.76741.a1 -
Polis, G.A., & Strong, D.R., 1996. Food web complexity and community dynamics. Am. Nat. 147(5), 813-846. https://doi.org/10.1086/285880
» https://doi.org/10.1086/285880 -
Pons, P., & Latapy, M., 2005. Computing communities in large networks using random walks. J. Graph Algorithms Appl. 10(2), 191-218. https://doi.org/10.7155/jgaa.00124
» https://doi.org/10.7155/jgaa.00124 -
Post, D.M., 2002. The long and short of food-chain length. Trends Ecol. Evol. 17(6), 269-277. https://doi.org/10.1016/S0169-5347(02)02455-2
» https://doi.org/10.1016/S0169-5347(02)02455-2 -
Post, D.M., Pace, M.L., & Hairston Junior, N.G., 2000. Ecosystem size determines food-chain length in lakes. Nature 405(6790), 1047-1049. PMid:10890443. https://doi.org/10.1038/35016565
» https://doi.org/10.1038/35016565 -
R Core Team, 2024. R: A language and environment for statistical computing Vienna: R Foundation for Statistical Computing. Retrieved in 2026, January 26, from https://www.R-project.org/
» https://www.R-project.org/ -
Rooney, N., McCann, K., Gellner, G., & Moore, J.C., 2006. Structural asymmetry and the stability of diverse food webs. Nature 442(7100), 265-269. PMid:16855582. https://doi.org/10.1038/nature04887
» https://doi.org/10.1038/nature04887 -
Sampaio, W.M.S., Belei, F., Giongo, P., & Silva, W.L., 2012. Ichthyofauna, Uberabinha River (Upper Paranaíba River Basin), Triangle Mineiro region, Uberlândia, Minas Gerais, Brazil. Check List 8(6), 1085-1088. https://doi.org/10.15560/8.6.1085
» https://doi.org/10.15560/8.6.1085 -
SciELO Data Dataverse, 2026. Acta Limnologica Brasiliensia Dataverse. Retrieved in 2026, January 26, from https://doi.org/10.48331/SCIELODATA.UNMR9R
» https://doi.org/10.48331/SCIELODATA.UNMR9R -
Stouffer, D.B., & Bascompte, J., 2011. Compartmentalization increases food-web persistence. Proc. Natl. Acad. Sci. USA 108(9), 3648-3652. PMid:21307311. https://doi.org/10.1073/pnas.1014353108
» https://doi.org/10.1073/pnas.1014353108 -
Thébault, E., & Fontaine, C., 2010. Stability of ecological communities and the architecture of mutualistic and trophic networks. Science 329(5993), 853-856. PMid:20705861. https://doi.org/10.1126/science.1188321
» https://doi.org/10.1126/science.1188321 -
Thompson, R.M., Hemberg, M., Starzomski, B.M., & Shurin, J.B., 2007. Trophic levels and trophic tangles: the prevalence of omnivory in real food webs. Ecology 88(3), 612-617. PMid:17503589. https://doi.org/10.1890/05-1454
» https://doi.org/10.1890/05-1454 -
Tylianakis, J.M., Didham, R.K., Bascompte, J., & Wardle, D.A., 2008. Global change and species interactions in terrestrial ecosystems. Ecol. Lett. 11(12), 1351-1363. PMid:19062363. https://doi.org/10.1111/j.1461-0248.2008.01250.x
» https://doi.org/10.1111/j.1461-0248.2008.01250.x -
Vander Zanden, M.J., & Fetzer, W.W., 2007. Global patterns of aquatic food chain length. Oikos 116(8), 1378-1388. https://doi.org/10.1111/j.0030-1299.2007.16036.x
» https://doi.org/10.1111/j.0030-1299.2007.16036.x -
Vannote, R.L., Minshall, G.W., Cummins, K.W., Sedell, J.R., & Cushing, C.E., 1980. The river continuum concept. Can. J. Fish. Aquat. Sci. 37(1), 130-137. https://doi.org/10.1139/f80-017
» https://doi.org/10.1139/f80-017 -
Williams, R.J., & Martinez, N.D., 2004. Limits to trophic levels and omnivory in complex food webs: theory and data. Am. Nat. 163(3), 458-468. PMid:15026980. https://doi.org/10.1086/381964
» https://doi.org/10.1086/381964 -
Winemiller, K.O., 1990. Spatial and temporal variation in tropical fish trophic networks. Ecol. Monogr. 60(3), 331-367. https://doi.org/10.2307/1943061
» https://doi.org/10.2307/1943061 -
Winemiller, K.O., McIntyre, P.B., Castello, L., Fluet-Chouinard, E., Giarrizzo, T., Nam, S., Baird, I.G., Darwall, W., Lujan, N.K., Harrison, I., Stiassny, M.L., Silvano, R.A., Fitzgerald, D.B., Pelicice, F.M., Agostinho, A.A., Gomes, L.C., Albert, J.S., Baran, E., Petrere Junior, M., Zarfl, C., Mulligan, M., Sullivan, J.P., Arantes, C.C., Sousa, L.M., Koning, A.A., Hoeinghaus, D.J., Sabaj, M., Lundberg, J.G., Armbruster, J., Thieme, M.L., Petry, P., Zuanon, J., Torrente Vilara, G., Snoeks, J., Ou, C., Rainboth, W., Pavanelli, C.S., Akama, A., van Soesbergen, A., & Sáenz, L., 2016. Balancing hydropower and biodiversity in the Amazon, Congo, and Mekong. Science 351(6269), 128-129. PMid:26744397. https://doi.org/10.1126/science.aac7082
» https://doi.org/10.1126/science.aac7082 -
Zavaleta, E., Pasari, J., Hulvey, K., & Tilman, D., 2010. Sustaining multiple ecosystem functions in grassland communities requires higher biodiversity. Proc. Natl. Acad. Sci. USA 107(4), 1443-1446. PMid:20080690. https://doi.org/10.1073/pnas.0906829107
» https://doi.org/10.1073/pnas.0906829107
Edited by
-
Associate Editor:
Ronaldo Angelini.