 A comparative study of automatic guidance signals and planting speeds for corn
ABSTRACT.
Planting is considered one of the most critical mechanized agricultural operations, because any errors during this stage could cause significant yield losses. In this context, the use of automatic guidance systems can minimize errors in the row parallelism and alignment, ensuring consistent spacing and optimal operational speeds. Therefore, the objective of this study was to evaluate the effects of different GNSS correction signals and forward speeds on the corn planting. The treatments consisted in two GNSS correction signals for automatic guidance: SF1 - a free-to-use signal with ±23 cm pass-to-pass parallelism error, and SF2 - a subscription-based signal with ±5 cm pass-to-pass parallelism error; and three forward speeds (5, 6, and 8 km h-1). The depth and longitudinal seed distribution (classified as double, skipped, and acceptable spacings) were evaluated using statistical process control (SPC) and descriptive statistical methods. The results showed that the SF2 signal provided superior seeding quality, characterized by lower variability and enhanced process stability. Therefore, usage of the subscription-based SF2 signal is recommended to achieve optimal seeding quality. It improves the seed distribution and link to acceptable parallelism correction.
Keywords:
precision agriculture; GNSS, parallelism; autopilot; statistical process control
Introduction
In recent decades, Brazil has become one of the world's largest food producers (FAO & WHO, 2023). In light of this, precision agriculture has been introduced, incorporating modern technologies that integrate intelligent devices and sensors to automate agricultural activities and optimize input usage, resulting in reduced production costs. Consequently, this approach has markedly increased agricultural productivity and the adoption of more sustainable practices (Ariza-Sentís et al., 2024).
Corn (Zea mays) is one of the primary commodities produced in Brazil, totaling 131,892,600 tons over an area of 22,269,200 hectares across all Brazilian regions in the 2022/2023 season (Companhia Nacional de Abastecimento [Conab], 2024). It is important to highlight the transformations in corn production in Brazil. Driven by the incorporation of various technologies, corn cultivation has evolved from a simple subsistence activity practiced by family farmers to large-scale commercial agriculture, including the production of two crops per year on the same field (Contini et al., 2019; Gonçalves Jr. et al., 2024).
However, several factors can delay planting of the second-crop corn, such as insufficient or excessive rainfall during the first crop season, low soil moisture at planting time, or simply inadequate machinery capacity to meet operational demands. These factors can negatively affect seed distribution quality, resulting in significant planting losses (Santos et al., 2019; Rosa Junior et al., 2022).
Therefore, the speed of the tractor-seeder combination is typically increased to compensate for delays in the planting operation. This increased speed can affect row parallelism as well as seed distribution, where the percentages of acceptable, double, and skipped spacings are crucial indicators of crop planting (Petrović et al., 2024). Thus, establishing an optimal spatial arrangement is essential to ensure an adequate plant stand and increased yield (Ariza-Sentís et al., 2024).
The advancement of precision agriculture technologies can improve the accuracy of planting operations and, consequently, reduce spatial variability in plant stands (Oliveira & Molin, 2014). The use of Global Navigation Satellite Systems (GNSS) can reduce labor costs and improve planting quality (Inoue et al., 2019). However, identifying the most efficient and appropriate correction signal for each type of operation remains a challenge, primarily due to the associated technological costs. This factor often leads to hesitation among producers regarding technology implementation, mainly because of uncertainties about return on investment and operational effectiveness.
Thus, several benefits of adopting automatic steering systems can be highlighted, such as improved accuracy in seed distribution, increased operational efficiency, reduced overlapping of passes, and enhanced ease of operation under low-visibility conditions (e.g., at night or in fog) (Barbosa Júnior et al., 2024; Lipiński et al., 2016). Moreover, the use of GNSS correction signals enables higher planting speeds, allowing producers to achieve an optimal operational balance (Aranha et al., 2021).
The type and accuracy of GNSS correction signals directly affect the quality of the seeding operation, as signal variations and instabilities can impact the trajectory of the tractor-seeder combination, affecting both row parallelism and longitudinal seed distribution. Therefore, the objective of this study was to evaluate whether different GNSS correction signals and seeding speeds affect the quality of corn seeding.
Material and methods
Experiment location
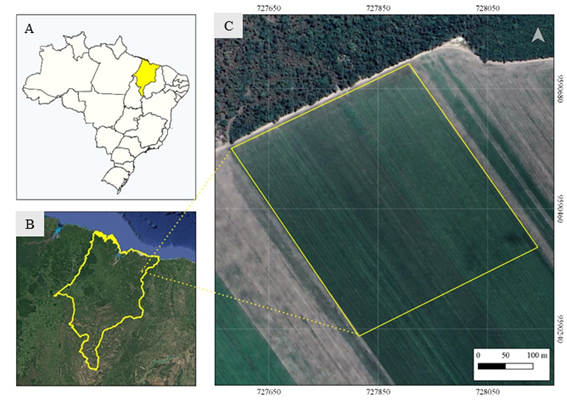
The experiment was conducted in a commercial corn field located in Brejo, Maranhão State, Brazil on the Cerrado biome, which partially covers some areas in the states of Maranhão, Tocantins, Piauí, and Bahia - collectively known as the MATOPIBA region (Figure 1).
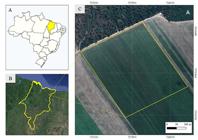
(A) Map of Brazil, (B) state of Maranhão, and (C) experimental area location in the municipality of Brejo.
The soil was classified as Acrisol (IUSS Working Group WRB-FAO, 2015) or Argissolo Amarelo based on the Brazilian Soil Classification System (Santos et al., 2018). The regional climate was classified as C2W2A'a' - subhumid climate. The weather shows an average temperature of 27°C and an annual rainfall from 1,600 to 2,000 mm.
Experimental design
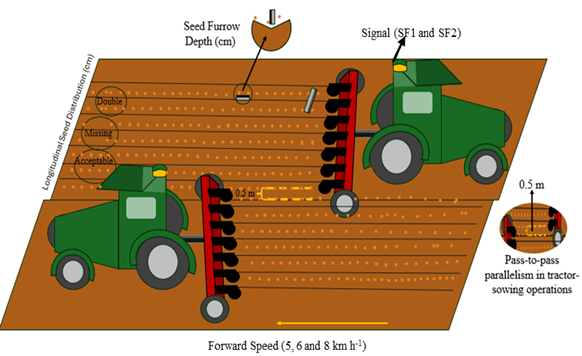
Planting was conducted in the first week of February 2022 using a pneumatic seed-fertilizer drill (Jumil JM3080PD Pantographic model, with 13 rows) coupled to a John Deere 7225J tractor equipped with a 225 hp engine. The seed-fertilizer drill was calibrated to distribute 3.1 seeds per meter at a depth of 4 cm and a row spacing of 50 cm. The cultivated corn cultivar was a hybrid Viptera 3, characterized by an average growth cycle of 170 days.
The experimental design was a 2 × 3 strip plot with nine replications. The first factor consisted of two automatic steering correction signals (SF1 and SF2), while the second factor comprised three planting speeds (5, 6, and 8 km h-1). SF1 is a free-to-use signal with a ±23 cm pass-to-pass parallelism error, and SF2 is a subscription-based signal with a ±5 cm pass-to-pass parallelism error. During the planting was used a StarFire™ 3000 receiver and GreenStar™ 3 monitor from John Deere company.
Experimental variables
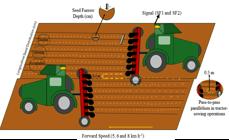
We evaluated planting depth, longitudinal seed distribution, and row parallelism. Based on the vertical distance from the soil surface to the seed position in the furrow, planting depth (cm) was measured with a ruler (Figure 2). Longitudinal seed distribution (mm) was determined with a measuring tape, recording the horizontal distance between seeds along the furrow. Row parallelism (cm) was evaluated by measuring the spacing between adjacent rows. Seed spacings (Xi) were classified as acceptable (normal) spacing (0.5 Xref < Xi < 1.5 Xref), multiple (double) spacing (Xi < 0.5 Xref), and faulty (skipped) spacing (Xi > 1.5 Xref), where Xref corresponds to the reference spacing, set during calibration of the tractor-seeder combination. For this study, the reference spacing (Xref) was 33.3 cm.
Data analysis
To evaluate the behavior of variables associated with each quality indicator, a descriptive analysis of the data was conducted using box plots. This approach allowed visualization of the data distribution, identification of potential outliers, asymmetry, and variability within the results. Box plots were used to illustrate statistical measures such as median, quartiles, and the interquartile range.
These variables were analyzed using Statistical Quality Control (SQC) methods, specifically employing individual control charts from Statistical Process Control (SPC). The lower control limit (LCL) and upper control limit (UCL) were determined based on process variability and calculated using Equations (1) and (2):
UCL = X̄ + 3((1)
LCL = X̄ + 3((2)
Abbreviations: UCL = upper control limit; LCL = lower control limit; X̄ = database average; σ = database standard deviation.
Results
Corn planting quality
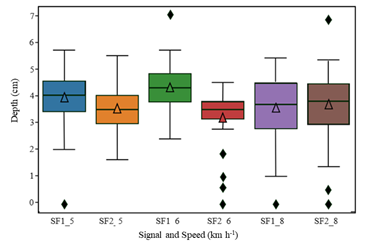
For the SF1 correction signal at 5 km h⁻¹, the seeding depth showed a relatively wide interquartile range, with a median around 4 cm and outliers below 1 cm. As the speed increased to 8 km h⁻¹, the interquartile range further widened, data dispersion intensified, and the occurrence of outliers increased, suggesting greater inconsistency in seeding depth.
Conversely, the SF2 signal provided greater stability in seeding depth, particularly at speeds of 6 and 8 km h⁻¹. At 5 km h⁻¹, both SF1 and SF2 exhibited similar data patterns as regards interquartile range and variability. However, their mean and median values differed, with SF1 remaining closer to 4 cm. At 6 km h⁻¹, the SF2 signal continued to demonstrate superior performance, characterized by lower variability despite a higher number of outliers. At 8 km h⁻¹, the SF2 signal also experienced increased data dispersion, indicating that even with a more accurate correction signal, higher operational speeds might compromise seeding depth consistency. These results suggested that using the SF2 correction signal especially at 6 km h⁻¹, was more effective in maintaining seeding depth within an acceptable range, thereby enhancing overall seeding uniformity (Figure 3).

Boxplot of planting depth under different correction signals (SF1 and SF2) and planting speeds (5, 6, and 8 km h-1).
The analysis showed that both speed and correction signal influenced the occurrence of double spacings, a crucial factor associated with yield losses. For the SF1 signal at 5 km h⁻¹, the median percentage of double seeds was low, around 1%. However, considerable variability was observed, as indicated by the presence of outliers reaching approximately 35%. This high percentage of double spacings was problematic because it increased plant competition and could negatively impact yield. As the speed increased to 6 and 8 km h⁻¹, the median values remained close to zero, although outliers continued to occur (Figure 4). Compared to SF1, the SF2 signal demonstrated higher stability. At speeds of 5 and 6 km h⁻¹, the median percentage of double spacings remained close to zero, with a more concentrated distribution indicating lower variability and fewer outliers than observed with SF1. These results indicated improved planting precision with the use of SF2 at these speeds. However, at 8 km h⁻¹, despite maintaining a low median, there was a slight increase in variability and number of outliers, reinforcing that SF2 is still a more precise signal overall (Figure 4). The enhanced stability observed with SF2 can be attributed to the greater accuracy of the GNSS correction signal because it provided more precise control of the autopilot system. The persistence of outliers at higher operational speeds, even with SF2, emphasized the importance of careful operational control in mitigating potential yield losses (Figure 4).
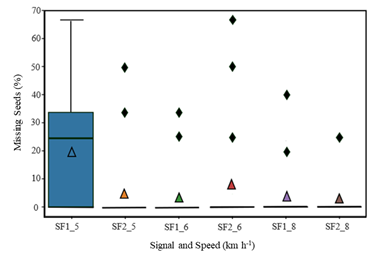
For the SF1 signal at 5 km h⁻¹, a median failure rate of approximately 25% was observed, accompanied by considerable variability, as indicated by the interquartile range extending to approximately 70%. The average failure rate represented by the blue triangle was higher compared to other treatment combinations, suggesting that this configuration produced a greater occurrence of seed distribution failures. This outcome suggested that an intrinsic error may have occurred at this speed using SF1, as this result substantially deviated from the others. When using the SF1 signal at increased speed of 6 km h⁻¹, the median failure rate approached zero, and the average represented by the green triangle was lower than that observed for SF2. This indicated that at 6 km h⁻¹, SF1 achieved better performance, exhibited fewer failures and stood out as the most efficient combination (Figure 5). While using the SF1 signal at 8 km h⁻¹, the median remained close to zero, although the average indicated by the purple triangle increased slightly. This suggested that SF1 continued to perform relatively well despite the increased speed. For the SF2 signal at 5 km h⁻¹, the median was similarly low, close to zero with the mean (represented by the orange triangle) substantially better than that recorded for SF1 at the same speed, indicating superior performance in minimizing seed distribution failures (Figure 5). Lastly, at 8 km h⁻¹ with the SF2 signal, the median remained close to zero and the mean indicated by the brown triangle, was also low and very similar to that observed for SF1 at the same speed. This indicated that at higher speeds, both signals had comparable performance although SF2 displayed a slight advantage in terms of stability (Figure 5).
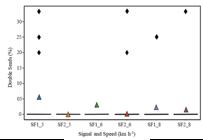
Boxplot of double seed distribution in relation to planting speeds (5, 6, and 8 km h-1) and signals (SF1 and SF2).
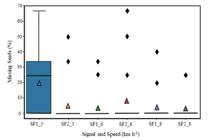
Boxplot of missing seed distribution in relation to planting speeds (5, 6, and 8 km h-1) and signals (SF1 and SF2).
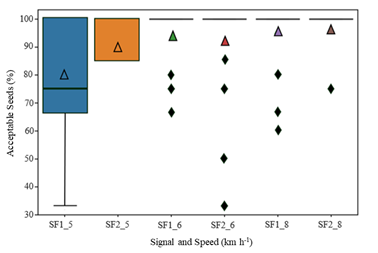
Figure 6 shows that at 5 km h⁻¹, the SF2 signal provided a more consistent and uniform seed distribution, with a median close to 95% and a similarly high mean represented by the orange triangle and minimal variability. This indicated that SF2 was particularly effective at maintaining seeding quality. In contrast, the SF1 signal at 5 km h⁻¹ showed greater variability, with a median around 85% and a slightly lower mean, suggesting reduced precision in seed distribution. At 6 km h⁻¹, SF1 displayed superior performance with both median and mean approaching 100%, indicating excellent seeding quality. However, the presence of some outliers suggested variability under certain conditions. At the same speed, SF2 also exhibited high average values but with an increased presence of outliers, suggesting some inconsistency compared to SF1 (Figure 6). At a higher speed of 8 km h⁻¹, SF1 and SF2 maintained medians and means close to 100%, suggesting that both signals effectively ensured a high proportion of acceptable spacings. These results demonstrated that while SF2 at 5 km h⁻¹ provided the highest consistency in seed distribution, SF1 at 6 km h⁻¹ excelled in precision, and both signals demonstrated comparable effectiveness at the highest speed tested (8 km h⁻¹) (Figure 6).
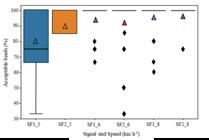
Boxplot of acceptable spacing distribution in relation to speeds (5, 6, and 8 km h-1) and signals (SF1 and SF2).
Control charts for analyzing corn planting quality
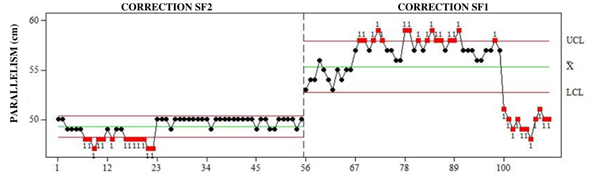
Control chart analysis of row parallelism under two different GNSS correction signals showed the precision and consistency of the seeding operation. For the SF2 signal, there was high stability in row parallelism with most data points concentrated around 50 cm, which corresponded to the desired row spacing. This result indicated a controlled and precise planting operation. The average (X̄) aligned closely with the central reference line near 50 cm, and variations remained well within the upper and lower control limits. The absence of significant deviations and outliers indicated that the SF2 signal maintained excellent control over parallelism, thereby ensuring uniform seed distribution (Figure 7).
In contrast, the parallelism results for the SF1 signal revealed significant instability. Initially, the data points deviated from the central line, leading to increased variability and several observations surpassing the upper control limit. This indicated a loss of control in the seeding process with the SF1 signal, particularly evident after observation point 75, where a notable peak was observed reflecting a substantial deviation from the desired row parallelism. The situation further deteriorated after observation point 90, with parallelism values decreasing sharply and approaching the lower control limit. This behavior highlighted a marked inconsistency associated with the SF1 signal, possibly influenced by external factors or inherent limitations in the signal's accuracy, thus compromising the uniformity of the seeding operation (Figure 7).
In summary, the comparison of both correction signals revealed that the SF2 signal provided more consistent seeding performance. In contrast, the SF1 signal exhibited susceptibility to larger deviations, thereby compromising the overall seeding quality. Therefore, SF2 is recommended as the preferred choice for operations requiring high precision in row parallelism, ensuring greater consistency and minimizing the risk of unwanted variability in seed distribution (Figure 7).
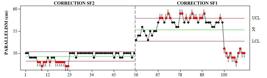
Control chart of parallelism analysis at speeds (5, 6, and 8 km h-1) with SF1 and SF2 signals.
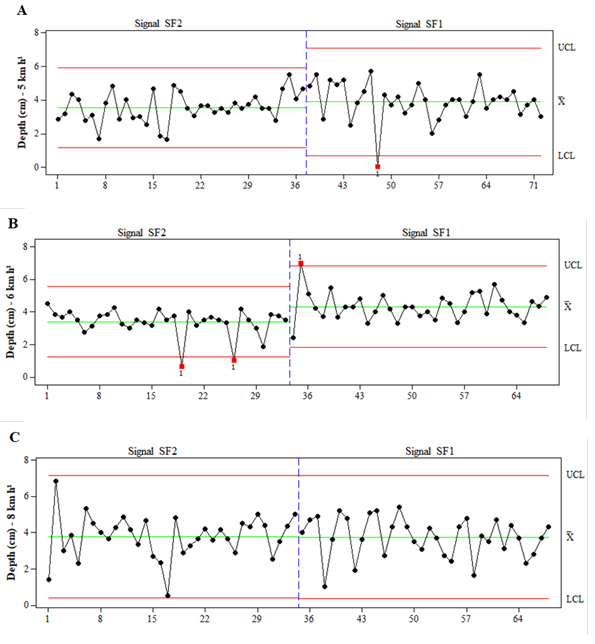
In chart A, at 5 km h⁻¹ the SF2 signal demonstrated notable stability, with most depth measurements closely clustered around the central line, showing minimal variability and indicating precise control over planting depth. Conversely, at the same speed, the SF1 signal exhibited significantly higher variability with data points dispersed closer to the upper control limit, and one observation exceeded the lower control limit. This increased dispersion suggests instability, indicating that planting depth under the SF1 signal was less consistent and more susceptible to variation (Figure 8).
As speed increased to 6 km h⁻¹ (Chart B), the SF2 signal continued to demonstrate lower variability, with planting depth measurements being closely clustered around the mean. By contrast, the SF1 signal at this speed exhibited more pronounced variability, indicating greater operational instability. As the speed increased, both signals revealed a reduced capability to maintain consistent planting depth, which could negatively affect overall planting uniformity (Figure 8).
Finally, in Chart C, both SF1 and SF2 exhibited similar behavior at 8 km h⁻¹, characterized by high variability for each signal and similar mean values. These results showed that planting quality was compromised as operational speed increased (Figure 8).

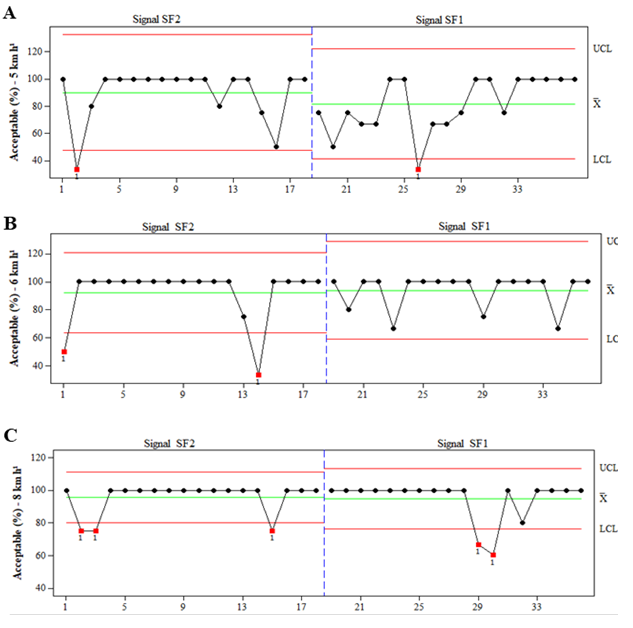
Control charts for analyzing the transverse seed distribution at speeds of (A) 5 km h-1, (B) 6 km h-1, and (C) 8 km h-1 with correction signals SF1 and SF2 (UCL - Upper Control Limit; LCL - Lower Control Limit; and X̄ - Mean).
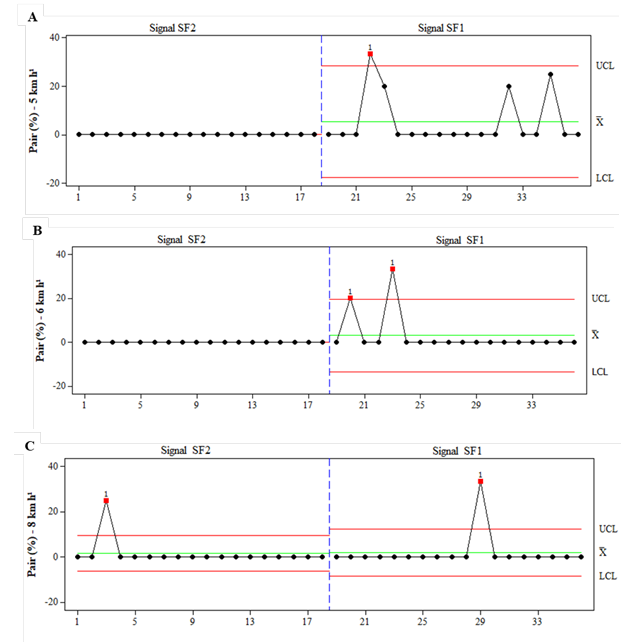
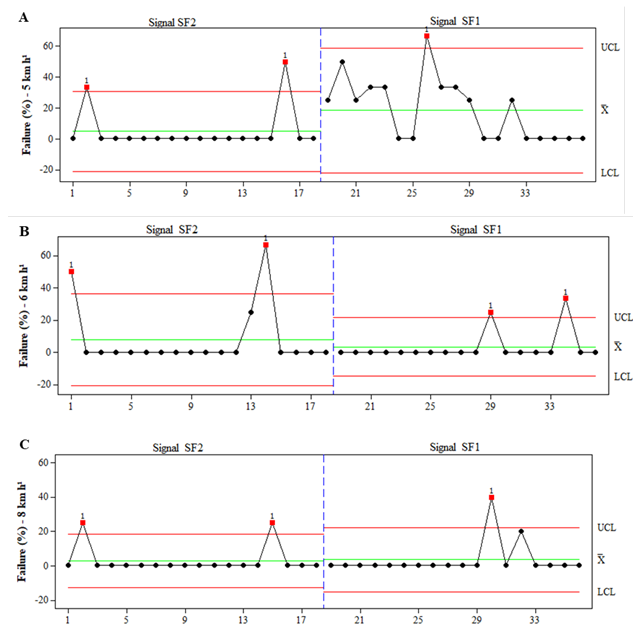
The SF2 signal demonstrated greater stability at 5 and 6 km h⁻¹. By contrast, the SF1 signal exhibited instability at these same speeds, characterized by higher variability and an increased frequency of double seed spacings. Although the performance of SF1 improved somewhat with increased speed, it still displayed greater operational variability compared to SF2 (Figure 9).
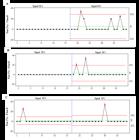
Control charts for analyzing the longitudinal distribution of double seeds at (A) 5 km h-1, (B) 6 km h-1, and (C) 8 km h-1 with correction signals SF1 and SF2 (UCL - Upper Control Limit; LCL - Lower Control Limit; and X̄ - Mean).
As regards the indication of defective seed quality, both signals and all speeds exhibited process instability. Overall, the SF1 signal showed greater instability, particularly at 5 km h⁻¹, where several points exceeded the upper control limit, indicating lower operational quality. Although the performance of SF1 improved slightly at 6 and 8 km h⁻¹, it still demonstrated higher variability compared to SF2 at 8 km h⁻¹. Thus, SF1 provided a relatively better performance specifically at the intermediate speed of 6 km h⁻¹ (Figure 10).
These results reinforced the importance of the SF2 signal for improving planting quality by minimizing seed distribution failures. However, it is noteworthy that both signals demonstrated a reduction in process variability with increased tractor-seeder speeds, a trend noticeable in results related to double spacings (Figure 10).
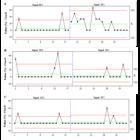
Control charts for analyzing the longitudinal distribution of missed seeds at (A) 5 km h-1, (B) 6 km h-1 and (C) 8 km h-1 with correction signals SF1 and SF2 (UCL - Upper Control Limit; LCL - Lower Control Limit; and X̄ - Mean).
The results of the acceptable spacing analysis showed that both correction signals, SF2 (subscription-based) and SF1 (free-to-use), exhibited some process instability as evidenced by data points exceeding the control limits. Notably, the lowest variability among all tested speeds was recorded at 8 km h⁻¹. Despite these instabilities, the overall results can be considered satisfactory, given that the mean percentage of acceptable spacings remained close to 100% under all operational conditions. This indicated high precision in the seeding process, even with variations in correction signals and operating speeds (Figure 11).
Discussion
The results obtained in this study underscore the importance of quality control in corn seeding, especially when considering the operational variability induced by different speeds and subscription-based versus free-to-use GNSS correction signals. The control charts revealed that the SF2 signal provided greater precision in seeding depth, with measurements consistently close to the mean of 3.5 cm and the target depth of 4 cm. This precision was particularly evident at 5 km h⁻¹, where all data points remained within the established upper and lower control limits, indicating excellent operational accuracy (Santos et al., 2017).
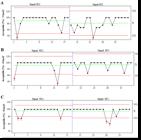
Control charts for analyzing the longitudinal distribution of missed seeds at (A) 5 km h-1, (B) 6 km h-1 and (C) 8 km h-1 showing the longitudinal distribution of missed seeds at speeds with correction signals SF1 and SF2 (UCL - Upper Control Limit; LCL - Lower Control Limit; and X̄ - Mean).
It has been reported that the operational speed of the tractor-seeder combination significantly influences corn seeding, as suitable speeds (around 5 km h⁻¹) enhance seed deposition efficiency and improve stand uniformity (Ferreira et al., 2019). Therefore, speed is a critical factor affecting uniformity in seed placement depth during seeding operations (Cintra et al., 2020). However, the use of GNSS receivers may cause more errors at lower operating speeds (Molin & Carreira, 2006). This observation was corroborated in the present study (Figure 3), particularly for the SF1 signal, where increasing the speed improved the overall operation quality by frequently reducing process variability.
Problems associated with seeding depth can reduce germination by affecting the seed's exposure to light and soil moisture, thereby negatively impacting stand establishment and the productive potential of corn (Limede et al., 2018). Furthermore, in soils such as Ferralsols, inadequate seed placement can further impair germination, particularly when the seeding depth exceeds recommended limits, as described by Dantas et al. (2014).
The predominance of acceptable spacings, characterized by fewer occurrences of skips and double seed spacings, is critical for proper stand establishment and consequently, the productive potential of corn - a crop known for its relatively low population density and limited capacity for canopy closure (Weirich Neto et al., 2015). Double seed spacings can intensify competition among plants for resources, ultimately reducing crop yield (Arcoverde et al., 2016). The low or nonexistent incidence of these spacing irregularities, as observed with the SF2 signal (Figure 4), revealed greater operational efficiency (Carpes et al., 2017).
The points observed outside the control limits could be associated with GNSS signal interference or operational, mechanical, climatic, or soil anomalies (Bortoli et al., 2021; Barbosa et al., 2018). The combination of these factors can negatively affect seeding quality and productivity, especially if inadequately corrected (Souza et al., 2019). In this context, employing Statistical Quality Control (SQC) has become essential to understand and mitigate these fluctuations (Arcoverde et al., 2016). The application of control charts as used in this study (Figure 5), is an effective method for evaluating the operational quality of mechanized agricultural systems, reducing errors and consequently enhancing agricultural profitability (Lipinski et al., 2016; Santos et al., 2018).
Furthermore, agricultural operations naturally exhibit greater variability compared to industrial processes due to factors such as operating speed, wheel slippage, seeder technology, and soil conditions, all of which directly influence seeding quality (Zerbato et al., 2019). From this perspective, Ferreira et al. (2019) showed that corn seeding could be conducted at higher speeds (7.5 km h⁻¹) using pneumatic seeders without compromising the proportion of acceptable seed spacings. In contrast, mechanical seeders which typically operate at lower speeds (around 5.5 km h⁻¹), appear to be less efficient. Thus, the results validate the effectiveness of GNSS correction signals, especially SF2 (Figure 10), as a viable solution for enhancing corn seeding quality across different operational speeds. Since seeding is a critical agricultural practice which directly influences crop productivity, ensuring the highest level of quality and precision during this operation is of paramount importance (Alonço et al., 2015).
The results of this study showed the importance of GNSS correction signals for seeding precision, with the subscription-based SF2 signal demonstrating greater stability and lower variability compared to the free-to-use SF1 signal (Figure 6). SF2 provided superior performance, ensuring higher accuracy in seeding depth and spacing particularly at increased operational speeds, while SF1 exhibited instability that could compromise seeding uniformity and ultimately reduce corn productivity.
It is important to emphasize that in some cases, intrinsic factors of the process may affect the evaluation outcomes as observed in Figure 5, where SF1 at 5 km h⁻¹ exhibited values different from the other indicators. When analyzing this behavior, it is essential to consider that seeding quality can be influenced by various interconnected factors, commonly represented by the 6M framework of Statistical Process Control (SPC) namely: 1) Machine, 2) Method, 3) Material, 4) Manpower, 5) Environment, and 6) Measurement (Montgomery, 2016). Any of these factors could have influenced the observed results either through variations in machine calibration and performance, soil and weather conditions during operation, interactions between forward speed and the seed-metering mechanism, accuracy of seed-spacing measurements, or operational and equipment handling conditions. Thus, although the SF1 signal at 5 km h⁻¹ exhibited markedly different performance compared to other treatment combinations, this outcome may reflect the complex interplay among the multiple factors affecting mechanized seeding.
These findings showed that despite the associated costs, investing in high-quality correction signals such as SF2 can be highly beneficial for operational efficiency and agricultural productivity. This advantage is particularly evident in the parallelism results (Figure 9), where the SF2 signal showed superior operational quality, ensuring better pass-to-pass overlap compared to SF1. Lipiński et al. (2016) analyzed both types of correction signals during soil preparation operations and found no significant differences between them. However, since each agricultural operation demands a specific level of precision, the choice of GNSS correction signal should be tailored according to the particular needs and characteristics of the operation (Santos et al., 2018).
Like the present study, Esau et al. (2021) evaluated a harvesting operation using both subscription-based and free-to-use GNSS signals from the same manufacturer. They observed confidence intervals of (-248.8 mm, 279.0 mm) for SF1 and (-204.6 mm, 226.2 mm) for SF3, indicating that the practical accuracy of GNSS signals can be affected by external factors such as atmospheric conditions, satellite availability, and environmental interferences. However, according to the manufacturer's specifications, the SF1 signal recorded a 95% confidence interval for pass-to-pass discrepancy between -150 mm and 150 mm, whereas the SF3 signal reduced this discrepancy significantly to -30 mm and 30 mm (John Deere, 2020). Therefore, for operations requiring high accuracy in longitudinal seed spacing and row parallelism, the SF2 signal may offer greater benefits. Conversely, in scenarios where minor variations are acceptable without significantly affecting productivity, the SF1 signal can serve as an economically viable alternative.
Thus, future studies could investigate the economic implications of using subscription-based versus free-to-use GNSS signals, for performing detailed cost-benefit analyses across different agricultural contexts. Additionally, studies incorporating a broader array of environmental and operational variables could offer a more comprehensive understanding of the factors influencing correction signal effectiveness. This deeper insight would help optimize seeding practices and maximize agricultural productivity under varying operational conditions.
Conclusion
The use of Global Navigation Satellite Systems (GNSS) proved efficient for evaluating corn seeding quality. It is recommended that the SF2 correction signal should be used at speeds of 6 and 8 km h⁻¹, as it ensures improved row parallelism and a standard seed distribution.
Data availability
The dataset used and analyzed in this study is not publicly available due to internal project restrictions but can be provided by the authors upon reasonable request.
Acknowledgements
Thanks to the Research and Scientific Development Foundation of Maranhão (FAPEMA) for financial support, code Universal 1110/19; Agricultural Machinery and Mechanization Laboratory of the State University of São Paulo for methodological support, and to the Soybean Farmers Association of Maranhão (APROSOJA Maranhão) for operational help.
References
-
Alonço, A. S., Silveira, H. A. T., Cardinal, K. M. & Rist, G. P.. (2015). Distribuição longitudinal de sementes de algodão e girassol com diferentes velocidades e inclinações em dosadores pneumáticos. Scientia Agraria, 16(2), 63-70. https://doi.org/10.5380/rsa.v16i2.41050
» https://doi.org/https://doi.org/10.5380/rsa.v16i2.41050 -
Aranha, T. S., Mollo Neto, M., Rodrigueiro, M. M. S., Morais, F. J. O. & Santos, P. S. B.. (2021). Instrumentação aplicada em máquinas agrícolas: revisão sistemática da literatura. Research, Society and Development, 10(17), 1-13. https://doi.org/10.33448/rsd-v10i17.24247
» https://doi.org/https://doi.org/10.33448/rsd-v10i17.24247 -
Arcoverde, S. N. S., Souza, C. M. A., Cortez, J. W., Guazina, R. A. & Maciak, P. A. G.. (2016). Qualidade do processo de semeadura da cultura do milho de segunda safra. Revista Engenharia na Agricultura, 24(5), 383-392. https://doi.org/10.13083/reveng.v24i5.709
» https://doi.org/https://doi.org/10.13083/reveng.v24i5.709 -
Ariza-Sentís, M., Vélez, S., Martínez-Penã, R., Baja, H. & Valente, J.. (2024). Object detection and tracking in precision farming: A systematic review. Computers and Electronics in Agriculture, 219, 1-19. https://doi.org/10.1016/j.compag.2024.108757
» https://doi.org/https://doi.org/10.1016/j.compag.2024.108757 -
Barbosa, J. J., Pereira, T. M., & Oliveira, F. L. P.. (2018). Uma proposta para identificação de outliers multivariados. Ciência e Natura, 40(40), 1-8. https://doi.org/10.5902/2179460X29535
» https://doi.org/https://doi.org/10.5902/2179460X29535 -
Barbosa Júnior, M. R., Moreira, B. R. A., Carreira, V. S., Brito Filho, A. L., Trentin, C., Souza, F. L. P., Tedesco, D., Setiyono, T., Flores, J. P., Ampatzidis, Y., Silva, R. P. & Shiratsuchi, L. S.. (2024). Precision agriculture in the United States: A comprehensive meta-review inspiring further research, innovation, and adoption. Computers and Electronics in Agriculture, 221, 108993. https://doi.org/10.1016/j.compag.2024.108993
» https://doi.org/https://doi.org/10.1016/j.compag.2024.108993 -
Bortoli, L. F., Arismendi, G. A., Ferreira, M. M. & Martin, T. N.. (2021). Planting speed can affect distribution and yield of soybean. Australian Journal of Crop Science, 15(1), 16-22. https://doi.org/10.21475/ajcs.21.15.01.2238
» https://doi.org/https://doi.org/10.21475/ajcs.21.15.01.2238 -
Carpes, D. P., Alonço, A. S., Rossato, F. P., Veit, A. A., Souza, L. B. & Francetto, T. R.. (2017). Effect of different conductor tubes on the longitudinal distribution of corn seeds. Revista Brasileira de Engenharia Agrícola e Ambiental, 21(9), 657-662. https://doi.org/10.1590/1807-1929/agriambi.v21n9p657-662
» https://doi.org/https://doi.org/10.1590/1807-1929/agriambi.v21n9p657-662 -
Cintra, P. H. M., Compagnon, A. M., Arriel, F. H., Ventura, G. S., Santos, M. L. & Pimenta Neto , A. M. (2020). Variabilidade espacial e qualidade na semeadura de soja. Brazilian Applied Science Review, 4(3), 1206-1221. https://doi.org/10.34115/basrv4n3-037
» https://doi.org/https://doi.org/10.34115/basrv4n3-037 -
Companhia Nacional de Abastecimento. (2024). Boletim da safra de grãos: 11° levantamento - Safra 2023/2024. Conab. https://www.conab.gov.br/info-agro/safras/graos/boletim-da-safra-de-graos
» https://www.conab.gov.br/info-agro/safras/graos/boletim-da-safra-de-graos -
Contini, E., Mota, M. M., Marra, R., Borghi, E., Miranda, R. A., Silva, A. F., Silva, D. D., Machado, J. R. A., Cota, L. V., Costa, R. V., & Mendes, S. M. (2019). Milho: caracterização e desafios técnicos. Embrapa Milho e Sorgo. https://ainfo.cnptia.embrapa.br/digital/bitstream/item/195075/1/Milho-caracterizacao.pdf
» https://ainfo.cnptia.embrapa.br/digital/bitstream/item/195075/1/Milho-caracterizacao.pdf -
Dantas, J. S., Marques Júnior, J., Martins Filho, M. V., Resende, J. M. A., Camargo, L. A. & Barbosa, R. S.. (2014). Gênese de solos coesos do Leste Maranhense: relação solo-paisagem. Revista Brasileira de Ciência do Solo, 38(4), 1039-1050. https://doi.org/10.1590/S0100-06832014000400001
» https://doi.org/https://doi.org/10.1590/S0100-06832014000400001 -
Esau, T. J., MacEachern, C. B., Farooque, A. A. & Zaman, Q. U.. (2021). Evaluation of autosteer in rough terrain at low ground speed for commercial wild blueberry harvesting. Agronomy, 11(2), 384. https://doi.org/10.3390/agronomy11020384
» https://doi.org/https://doi.org/10.3390/agronomy11020384 -
FAO & WHO. (2023). Food safety aspects of cell-based food. https://doi.org/10.4060/cc4855en
» https://doi.org/10.4060/cc4855en -
Ferreira, L. L., Araújo, G. S., Carvalho, I. R., Santos, G. A., Fernandes, M. S., Carnevale, A. B., Curvêlo, C. R. S. & Pereira, A. I. A.. (2019). Cause and effect estimates on corn yield as a function of tractor planting speed. Journal of Experimental Agriculture International, 41(5), 1-7. https://doi.org/10.9734/jeai/2019/v41i530417
» https://doi.org/https://doi.org/10.9734/jeai/2019/v41i530417 -
Gonçalves Jr., A. C., Conradi Junior, E., Schwantes, D., Braccini, A. L., Pinheiro, A. & Conradi, G. (2024). Fate of atrazine in soybean (Glycine max L. ) and corn (Zea mays L.) succession in Brazilian subtropical conditions. Soil and Tillage Research, 237, 105958. https://doi.org/10.1016/j.still.2023.105958
» https://doi.org/https://doi.org/10.1016/j.still.2023.105958 -
Inoue, K., Kaiz, Y., Igarashi, S. & Imou, K.. (2019). The development of autonomous navigation and obstacle avoidance for a robotic mower using machine vision technique. IFAC-Agricontrol, 52(30), 173-177. https://doi.org/10.1016/j.ifacol.2019.12.517
» https://doi.org/https://doi.org/10.1016/j.ifacol.2019.12.517 -
IUSS Working Group WRB-FAO (2015). World Soil Resources Reports. World Reference Base for Soil Resources2014, update 2015. International soil classification system for naming soils and creating legends for soilmaps. http://www.fao.org/3/i3794en/I3794en.pdf
» http://www.fao.org/3/i3794en/I3794en.pdf - John Deere (2020). Selecionando o Sinal de Correção Correção. John Deere.
-
Limede, A. C., Oliveira, C. E. S., Zoz, A., Zuffo, A. M., Steiner, F. & Zoz, T.. (2018). Effects of seed size and planting depth in the emergence and morphophysiological development of soybean cultivated in sandy texture soil. Austalian Journal of Crop Science, 12(1), 93-98. https://doi.org/10.21475/ajcs.18.12.01.pne765
» https://doi.org/https://doi.org/10.21475/ajcs.18.12.01.pne765 -
Lipiński, A. J., Markowski, P., Lipiński, S. & Pyra, P.. (2016). Precision of tractor operations with soil cultivation implements using manual and automatic steering modes. Biosystems Engineering, 145, 22-28. https://doi.org/10.1016/j.biosystemseng.2016.02.008
» https://doi.org/https://doi.org/10.1016/j.biosystemseng.2016.02.008 - Molin, J. P. & Carreira, P. T.. (2006). Metodologia para ensaios cinemáticos de receptores de GNSS utilizando um GPS RTK como referência. Revista Brasileira de Agroinformática, 8, 53-62.
- Montgomery, D. C. (2016). Introdução ao controle estatístico da qualidade (7. ed.). LTC.
-
Oliveira, T. C. A. & Molin, J. P.. (2014). Uso de piloto automático na implantação de pomares de citros. Engenharia Agrícola, 31(2), 334-342. https://doi.org/10.1590/S0100-69162011000200013
» https://doi.org/https://doi.org/10.1590/S0100-69162011000200013 -
Petrović, B., Bumbálek, R., Zoubek, T., Kuneš, R., Smutný, L. & Bartoš, P.. (2024). Application of precision agriculture technologies in Central Europe-review. Journal of Agriculture and Food Research, 15, 1-10. https://doi.org/10.1016/j.jafr.2024.101048
» https://doi.org/https://doi.org/10.1016/j.jafr.2024.101048 -
Rosa Junior, L. R., Mauad, M., Silva, P. V., Gonçalves, A. A., Orlando, R. C., Medeiros, E. S. & Schedenffeldt, B. F.. (2022). Avaliação horizontal da distribuição de sementes de milho em função de mecanismos dosadores e velocidade operacional. Revista de Ciências Agroveterinárias, 21(4), 524-530. https://doi.org/10.5965/223811712142022524
» https://doi.org/https://doi.org/10.5965/223811712142022524 -
Santos, A. F., Silva, R. P., Tavares, T. O., Ormond, A. T. S., Rosalen, D. L. & Assis, L. C.. (2017). Parallelism error in peanut planting operation with auto-steer guidance. Revista Brasileira de Engenharia Agrícola e Ambiental, 21(10), 731-736. https://doi.org/10.1590/1807-1929/agriambi.v21n10p731-736
» https://doi.org/https://doi.org/10.1590/1807-1929/agriambi.v21n10p731-736 -
Santos, C. H. F., Tejo, D. P. & Arruda, K. M. A.. (2019). Influência da velocidade de semeadura no estabelecimento e produtividade do milho. Revista Científica Rural, 21(3), 155-171. https://doi.org/10.30945/rcr-v21i3.3060
» https://doi.org/https://doi.org/10.30945/rcr-v21i3.3060 - Santos, H. G., Jacomine, P. K. T., Anjos, L. H. C., Oliveira, V. A., Lumbreras, J. F., Coelho, M. R., Almeida, J. A., Araujo Filho, J. C., Oliveira, J. B. & Cunha, T. J. F. (2018). Sistema Brasileiro de Classificação de Solos (5. ed.). Embrapa Solos.
-
Souza, C. M. A., Rafull, L. Z. L., Arcoverde, S. N. S., Bottega, E. L. & Orlando, R. C.. (2019). Desempenho de semeadora-adubadora de milho de segunda safra em semeadura direta. Revista Agrarian, 12(45), 346-353. https://doi.org/10.30612/agrarian.v12i45.7965
» https://doi.org/https://doi.org/10.30612/agrarian.v12i45.7965 -
Weirich Neto, P. H., Fornari, A. J., Justino, A. & Garcia, L. C.. (2015). Qualidade na semeadura do milho. Engenharia Agrícola, 35(1), 171-179. https://doi.org/10.1590/1809-4430-Eng.Agric.v35n1p171-179/2015
» https://doi.org/https://doi.org/10.1590/1809-4430-Eng.Agric.v35n1p171-179/2015 -
Zerbato, C., Furlani, C. E. A., Oliveira, M. F., Voltarelli, M. A., Tavares, T. O. & Carneiro, F. M.. (2019). Quality of mechanical peanut planting and digging using autopilot. Revista Brasileira de Engenharia Agrícola e Ambiental, 23(8), 630-637. https://doi.org/10.1590/1807-1929/agriambi.v23n8p630-637
» https://doi.org/https://doi.org/10.1590/1807-1929/agriambi.v23n8p630-637
Edited by
-
Associate Editor in charge:
Alessandro Lucca BracciniCarlos Alberto Scapim