 Apigenin: a Promising Therapeutic Agent for Combating Obesity and Metabolic Dysfunction in Obese Rats
HIGHLIGHTS
-
Induction of obesity in rats was done using a high-fat diet (HFD) and tap water containing 25% sucrose for a duration of 16 weeks.
-
Obese control group exhibited significant increases in body weight, body mass index, waist circumference, dyslipidemia.
-
Increase in cardiac injury markers, oxidative stress, altered adipokine levels, and impaired liver and kidney function in obese group were detected.
-
Obese control group exhibited elevated levels of leptin and reduced levels of adiponectin, reflecting an imbalance in adipokine signaling.
-
Apigenin modulated various signaling pathways involved in lipid metabolism, glucose homeostasis, and adipogenesis, as well as exert protective effects against oxidative stress.
Abstract
Obesity is a major public health challenge linked to metabolic dysfunction. This study evaluated the therapeutic potential of apigenin, a natural flavonoid, in ameliorating obesity-induced complications in rats. Male Wistar rats were assigned to four groups: normal control, obese control, and obese treated with apigenin at 25 mg/kg or 50 mg/kg. Anthropometric, biochemical, and histological parameters were assessed. Apigenin treatment improved obesity-related outcomes in a dose-dependent manner. The 50 mg/kg dose demonstrated greater reductions in dyslipidemia, oxidative stress, cardiac injury markers, and organ dysfunction, alongside restoration of adipokine balance. Apigenin exerts protective effects against obesity-associated metabolic disturbances, likely via antioxidant, anti-inflammatory, and metabolic regulatory mechanisms. These findings support its translational potential as a candidate for the management of obesity and related comorbidities.
INTRODUCTION
The pathological condition known as obesity occurs when energy intake exceeds energy expenditure, leading to excessive body fat and a weight greater than 20% of the average body weight [1]. Many genetic, environmental, and behavioral factors work together to generate obesity, which is a multifactorial disease. Obesity is complex and requires greater effort to treat due to the intricate interactions among various genes and additional risk factors, such as environmental and lifestyle factors [2]. Global obesity rates are rising quickly; in the absence of effective management, they are projected to reach 18% for men and over 20% for women by 2025 [3]. A rise in the quantity and size of fat cells (hyperplasia and hypertrophy) results from excessive dietary fat consumption [4–6]. Adipose tissue fails to store excess energy in an obese state, leading to the accumulation of fat in other tissues, such as the liver and skeletal muscle, which are involved in maintaining metabolic homeostasis. Such ectopic fat deposits may also result in reduced insulin sensitivity, altered adipokine production, inflammation, and mitochondrial dysfunction [7,8]. Adiposity is linked to elevated free fatty acid levels, which induce oxidative stress and impair insulin sensitivity by increasing the production of oxygen-free radicals [9].
Furthermore, a network of intricately linked cascades, known as the insulin signaling pathways, plays a crucial role in the development of obesity [10]. However, disruption of insulin signaling can lead to metabolic dysregulation, which in turn causes obesity and associated conditions such as type 2 Diabetes Mellitus (T2DM) [11]. Numerous ailments, including hypertension, type 2 diabetes, sleep apnea syndrome, cardiovascular and cerebrovascular disorders, are linked to obesity. Additionally, it has led to a rise in cancer, nonalcoholic fatty liver disease, and other illnesses that threaten patients’ lives and have a significant negative impact on their health [12]. Thus, preventing and treating obesity is essential to lowering the rising rates of illness and mortality among people.
Flavonoids constitute a category of phytochemicals found in an extensive variety of fruits and vegetables. Apigenin, a flavone, is commonly present in grapefruit, oranges, chamomile, parsley, and onions, among many flavonoids [13]. It has been demonstrated to lessen inflammation and protect against cancer and cardiovascular disease [14]. In a variety of animal models, apigenin’s pharmacological actions, including its hypoglycemic, hypolipidemic, antioxidant, and anti-inflammatory properties, have been reported to prevent multi-organ damage [15–17]. Apigenin also shields diabetic animals’ kidneys from harm [15]. Apigenin has been shown to scavenge ROS, increase GSH levels and antioxidant enzyme activity, and inhibit the generation of inflammatory cytokines in chemically induced nephropathies [18,19]. By decreasing cholesterol absorption, raising ApoB levels, and improving the conversion of LDL-c to bile acids, apigenin mitigated obesity and hyperlipidemia induced by a high-fat diet [20]. Additionally, it has been discovered that apigenin reduces hepatic de novo lipid synthesis by promoting autophagy and increasing mitochondrial FFA oxidation [21]. Furthermore, apigenin has been shown to have anti-obesity and antidiabetic properties. It inhibited mitotic clonal expansion and activated 5′ AMP-activated protein kinase (AMPK) to reduce adipogenesis in 3T3-L1 cells [22]. Additionally, in mice given a high-fat diet (HFD), it enhanced hepatic lipid metabolism, glucose homeostasis, and glucose tolerance [23,24].
Based on the above background, we hypothesize that apigenin exerts dose-dependent protective effects against obesity-induced metabolic dysfunction. Therefore, the objective of this study was to investigate the therapeutic potential of apigenin in ameliorating dyslipidemia, oxidative stress, cardiac injury, adipokine imbalance, and organ damage in a rat model of diet-induced obesity.
MATERIAL AND METHODS
Experimental animals
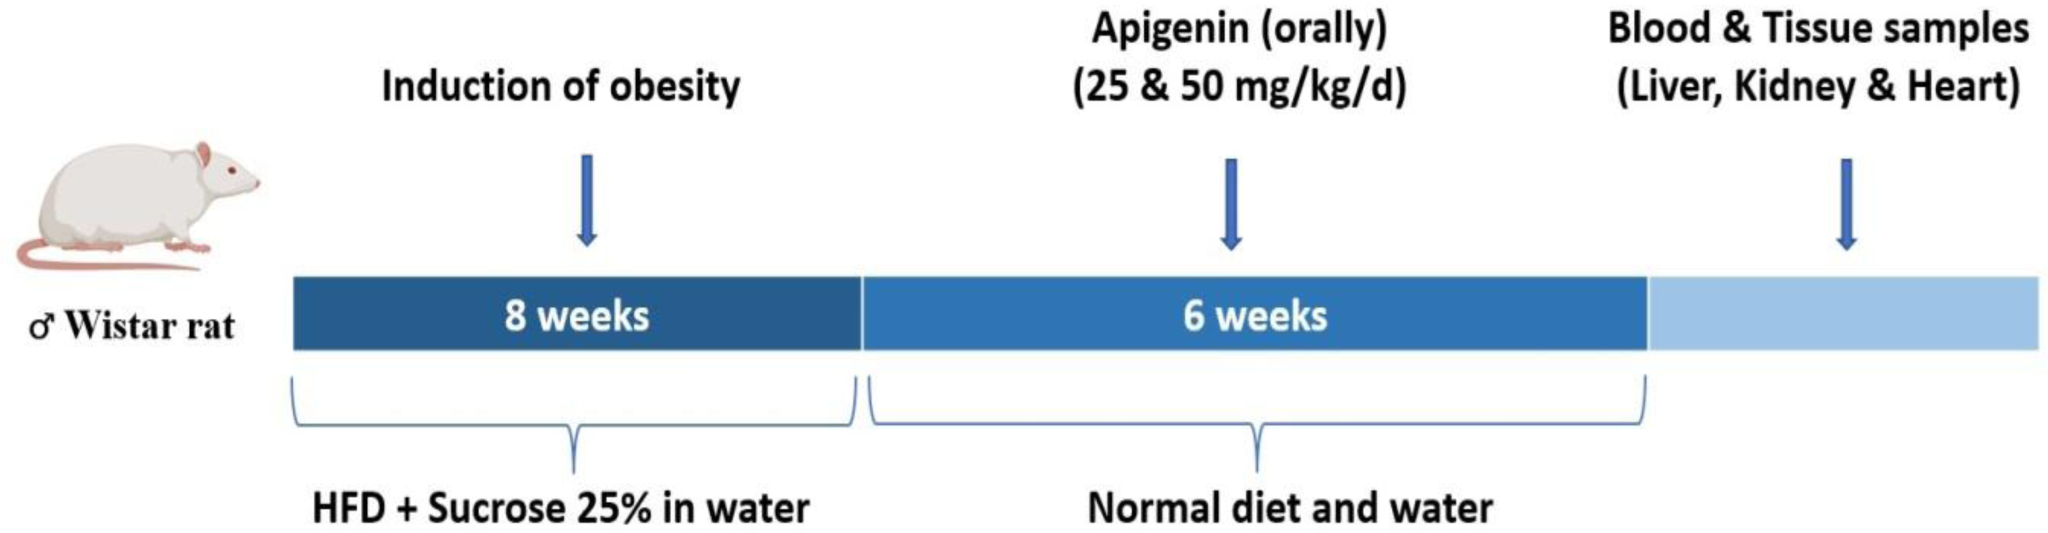
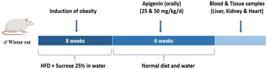
Adult male Wistar rats (32 rats, subdivided into 4 groups), aged 10 weeks and weighing 138-155 g, were maintained in a controlled environment at a stable room temperature (25 °C), with a 12-hour light/dark cycle and unrestricted access to food and water. Animal handling was conducted in accordance with the guidelines and regulations of the Animal Care and Use of the National Research Centre in Egypt (Reg. No. 13060187). The animals were provided with a week of acclimatization before the research. The experimental timeline is illustrated in Figure 1. Additionally, the studies were conducted in accordance with the ARRIVE guidelines and the Animal Welfare Compliance Guide for the Care and Use of Laboratory Animals (8th ed., 2011).
Chemicals
Apigenin (APG) was obtained from Swanson, North Dakota, USA, an oral over-the-counter dietary supplement available on the market. All utilized compounds were of high analytical grade. Biochemical kits for serum analysis were purchased from Gamma Trade Company for Pharmaceuticals and Chemicals in Dokki, Egypt.
Experimental design
Induction of obesity in rats was done according to Bashandy and coauthors [25]. Six rats served as the control group, while the remaining 18 rats were fed an HFD and tap water containing 25% sucrose for 8 weeks to induce obesity; thereafter, the water or apigenin was orally administered daily for the following 6 weeks with HFD. The high-fat diet has 42.3% carbohydrates, 17% protein, 22.5% fat, 3.2% fiber, 5% minerals, and 10% moisture. Normal rats were provided with unrestricted access to normal food pellets.
The rats were divided into four groups, each consisting of 6 rats. Group 1: Normal rats functioned as the control group. Group 2: Obese rats orally received injections of an equivalent volume of the vehicle, distilled water. Group 3: Obese rats orally received a treatment of 25 mg/kg apigenin, suspended in distilled water, administered orally for a duration of 6 weeks, and were designated as the Obese + APG (25 mg/kg) group. Group 4: Obese rats orally received a treatment of 50 mg/kg apigenin [26], suspended in distilled water, administered orally for 6 weeks, and were designated as the Obese + APG (50 mg/kg) group.
Anthropometric measures
The body mass index (BMI) was computed, and waist circumference was measured at baseline and at 2-week intervals until the sixth week.
Collection and preparation of blood samples
Following the treatment period, all groups of rats underwent a 10-hour fast. Blood samples were obtained from the retro-orbital venous plexus, and the separated sera were preserved in Eppendorf tubes at -20˚C for biochemical examination.
Isolation of liver, kidney, and heart tissues
Subsequent to the blood samples, all animals were euthanized via cervical dislocation under light ketamine anesthesia (25 mg/kg), and then liver, kidney, and heart tissues were harvested. Weighed portions of liver, kidney, and heart from 6 rats per group were homogenized in ice-cold saline (0.9% NaCl) to obtain a homogenate. The homogenate was subsequently centrifuged at 3000 rpm for 10 minutes at 5°C utilizing a cooling centrifuge from Laborzentrifugen, Sigma, Germany. The supernatant was utilized for biochemical studies. The tissues of two rats per group were promptly fixed in 10% neutral buffered formalin, processed for light microscopy to obtain 5 μm paraffin sections, and stained with Hematoxylin and Eosin (H&E) to confirm histological characteristics.
Assessment of liver function tests
Alanine aminotransferase (SGPT) (Cat. No.: EZ016LQ/ LIQ-173-M), aspartate aminotransferase (SGOT) (Cat. No.: EZ012LQ/ LIQ-155), and albumin levels (Cat. No.: SU001/ QC014) were colorimetrically determined in serum using kits from the Activos-GPL Company in Barcelona, Spain.
Assessment of kidney function tests
Creatinine (Cat. No.: SU015/ D-376-A), urea (Cat. No.: SU037/ LIQ-871-EM), and uric acid (Cat. No.: SU043/ LIQ-466-C) levels were colorimetrically determined in serum using kits from the Activos-GPL Company in Barcelona, Spain.
Assessment of heart function tests
Troponin-1 (Rat ELISA Kit) estimated in serum by kit from the SinoGeneClon Biotech company in HangZhou, China, creatine kinase (CK-MB) (Cat. No.: EZ007/ LIQ-343-GM) and lactate dehydrogenase (LDH) (Cat. No.: EZ021 LQ/ LIQ-400) were colorimetrically determined in serum using kits from Activos-GPL Company in the Barcelona-Spain, and monocyte chemotactic protein-1 (MCP-1) (Rat ELISA kit) were colorimetrically estimated in serum by kit from the Sunlong Company in the Hangzhou City, Zhejiang Province, China.
Assessment of lipid profile
HDL (Cat. No.: SU014/H-108-M), cholesterol (Cat. No. SU012/LIQ-477), and triglycerides (Cat. No. SU033/ LIQ-482-BM) were colorimetrically determined in serum using kits from the Activos-GPL Company in Barcelona, Spain. LDL (Cat. No.: CF 10000100/ CF 10201B) was colorimetrically determined in serum using kits from Centronic GmbH company in Westenberg, Germany.
Assessment of serum oxidative stress parameters
The index of lipid peroxidation, malondialdehyde (MDA) level, was measured using (Cat. No.: E-BC-K025-S). Glutathione content (GSH) (Cat. No.: E-BC-K030-S) and superoxide dismutase (SOD) (Cat. No.: E-BC-K022-S) levels were measured using colorimetric kits from Elabscience company in Texas, USA.
The adipocyte hormones
An ELISA technique was used to measure serum leptin levels (Cat. No. SL 0441 Ra) from Sunlong Company in Hangzhou City, Zhejiang Province, China. and adiponectin (Cat. No.: SG-20421) ELISA kit procured from the SinoGeneClon Biotech company in Hangzhou, China.
Histopathological evaluations
Formalin-fixed specimens of liver, kidney, and heart from all groups were routinely treated to obtain paraffin blocks, followed by the acquisition of serial sections measuring 4–5 μm, which were stained with Hematoxylin and Eosin (H&E). The slides were examined and photographed using an Olympus CX-41 light microscope and a DP-12 Olympus digital camera (Olympus Optical Co. Ltd, Tokyo, Japan). Histopathological evaluation was performed on all fields of the slide, comprising approximately 6 fields per slide from two animals in each group. The histological lesions were characterized according to the percentage of affected hepatocytes and their zonal distribution, wherein macrovesicular steatosis is quantified as follows: 0 = absent; 1 (mild) < one-third; 2 (moderate) = one to two-thirds; 3 (severe) > two-thirds, and the occurrence of microvesicular steatosis was documented. Hepatocellular ballooning was assessed for its zonal distribution and severity (mild or prominent) based on the number of hepatocytes exhibiting this anomaly [27].
Statistical analysis
The primary outcome was the change in body weight [28]. The sample size was used according to a previous study in our lab. The sample size was calculated using G-Power software version 3.1.9.4 (Fraz faul, Germany). The study has 4 independent groups. Prior data indicated a change in body weight of an approximate effect size of 8.5. We estimated that six rats should be assigned to each study group to achieve an effect size (f) of 8.5 and a study power of 95% (1- β error probe). This number will be needed to reject the null hypothesis that the effect in the treated group and the control group are equal. A continuity-corrected squared Fisher’s exact test will be used to evaluate this null hypothesis with a probability of type I error (α error = 0.05), power = 95%
The degree of variability of results was expressed as means ±standard error of means (SEM). The data were tested for SD variation using the Brown-Forsythe test and for normality using the Shapiro-Wilk test. Then, all data were evaluated by one-way analysis of variance (ANOVA) followed by Tukey-Kramer multiple comparisons. The level of significance was accepted at p≤0.05.
RESULTS
Effect of apigenin on anthropometric measurements of obese rats
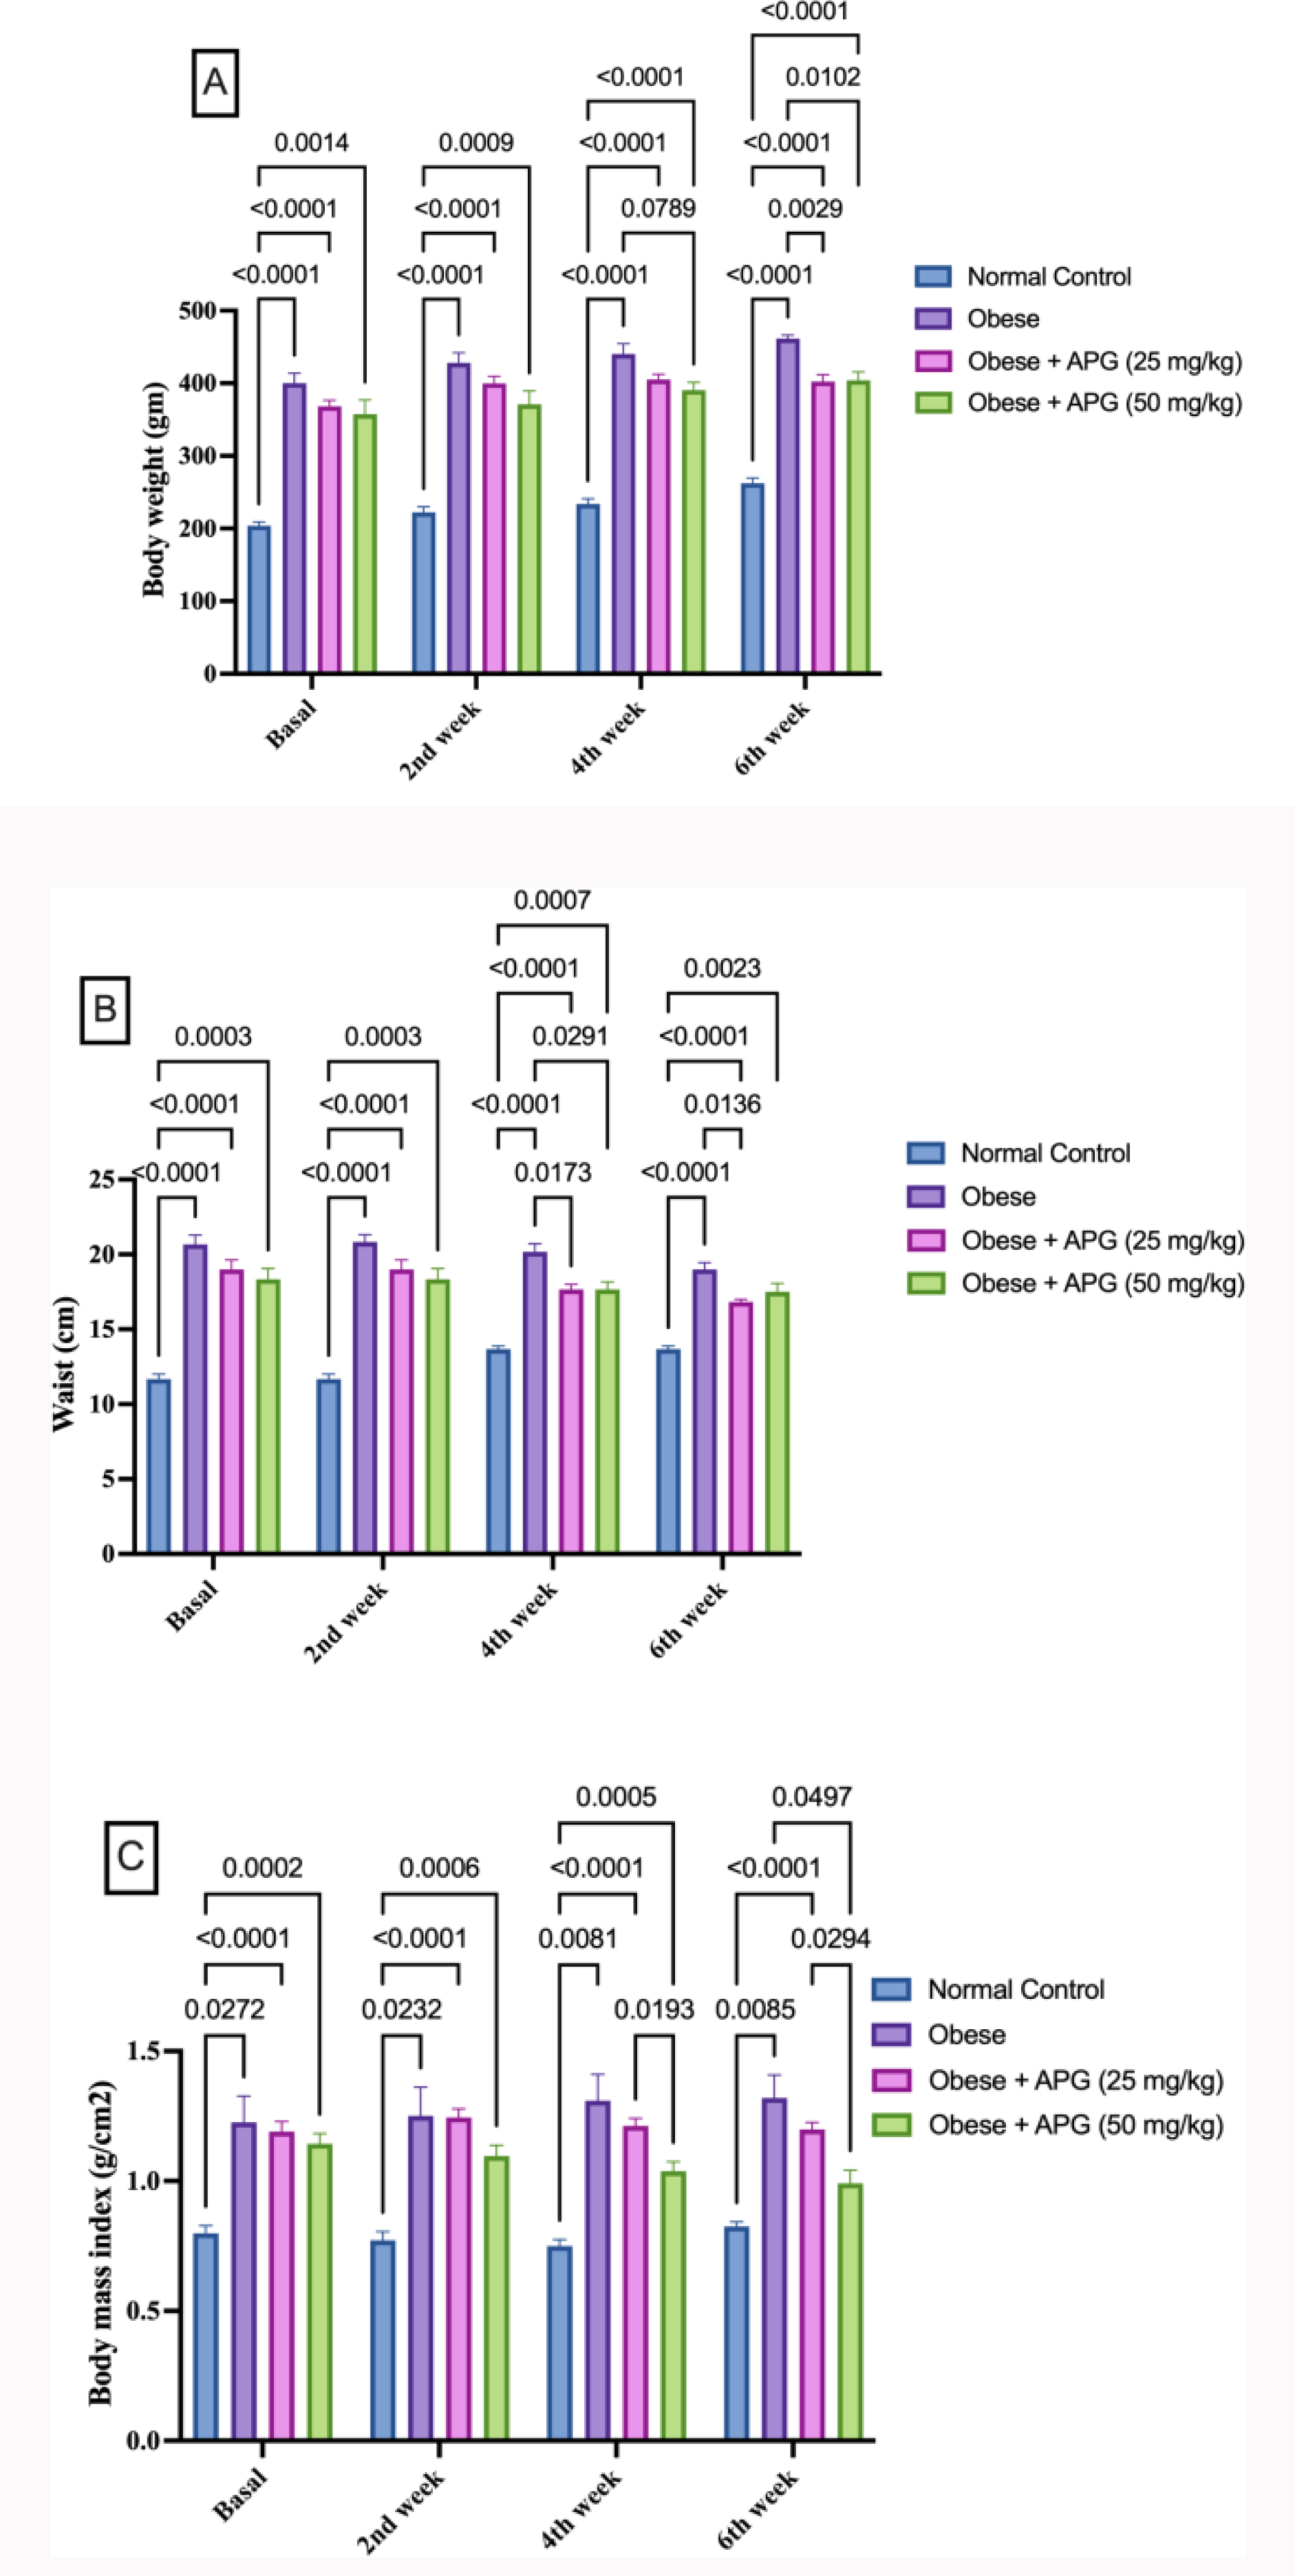
In the basal state, the obese group exhibited a 62.9% increase in body weight compared to the normal control group (421 g vs. 197 g). After 2 weeks of treatment, the obese group showed a 92.6% increase in body weight (458 g vs. 216 g), while the groups treated with 25 mg/kg and 50 mg/kg apigenin displayed a 19.2% (375 g vs. 458 g) and 34.5% (300 g vs 458 g) decrease in body weight, respectively, compared to the untreated obese group. In the 4th week, the obese group maintained a 100% increase in body weight (460 g vs. 230 g). In comparison, the 25 mg/kg and 50 mg/kg apigenin-treated groups exhibited 10.9% (410 g vs. 460 g) and 19.6% (370 g vs. 460 g) decreases, respectively, compared to the untreated obese group. By the 6th week, the obese group showed a 74.1% increase in body weight (from 270 g to 470 g). In contrast, the 25 mg/kg and 50 mg/kg apigenin-treated groups demonstrated 9.4% (425 g vs. 470 g) and 17.0% (390 g vs. 470 g) decreases, respectively, compared to the untreated obese group (Figure 2).
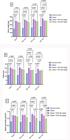
Effect of apigenin on anthropometric measurements of obese rats. (A) Body weight, (B) Waist, and (C) Body mass index. The bars display the mean ± SEM (n=6). The levels of significance are shown on the horizontal bars in the pairwise comparisons.
At the baseline, the obese group showed a 50% increase in waist circumference compared with the normal control group (20 cm vs. 12 cm). This difference persisted throughout the study, with the obese group maintaining a 58.3% larger waist circumference than the control group at the 6th week (19 cm vs 14 cm). However, the obese groups treated with 25 mg/kg and 50 mg/kg apigenin showed a 10.5% (17 cm vs. 19 cm) and 10.5% (17 cm vs. 19 cm) reduction in waist circumference, respectively, compared to the untreated obese group by the 6th week (Figure 2).
At the baseline, the obese group had a 45.1% higher BMI than the normal control group (1.278893 vs 0.8736). This difference remained significant throughout the study, with the obese group consistently exhibiting a 50.6% higher BMI than the control group in the 6th week (1.25 vs. 0.833333). However, the obese groups treated with 25 mg/kg and 50 mg/kg apigenin demonstrated a 26% (0.925 vs. 1.25) and 22% (0.975 vs. 1.25) decrease in BMI, respectively, compared to the untreated obese group by the 6th week (Figure 2).
Effect of apigenin on serum lipid profile of obese rats
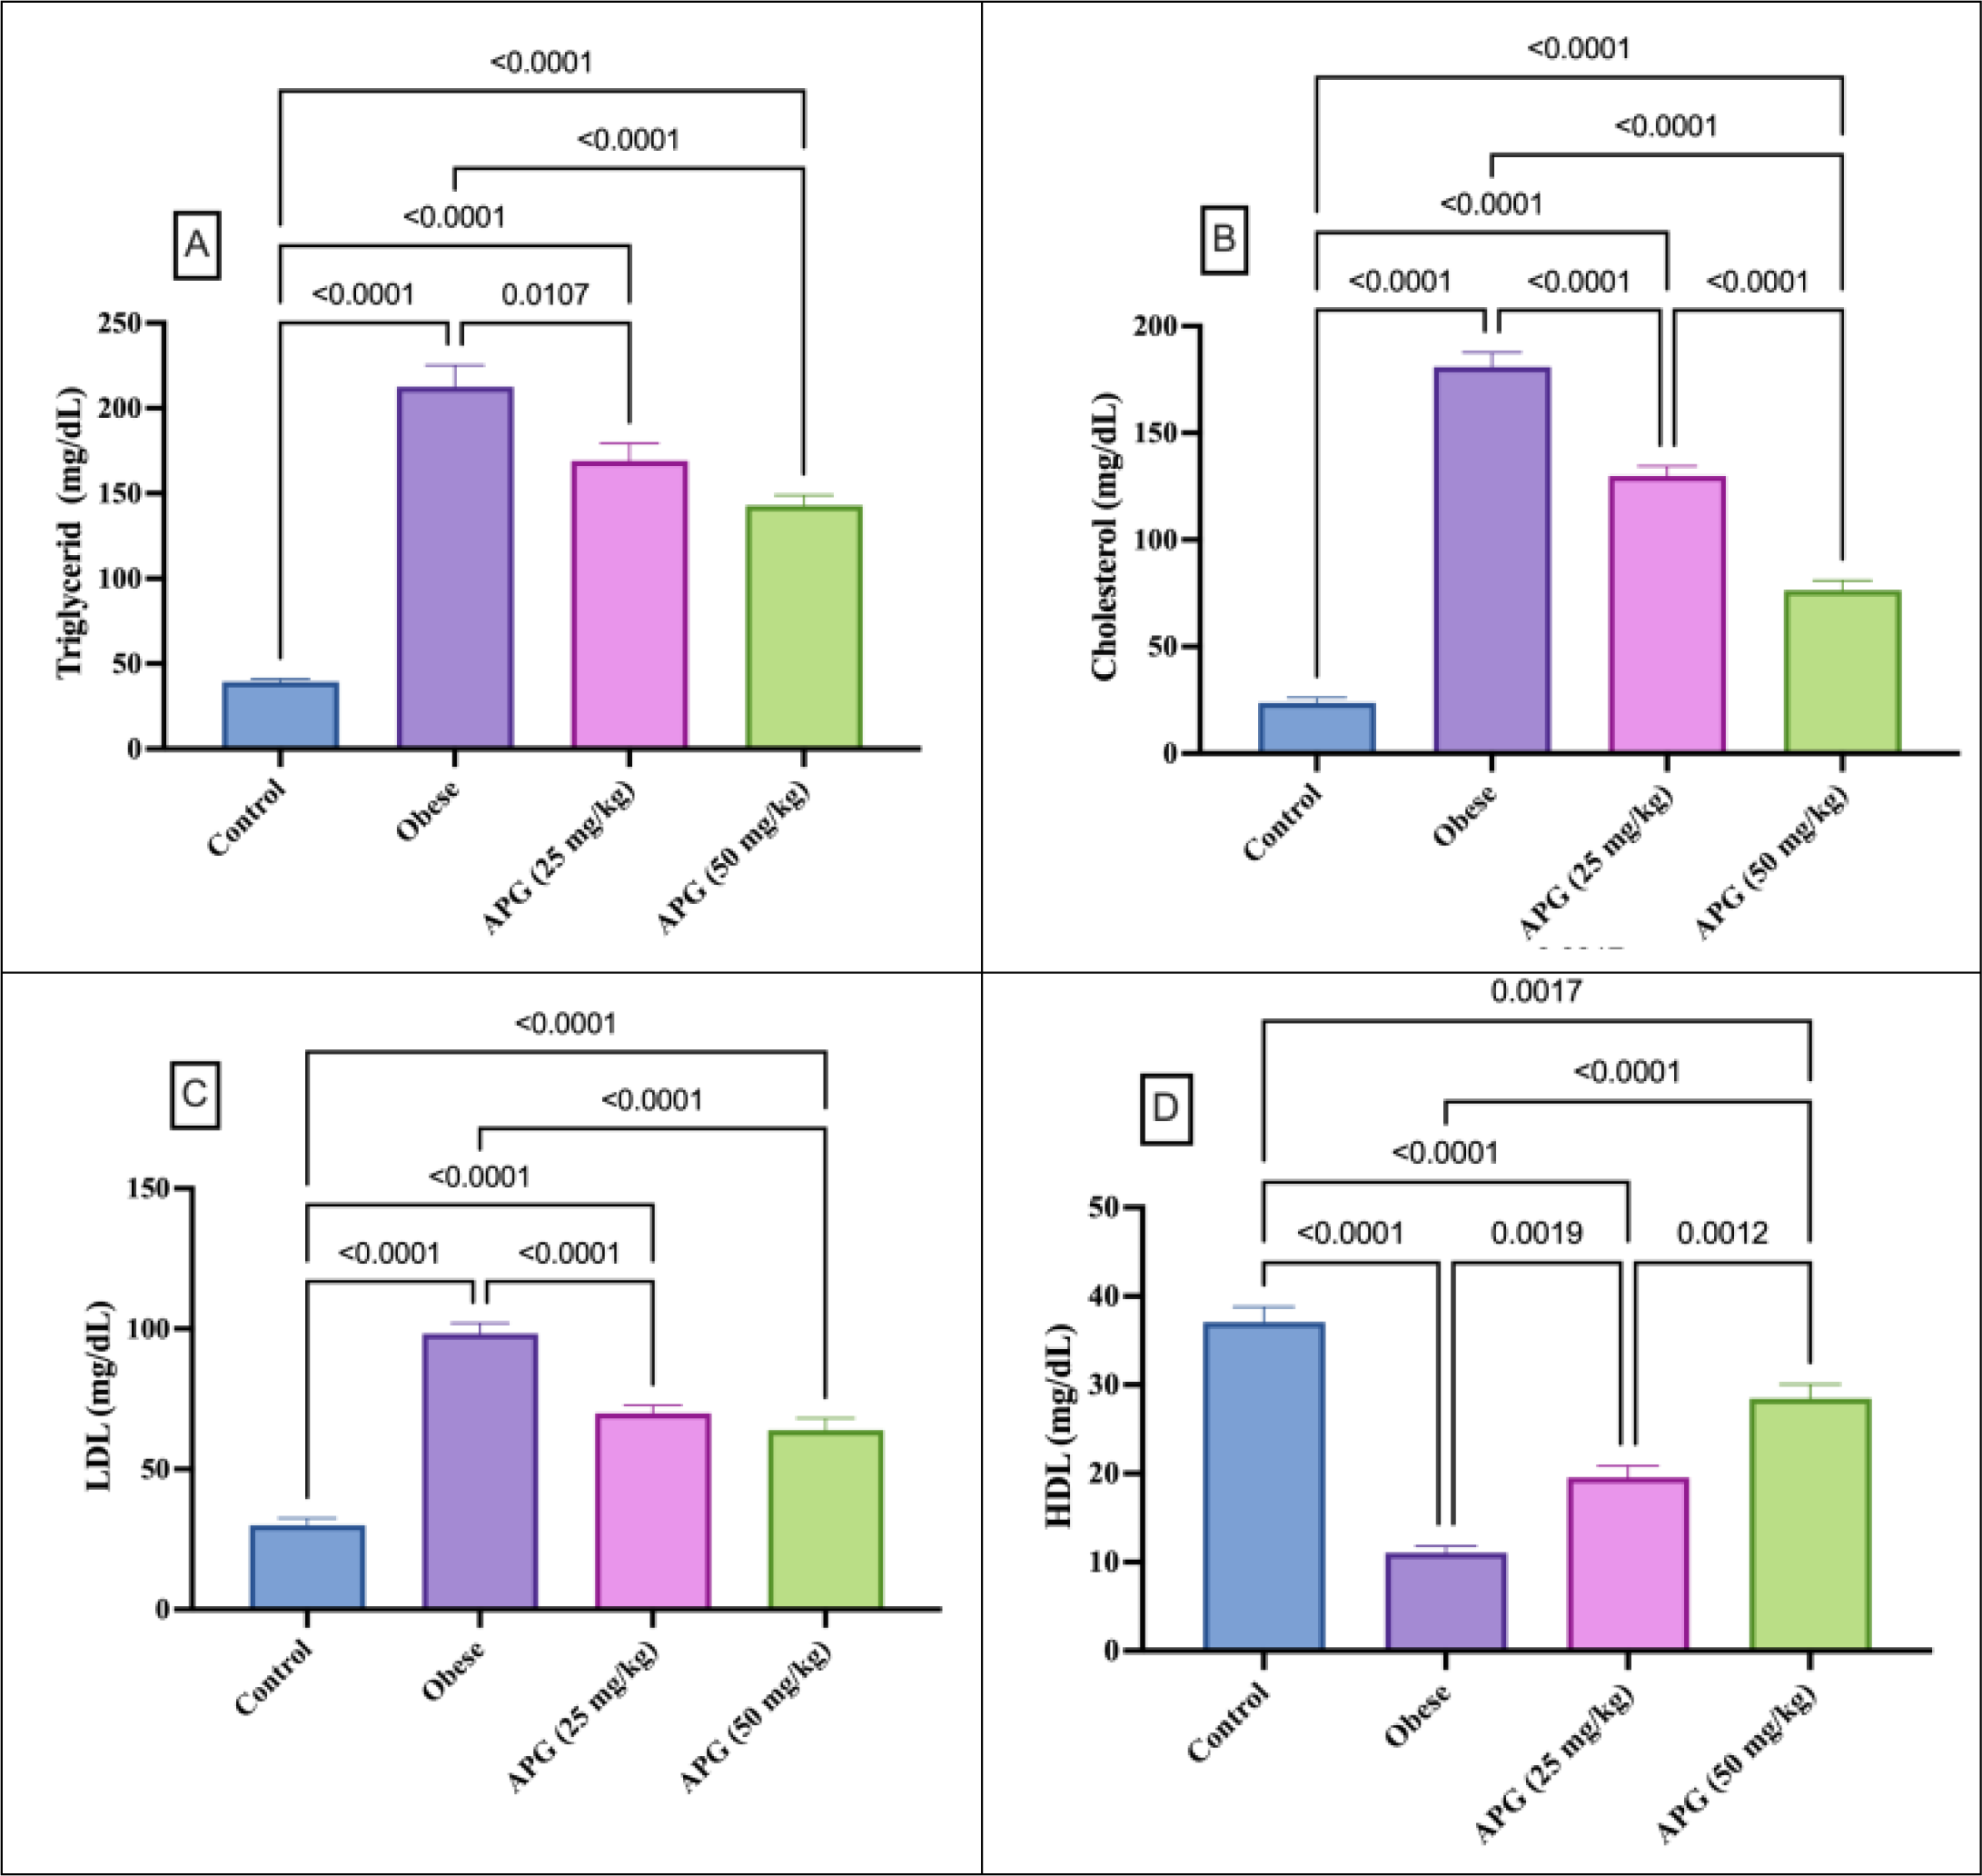
As depicted in Figure 3, The obese group exhibited a significant increase in dyslipidemia compared to the normal control group, with a 439.4% increase in triglyceride levels (212.5±12.63 mg/dL vs. 39.38±1.68 mg/dL), a 663.7% increase in cholesterol levels (181±6.73 mg/dL vs. 23.7±2.47 mg/dL), a 227.3% increase in LDL levels (98.22±3.74 mg/dL vs. 30.02±2.51 mg/dL), and a 70.1% decrease in HDL levels (11.07±0.77 mg/dL vs. 37.07±1.74 mg/dL). Treatment with 25 mg/kg apigenin significantly improved the lipid profile, reducing triglyceride levels by 20.4% (169.2±10.2 mg/dL vs. 212.5±12.63 mg/dL), cholesterol levels by 28.3% (129.8±4.67 mg/dL vs. 181±6.73 mg/dL), LDL levels by 28.8% (69.92±2.79 mg/dL vs. 98.22±3.74 mg/dL), and increasing HDL levels by 76.8% (19.57±1.3 mg/dL vs. 11.07±0.77 mg/dL) compared to the untreated obese group. The 50 mg/kg apigenin treatment exhibited a more pronounced improvement, reducing triglyceride levels by 32.8% (142.8±6.09 mg/dL vs. 212.5±12.63 mg/dL), cholesterol levels by 57.8% (76.33±4.72 mg/dL vs. 181±6.73 mg/dL), LDL levels by 35.0% (63.83±4.31 mg/dL vs. 98.22±3.74 mg/dL), and increasing HDL levels by 157.3% (28.47±1.6 mg/dL vs. 11.07±0.77 mg/dL) compared to the untreated obese group.
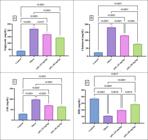
Effect of apigenin on serum lipid profile of obese rats. (A) Triglycerides, (B) cholesterol, (C) LDL, and (D) HDL. The bars display the mean ± SEM (n=6). The levels of significance are shown on the horizontal bars in the pairwise comparisons.
Effect of apigenin on serum antioxidant parameters of obese rats
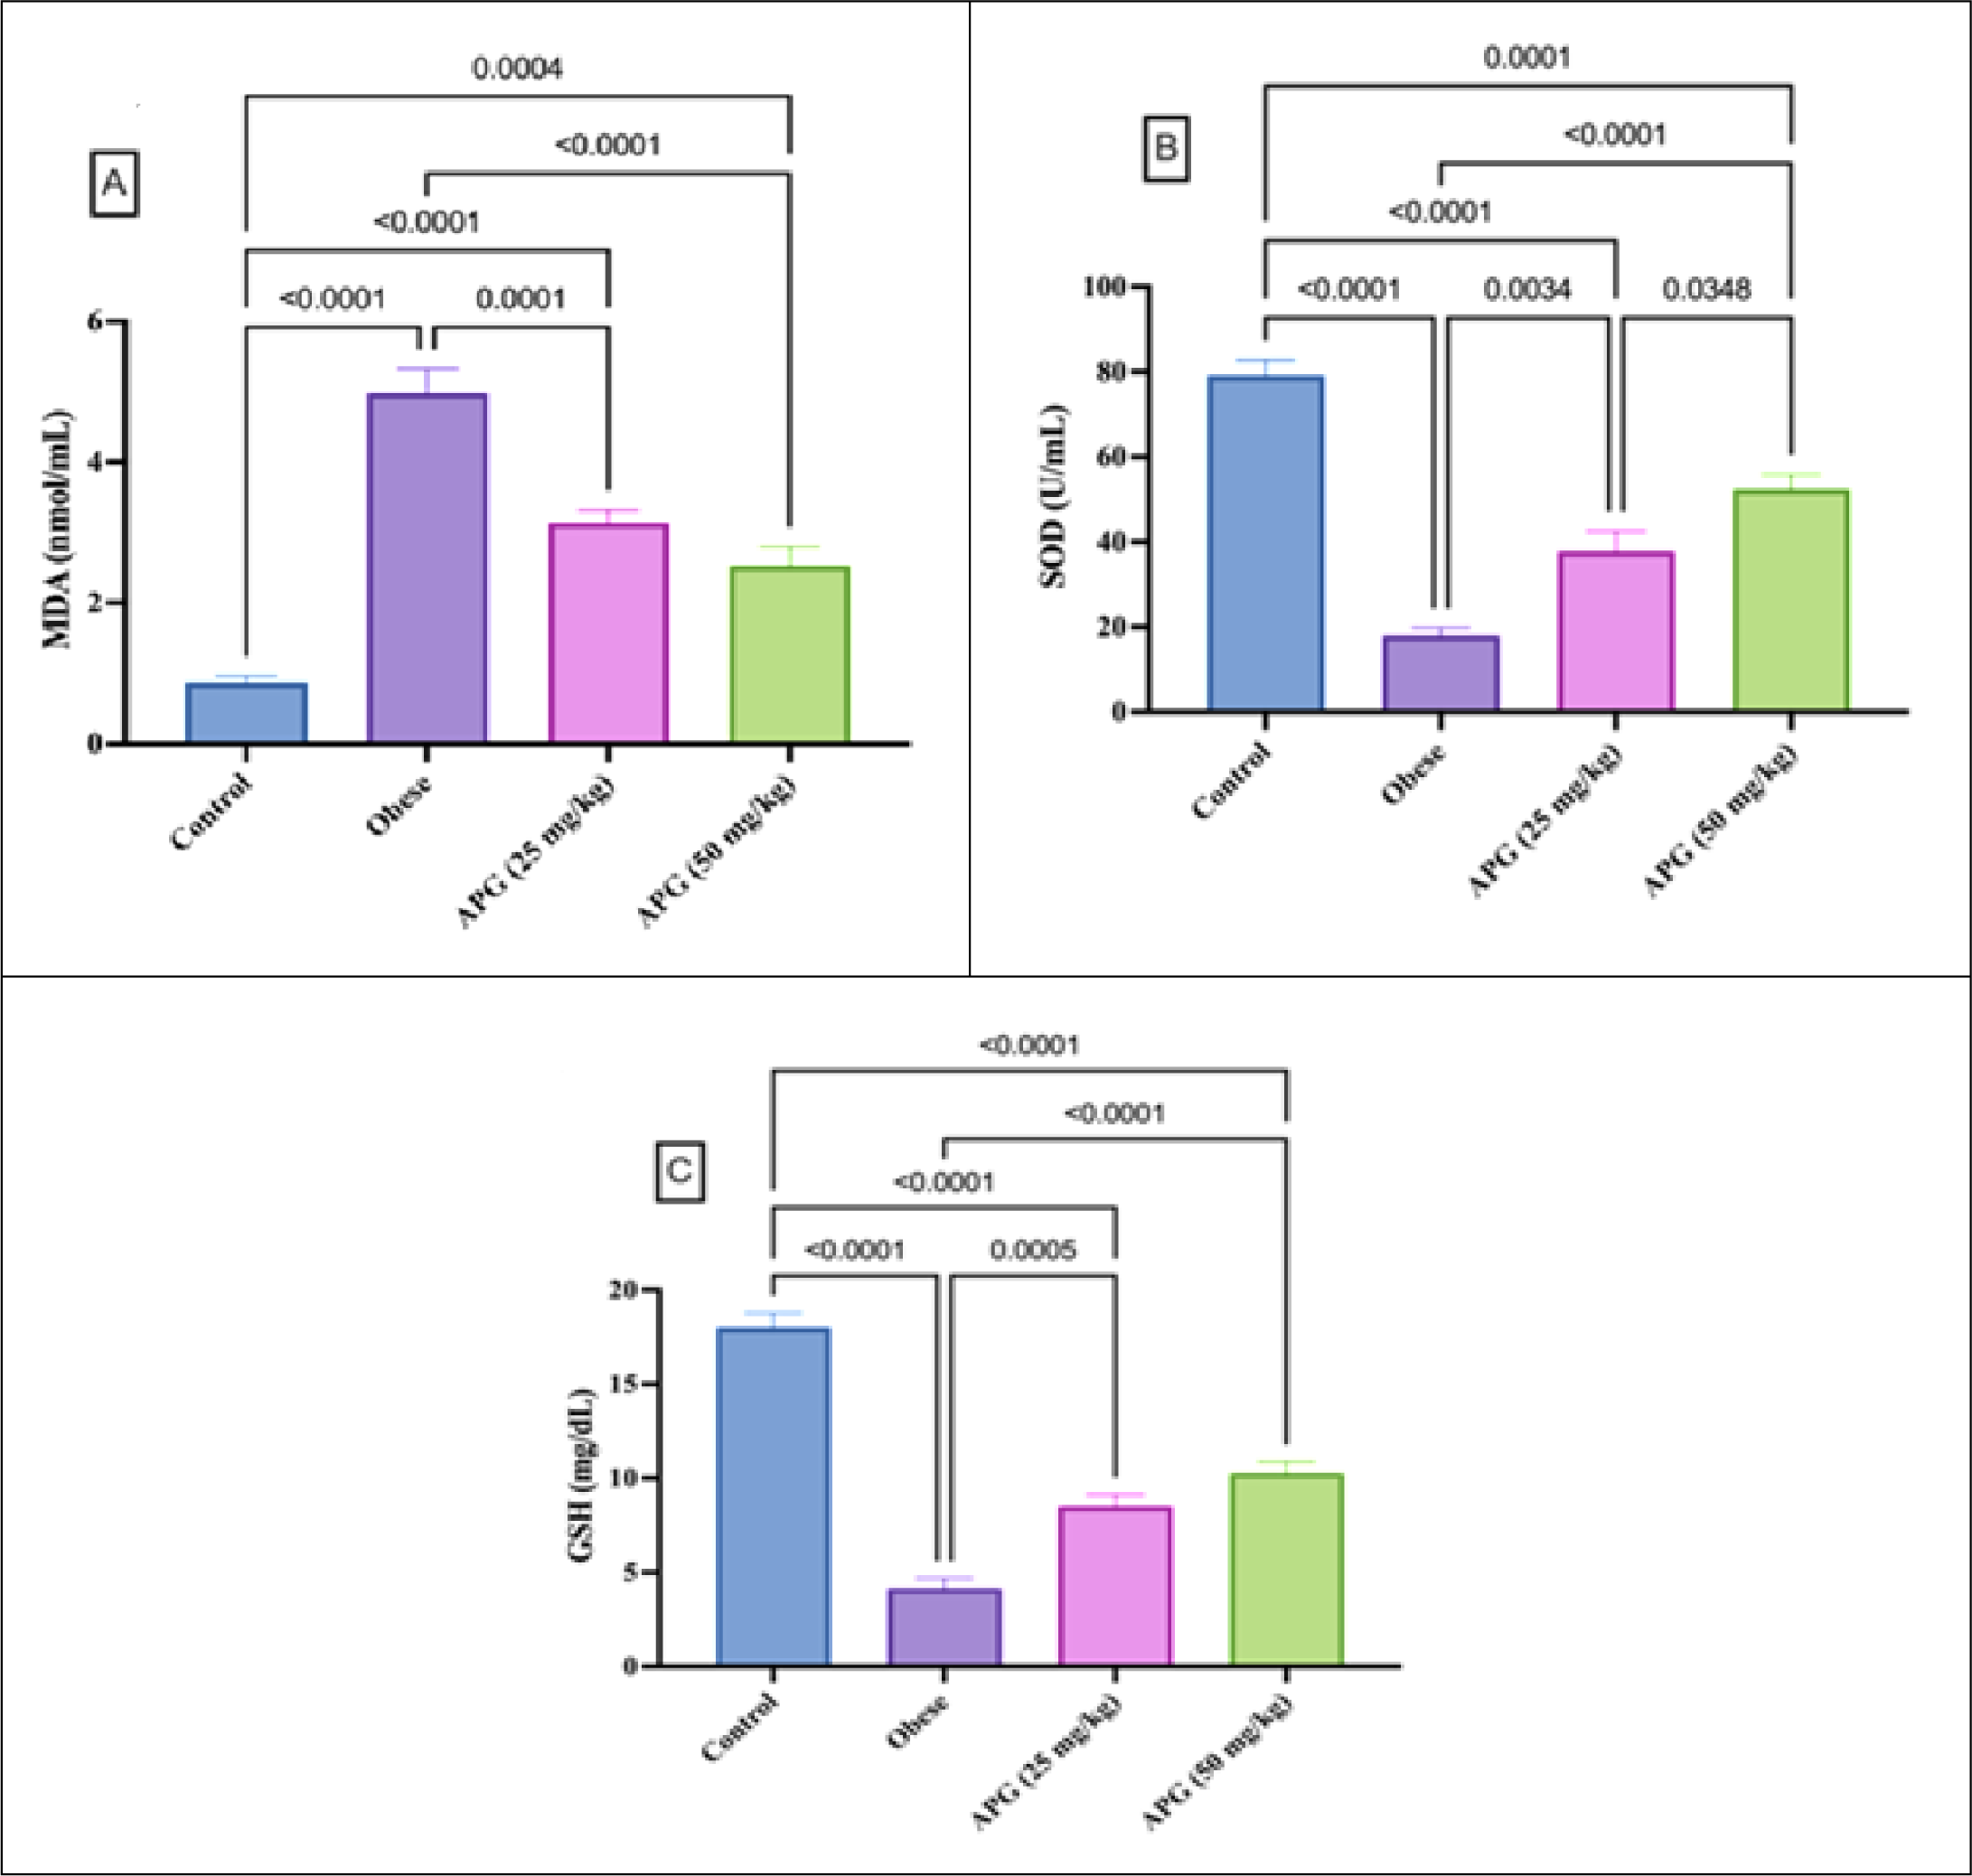
The obese group exhibited increased oxidative stress and depleted antioxidant levels compared to the normal control group, with a 472.4% increase in MDA levels (4.98±0.34 nmol/mL vs. 0.87±0.09 nmol/mL), a 77.3% decrease in SOD levels (18.0±1.77 U/mL vs 79.17±3.61 U/mL), and a 77.0% decrease in GSH levels (4.15±0.53 mg/dL vs 18.02±0.76 mg/dL). Treatment with 25 mg/kg apigenin significantly improved antioxidant parameters, reducing MDA levels by 37.0% (3.14±0.19 nmol/mL vs. 4.98±0.34 nmol/mL), increasing SOD levels by 110.2% (37.83±4.66 U/mL vs. 18±1.77 U/mL), and increasing GSH levels by 105.3% (8.52±0.61 mg/dL vs. 4.15±0.53 mg/dL) compared to the untreated obese group. The 50 mg/kg apigenin treatment exhibited a more pronounced improvement, reducing MDA levels by 49.2% (2.53±0.26 nmol/mL vs. 4.98±0.34 nmol/mL), increasing SOD levels by 191.7% (52.5±3.28 U/mL vs. 18±1.77 U/mL), and increasing GSH levels by 147.5% (10.27±0.61 mg/dL vs. 4.15±0.53 mg/dL) compared to the untreated obese group (Figure 4).
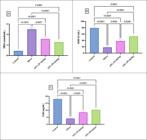
Effect of apigenin on serum antioxidant parameters of obese rats. (A) MDA, (B) SOD, and (C) GSH. The bars display the mean ± SEM (n=6). The levels of significance are shown on the horizontal bars in the pairwise comparisons.
Effect of apigenin on leptin and adiponectin levels in obese rats
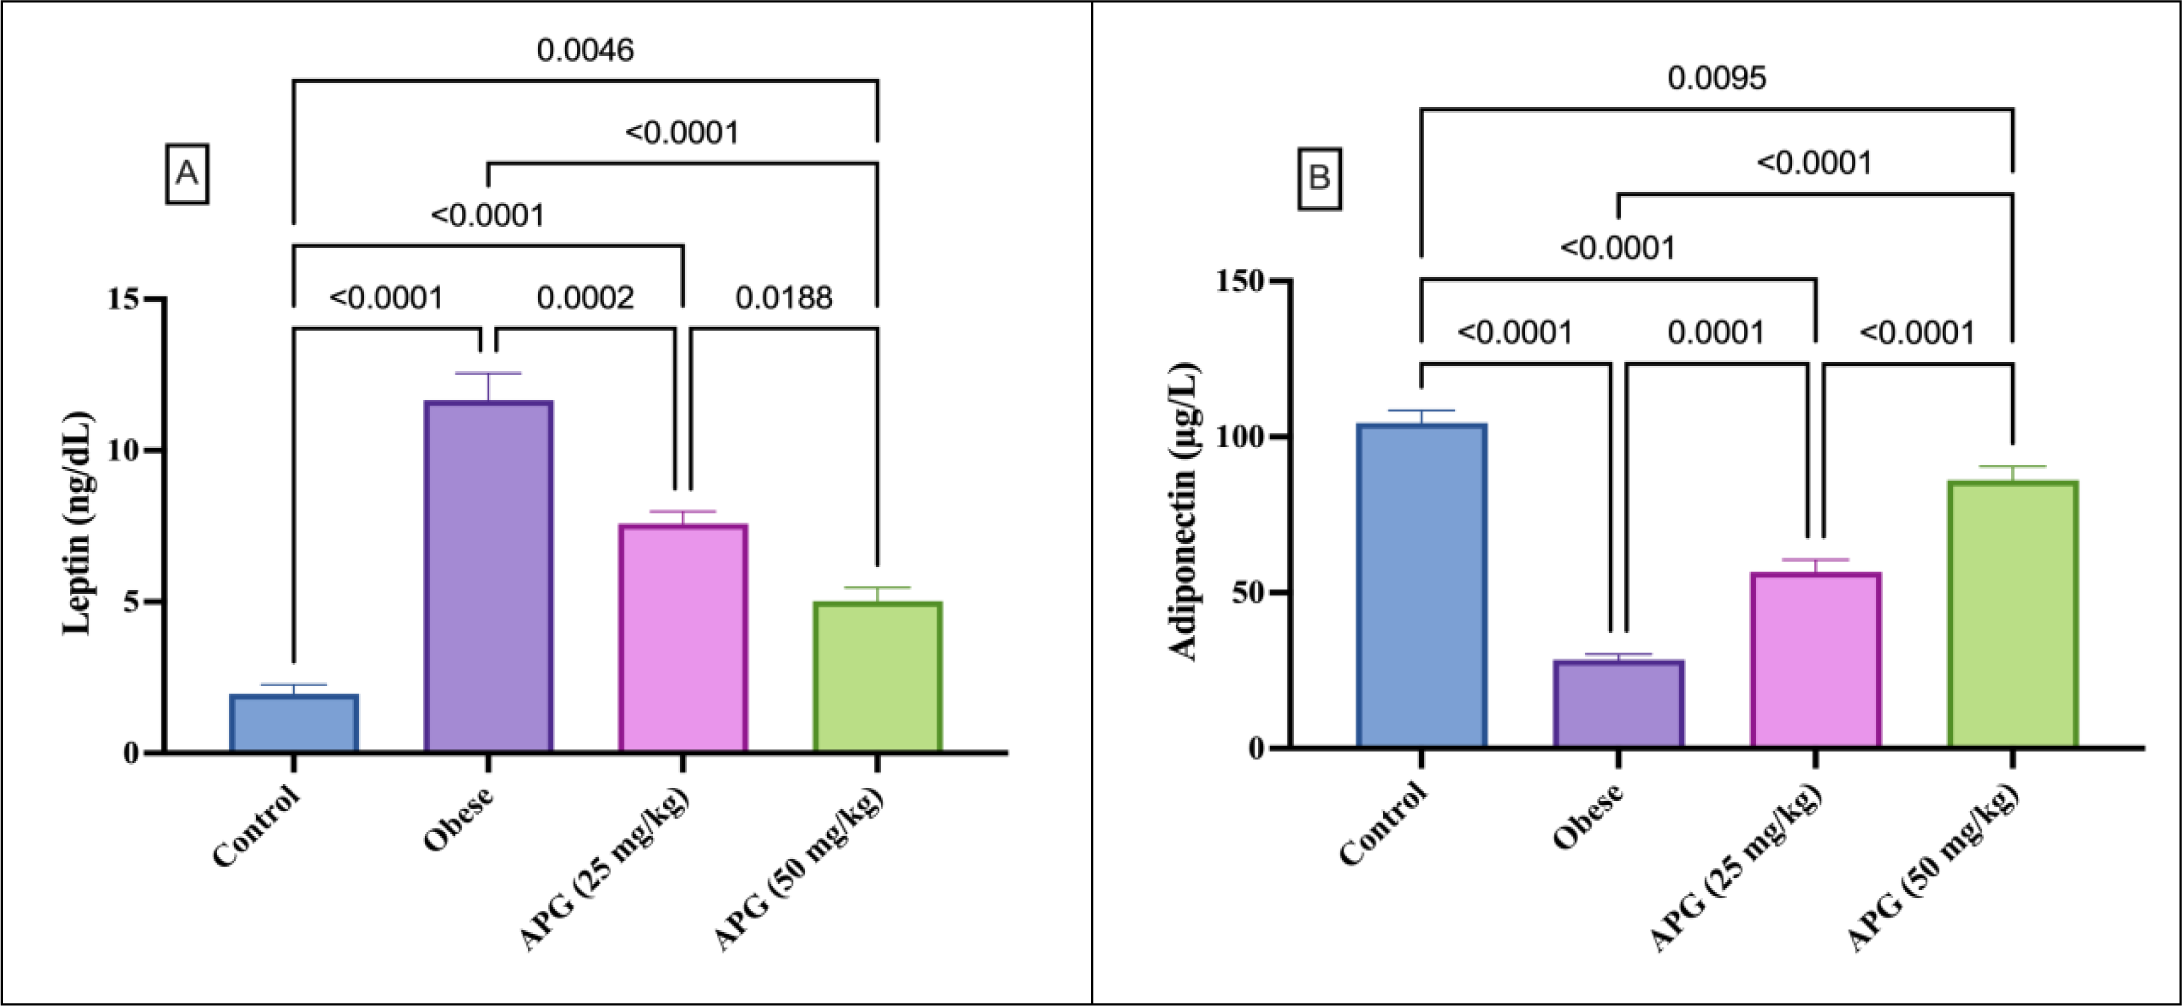
As shown in Figure 5, the obese group exhibited altered adipocyte function compared to the normal control group, with a 495.9% increase in leptin levels (11.67±0.88 ng/mL vs 1.96±0.3 ng/mL) and a 72.8% decrease in adiponectin levels (28.5±1.78 μg/L vs 104.5±3.99 μg/L). Treatment with 25 mg/kg apigenin significantly improved adipocyte function, reducing leptin levels by 35.1% (7.58±0.4 ng/mL vs. 11.67±0.88 ng/mL) and increasing adiponectin levels by 98.9% (56.67±3.86 μg/L vs 28.5±1.78 μg/L) compared to the untreated obese group. The 50 mg/kg apigenin treatment showed a more pronounced improvement, reducing leptin levels by 57.0% (5.02±0.45 ng/mL vs. 11.67±0.88 ng/mL) and increasing adiponectin levels by 202.4% (86.17±4.32 μg/L vs. 28.5±1.78 μg/L) compared with the untreated obese group.
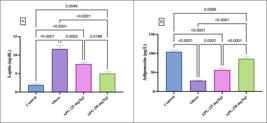
Effect of apigenin on leptin and adiponectin levels in obese rats. The bars display the mean ± SEM (n=6). The levels of significance are shown on the horizontal bars in the pairwise comparisons.
Effect of apigenin on liver function markers in the serum of obese rats
Table 1 presents the levels of serum liver function of obese rats. The obese group exhibited impaired liver function compared to the normal control group, with a 452.4% increase in SGPT levels, a 172.6% increase in SGOT levels, and a 60.8% decrease in albumin levels. Treatment with 25 mg/kg apigenin significantly improved liver function, reducing SGPT levels by 45.2%, SGOT levels by 28.9%, and increasing albumin levels by 17.8% compared to the untreated obese group. The 50 mg/kg apigenin treatment exhibited a more pronounced improvement, reducing SGPT levels by 71.1%, SGOT levels by 51.6%, and increasing albumin levels by 76.4% compared to the untreated obese group.
Effect of apigenin on kidney function markers in the serum of obese rats
The obese group exhibited impaired kidney function compared with the normal control group, with 194.6% increases in creatinine levels, 72.1% in uric acid levels, and 216.2% in urea levels. Treatment with 25 mg/kg apigenin significantly improved kidney function, reducing creatinine levels by 32.1%, uric acid levels by 13.9%, and urea levels by 18.1% compared to the untreated obese group. The 50 mg/kg apigenin treatment exhibited a more pronounced improvement, reducing creatinine levels by 47.2%, uric acid levels by 30.8%, and urea levels by 42.7% compared to the untreated obese group (Table 2).
Effect of apigenin on cardiac function markers in the serum of obese rats
The obese group exhibited impaired cardiac function compared to the normal control group, with a 423.5% increase in LDH levels (496.7±24.31 U/L vs. 94.67±12.09 U/L), a 281.9% increase in troponin-1 levels (40.17±1.68 pg/mL vs 10.5±0.76 pg/mL), a 370.3% increase in CK-MB levels (78.33±5.17 U/L vs 16.67±2.17 U/L), and a 163.1% increase in MCP-1 levels (372.5±14.59 pg/mL vs 141.7±5.58 pg/mL). Treatment with 25 mg/kg apigenin significantly improved cardiac function, reducing LDH levels by 27.7% (358.8±22.26 U/L vs. 496.7±24.31 U/L), troponin-1 levels by 34.8% (26.17±1.97 pg/mL vs. 40.17±1.68 pg/mL), CK-MB levels by 28.7% (55.83±5.49 U/L vs 78.33±5.17 U/L), and MCP-1 levels by 19.4% (300.3±5.92 pg/mL vs. 372.5±14.59 pg/mL) compared to the untreated obese group. The 50 mg/kg apigenin treatment exhibited a more pronounced improvement, reducing LDH levels by 39.1% (302.8±21.19 U/L vs. 496.7±24.31 U/L), troponin-1 levels by 45.2% (22±1.65 pg/mL vs. 40.17±1.68 pg/mL), CK-MB levels by 45.6% (42.67±2.81 U/L vs. 78.33±5.17 U/L), and MCP-1 levels by 32.7% (250.8±15.3 pg/mL vs. 372.5±14.59 pg/mL) compared to the untreated obese group (Table 3).
Histopathological examinations
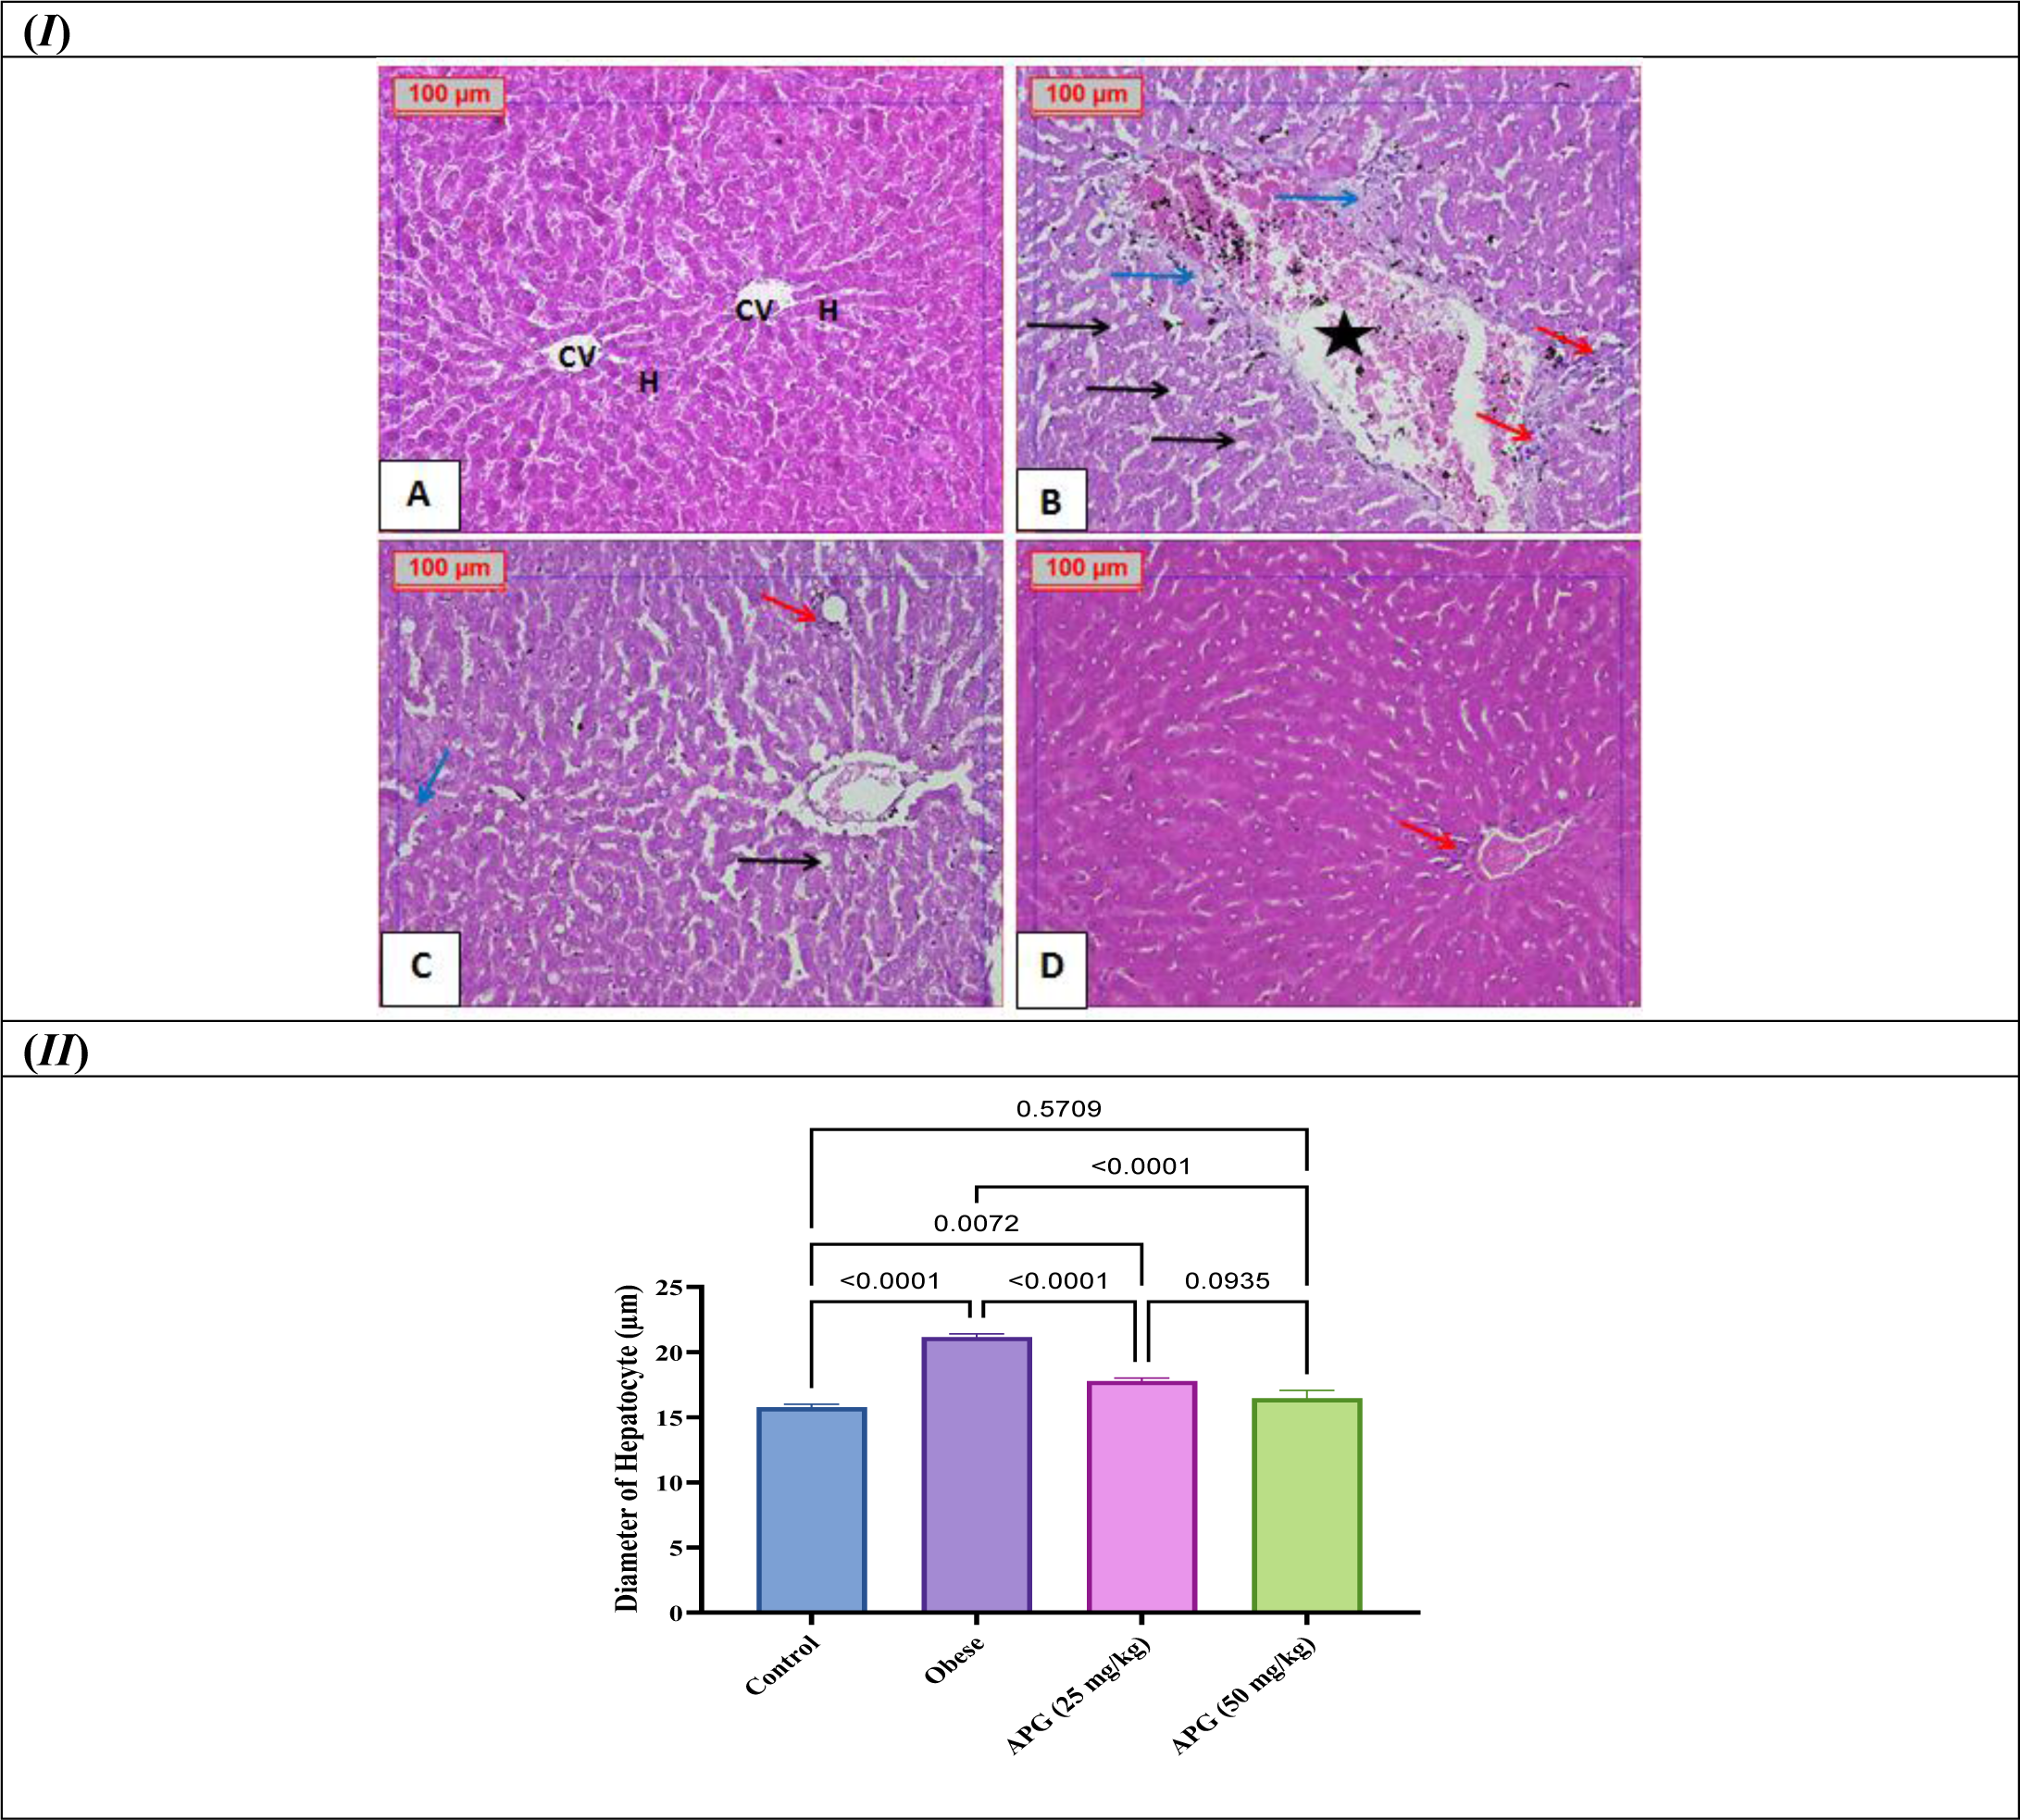
As depicted in Figure 6-I, the liver section of the normal control group revealed normal hepatic architecture. In contrast, the hepatic tissue of the obese group showed a marked, dilated, congested central vein, hepatocytes with steatosis, perivascular fibrosis, and scattered inflammatory cells. APG-treated groups revealed improvement in steatosis with minimal inflammatory cells.
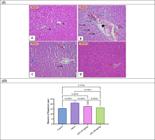
(I): Histopathological examination of liver sections. A: photomicrograph of Normal Control group showing normal structure of the classical hepatic lobule, which is formed of hepatocytes (H) arranged in plates radiating from the central vein (CV) towards periphery B: photomicrograph of hepatic tissue of Obese group showing marked dilated congested central vein (star), hepatocytes with multiple scattered lipid droplets (steatosis) (black arrow), perivascular fibrosis (blue arrow) and scattered inflammatory cells (red arrow). C: photomicrograph of hepatic tissue of Obese + APG (25 mg/kg) group showing moderate improvement with minimal steatosis; most of them are microvesicular (small fat droplet) and macrovesicular (black arrow), dilated congested central vein, mild fibrosis (blue arrow), and minimal inflammatory cells (red arrow). D: photomicrograph of hepatic tissue of the Obese + APG (50 mg/kg) group showed normal hepatic tissue with minimal inflammatory cells around the central vein (red arrow) (H&E, x200). (II): morphometric analysis data of hepatic cells.
Based on the morphometric analysis data (Figure 6-II), there is clear evidence of quantification of hepatic cell hypertrophy. The data show distinct differences in hepatic cell diameters across the experimental groups. The obese group demonstrated significantly larger hepatic cell diameters, ranging from 20.44 to 21.69 μm, representing approximately a 30-35% increase compared to the control group values (15.32-16.68 μm). This quantitative assessment confirms the histopathological observations of cellular hypertrophy.
The treatment with APG showed a dose-dependent effect in normalizing hepatic cell dimensions. At 25 mg/kg, APG reduced the cell diameter to 16.95-18.37 μm, representing an approximate 15% reduction from the obese group, though still slightly elevated compared to controls. The higher dose of APG (50 mg/kg) demonstrated greater effectiveness, bringing cell diameters (14.66-17.99 μm) closer to control values, with only about a 5% difference from normal measurements.
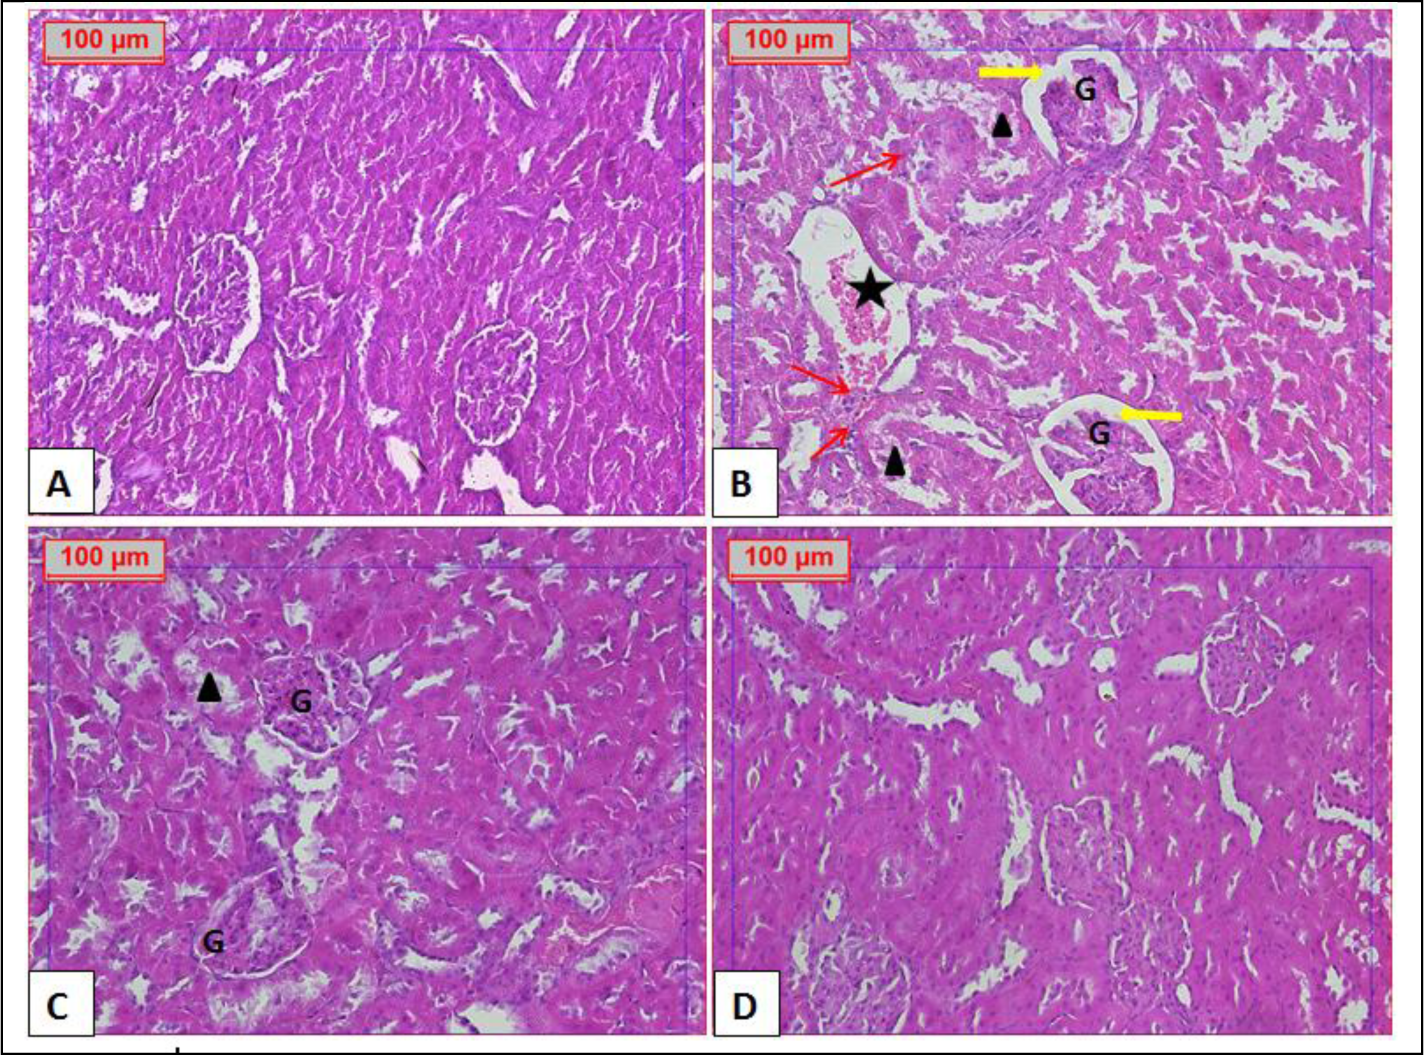
Histopathological examination of renal tissue sections exhibited normal glomerular and tubular appearance in the normal control group (Figure 7). On the other hand, the obese group showed dilated blood vessels, glomerular sclerosis, glomerular cell degeneration, Bowman’s space dilatation, and scattered inflammatory cells. In contrast, APG-treated groups showed apparently normal renal tissue.
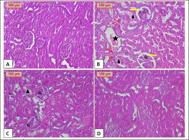
Histopathological examination of kidney sections. A: photomicrograph of renal tissue of the Normal Control group showing normal glomerular and tubular appearance. B: photomicrograph of renal tissue of the Obese group showing dilated blood vessel (star), glomerular sclerosis, and degeneration of glomerular cells (G) with Bowman’s space dilatation (yellow arrow), scattered inflammatory cells (red arrow), and some tubules containing debris in their lumen (arrowhead). C: photomicrograph of renal tissue of Obese + APG (25 mg/kg) group showing normal mild glomerular sclerosis (G) with minimal debris in the lumen of convoluted tubules (arrowhead). D: photomicrograph of renal tissue of Obese + APG (50 mg/kg) group showing normal glomerular and tubular appearance (H&E, x200).
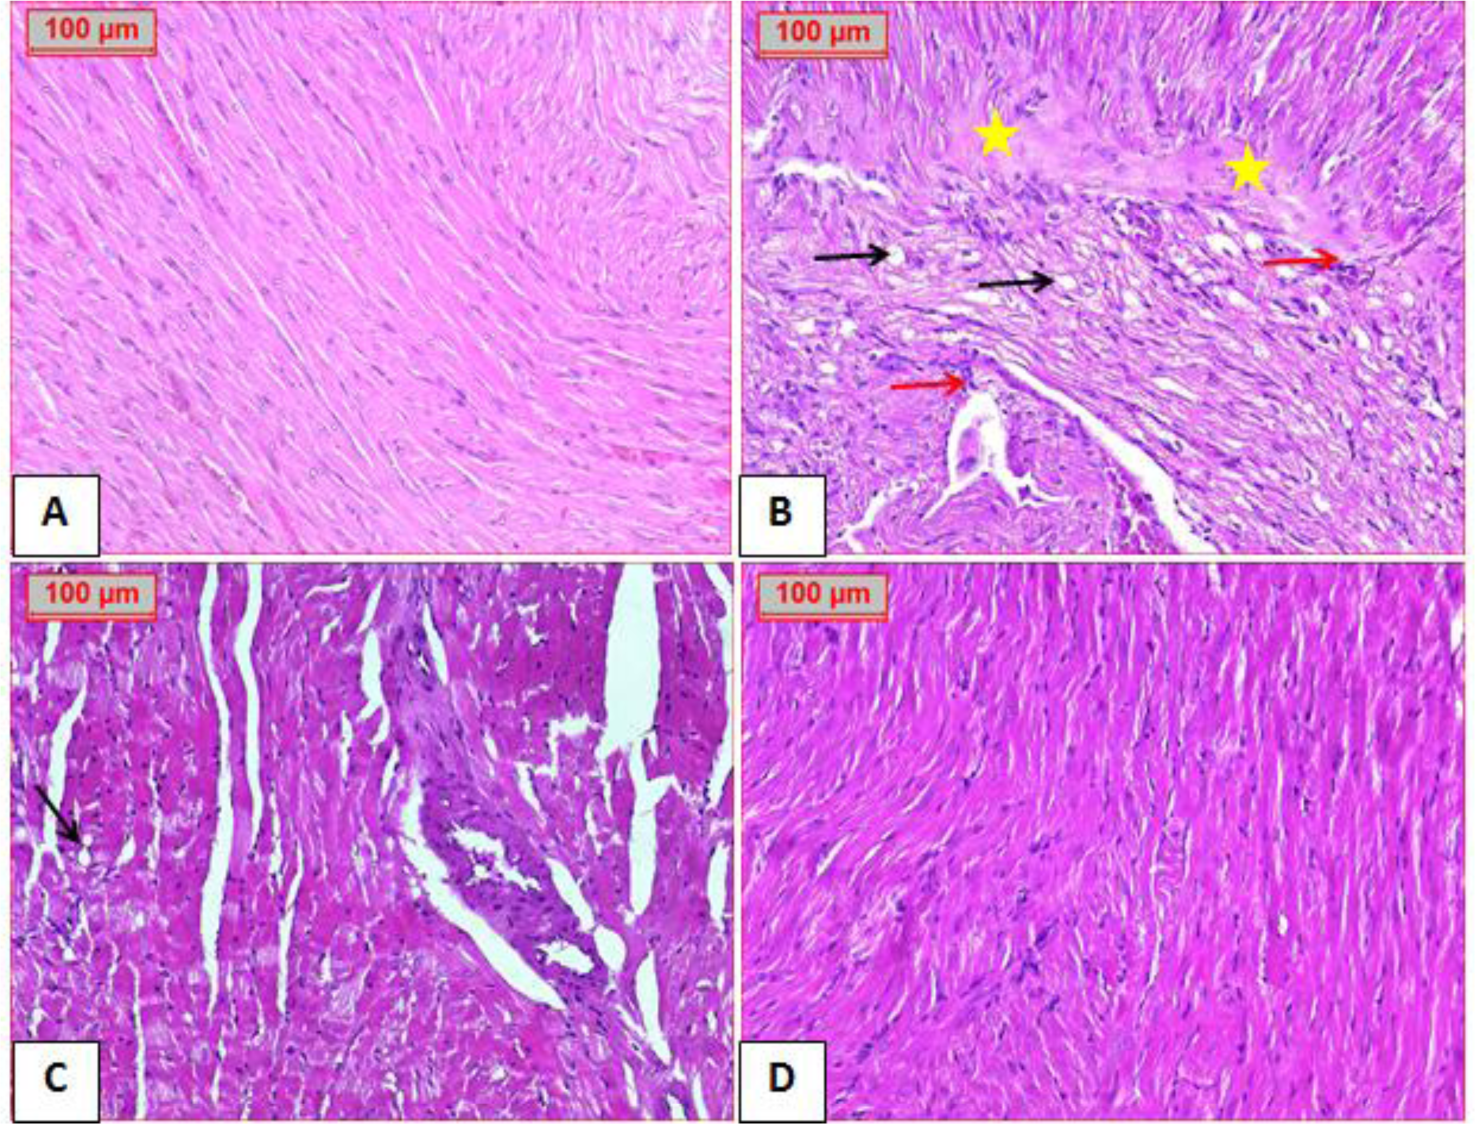
Examination of cardiac tissue sections revealed a normal histological appearance in the control group. In contrast, the obese group showed fat cell deposition, moderate hyalinization, and moderate inflammatory cell infiltration. Cardiac tissue from obese groups treated with APG showed minimal fat cell deposition and appeared normal (Figure 8).
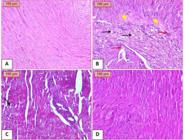
Histopathological examination of heart sections. A: photomicrograph of cardiac tissue of the Normal Control group showing normal cardiac tissue and normal muscle fibers. B: photomicrograph of cardiac tissue of the Obese group showing deposition of fat cells (steatosis) (black arrow), moderate hyalinization (yellow star), and moderate inflammatory cell infiltrate (red arrow). C: photomicrograph of cardiac tissue of Obese + APG (25 mg/kg) group showing minimal fat cell deposition (black arrow). D: photomicrograph of cardiac tissue of Obese + APG (50 mg/kg) group showing normal cardiac tissue (H&E, x200).
DISCUSSION
The present study investigated the effects of apigenin, a natural flavonoid, on obesity and associated metabolic complications in a rat model fed a high-fat diet (HFD) with 20% sucrose in drinking water. The findings clearly demonstrate the potential benefits of apigenin supplementation in mitigating the deleterious effects of obesity. Obesity is a multifaceted metabolic condition defined by an abnormal buildup of adipose tissue, which predisposes individuals to various comorbidities, including dyslipidemia, cardiovascular diseases, oxidative stress, and impaired organ function [12]. In this study, the obese control group exhibited significant increases (p≤0.05) in body weight, body mass index (BMI), and waist circumference, reflecting the anthropometric changes associated with obesity. These findings are consistent with previous studies reporting similar anthropometric alterations in obese animal models and human subjects [25]. Apigenin administration for 6 weeks at 25 mg/kg and 50 mg/kg dose levels significantly decreased body weight, waist circumference, and body mass index (BMI) (p≤0.05). These findings are consistent with those of [29], who found that apigenin had anti-obesity properties by modulating oxidative stress and inflammation, as well as an anti-visceral obesity effect.
Dyslipidemia is a common feature of obesity and a significant risk factor for cardiovascular diseases. Serum lipid profiles are a reliable indicator of the onset of metabolic complications associated with obesity [30]. Prior research has linked an HFD to dyslipidemia, characterized by lower HDL and increased levels of total low-density lipoprotein (LDL), very-low-density lipoprotein (VLDL), total cholesterol, and triglycerides [31,32]. The obese control group exhibited markedly elevated levels of triglycerides, total cholesterol, and LDL cholesterol, along with a significant reduction in HDL cholesterol. These lipid abnormalities are well-recognized contributors to the development of atherosclerosis and subsequent cardiovascular complications [33]. One flavonoid with anti-adiposity properties is apigenin [34]. Apigenin treatment, particularly at the higher dose of 50 mg/kg, effectively ameliorated these dyslipidemic conditions (p≤0.05), suggesting its potential to improve lipid profiles and reduce cardiovascular risk in obesity. Jung and coauthors. Examined the protective benefits of apigenin against obesity-related transcriptional and metabolic responses, along with associated metabolic issues, utilizing HFD-induced obese mice. Apigenin reduced serum concentrations of apolipoprotein B, free fatty acids (FFAs), total cholesterol, and several markers of hepatic dysfunction [20,35]. The beneficial effects of apigenin observed in this study are likely mediated through the modulation of key molecular pathways involved in energy metabolism and inflammation. A primary mechanism may be the activation of AMP-activated protein kinase (AMPK) [35]. As a central regulator of cellular energy status, AMPK activation promotes catabolic processes, such as fatty acid oxidation, and inhibits anabolic processes, such as lipogenesis and cholesterol synthesis. This is consistent with our findings of a markedly improved lipid profile and reduced ectopic fat deposition [36,37]
Oxidative stress, which is characterized by an imbalance between the oxidative and antioxidant systems [38], is closely associated with obesity and its associated diseases [39]. Furthermore, it is well recognized that a high-fat diet induces oxidative damage through lipid peroxidation, leading to the formation of malondialdehyde, depleting endogenous antioxidants, and lowering the activity of natural antioxidant enzymes such as SOD and CAT [40]. In the present study, the obese control group exhibited elevated levels of malondialdehyde (MDA), a marker of oxidative stress, along with reduced levels of antioxidant enzymes, such as superoxide dismutase (SOD) and glutathione (GSH). Apigenin supplementation effectively mitigated oxidative stress by decreasing MDA levels and increasing SOD and GSH activities, indicating its potent antioxidant properties. APG is a powerful antioxidant, according to Abdel-Rahman and coauthors [13], who reported that it reduced MDA levels and increased GSH levels in response to oxidative stress in hepatocytes. Likewise, Goudarzi and coauthors showed that APG could hinder methotrexate-induced hepatotoxicity via reducing oxidative stress [41]. Obesity is also known to impact liver and kidney function [42,43]. Furthermore, consuming too many calories causes obesity. It triggers a chain reaction that eventually results in end-organ dysfunction, such as nonalcoholic fatty liver disease (NAFLD), cardiovascular disease, and chronic kidney disease (CKD) linked to obesity [42]. The obese control group exhibited elevated liver enzyme levels, including serum glutamic-pyruvic transaminase (SGPT) and serum glutamic-oxaloacetic transaminase (SGOT), along with reduced albumin levels, indicating impaired liver function. Similarly, markers of kidney dysfunction, including creatinine, uric acid, and urea, were significantly elevated in the obese control group. Apigenin supplementation effectively improved liver and kidney function by normalizing these biochemical parameters, suggesting its potential to mitigate obesity-induced organ damage. These results were corroborated by earlier research showing that APG protected hepatocyte integrity in a dose-dependent manner, as demonstrated by the decreased enzyme activities, SGPT, SGOT, and restored serum albumin concentrations, total protein, and A/G ratio, all of which showed that APG eliminates TAA-induced hepatic damage [13]. In support of this, apigenin modulates oxidative stress and inflammatory processes by regulating the TLR4-MyD88 signaling pathway, thereby exerting neuroprotective effects against streptozotocin (STZ)-induced diabetic neuropathy [44].
In support of this, male albino Wistar rats treated with apigenin (20 mg/kg) showed improvements in oxidative stress and renal impairment [45]. [46]Moreover, cardiac injury markers, including lactate dehydrogenase (LDH), troponin-1, and creatine kinase-MB (CK-MB), were significantly elevated in the obese control group, reflecting the potential adverse effects of obesity on cardiac function [46]. Apigenin treatment, particularly at the higher dose, effectively reduced these cardiac injury markers, suggesting its cardioprotective effects. Moreover, the obese control group showed elevated levels of monocyte chemoattractant protein-1 (MCP-1), a proinflammatory cytokine implicated in the development of cardiovascular disease. Apigenin supplementation effectively reduced MCP-1 levels, indicating its potential anti-inflammatory properties in the context of obesity-associated cardiovascular complications. In a different investigation, apigenin administration reinstated hemodynamic fluctuations, repaired left ventricular function, and restored a balanced redox state in vivo.
Siddiqueea and coauthors showed that APG exerted cardioprotective effects against isoproterenol-induced myocardial infarction in rats [47]. Xu and coauthors have also demonstrated that APG guards against cardiac damage caused by oxidative stress [48]. Changes in circulating adipokine levels resulting from excessive adipose tissue buildup and dysfunction are a hallmark of obesity [49]. The main adipokines secreted by white adipose tissue are leptin and adiponectin; these molecules are crucial for regulating metabolism [50]. Obesity is characterized by elevated leptin levels and decreased adiponectin levels [51]. The proinflammatory adipokine leptin is linked to insulin resistance, inflammation, cardiovascular disease, energy homeostasis, and central regulation of food intake [47], whereas adiponectin has anti-inflammatory, anti-atherogenic, and antidiabetic effects [17]. In this study, the obese control group exhibited elevated leptin levels and reduced adiponectin levels, reflecting an imbalance in adipokine signaling. Apigenin treatment effectively restored this imbalance, decreasing leptin levels and increasing adiponectin levels, suggesting its potential to modulate adipokine secretion and improve insulin sensitivity. Parallel findings were shown in Mou and coauthors [53] study, which demonstrated that Apigenin reduced adipose inflammation and raised adiponectin levels in hypertension associated with obesity. Moreover, the obese control group showed elevated levels of monocyte chemoattractant protein-1 (MCP-1), a proinflammatory cytokine implicated in the development of cardiovascular disease. Apigenin supplementation effectively reduced MCP-1 levels, indicating its potential anti-inflammatory properties in the context of obesity-associated cardiovascular complications.
Furthermore, the significant reduction in oxidative stress and the pro-inflammatory chemokine MCP-1 suggests the suppression of the NF-κB signaling pathway, a known regulator of inflammatory cytokine production [54]. Apigenin has been demonstrated to inhibit NF-κB activation in other models, which would explain the reduced inflammatory tone observed here [55]. Finally, correcting adipokine imbalance, characterized by elevated leptin and decreased adiponectin, suggests improved adipose tissue function. This restoration is crucial, as adiponectin itself is a potent activator of AMPK, creating a positive feedback loop that enhances insulin sensitivity and metabolic health [56]. Therefore, the collective amelioration of obesity-related metabolic dysfunctions by apigenin appears to stem from a coordinated action on AMPK, inflammatory cytokines, and adipokine signaling.
The observed beneficial effects of apigenin in this study can be attributed to its diverse pharmacological properties, including antioxidant, anti-inflammatory, and metabolic regulatory activities. Apigenin has been shown to modulate various signaling pathways involved in lipid metabolism, glucose homeostasis, and adipogenesis, as well as exert active effects against oxidative stress and inflammation. Overall, the findings from this study highlight the therapeutic potential of apigenin in combating obesity and its associated metabolic complications. However, it is essential to note that the current study was conducted in an animal model, and further clinical investigations are warranted to evaluate the safety and efficacy of apigenin in human subjects.
CONCLUSION
This study demonstrates that oral administration of apigenin exerts a dose-dependent therapeutic effect in mitigating high-fat diet-induced metabolic and organ dysfunction in obese rats. The 50 mg/kg dose consistently outperformed the 25 mg/kg dose, producing more substantial improvements in lipid profiles, oxidative stress markers, adipokine balance, and organ integrity. Notably, the higher dose led to a 57.8% reduction in serum cholesterol, a 157.3% increase in HDL, and marked restoration of adiponectin and leptin levels, alongside histological evidence of reduced hepatic steatosis, renal glomerular sclerosis, and cardiac fat deposition.
These findings underline apigenin’s potential as a multi-targeted agent for obesity-related complications, likely mediated through its antioxidant, anti-inflammatory, and metabolic regulatory mechanisms. Future studies should explore the molecular pathways underlying these effects, particularly those involving AMPK activation, lipid metabolism, and adipokine signaling. Moreover, clinical trials are warranted to evaluate the safety, efficacy, and optimal dosing of apigenin in human populations at risk for obesity and its comorbidities.
Study limitations
The study was conducted on a rat model of obesity. The physiological and metabolic responses in rats may not fully replicate those in humans, limiting the direct translatability of the findings to a clinical setting. The long-term effects, optimal dosing regimen, and potential side effects of chronic apigenin administration remain unknown. While the study demonstrates apigenin’s beneficial effects, it does not deeply investigate the precise molecular mechanisms of action.
-
Funding:
The research project no. 2022/13060187 was funded by the National Research Centre-Egypt (NRC).
-
Institutional Review Board Statement:
The animal study protocol was approved by the Ethics Committee of the National Research Centre (protocol code 13060187 and date of approval 2022).” for studies involving animals.
-
Informed Consent Statement:
Not applicable.
Data Availability Statement:
Data are available on reasonable request for corresponding author.
Acknowledgments:
The authors have no acknowledgments to declare.
-
Use of Generative Artificial Intelligence
The authors declare that large language models and other generative artificial intelligence (AI) or AI-assisted technologies cannot be credited as authors and have not been listed as authors of this paper.The authors declare that no generative artificial intelligence (AI) or AI-assisted technologies were used to generate or modify the scientific content of this manuscript, including the conception of the study, data collection, data analysis, interpretation of results, or creation of original text, figures, tables or graphical abstracts, apart from routine tools for spelling, grammar checking and reference management that do not create original scholarly content.
REFERENCES
-
1 Daniel UE, Item AJ, Eyong EU, Grace UU, Godwin EE, Solomon RO, et al. African Walnuts (Tetracarpidium conophorum) modulate hepatic lipid accumulation in obesity via reciprocal actions on HMG-CoA reductase and paraoxonase. Endocr Metab Immune Disord Drug Targets. 2020;20(3):365-79. doi:10.2174/1871530319666190724114729.
» https://doi.org/10.2174/1871530319666190724114729 -
2 Grundy SM. Multifactorial causation of obesity: implications for prevention. Am J Clin Nutr. 1998;67(3):563S-72S. doi:10.1093/ajcn/67.3.563S.
» https://doi.org/10.1093/ajcn/67.3.563S -
3 NCD Risk Factor Collaboration (NCD-RisC). Trends in adult body-mass index in 200 countries from 1975 to 2014: a pooled analysis of 1698 population-based measurement studies with 19·2 million participants. Lancet. 2016;387(10026):1377-96. doi:10.1016/S0140-6736(16)30054-X.
» https://doi.org/10.1016/S0140-6736(16)30054-X -
4 Akiyama S, Katsumata S, Suzuki K, Nakaya Y, Ishimi Y, Uehara M. Hypoglycemic and hypolipidemic effects of hesperidin and cyclodextrin-clathrated hesperetin in Goto-Kakizaki rats with type 2 diabetes. Biosci Biotechnol Biochem. 2009;73(12):2779-82. doi:10.1271/bbb.90576.
» https://doi.org/10.1271/bbb.90576 -
5 Hildebrandt X, Ibrahim M, Peltzer N. Cell death and inflammation during obesity: "Know my methods, WAT(son)". Cell Death Differ. 2023;30(2):279-92. doi:10.1038/s41418-022-01062-4.
» https://doi.org/10.1038/s41418-022-01062-4 -
6 Goossens GH. The metabolic phenotype in obesity: fat mass, body fat distribution, and adipose tissue function. Obes Facts. 2017;10(3):207-15. doi:10.1159/000471488.
» https://doi.org/10.1159/000471488 -
7 Kusminski CM, Bickel PE, Scherer PE. Targeting adipose tissue in the treatment of obesity-associated diabetes. Nat Rev Drug Discov. 2016;15(9):639-60. doi:10.1038/nrd.2016.75.
» https://doi.org/10.1038/nrd.2016.75 -
8 Kawai T, Autieri MV, Scalia R. Adipose tissue inflammation and metabolic dysfunction in obesity. Am J Physiol Cell Physiol. 2021;320(3):C375-91. doi:10.1152/ajpcell.00379.2020.
» https://doi.org/10.1152/ajpcell.00379.2020 -
9 Gurzov EN, Tran M, Fernandez-Rojo MA, Merry TL, Zhang X, Xu Y, et al. Hepatic oxidative stress promotes insulin-STAT-5 signaling and obesity by inactivating protein tyrosine phosphatase N2. Cell Metab. 2014;20(1):85-102. doi:10.1016/j.cmet.2014.05.011.
» https://doi.org/10.1016/j.cmet.2014.05.011 -
10 Chakraborty C, Doss CGP, Bandyopadhyay S, Agoramoorthy G. Influence of miRNA in insulin signaling pathway and insulin resistance: micro-molecules with a major role in type-2 diabetes. Wiley Interdiscip Rev RNA. 2014;5(5):697-712. doi:10.1002/wrna.1240.
» https://doi.org/10.1002/wrna.1240 -
11 He F, Huang Y, Song Z, Zhou HJ, Zhang H, Perry RJ, et al. Mitophagy-mediated adipose inflammation contributes to type 2 diabetes with hepatic insulin resistance. J Exp Med. 2021;218(3):e20201416. doi:10.1084/jem.20201416.
» https://doi.org/10.1084/jem.20201416 -
12 Xiong H, Wang J, Ran Q, Lou G, Peng C, Gan Q, et al. Hesperidin: a therapeutic agent for obesity. Drug Des Devel Ther. 2019;13:3855-66. doi:10.2147/DDDT.S227499.
» https://doi.org/10.2147/DDDT.S227499 -
13 Abdel-Rahman RF, Fayed HM, Mohamed MAE, Hessin AF, Asaad GF, AbdelRahman S, et al. Apigenin role against thioacetamide-triggered liver fibrosis: deciphering the PPARγ/TGF-β1/NF-κB and the HIF/FAK/AKT pathways. J Herbmed Pharmacol. 2023;12(2):202-13. doi:10.34172/jhp.2023.21.
» https://doi.org/10.34172/jhp.2023.21 -
14 Shukla S, Gupta S. Apigenin: a promising molecule for cancer prevention. Pharm Res. 2010;27(6):962-78. doi:10.1007/s11095-010-0089-7.
» https://doi.org/10.1007/s11095-010-0089-7 -
15 Alam W, Rocca C, Khan H, Hussain Y, Aschner M, De Bartolo A, et al. Current status and future perspectives on therapeutic potential of apigenin: focus on metabolic-syndrome-dependent organ dysfunction. Antioxidants (Basel). 2021;10(10):1643. doi:10.3390/antiox10101643.
» https://doi.org/10.3390/antiox10101643 -
16 Ali F, Naz F, Jyoti S, Siddique YH. Health functionality of apigenin: a review. Int J Food Prop. 2017;20(6):1197-238. doi:10.1080/10942912.2016.1207188.
» https://doi.org/10.1080/10942912.2016.1207188 -
17 Liu W, Zhou X, Li Y, Zhang S, Cai X, Zhang R, et al. Serum leptin, resistin, and adiponectin levels in obese and non-obese patients with newly diagnosed type 2 diabetes mellitus: a population-based study. Medicine. 2020;99(6):e19052. doi:10.1097/MD.0000000000019052.
» https://doi.org/10.1097/MD.0000000000019052 -
18 Laaroussi H, Bakour M, Ousaaid D, Ferreira-Santos P, Genisheva Z, El Ghouizi A, et al. Protective effect of honey and propolis against gentamicin-induced oxidative stress and hepatorenal damages. Oxid Med Cell Longev. 2021;2021:9719906. doi:10.1155/2021/9719906.
» https://doi.org/10.1155/2021/9719906 -
19 Suchal K, Malik S, Khan SI, Malhotra RK, Goyal SN, Bhatia J, et al. Protective effect of mangiferin on myocardial ischemia-reperfusion injury in streptozotocin-induced diabetic rats: role of AGE-RAGE/MAPK pathways. Sci Rep. 2017;7:42027. doi:10.1038/srep42027.
» https://doi.org/10.1038/srep42027 -
20 Jung UJ, Cho YY, Choi MS. Apigenin ameliorates dyslipidemia, hepatic steatosis and insulin resistance by modulating metabolic and transcriptional profiles in the liver of high-fat diet-induced obese mice. Nutrients. 2016;8(5):305. doi:10.3390/nu8050305.
» https://doi.org/10.3390/nu8050305 -
21 Hsu MC, Chen CH, Wang MC, Chen WH, Hu PA, Guo BC, et al. Apigenin targets fetuin-A to ameliorate obesity-induced insulin resistance. Int J Biol Sci. 2024;20(4):1563-77. doi:10.7150/ijbs.91695.
» https://doi.org/10.7150/ijbs.91695 -
22 Ono M, Fujimori K. Antiadipogenic effect of dietary apigenin through activation of AMPK in 3T3-L1 cells. J Agric Food Chem. 2011;59(24):13346-52. doi:10.1021/jf203490a.
» https://doi.org/10.1021/jf203490a -
23 Escande C, Nin V, Price NL, Capellini V, Gomes AP, Barbosa MT, et al. Flavonoid apigenin is an inhibitor of the NAD+ ase CD38: implications for cellular NAD+ metabolism, protein acetylation, and treatment of metabolic syndrome. Diabetes. 2013;62(4):1084-93. doi:10.2337/db12-1139.
» https://doi.org/10.2337/db12-1139 -
24 Myoung HJ, Kim G, Nam KW. Apigenin isolated from the seeds of Perilla frutescens britton var crispa (Benth.) inhibits food intake in C57BL/6J mice. Arch Pharm Res. 2010;33(11):1741-6. doi:10.1007/s12272-010-1105-5.
» https://doi.org/10.1007/s12272-010-1105-5 -
25 Bashandy SAE, El-Seidy AMA, Ibrahim FAA, Abdelrahman SS, Abdelmottaleb Moussa SA, ElBaset MA. Zinc nanoparticles ameliorated obesity-induced cardiovascular disease: role of metabolic syndrome and iron overload. Sci Rep. 2023;13(1):16010. doi:10.1038/s41598-023-42550-y.
» https://doi.org/10.1038/s41598-023-42550-y -
26 Saleh Aldayel T. Apigenin attenuates high-fat diet-induced nephropathy in rats by hypoglycemic and hypolipidemic effects, and concomitant activation of the Nrf2/antioxidant axis. J Funct Foods. 2022;99:105295. doi:10.1016/j.jff.2022.105295.
» https://doi.org/10.1016/j.jff.2022.105295 -
27 Brunt EM, Janney CG, Di Bisceglie AM, Neuschwander-Tetri BA, Bacon BR. Nonalcoholic steatohepatitis: a proposal for grading and staging the histological lesions. Am J Gastroenterol. 1999;94(9):2467-74. doi:10.1111/j.1572-0241.1999.01377.x.
» https://doi.org/10.1111/j.1572-0241.1999.01377.x -
28 Bashandy SAE, El-Seidy AMA, Ibrahim FAA, Abdelrahman SS, Abdelmottaleb Moussa SA, ElBaset MA. Zinc nanoparticles ameliorated obesity-induced cardiovascular disease: role of metabolic syndrome and iron overload. Sci Rep. 2023;13(1):16010. doi:10.1038/s41598-023-42550-y.
» https://doi.org/10.1038/s41598-023-42550-y -
29 Su T, Huang C, Yang C, Jiang T, Su J, Chen M, et al. Apigenin inhibits STAT3/CD36 signaling axis and reduces visceral obesity. Pharmacol Res. 2020;152:104586. doi:10.1016/j.phrs.2019.104586.
» https://doi.org/10.1016/j.phrs.2019.104586 -
30 Che DN, Kang HJ, Cho BO, Shin JY, Jang SI. Combined effects of Diospyros lotus leaf and grape stalk extract in high-fat-diet-induced obesity in mice. Food Sci Biotechnol. 2019;28(4):1207-15. doi:10.1007/s10068-018-00551-y.
» https://doi.org/10.1007/s10068-018-00551-y -
31 Al Mamun MA, Faruk M, Rahman MM, Nahar K, Kabir F, Alam MA, et al. High carbohydrate high fat diet induced hepatic steatosis and dyslipidemia were ameliorated by Psidium guajava leaf powder supplementation in rats. Evid Based Complement Alternat Med. 2019;2019:1897237. doi:10.1155/2019/1897237.
» https://doi.org/10.1155/2019/1897237 -
32 Sifat N, Zihad SMNK, Lovely F, Rouf R, Al Shajib GM, Alam MA, et al. Supplementation of Heliotropium indicum Linn attenuates obesity and associated metabolic disorders in high-carbohydrate-high-fat diet-induced obese rats. J Food Biochem. 2020;44(9):e13444. doi:10.1111/jfbc.13444.
» https://doi.org/10.1111/jfbc.13444 -
33 Wazir M, Olanrewaju OA, Yahya M, Kumari J, Kumar N, Singh J, et al. Lipid disorders and cardiovascular risk: a comprehensive analysis of current perspectives. Cureus. 2023;15(12):e51395. doi:10.7759/cureus.51395.
» https://doi.org/10.7759/cureus.51395 -
34 Qadi HH, Bendary MA, Almaghrabi SY, Zaher MAF, Karami MM, Alsehli AM, et al. Exploring the therapeutic potential of apigenin in obesity-associated fibrinolytic dysfunction: insights from an animal study. Cureus. 2023;15(11):e40943. doi:10.7759/cureus.40943.
» https://doi.org/10.7759/cureus.40943 -
35 Wu L, Guo T, Deng R, Liu L, Yu Y. Apigenin ameliorates insulin resistance and lipid accumulation by endoplasmic reticulum stress and SREBP-1c/SREBP-2 pathway in palmitate-induced HepG2 cells and high-fat diet-fed mice. J Pharmacol Exp Ther. 2021;377(1):146-56. doi:10.1124/jpet.120.000162.
» https://doi.org/10.1124/jpet.120.000162 -
36 Lu J, Meng Z, Cheng B, Liu M, Tao S, Guan S. Apigenin reduces the excessive accumulation of lipids induced by palmitic acid via the AMPK signaling pathway in HepG2 cells. Exp Ther Med. 2019;18(4):2965-71. doi:10.3892/etm.2019.7905.
» https://doi.org/10.3892/etm.2019.7905 -
37 Lu J, Zhou H, Hu J, Zhang R, Meng Z, Guan S. Apigenin reduces lipid droplet accumulation in hepatocytes by enhancing chaperone-mediated autophagy via AMPK. J Agric Food Chem. 2024;72(51):27965-77. doi:10.1021/acs.jafc.4c08430.
» https://doi.org/10.1021/acs.jafc.4c08430 -
38 Sies H. Oxidative stress: a concept in redox biology and medicine. Redox Biol. 2015;4:180-3. doi:10.1016/j.redox.2015.01.002.
» https://doi.org/10.1016/j.redox.2015.01.002 -
39 Rani V, Deep G, Singh RK, Palle K, Yadav UCS. Oxidative stress and metabolic disorders: pathogenesis and therapeutic strategies. Life Sci. 2016;148:183-93. doi:10.1016/j.lfs.2016.02.002.
» https://doi.org/10.1016/j.lfs.2016.02.002 -
40 Agil R, Patterson ZR, Mackay H, Abizaid A, Hosseinian F. Triticale bran alkylresorcinols enhance resistance to oxidative stress in mice fed a high-fat diet. Foods. 2016;5(1):5. doi:10.3390/foods5010005.
» https://doi.org/10.3390/foods5010005 -
41 Goudarzi M, Kalantar M, Sadeghi E, Karamallah MH, Kalantar H. Protective effects of apigenin on altered lipid peroxidation, inflammation, and antioxidant factors in methotrexate-induced hepatotoxicity. Naunyn Schmiedebergs Arch Pharmacol. 2021;394(3):523-31. doi:10.1007/s00210-020-01991-2.
» https://doi.org/10.1007/s00210-020-01991-2 -
42 Abdel-Rahman RF. Non-alcoholic fatty liver disease: epidemiology, pathophysiology and an update on the therapeutic approaches. Asian Pac J Trop Biomed. 2022;12(3):99-114. doi:10.4103/2221-1691.338919.
» https://doi.org/10.4103/2221-1691.338919 -
43 Raphael H, Klang E, Konen E, Inbar Y, Leibowitz A, Frenkel-Nir Y, et al. Obesity is associated with fatty liver and fat changes in the kidneys in humans as assessed by MRI. Nutrients. 2024;16(9):1387. doi:10.3390/nu16091387.
» https://doi.org/10.3390/nu16091387 -
44 Yu YB, Qiu MZ, Zhang DY. Apigenin ameliorates diabetic neuropathy in rats by modulating the TLR4/MyD88 signaling pathway. Asian Pac J Trop Biomed. 2023;13(11):469-78. doi:10.4103/2221-1691.389572.
» https://doi.org/10.4103/2221-1691.389572 -
45 Malik S, Suchal K, Khan SI, Bhatia J, Kishore K, Dinda AK, et al. Apigenin ameliorates streptozotocin-induced diabetic nephropathy in rats via MAPK-NF-ĸB-TNF-α and TGF-β1-MAPK-fibronectin pathways. Am J Physiol Renal Physiol. 2017;313(2):F414-22. doi:10.1152/ajprenal.00393.2016.
» https://doi.org/10.1152/ajprenal.00393.2016 -
46 Parsanathan R, Jain SK. Novel invasive and noninvasive cardiac-specific biomarkers in obesity and cardiovascular diseases. Metab Syndr Relat Disord. 2020;18(1):10-30. doi:10.1089/met.2019.0073.
» https://doi.org/10.1089/met.2019.0073 -
47 Siddiquee R, Mahmood T, Ansari VA, Ahsan F, Bano S, Ahmad S, et al. Cardioprotective effect of apigenin and carvedilol against isoproterenol-induced myocardial infarction in rats. Drug Chem Toxicol. 2025:1-17. doi:10.1080/01480545.2025.2565350.
» https://doi.org/10.1080/01480545.2025.2565350 -
48 Xu K, Yang Y, Lan M, Wang J, Liu B, Yan M, et al. Apigenin alleviates oxidative stress-induced myocardial injury by regulating SIRT1 signaling pathway. Eur J Pharmacol. 2023;944:175584. doi:10.1016/j.ejphar.2023.175584.
» https://doi.org/10.1016/j.ejphar.2023.175584 -
49 Forny-Germano L, De Felice FG, do N. Vieira MN. The role of leptin and adiponectin in obesity-associated cognitive decline and Alzheimer's disease. Front Neurosci. 2018;12:1027. doi:10.3389/fnins.2018.01027.
» https://doi.org/10.3389/fnins.2018.01027 -
50 Loeb M, Bentley DW, Bradley S, Crossley K, Garibaldi R, Gantz N, et al. Development of minimum criteria for the initiation of antibiotics in residents of long-term-care facilities: results of a consensus conference. Infect Control Hosp Epidemiol. 2001;22(2):120-4. doi:10.1086/501875.
» https://doi.org/10.1086/501875 -
51 Frühbeck G, Catalán V, Rodríguez A, Gómez-Ambrosi J. Adiponectin-leptin ratio: a promising index to estimate adipose tissue dysfunction. Relation with obesity-associated cardiometabolic risk. Adipocyte. 2018;7(1):57-62. doi:10.1080/21623945.2017.1402151.
» https://doi.org/10.1080/21623945.2017.1402151 - 52 Saeed HSM, Sarhat ER, Wadi SA. Effects of extracted phenolic compounds from grape seeds on leptin, adiponectin and resistin levels in rats fed with high fat foods. Tikrit J Pure Sci. 2018;23(7):23-8. [No DOI available]
-
53 Mou A, Sun F, Tong D, Wang L, Lu Z, Cao T, et al. Dietary apigenin ameliorates obesity-related hypertension through TRPV4-dependent vasorelaxation and TRPV4-independent adiponectin secretion. Biochim Biophys Acta Mol Basis Dis. 2024;1870(6):167488. doi:10.1016/j.bbadis.2024.167488.
» https://doi.org/10.1016/j.bbadis.2024.167488 -
54 Singh S, Anshita D, Ravichandiran V. MCP-1: function, regulation, and involvement in disease. Int Immunopharmacol. 2021;101(Pt B):107598. doi:10.1016/j.intimp.2021.107598.
» https://doi.org/10.1016/j.intimp.2021.107598 -
55 Sapmaz Erçakalli T, Coskun G, Saker D, Sencar L, Gönlüşen G, Polat S. Effects of apigenin on mesangial GATA3 expression and PDGFR-β/NF-κB signaling pathway in experimental diabetic nephropathy model. Eur J Pharmacol. 2025;1007:178252. doi:10.1016/j.ejphar.2025.178252.
» https://doi.org/10.1016/j.ejphar.2025.178252 -
56 Abdalla MMI. Therapeutic potential of adiponectin in prediabetes: strategies, challenges, and future directions. Ther Adv Endocrinol Metab. 2024;15:20420188231222372. doi:10.1177/20420188231222371.
» https://doi.org/10.1177/20420188231222371
Edited by
-
Editor-in-Chief:
Paulo Vitor Farago
-
Associate Editor:
Jane Manfron