
 Walkability index adaptation for remote assessment using street-level imagery
Abstract:
Urban public space is a fundamental component of the built environment, yet it remains predominantly shaped by infrastructure for motorized transport, often to the detriment of pedestrian accessibility. Walking, however, contributes significantly to physical and mental well-being, social cohesion, and urban sustainability. In this context, walkability has emerged as a key parameter in planning strategies aimed at reducing traffic congestion, promoting health, and enhancing quality of life. This study presents and validates a novel methodological framework for assessing walkability through remote analysis of street-level imagery (SLI). The method is based on an adaptation of the Walkability Index (iCam, initially developed by the Institute for Transportation and Development Policy (ITDP)) to a virtual environment, utilizing publicly accessible Google Street View imagery. Notably, the index was expanded to include a dedicated Accessibility category, addressing the often-overlooked needs of individuals with disabilities or reduced mobility. The methodology was applied to a pilot area in Salvador, Brazil. The results classified the average walkability condition as “sufficient”, with a composite score of 1.75, and confirmed through field validation (score: 1.86). Categories such as Mobility, Attraction, and Public Safety performed well, while Accessibility and Environmental Quality revealed areas that require targeted intervention. Despite limitations related to image temporality, spatial coverage gaps, licensing constraints associated with proprietary imagery, and subjectivity in interpretation, the proposed framework demonstrates high potential for cost-effective, scalable, and transferable urban diagnostics. It enables broader spatial coverage and supports periodic monitoring of pedestrian infrastructure. The findings provide actionable insights for urban planners, policymakers, and researchers committed to building more inclusive, walkable, and sustainable cities.
Keywords:
accessibility; urban infrastructure; Google Street View; virtual audit; urban planning
1. Introduction
Accelerated urbanization has reshaped city landscapes and posed significant challenges to mobility, environmental sustainability, and quality of life. Within this context, the concept of walkability - defined as the ease, safety, and comfort of walking in urban environments - has emerged as a critical element in promoting healthier, more equitable, and sustainable cities.
Recent studies have underscored the multiple benefits of walkable environments. Beyond reducing vehicular traffic and greenhouse gas emissions, regular walking contributes to improved physical and mental health, while also fostering social interaction and inclusive urban spaces (Lima et al. 2021). Urban areas that support walkability are thus more likely to promote active lifestyles and long-term community well-being. Authors are required to use this template for formatting and However, assessing walkability in a reliable, cost-effective, and comprehensive manner remains a methodological challenge. Conventional approaches often rely on in-person field surveys or subjective evaluations, which are resource-intensive and may be impractical for many municipalities (Vegi et al. 2020). While models based on expert knowledge and user perceptions are valuable, data collection remains a significant barrier to the large-scale implementation of these models.
In this scenario, the use of street-level imagery - such as that provided by Google Street View - emerges as a promising alternative. Previous research has demonstrated the applicability of such imagery in urban studies related to infrastructure, environmental exposure, and public health (Huang et al. 2023) (Kang et al. 2021). Street-level images enable detailed visual assessments of urban features, such as sidewalks, crosswalks, and lighting infrastructure, all without requiring direct field visits.
This study introduces a walkability indicator based on remote evaluation using street-level imagery, focusing on the visual identification of key walkability attributes. The methodology involves the visual identification and segment rating of features, including sidewalk presence and condition, availability of crosswalks, and adequacy of public lighting, through a technical inspection of Google Street View images.
Furthermore, the paper discusses the strengths and limitations of this image-based approach, including the scalability and economic efficiency of data collection, as well as potential challenges such as outdated imagery or limited visibility of certain urban elements.
A significant practical limitation is related to the licensing terms of proprietary imagery platforms, such as Google Street View. While the proposed procedure is reproducible at the workflow level, scoring rules, and derived outputs, the redistribution of raw imagery is constrained by the platform’s terms of use. For this reason, we explicitly discuss licensing and reproducibility constraints and highlight open-source alternatives (e.g., crowdsourced street-level imagery platforms) as potential avenues for future replication and scaling.
By advancing a remote and reproducible methodology for mapping walkability conditions, this study aims to contribute to urban planning practices that promote sustainability, accessibility, and an improved quality of life in Brazilian cities.
1.1 Objectives, Scope and Limitations
1) Objectives
This study aims to develop and validate a methodological framework for assessing urban walkability through remote auditing based on street-level imagery. The proposed approach is grounded in an adaptation of the iCam 2.0 Walkability Index.
The specific objectives are:
-
to adapt the iCam 2.0 structure for application in a virtual environment using street-level imagery;
-
to incorporate an explicit Accessibility category aligned with universal design principles;
-
to apply the adapted index to a pilot study area, generating segment-level and area-level scores;
-
to validate the remote assessment through in situ field inspections; and
-
to evaluate the methodological robustness, scalability, and reproducibility of the proposed approach.
2) Scope
The study is geographically confined to a mixed-use urban pilot area in the Barra neighborhood of Salvador, Brazil. The unit of analysis is the sidewalk segment defined as the portion of pedestrian infrastructure located between two adjacent intersections, in accordance with the methodological definition established by iCam 2.0.
The assessment was conducted through structured visual audits using street-level imagery, complemented by municipal geospatial vector data, systematic indicator scoring procedures, and field-based validation for comparative purposes.
The analysis is restricted to physical and environmental attributes that are observable in street-level imagery. Behavioral patterns, pedestrian demand modeling, and long-term public health outcomes are beyond the scope of this research.
3) Limitations
The main limitations of this study relate to temporal discrepancies between image acquisition and field validation, potential subjectivity inherent to visual interpretation, the inability to assess non-visual indicators such as noise and air pollution, spatial coverage gaps in street-level imagery platforms, and licensing constraints associated with proprietary imagery services, which limit raw image redistribution and full archival reproducibility.
Notwithstanding these constraints, the proposed methodology provides a structured and transferable framework suitable for diagnostic applications and comparative urban analyses across different contexts.
2. Background / Literature Review
The concept of walkability is grounded in the relationship between the built environment and pedestrian experience. Introduced through the development of the Neighborhood Environment Walkability Scale (NEWS) by Saelens and Sallis et al. (2002), walkability initially aimed to capture how perceived environmental attributes influence physical activity. Since then, the term has evolved to encompass broader dimensions of urban quality, including safety, comfort, accessibility, and aesthetics (Araújo et al. 2022; ITDP Brazil 2019). Studies emphasize that elements such as sidewalk continuity, public lighting, crossing infrastructure, and urban design features significantly influence perceptions of walkability (Silva et al. 2019; Vieira & Morastoni 2013). Moreover, walkability is often framed within paradigms such as New Urbanism and sustainable neighborhood design, integrating aspects like land-use diversity and environmental performance (Lucchesi et al. 2018; Eloah et al. 2021).
A critical note is warranted regarding the term “walkability”. Although widely adopted, the term is used in multiple ways across research and practice, and it can implicitly assume the ability to walk, which may underrepresent people with disabilities, reduced mobility, or other forms of assisted locomotion (Forsyth 2015). Recent accessibility scholarship has argued that bipedal, universalized framings can produce ableist readings of neighbourhood accessibility and has proposed more inclusive alternatives such as “traversability” and “rollability” (Bridge 2025; Buliung 2025). In this paper, we retain the term “walkability” for consistency with the mainstream literature and with the iCam framework, while explicitly framing our adaptation through a universal design and accessibility lens.
Walkability assessment methods range from perception-based instruments (e.g., NEWS) to in situ audit tools to GIS-derived indices that combine land-use mix, destination accessibility, and network connectivity. Compared with purely GIS-based indices, audit-based tools can better capture micro-scale pedestrian conditions such as surface quality, obstructions, ramps, and lighting. The iCam 2.0 index is positioned within this audit-based family and was selected for this study because it provides a structured, multi-category scoring system at the sidewalk segment level and is accompanied by clear operational definitions, enabling transparent adaptation to remote auditing using street-level imagery.
Traditional methods for assessing walkability typically rely on in situ audits, perception surveys, or geostatistical modeling, which may be costly, time-consuming, and spatially limited (Veloso et al. 2023). In response, researchers have increasingly explored the use of georeferenced panoramic images, known as street-level imagery (SLI), as a remote sensing alternative for analyzing urban environments. Platforms such as Google Street View (GSV), Mapillary, and KartaView offer comprehensive visual datasets that capture urban landscapes from the pedestrian’s perspective (Anguelov et al. 2010; Biljecki & Ito 2021).
GSV images are collected through standardized methods involving vehicle-mounted panoramic cameras, ensuring broad and relatively uniform coverage. Other platforms, such as Mapillary, rely on crowdsourced contributions, leading to more heterogeneous image quality and spatial-temporal coverage (Neuhold et al. 2017). Despite these limitations, street-level imagery has proven valuable for applications in urban planning, sidewalk mapping, public health surveillance, and environmental monitoring (Kang et al. 2021; Doiron et al. 2022).
However, the use of SLI is not without challenges. Variability in image currency, visibility obstructions, and sensor artifacts can affect the reliability of the data (Yang 2019). Nonetheless, the ability to conduct virtual audits with a broad spatial reach and low operational cost makes SLI a promising tool for evaluating walkability in data-scarce or resource-constrained contexts.
3. Guidelines for graphics preparation
The methodology proposed in this study utilizes street-level imagery, specifically from Google Street View (GSV), to evaluate urban walkability. The first step consisted of selecting a study area that is both relevant and representative of pedestrian dynamics. Subsequently, the parameters for the walkability index were established based on an adaptation of the Walkability Index 2.0 (iCam 2.0), developed by the Institute for Transportation and Development Policy (ITDP). This adaptation included the addition of an accessibility category and the exclusion of elements that could not be evaluated through virtual inspection.
QGIS software tools were employed for spatial data processing and visualization. Data collection from street-level imagery was conducted via virtual audits using GSV. During this phase, visual assessments were conducted of walkability indicators, including the presence and condition of sidewalks, the availability of street lighting, and the identification of physical obstacles. The formulas used for calculating the walkability index are presented in a subsequent section. The proposed methodology was validated through field inspections, which were used to compare in situ observations with results derived from the virtual audits.
The iCam 2.0 index, which serves as the methodological foundation for this work, evaluates urban walkability through multiple dimensions, including residential density, commercial density, street connectivity, sidewalk presence, and public lighting. The adaptability of this index allows it to be tailored to diverse urban environments, ensuring its applicability across different spatial contexts.
3.1 Types of graphics
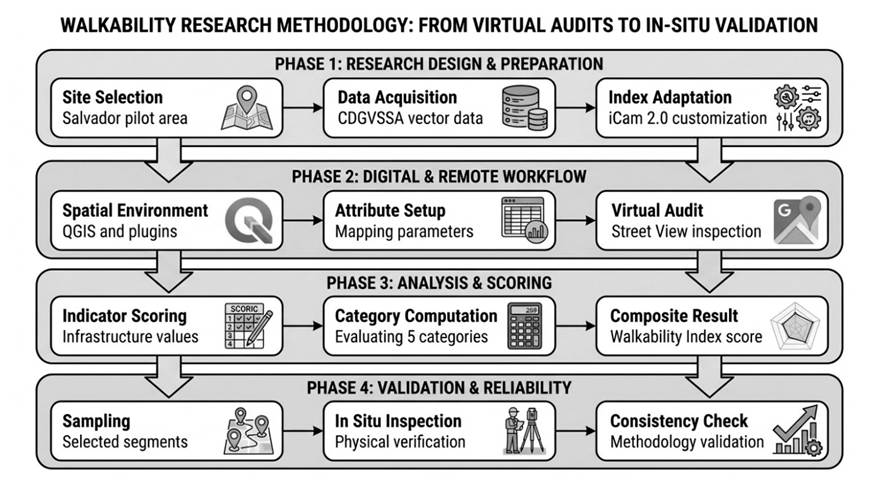
To facilitate understanding and reproducibility, Figure 1 summarizes the end-to-end workflow adopted in this study.
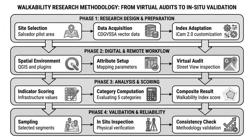
General workflow of the proposed methodology (study design, remote audit, scoring, computation, and validation).
3.2 Selection and characterization of the study area
To define the study area, specific urban and pedestrian characteristics were considered to ensure the selected location was both meaningful and impactful for pedestrian mobility. The chosen area for this research is the Barra neighborhood, located in Salvador, capital of the state of Bahia, in northeastern Brazil.
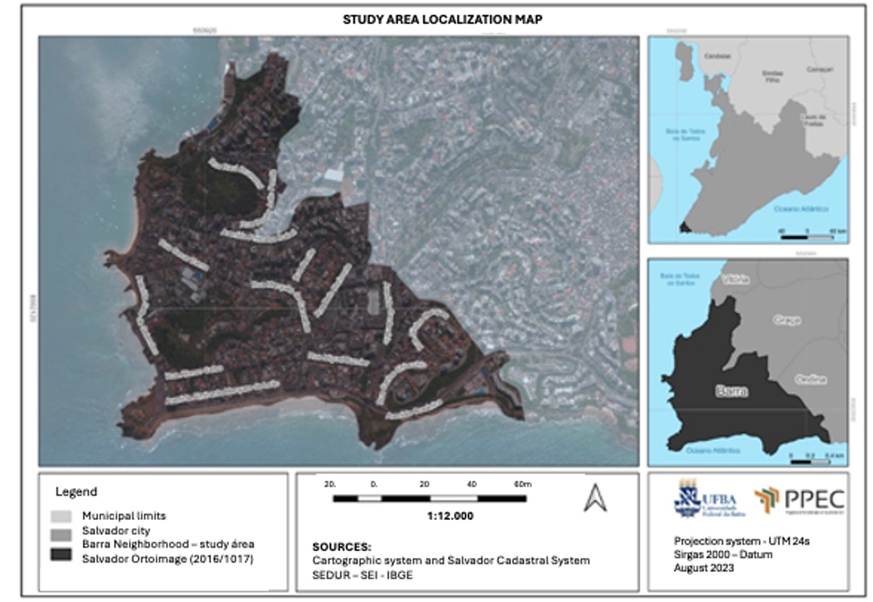
Barra is one of Salvador’s most prominent and touristic neighborhoods, widely recognized for being part of the city’s Carnival circuit (Barra-Ondina). It is situated on the peninsula separating the Baía de Todos os Santos from the Atlantic Ocean, as shown in Figure 2, which presents the location of the study area.
The neighborhood underwent an urban requalification process between 2013 and 2014, which included the widening and reconstruction of sidewalks, resurfacing of roadways, and enhancements in public lighting. Another decisive factor in selecting this area was the availability of up-to-date Google Street View imagery, which covered the entire neighborhood.
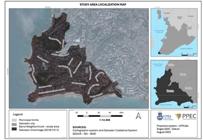
3.3 Definition of Walkability Index Parameters and Adaptation of iCam 2.0
ICam 2.0 defines the sidewalk segment as the fundamental unit of analysis. A segment is delineated as the portion of the street between two adjacent pedestrian network intersections, including non-motorized crossings. Each segment can be scored from 0 to 3 across multiple indicators, grouped into distinct categories.
In this study, the term “segment” refers to a spatial unit of analysis (sidewalk segment) and should not be confused with image segmentation. Similarly, the assignment of scores to indicators is performed through a standardized visual audit, known as a “segment rating,” rather than through automated image classification.
Initially, iCam 2.0 comprises 15 indicators distributed across six categories, offering a comprehensive perspective on walkability. For this study, several adaptations were made to accommodate the limitations of virtual assessments via street-level imagery. Specifically, indicators such as noise pollution, gas emissions, and patterns of pedestrian flow (daytime and nighttime) were excluded due to their non-observable nature in virtual environments.
To address inclusivity concerns, a new category titled “Accessibility” was added, which evaluates conditions for individuals with disabilities or reduced mobility. This category comprises three essential indicators: tactile paving, the presence of obstacles, and accessibility ramps.
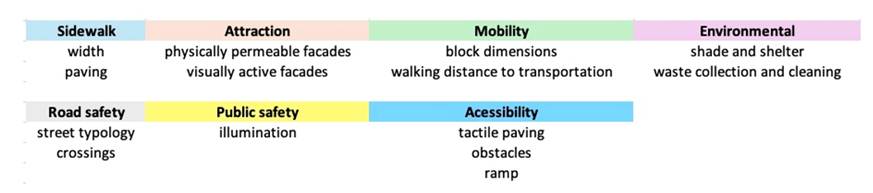
With these modifications, the adapted index comprises 18 indicators organized into seven categories, as illustrated in Figure 3.
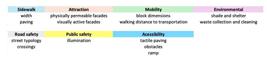
Adapted categories and indicators of iCam 2.0, including the newly added “Accessibility” category.
3.4 Spatialization of Sidewalk Segment Vectors
To implement the methodology, sidewalk vector data were obtained from the Salvador Geospatial Vector Data Set (CDGVSSA, 2017), provided by the municipal geoservices department. The vectors were imported into QGIS, where attribute tables were edited to incorporate the parameters required for walkability analysis. The “Street View” plugin was used to access Google Street View imagery, allowing for a detailed visual audit of sidewalk segments at selected points of interest.
3.5 Data Collection from Street-Level Imagery
Data collection is a critical step in the methodology, involving detailed and systematic visual assessments. At this stage, Google Street View and Google Maps were used to virtually navigate the streets within the study area, with particular focus on sidewalk infrastructure.
Each sidewalk segment was individually assessed, and relevant features were systematically documented. These included the presence of potholes, surface cracks, uneven pavement, physical obstacles, absence of accessibility ramps, inadequate signage, and other conditions that may compromise pedestrian safety and accessibility.
3.6 Calculation of the Walkability Index
The iCam 2.0 Walkability Index, as proposed by ITDP (2018), is computed through spatial aggregation of scores initially assigned to individual street segments. This approach enables the derivation of walkability scores at multiple spatial levels -both at the segment and street level, and for broader spatial units such as neighborhood - while allowing analyses based on either individual indicators or grouped categories. The formulation of the iCam 2.0 Index can be described as follows:
For a specific study region , each segment of a street has e i,j meters in length and each street j = 1,2, …, J has n j segments and a total length of . Considering the score (0, 1, 2 ou 3) that a segment i from a street j receives on indicator k, its contribution to the calculation of this indicator k can be computed as:
Then, the score for each street j in each indicator k, , can be obtained by summing each score value of the segments as in Equation 2:
Subsequently, the score for the entire study area for each indicator k is obtained by summing the values from Equation 2 for each street j:
Since each indicator is part of broader categories, and assuming there are g = 1,2, …, G categories with m g indicators each, the weighted score of a segment i of a street j in a category g can be calculated as shown in Equation 4:
Next, the score for each street j in each category g is computed by summing the values of the scores in the categories of each of its segments (Equation 4), according to Equation 5:
For the scoring of the entire study area in each category g, a new sum is produced considering the score for all streets obtained in the previous step (Equation 5), according to the following expression:
Finally, to calculate the iCam for each street j, it is possible to sum the values of the score from each category g according to the expression:
On the other hand, if the goal is to obtain the iCam for the entire study area, the composite scores are mapped to qualitative classes using the thresholds in Table 1.
3.7 Validation
To validate the proposed methodology, the original procedure developed by ITDP was adapted and applied in three distinct stages. The first stage involved defining the sample size and randomly selecting the segments to be evaluated.
A tolerable sampling error of 10% was adopted for sample size estimation. Given a total of 180 segments used in the index calculation, a simple random sampling method was employed. The equations used are as follows:
Here, the sampling error E represents the maximum tolerable difference between the sample estimate and the (unknown) population proportion under a specified confidence level, with the finite-population correction applied given the finite number of segments. We adopted E = 10% as a pragmatic choice for a pilot diagnostic study, balancing fieldwork effort and the need for representative coverage. Sidewalk segments were selected by simple random sampling from the finite set of segments, so each segment had equal probability of selection.
Our main estimand is a proportion p, estimated by , where X denotes the number of sampled segments that meet the criterion and n is the sample size. For sample-size planning, we rely on the standard large-sample normal approximation to the binomial model , under which is approximately normal with mean p and variance p(1 - p)/n. We adopt the conservative choice p = 0.5, which maximizes p(1 - p) and therefore yields the largest required sample size for a given E. With this conservative setting, we base the margin-of-error expression on a 95% confidence interval (two-sided), using , the initial approximation of the sample size is given by Equation (9), and the final sample size is obtained by applying the finite-population correction in Equation (10).
Where:
N is the population size (N = 180).
E is the sampling error (10%, i.e., E = 0.10)
n0 is the initial approximation of the sample size.
Based on this approach, the minimum required sample size was approximately 64 segments. The “Random Selection” tool in QGIS was used to perform the random sampling, ensuring a systematic and reproducible process for selecting the segments to be surveyed.
In the second stage, the selected features were examined in situ through field visits conducted on September 24th, 29th, and 30th, 2023. On-site data collection was performed with the support of an assistant, who helped record the measurements and complete the evaluation form according to the observed sidewalk characteristics.
In the final stage, photographic documentation was carried out to capture specific features relevant to sidewalk characterization, such as surface conditions, accessibility elements, and physical barriers. These photographs served as supporting material to compare in-person observations with data collected through virtual audits.
4. Results and Discussion
Following the application of the proposed methodology, individual scores were assigned to each sidewalk segment across all indicators and categories. These scores resulted in classifications ranging from “sufficient” to “good,” based on the final composite values attributed to each segment.
The overall walkability rating for the study area was classified as “sufficient,” with a mean score of 1.75. The seven categories of the adapted iCam Index received scores ranging from “insufficient” to “sufficient,” as summarized in Table 2.
Although themobilityandattractioncategories received “good” scores, the findings suggest that medium-term interventions are still warranted to further enhance these aspects. All other categories were rated as “sufficient,” indicating that short-to medium-term improvements are both feasible and necessary to raise the overall walkability conditions in the area.
The low score for Accessibility, particularly for therampsindicator (0.66), highlights critical challenges for people with disabilities or reduced mobility. This reinforces the relevance of including an accessibility category in the adapted index, and it suggests that targeted infrastructure upgrades are essential for promoting inclusive urban mobility.
4.1 Sidewalk Category
An ideal sidewalk offers a safe and comfortable environment for pedestrian circulation. This requires the use of appropriate surface materials, the absence of steps and obstacles, and the strategic placement of urban furniture and vegetation to avoid impeding pedestrian movement. The overall quality of sidewalks can be assessed based on three primary dimensions: fluidity, comfort, and safety.
According to the ITDP, sidewalk quality is fundamentally linked to infrastructure elements, including adequate dimensions, surface conditions, and regular maintenance. In this study, two key indicators were used to evaluate the sidewalk category: width and pavement quality. The category received a score of 1.85, which corresponds to a “sufficient” classification.
The width indicator was assessed based on the critical clear zone width of each sidewalk segment. The critical width refers to the narrowest unobstructed portion of the sidewalk and must be at least 1.50 meters to avoid a score of zero. This metric also considers contextual factors such as pedestrian flow and street typology, as areas with higher pedestrian volumes demand greater sidewalk width for functional adequacy.
In the remote audit, this indicator was operationalized through structured visual judgement of the clear walking zone and the presence of obstructions, using multiple viewpoints along the segment. We did not apply geometric transformations to derive metric widths from panoramas; whenever precise measurements were needed, they were obtained during field validation.
The width indicator achieved a score of 1.95, categorized as “sufficient.” Among the 180 segments evaluated, the following distribution was observed: 17.8% classified as excellent, 62.8% as good, 13.9% as sufficient, and 5.6% as insufficient.
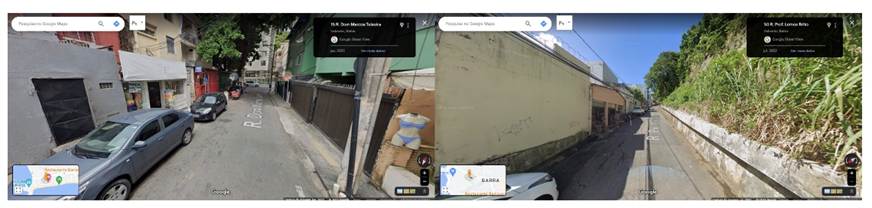
Critical cases were identified in specific segments. For instance, on Dom Marcos Teixeira Street, the critical clear width is approximately 60 centimeters, as illustrated in Figure 4(a). On Professor Lemos Brito Street, some segments lack sidewalks entirely, as shown in Figure 4(b).
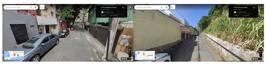
(a) Segment of Dom Marcos Teixeira Street with Critical Width (b) Segment of Professor Lemos Brito Street without sidewalk.
The pavement quality indicator was assessed visually by identifying paved segments and quantifying the presence of potholes and surface irregularities.
This indicator received a score of 1.75, also categorized as “sufficient.” The segment classification results were as follows: 17.8% rated as excellent, with no potholes or irregularities, 50.5% rated as good, with up to 5 potholes or surface defects per 100 meters, 30% rated as sufficient, with up to 10 defects per 100 meters, and 1.7% rated as insufficient, with more than 10 defects per 100 meters.
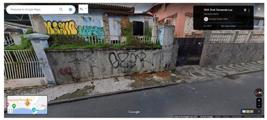
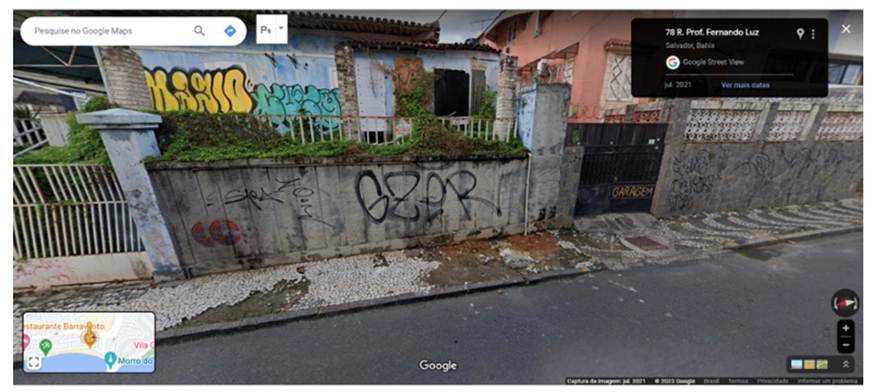
A representative example of poor pavement quality can be observed on Professor Fernando Luz Street, where various types of surface materials and potholes exceeding 15 cm in diameter were identified, as depicted in Figure 5.
4.2 Mobility Category
The mobility dimension is associated with pedestrian accessibility, the availability of public transportation, and the permeability of the urban structure. In this study, two key indicators were considered: block size and walking distance to public transport. Their results were combined through an arithmetic mean, yielding a final score of 2.34, which corresponds to a “good” classification. This suggests that, while pedestrian mobility within the neighborhood is generally favorable, targeted medium-term interventions are still desirable.
The block size indicator received a score of 1.89, classified as “sufficient.” The classification of the evaluated segments was as follows: 67.8% were rated excellent (block lengths 110 meters), 17.8% were rated good, 4.4% were rated sufficient, and 10% were rated insufficient.
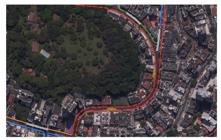
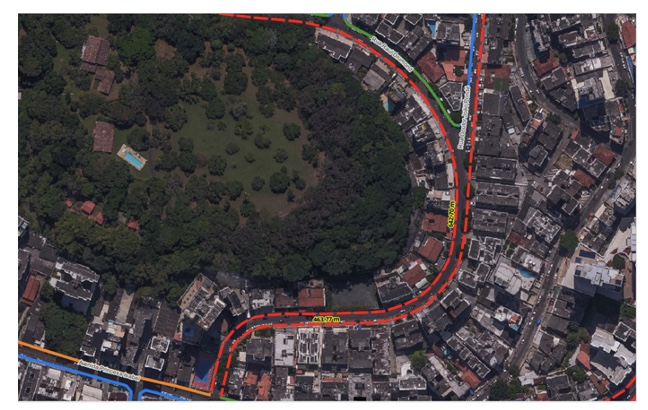
The longest blocks were identified on Raul Drummond Street (642.70 meters) and Dr. João Pondé Street (463.77 meters), both of which exceeded the 190-meter threshold and thus received a score of zero for this indicator, as illustrated in Figure 6.
The walking distance to public transport indicator evaluated pedestrian proximity to medium- or high-capacity transit stations. Since the study area lacks such infrastructure, the analysis focused on the distance to conventional bus stops.
This indicator received a score of 2.78, classified as “good.” The distribution of segment ratings was as follows: 84.4% rated the segment excellent, with walking distances of 500 meters, and 15.6% rated it good, with distances between 501 and 700 meters.
These results highlight the relatively high accessibility to public transportation across the study area, despite the absence of major transit hubs.
4.3 Attraction Category
The Attraction category encompasses indicators related to land use characteristics that positively contribute to pedestrian interest and spatial vitality. The evaluated indicators were: physically permeable facades, visually active facades, and mixed land uses. The arithmetic mean of these indicators yielded a final score of 2.11, which corresponds to a “good” classification. This suggests that, in general, the walking experience through the neighborhood is favorable in terms of spatial attractiveness.
The Physically Permeable Facades indicator assessed the presence of entrances and transparent elements that facilitate pedestrian interaction with the built environment. This includes openings in commercial facades, park entrances, restaurants, cafés, and other active frontage elements.
This indicator scored 2.38, classified as “good,” but still suggests the need for strategic interventions to strengthen permeability. Among the 180 sidewalk segments evaluated, 65.5% were rated as excellent, 18.9% as good, 11.7% as sufficient, and 3.9% as insufficient.
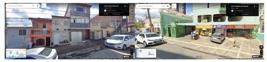
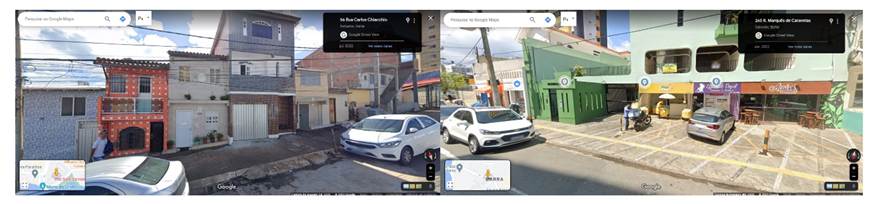
Figure 7(a) shows Carlos Chiacchio Street, where residential units allow visual permeability between private and public spaces. Figure 7(b) illustrates Marquês de Caravelas Street, which features several small commercial establishments contributing to a high degree of facade permeability.
The Visually Active Facades indicator evaluated the proportion of the block face that offers a visual connection between indoor and outdoor spaces, particularly between the ground and first floors. Segments were classified as excellent when 60% or more of the facade exhibited such characteristics.
This indicator scored 2.29, classified as “good.” The breakdown of segment ratings was as follows: 62.2% excellent, 20% good, 10% sufficient, and 7.8% insufficient.
The Mixed Uses indicator assessed the integration of residential, commercial, and service activities within the same urban fabric. Mixed-use development promotes pedestrian activity by reducing travel distances and fostering vibrant public spaces throughout the day and night.
This indicator received a score of 1.65, classified as “sufficient,” indicating a need for short-term improvements. Among the evaluated segments, 23.9% were rated excellent, 28.9% good, 31.7% sufficient, and 15.5% insufficient.
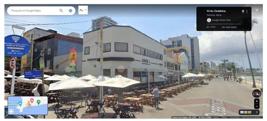
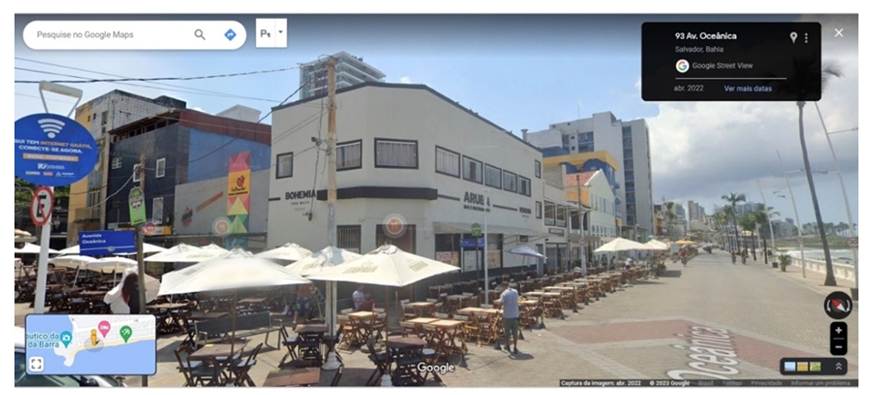
The neighborhood is predominantly residential. However, the area surrounding Oceânica Avenue, Almirante Marquês de Leão Avenue, and Sete de Setembro Avenue exhibits a higher concentration of mixed-use buildings, making it one of the most attractive sectors for pedestrian circulation (Figure 8).
4.4 Road Safety Category
The Road Safety category examines how pedestrian safety is influenced by vehicular infrastructure and urban design. This category received a final score of 1.30, which corresponds to a “sufficient” classification according to the evaluation criteria.
The Street Typology indicator assesses the extent to which sidewalks are appropriately designated and protected for pedestrian use, particularly in relation to adjacent motor vehicle traffic. Inadequate street typologies are characterized by sidewalks that lack physical separation from traffic or are in high-speed traffic zones without safety buffers.
This indicator received a score of 1.48, classified as “sufficient.” Although this score indicates a relatively favorable situation, it still points to the need for medium-term interventions. Among the segments evaluated, 7.2% were rated as excellent, 38.9% as good, 48.9% as sufficient, and 5% as insufficient.
The Crossings indicator evaluates the integrity of the pedestrian network, focusing on the availability and quality of street crossings in compliance with local accessibility and safety standards. Well-designed crossings are crucial for ensuring continuity, visibility, and safety in pedestrian mobility.
This indicator scored 1.12, also classified as “sufficient,” but with higher urgency for intervention. The classification results were as follows: 7.2% of segments were rated as excellent, 35% as good, 27.2% as sufficient, and 30.6% as insufficient.
The relatively low score for crossings reflects the need to improve pedestrian infrastructure continuity and compliance with safety norms, particularly in high-traffic or intersection areas.
4.5 Public Safety
The Public Safety category encompasses urban design elements that enhance pedestrians’ sense of safety, particularly during nighttime mobility. This category received a final score of 1.66, which places it within the “sufficient” classification range according to the evaluation criteria.
The indicator assessed under this category was public lighting. Adequate public safety infrastructure includes lighting specifically designed to illuminate pedestrian pathways, thereby enhancing visibility and promoting secure circulation during nighttime hours. Ideally, lighting should be well-distributed and oriented toward the sidewalk along each evaluated segment.
The indicator revealed the following distribution of classifications: 10% of segments were rated as excellent, 46.7% as good, 38.3% as sufficient, and 5% as insufficient.
Although the overall rating was sufficient, the 5% of segments with inadequate lighting represent critical areas of concern, particularly in terms of perceived and actual safety for pedestrians during low-light conditions. These findings suggest the need for targeted interventions to improve lighting infrastructure and ensure compliance with pedestrian safety standards.
4.6 The Environment Category
The Environment category encompasses indicators related to environmental conditions that affect pedestrian comfort and safety in urban spaces. The evaluated indicators were shade and shelter, as well as garbage collection and cleanliness. The arithmetic mean of these indicators yielded a final score of 1.86, corresponding to a “sufficient” classification. This suggests that while environmental conditions are generally adequate, improvements are recommended through medium-term interventions.
In tropical coastal cities such as Salvador, shade and shelter are particularly crucial for thermal comfort and for supporting walking among heat-sensitive groups (e.g., older adults, children, and individuals with cardiorespiratory conditions), which underscores the importance of this category in the local context.
The Shade and Shelter indicator received a score of 1.76, classified as “sufficient.” This indicator measures the proportion of sidewalk segments that are covered by tree canopies or other elements that provide shade and protection from weather conditions. The distribution of classifications was as follows: 22.3% of segments were rated excellent, offering shade along more than 75% of the segment; 37.2% good (shade along more than 50%); 35% sufficient (shade along more than 25%), and 5.5% insufficient (shade along less than 25%).
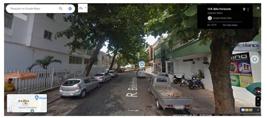
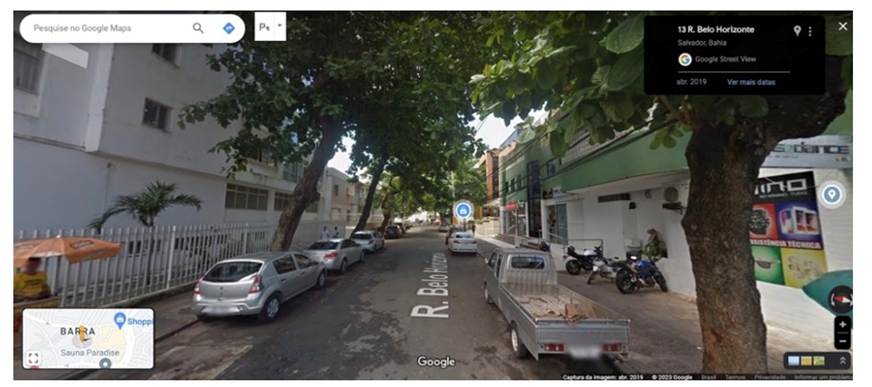
A representative example is the Belo Horizonte Street segment, which features a continuous tree canopy providing shade throughout most of the sidewalk, as shown in Figure 9.
Another fundamental environmental aspect affecting pedestrian experience is the presence of solid waste and general cleanliness. Efficient street cleaning services and regular garbage collection are essential for maintaining functional and welcoming public spaces.
The Garbage Collection and Cleanliness indicator scored 1.96, classified as “good.” The classification breakdown was as follows: 34.5% of segments were rated as excellent, 41.1% as good, 19.4% as sufficient, and 5% as insufficient.
Although most segments received satisfactory evaluations, the presence of waste and inadequate maintenance in certain sections reinforces the need for consistent municipal cleaning services to enhance environmental quality for pedestrians.
4.7 Walkability Index - Validation
The validation sample, composed of randomly selected sidewalk segments from the study area, achieved a composite walkability score of 1.87, classified as “sufficient.” The seven categories of the adapted Walkability Index (iCam) obtained individual scores ranging from “sufficient” to “good.” These results indicate that all dimensions of pedestrian infrastructure require intervention, which should be prioritized in the short to medium term.
Overall, the study area demonstrates a walkability condition that meets minimum standards but presents several opportunities for improvement. Medium-term interventions are recommended to enhance pedestrian mobility and ensure safer, more inclusive, and more comfortable urban walking environments.
Table 3 summarizes the scores and corresponding classifications for each indicator and category assessed during the validation phase.
4.8 Validation Analysis
The walkability index derived from street-level imagery (iCam_SVI) yielded a score of 1.75, while the score obtained through field surveys (iCam_field) was slightly higher at 1.86. This comparison between remote and in-person assessment methods reinforces the reliability of street-level imagery as a viable tool for walkability evaluation.
The observed difference between the two scores is primarily attributed to urban improvements and infrastructure upgrades that were implemented after the Google Street View (SVI) images were captured. These post-capture interventions, including new sidewalk infrastructure and accessibility enhancements, contributed to the higher field-based score.
Field validation was conducted in late September 2023. In contrast, the GSV imagery used in the virtual audit (as indicated in the figure captions) is dated 2022 for most locations in the study area. Therefore, the temporal gap between image capture and field inspection is approximately 12 to 21 months, depending on the street segment.
Despite this discrepancy, both methods yielded the same overall classification (“sufficient”), confirming the consistency of the findings. Therefore, the remote methodology remains valid and effective for diagnostic purposes, particularly in contexts where fieldwork is limited or not feasible. Moreover, the results underscore the importance of implementing short- and medium-term interventions to enhance walkability and foster more inclusive, pedestrian-friendly urban environments.
To provide a quantitative comparison between the remote and in-person assessments, we also examined whether the category-level scores differ systematically between the two methods. Using the seven category scores as paired observations (remote vs. field), a paired t-test did not indicate a statistically significant difference (t = 1.12, p = 0.304). A nonparametric Wilcoxon signed-rank test led to the same conclusion (W = 6.0, p = 0.219). Given the small number of paired observations at this aggregation level, these tests should be interpreted as a complementary, exploratory check; segment-level paired testing is recommended when full paired segment scores are available.
4.9 Analysis of the Proposed Methodology
The methodology proposed for assessing urban walkability using street-level imagery has demonstrated both applicability and practicality. Its main strengths lie in the accessibility and broad spatial coverage of services such as Google Street View (GSV), which allow for detailed, street-level perspectives to be obtained remotely, without the need for physical field visits. This capability enables the evaluation of large urban areas in a time- and cost-efficient manner.
From a logistical standpoint, the method offers significant cost-effectiveness by eliminating expenses typically associated with in-person surveys, such as transportation, field equipment, and labor. Furthermore, it may support, in future work, the integration of computer vision and machine learning techniques for the automated extraction and analysis of walkability indicators from the imagery, opening avenues for scalable urban diagnostics.
Despite these advantages, several limitations should be acknowledged. One critical issue is the subjectivity of interpretation: specific walkability attributes, such as the assessment of surface conditions or the visibility of tactile paving, may vary according to the analyst’s judgment, particularly in the absence of standardized protocols. Additionally, the temporal limitations of the image data present challenges. In some areas, GSV images may be outdated and not reflect recent infrastructure improvements or urban changes.
A further limitation concerns data governance and licensing. Google Street View imagery is proprietary and subject to the platform’s terms of service, which may restrict redistribution, long-term archiving, and certain automated extraction workflows. Consequently, full methodological reproducibility should be understood in terms of procedural transparency (scoring rules, sampling, and computation) and the sharing of derived, non-image data products, rather than the redistribution of the raw panoramas themselves. Where licensing constraints are prohibitive, open-source or crowdsourced SLI providers can be explored, noting that they may introduce additional variability in coverage and image quality.
Nevertheless, street-level imagery remains a highly accessible and convenient tool, given its widespread availability and remote access. These images typically provide systematic coverage of urban environments and are updated periodically, allowing for a relatively current and spatially continuous overview of pedestrian infrastructure.
From a pedestrian’s perspective, street-level imagery enables the identification of specific sidewalk characteristics, such as width, surface quality, presence of obstacles, signage, and lighting. Moreover, it can be combined with geospatial vector data and auxiliary datasets to enhance analytical depth and provide a more comprehensive assessment of urban walkability.
The consistency of data acquisition - a key advantage of this method - ensures that images are captured using uniform protocols, facilitating comparison across neighborhoods, cities, or temporal intervals. Additionally, historical image archives enable the analysis of temporal trends and the monitoring of urban transformations over time.
However, some limitations must be addressed to avoid biased results. For instance, the presence of temporary obstructions, such as parked vehicles or ongoing construction work, may obscure sidewalk conditions and lead to misinterpretations. Image quality may also vary due to factors such as lighting conditions, shadows, or atmospheric effects, which can hinder the accurate identification of key features.
Lastly, technical issues such as image distortions, fisheye effects, or perspective artifacts can affect spatial accuracy, particularly in dense urban environments or areas with complex building geometries. These factors underscore the importance of integrating visual interpretation with supplementary spatial data and establishing standardized evaluation protocols to enhance methodological robustness.
5. Results and Discussion
Walkability, as conceptualized by (Saelens 2002) and (Sallis et al. 2002), refers to the capacity of the urban environment to support and encourage walking as a primary mode of mobility. The findings of this study confirm the central role of urban infrastructure, particularly sidewalk width, pavement quality, and street connectivity, in enabling and enhancing pedestrian movement. This aligns with the observations of (Vieira 2013) and (Morastoni 2013), who emphasize that infrastructure characteristics are key determinants of perceived and actual walkability.
The results demonstrate that most evaluated segments fall within the “sufficient” classification, with some categories, such as Mobility, Attraction, and Public Safety, reaching “good” status. The Accessibility category, however, showed the most critical deficiencies, particularly in relation to ramps, with over 57% of evaluated segments rated as insufficient. This gap underlines the importance of incorporating universal accessibility into walkability assessments, as reflected in the adaptation of the Walkability Index (iCam) used in this study. By including an Accessibility category, the adapted index addresses a notable omission in traditional models, as pointed out by ITDP (2018a), thereby contributing to a more inclusive approach to urban analysis.
From a public health and social equity perspective, the benefits of walkable environments are well documented. Studies by (Lima et al. 2021) and (Eloah et al. 2021) highlight the positive impacts of walkability on physical and mental health, social interaction, and the reduction of vehicular dependence and emissions. The present study reinforces this evidence, suggesting that targeted improvements in sidewalk infrastructure, lighting, and public space permeability can significantly contribute to a more sustainable and socially integrated urban environment.
Regarding methodology, the use of street-level imagery (SLI) - particularly Google Street View - proved to be a cost-effective, scalable, and practical alternative to traditional fieldwork. As noted by (Vegi et al. 2020), data collection for walkability assessments can be resource intensive. The SLI-based approach reduces the need for physical surveys, enabling faster, broader, and more economical evaluations of urban areas. Additionally, this method could be integrated, in future work, with machine learning and computer vision techniques, which can automate the detection of urban features and increase analytical efficiency.
However, several methodological limitations must be acknowledged. A primary constraint involves the temporal inconsistency of imagery: Google Street View does not update uniformly across all areas, particularly in peripheral or low-income regions, which may compromise data reliability (Huang et al. 2023; Yang 2019; Quinn & Alvarez León 2019). Spatial coverage is another limitation, as specific environments -such as informal settlements, pedestrian-only zones, or narrow alleyways - may be inaccessible to SLI platforms, leading to geographic bias in the analysis (Biljecki & Ito 2021).
Additionally, the environmental conditions at the time of image capture - such as lighting, weather, and visual obstructions (e.g., parked vehicles, vegetation) - may reduce the visibility and interpretability of pedestrian infrastructure elements (Neuhold et al. 2017; Zhang et al. 2021). Even when visibility is adequate, the subjective nature of visual interpretation can introduce inconsistency, particularly in the absence of standardized evaluation protocols (Kang et al. 2021).
While automated techniques are increasingly available, computer vision models still face challenges in reliably detecting fine-grained features such as tactile paving, surface cracks, or ramps due to model generalizability and limitations in training datasets (Doiron et al. 2022; Neuhold et al. 2017). In high-density areas, fisheye distortions and image artifacts may also compromise the accuracy of spatial judgments. Ethical considerations, such as privacy and data sensitivity - especially in residential areas - remain pertinent (Quinn & Alvarez León 2019) and must be addressed in future applications of this methodology.
Despite these constraints, the consistency in classification between SLI-based results (iCam_SVI = 1.75) and field observations (iCam_Field = 1.86) reinforces the reliability of the proposed method. The minor difference between scores is likely due to recent infrastructure improvements implemented after the SLI imagery was captured. Nevertheless, the method proved effective for diagnostic purposes and demonstrates potential for replication in other urban contexts, particularly when field access is limited.
In line with the findings of Larranaga et al. (2016), who demonstrated the value of quantitative methods in identifying priority areas for improving walkability, this study corroborates that block size, connectivity, and the presence of amenities are decisive factors for pedestrian movement. The adapted index provides a transferable, inclusive, and low-cost framework that aligns with both current scientific literature and emerging technological tools in urban analytics.
6. Conclusion
This study developed and validated a remote methodology for assessing urban walkability using street-level imagery, grounded in an adaptation of the iCam 2.0 Walkability Index. The empirical application to the Barra neighborhood in Salvador demonstrated the analytical consistency and diagnostic capacity of the proposed framework.
The composite walkability score derived from street-level imagery (iCam_SVI) was 1.75, corresponding to a “sufficient” classification. Field validation produced a slightly higher score of 1.86, also classified as “sufficient”. The difference of 0.11 points between the two methods is modest and statistically non-significant at the category level (paired t-test: t = 1.12, p = 0.304; Wilcoxon test: p = 0.219), reinforcing the reliability of the remote assessment approach. The discrepancy is mainly due to infrastructure improvements implemented after the capture of the street-level imagery.
At the category level, the Mobility (2.34) and Attraction (2.11) dimensions achieved “good” classifications in the remote assessment, indicating favorable block dimensions, proximity to public transport (walking distance: 2.78), and active façades. In contrast, Road Safety (1.30), Public Safety (1.66), Environmental Quality (1.86), and Sidewalk conditions (1.85) remained within the “sufficient” range, suggesting the need for targeted short- to medium-term interventions.
The Accessibility category presented the most critical deficiencies, with a composite score of 1.10. Notably, the Ramp indicator scored 0.66, classified as “insufficient”, with 57.8% of segments rated below acceptable standards. This result highlights a structural gap in compliance with accessibility norms and justifies the inclusion of a dedicated Accessibility category in the adapted index. Even after field validation, the Ramp indicator remained the lowest-performing component (0.85), confirming that accessibility limitations are not an artifact of remote interpretation but reflect actual infrastructural shortcomings.
The results demonstrate that the proposed methodology can identify both strengths and vulnerabilities in pedestrian infrastructure with sufficient precision to inform planning priorities. The strong convergence between remote and field-based scores supports the use of street-level imagery as a cost-effective diagnostic tool, particularly in contexts where large-scale field audits are impractical.
However, the conclusions must be interpreted considering identified methodological constraints, including temporal discrepancies in imagery, spatial coverage gaps, and interpretative subjectivity. Despite these limitations, the consistency of classifications across methods and the statistically non-significant difference between aggregated results provide empirical support for the robustness of the framework.
In practical terms, the findings indicate that while the study area meets minimum walkability standards, systematic interventions are needed to improve pedestrian safety, ensure infrastructure continuity, and achieve universal accessibility. The adapted index offers a transferable, scalable approach that supports evidence-based decision-making and comparative analyses across urban contexts.
Overall, this research contributes a validated, data-supported methodological framework that bridges traditional audit-based walkability assessment and remote geospatial analysis, advancing inclusive and scalable urban diagnostics grounded in measurable indicators.
REFERENCES
-
ANGUELOV, D. et al., 2010. Google Street View: capturing the world at street level Computer, 43(6), pp.32-38. Disponível em: http://dx.doi.org/10.1109/MC.2010.170. Acesso em: 6 jun. 2025.
» https://doi.org/http://dx.doi.org/10.1109/MC.2010.170 - ARAÚJO, K., LIMA, A. and LEÃO, M., 2022. Propostas à mobilidade urbana Pixo - Revista de Arquitetura, Cidade e Contemporaneidade, 6(23), pp.254-273.
-
ASSOCIAÇÃO BRASILEIRA DE NORMAS TÉCNICAS, 2015. NBR 9050: acessibilidade a edificações, mobiliário, espaços e equipamentos urbanos Rio de Janeiro: ABNT. Disponível em: Disponível em: https://bibliotecadigital.mdh.gov.br/jspui/handle/192/9974 Acesso em: 6 jun. 2025.
» https://bibliotecadigital.mdh.gov.br/jspui/handle/192/9974 -
BILJECKI, F. and ITO, K., 2021. Street view imagery in urban analytics and GIS: a review Landscape and Urban Planning, 215, 104217. Disponível em: Disponível em: https://doi.org/10.1016/j.landurbplan.2021.104217 Acesso em: 6 jun. 2025.
» https://doi.org/10.1016/j.landurbplan.2021.104217 -
BRIDGE, G., 2025. Equitable mobility: enhancing walkability and rollability for inclusive and healthy communities. Cities & Health. https://doi.org/10.1080/23748834.2025.2468016
» https://doi.org/https://doi.org/10.1080/23748834.2025.2468016 -
BULIUNG, R., 2025. 15-minute cities, ‘walkability’ and last millimeter problems Disability & Society https://doi.org/10.1080/09687599.2024.2385919
» https://doi.org/https://doi.org/10.1080/09687599.2024.2385919 -
CDGVSSA, [s.d.]. Conjunto de Dados Geoespacial Vetorial de Salvador Prefeitura Municipal de Salvador. Disponível em: Disponível em: http://cartografia.salvador.ba.gov.br/index.php/dados-geoespaciais/geoservicos Acesso em: 6 jun. 2025.
» http://cartografia.salvador.ba.gov.br/index.php/dados-geoespaciais/geoservicos - DOIRON, D. et al., 2022. Predicting walking-to-work using street-level imagery and deep learning in seven Canadian cities Scientific Reports, 12(1).
- ELOAH, A., QUEIROZ, N. and COELHO, L., 2021. Parametric Urbanism: multi-criteria optimization for a sustainable neighborhood in São José dos Campos In: Proceedings of the International Conference of the Iberoamerican Society of Digital Graphics, 25. São Paulo: Blucher, pp.351-364.
- FORSYTH, A., 2015. What is a walkable place? The walkability debate in urban design Urban Design International, 20(4), pp.274-292.
- HUANG, G. et al., 2023. Using Google Street View panoramas to investigate the influence of urban coastal street environment on visual walkability Environmental Research Communications, 5(6), 065017.
-
ITDP BRASIL, 2017. Índice de caminhabilidade. Disponível em: Disponível em: https://itdpbrasil.org/icam2/ Acesso em: 6 jun. 2025.
» https://itdpbrasil.org/icam2/ -
KANG, B., LEE, S. and ZOU, S., 2021. Developing sidewalk inventory data using street view images Sensors, 21, 3300. https://doi.org/10.3390/s21093300
» https://doi.org/https://doi.org/10.3390/s21093300 - LARRANAGA, A. et al., 2016. Estimando a importância de características do ambiente construído para estimular bairros caminháveis usando o best-worst scaling Transportes, 24(2), p.13.
- LIMA, D., LIMA, L. and SAMPAIO, A., 2021. Promover caminhabilidade: um ensaio para a promoção de saúde e qualidade de vida de brasileiros Espaço para a Saúde, 22, pp.1-9.
- LUCCHESI, S., URIARTE, A. and CYBIS, H., 2018. Aplicação da teoria de preços hedônicos para avaliação da influência da caminhabilidade no preço de venda de imóveis residenciais Transportes, 26(3), pp.120-133.
-
NEUHOLD, G. et al., 2017. The Mapillary Vistas Dataset for semantic understanding of street scenes In: Proceedings of the IEEE International Conference on Computer Vision (ICCV), pp.5000-5009. https://doi.org/10.1109/ICCV.2017.534
» https://doi.org/https://doi.org/10.1109/ICCV.2017.534 - PISCO, V. and MARQUES-NETO, H., 2021. Iwalk: uma solução para medição e análise da caminhabilidade de cidades com portais de dados abertos
-
QUINN, S. and ALVAREZ LEÓN, L., 2019. Every single street? Rethinking full coverage across street-level imagery platforms Transactions in GIS, 23(6), pp.1251-1272. https://doi.org/10.1111/tgis.12571
» https://doi.org/https://doi.org/10.1111/tgis.12571 - SAELENS, B.E. et al., 2002. Measuring perceived neighborhood environment factors related to walking/cycling Annals of Behavioral Medicine, 24, pp.S139-S152.
- SILVA, K., LEÃO, A. and KANASHIRO, M., 2019. Percepções do ambiente construído e sua associação com a caminhabilidade objetiva Revista de Morfologia Urbana, 7(2), e00084.
- VEGI, A. et al., 2020. Caminhabilidade e envelhecimento saudável: uma proposta de análise para cidades brasileiras de pequeno e médio porte Cadernos de Saúde Pública, 36(3).
- VELOSO, A., FRANÇA, I. and NETO, N., 2023. Índice de caminhabilidade: uma proposta metodológica. Revista Transporte y Territorio, 28, pp.214-236.
-
VIEIRA, R. and MORASTONI, R., 2013. Qualidade das calçadas na cidade de Camboriú/SC Revista Brasileira de Pesquisa em Turismo, 7(2), pp.239-259. https://doi.org/10.7784/rbtur.v7i2.516
» https://doi.org/https://doi.org/10.7784/rbtur.v7i2.516 - XIANXIONG, L. et al., 2016. An effective spherical panoramic LoD model for a mobile street view service Transactions in GIS , 21(5), pp.897-915.
- YANG, B., 2019. Developing a mobile mapping system for 3D GIS and smart city planning Sustainability.
- ZHANG, J., FUKUDA, T. and YABUKI, N., 2021. Automatic object removal with obstructed façades completion using semantic segmentation and generative adversarial inpainting IEEE Access, 9, pp.117486-117495.
The datasets generated during and/or analyzed during the current study are available from the corresponding author on reasonable request.

 Source: The authors (2024).
 Source: The authors (2024).
 Source: The authors (2024).
 Source: Google Street View (2022).
 Source: Google Street View (2022).
 Source: Google Street View (2022).
 Source: Google Street View (2022).
 Source: Google Street View (2022).
 Source: Google Street View (2022).