 Genotype-environment interactions in elephant grass: identifying superior genotypes for energy
Abstract
Elephant grass (Cenchrus purpureus (Schumach.) Morrone) combines high biomass potential with wide adaptability, making it a strategic crop for both forage and renewable energy production. Its broad genetic base provides opportunities for breeding programs aimed at improving dry matter yield (DMY) and stability across environments. In this study, genotype × environment interactions were investigated using the GGE biplot method. A randomized complete block design with three replications was adopted to evaluate genotypes across four harvests, considered as distinct environments. The first and second harvests accounted for the largest proportion of genotype variation, suggesting that early growth stages are the most informative for selection. Genotype G15 (FIII) produced an average of 18.2 t ha−1 of DMY, surpassing the overall mean by 12%, while G9 (FII) exhibited consistent performance across environments, indicating broad adaptability. Together, these results highlight G15 as a high‑yielding option and G9 as a stable genotype for energy applications. However, the study was limited to favorable conditions, and further trials under water stress and in additional environments are required to validate these recommendations.
Keywords:
elephant grass; dry matter; energy production; renewable energy; sustainable development
Resumo
O capim-elefante (Cenchrus purpureus (Schumach.) Morrone) combina elevado potencial de produção de biomassa com ampla adaptabilidade, configurando-se como uma cultura estratégica tanto para a produção de forragem quanto para a geração de energia renovável. Sua ampla base genética oferece oportunidades para programas de melhoramento voltados ao aumento da produtividade de matéria seca (PMS) e à estabilidade entre ambientes. Neste estudo, as interações genótipo × ambiente foram investigadas por meio do método GGE biplot. Utilizou-se o delineamento em blocos ao acaso, com três repetições, para avaliar os genótipos em quatro cortes, considerados como ambientes distintos. O primeiro e o segundo cortes responderam pela maior proporção da variação entre genótipos, sugerindo que os estádios iniciais de crescimento são os mais informativos para a seleção. O genótipo G15 (FIII) apresentou média de 18,2 t ha−1 de PMS, superando a média geral em 12%, enquanto o genótipo G9 (FII) demonstrou desempenho consistente entre os ambientes, indicando ampla adaptabilidade. Em conjunto, esses resultados destacam o G15 como uma opção de alto rendimento e o G9 como um genótipo estável para aplicações energéticas. Contudo, o estudo foi conduzido sob condições favoráveis, sendo necessários ensaios adicionais sob estresse hídrico e em ambientes distintos para validar essas recomendações.
Palavras-chave:
capim-elefante; matéria seca; produção de energia; energia renovável; desenvolvimento sustentável
1. Introduction
The energy market exerts a significant influence on income and employment levels in the Brazilian economy, including the northern region of the state of Rio de Janeiro (Novo et al., 2016). Escalating costs associated with fossil fuel-generated energy and the environmental impacts stemming from their intensive use have brought the search for renewable energy sources to the forefront of the international political agenda (Uczai et al., 2012). Consequently, the key challenge is to satisfy future energy demand while maintaining current levels of renewable energy use. This necessitates exploring new sources and processes, including the cultivation of energy-producing plant species such as elephant grass (Cenchrus purpureus (Schumach.) Morrone), which could be developed into sustainable businesses.
The pursuit of renewable energy sources, such as elephant grass, is directly aligned with the Sustainable Development Goals (SDGs) of the 2030 Agenda (UN Brazil, 2015). This is particularly true for SDG 7, which seeks to ensure access to affordable, reliable, sustainable, and modern energy for all. Moreover, by fostering the transition toward clean energy and reducing dependence on fossil fuels, it also contributes to SDG 13, which emphasizes urgent action to combat climate change and its impacts. Additionally, the development of sustainable enterprises based on bioenergy production supports SDG 8, aimed at promoting inclusive and sustainable economic growth, full and productive employment, and decent work for all. Therefore, the exploration of novel renewable energy sources, such as elephant grass, not only meets future energy demands but also promotes regional economic development in a sustainable way.
Elephant grass displays desirable attributes for its utilization in renewable energy production. Its stem, characterized by fibrous and dense tissue, encompasses bark, pith, and vascular bundles, resembling the morphological structure found in sugarcane bagasse (Saccharum spp.) (Marafon et al., 2016). Recognizing these advantageous features and their alignment with energy requirements in the global economy (Naddeo and Taherzadeh, 2021), research has been conducted, particularly in the field of genetics and plant breeding, aimed at optimizing the utilization of elephant grass biomass (Rocha et al., 2017). In pursuit of this objective, novel selection criteria have been implemented to enhance the plant's suitability for energy-related applications.
The genotype-by-environment (GE) is a major constraint in breeding programs, hampering efficiency due to its limited insights into genotype behavior across diverse environments. Consequently, analyses focusing on adaptability and stability are conducted, facilitating the identification of cultivars with consistent performance and responsiveness to environmental fluctuations, whether within specific contexts or broader scenarios (Cruz et al., 2012).
Trials aimed at assessing stability and adaptability, often referred to as multi-environment trials (MET), are conducted worldwide for various crops (Dehghani et al., 2006; Olivoto et al., 2019; Souza et al., 2023). These trials serve not only to pinpoint high-yielding cultivars but also to ascertain locations that best represent the target environment. In these trials, genotypes are tested in different locations and years to assess crop adaptation, and it is often difficult to determine the pattern of genotypic responses across environments without the use of appropriate analytical tools, such as GGE Biplot (Yan et al., 2000; Yang et al., 2009; Ceccon et al., 2021).
Therefore, the objective of this study is to assess performance and identify superior elephant grass genotypes with robust dry matter yield and stability, suitable for use in sustainable agriculture.
2. Material and Methods
The study was conducted at the Experimental Station of the State Center for Research in Agroenergy and Waste Utilization (CEPAAR, PESAGRO-RIO), located in Campos dos Goytacazes, northern Rio de Janeiro State, Brazil (21°19’23” S, 41°19’40” W; 25 m above sea level).
The regional climate is classified as Aw according to the Köppen system (Köppen, 1948), characterized as tropical, hot, and humid, with a dry winter and a rainy summer. The mean annual precipitation is about 1.152 mm.
2.1. Plant material
To carry out the crosses, we used the parents IJ7125, Taiwan A46, Elefante Cachoeiro de Itapemirim, Cuba 116, and Mineirão IPEACO, obtained from the Germplasm Bank of the State University of Northern Rio de Janeiro. These parents were selected to establish four full-sib families, based on pollen availability and desirable traits for biomass production.
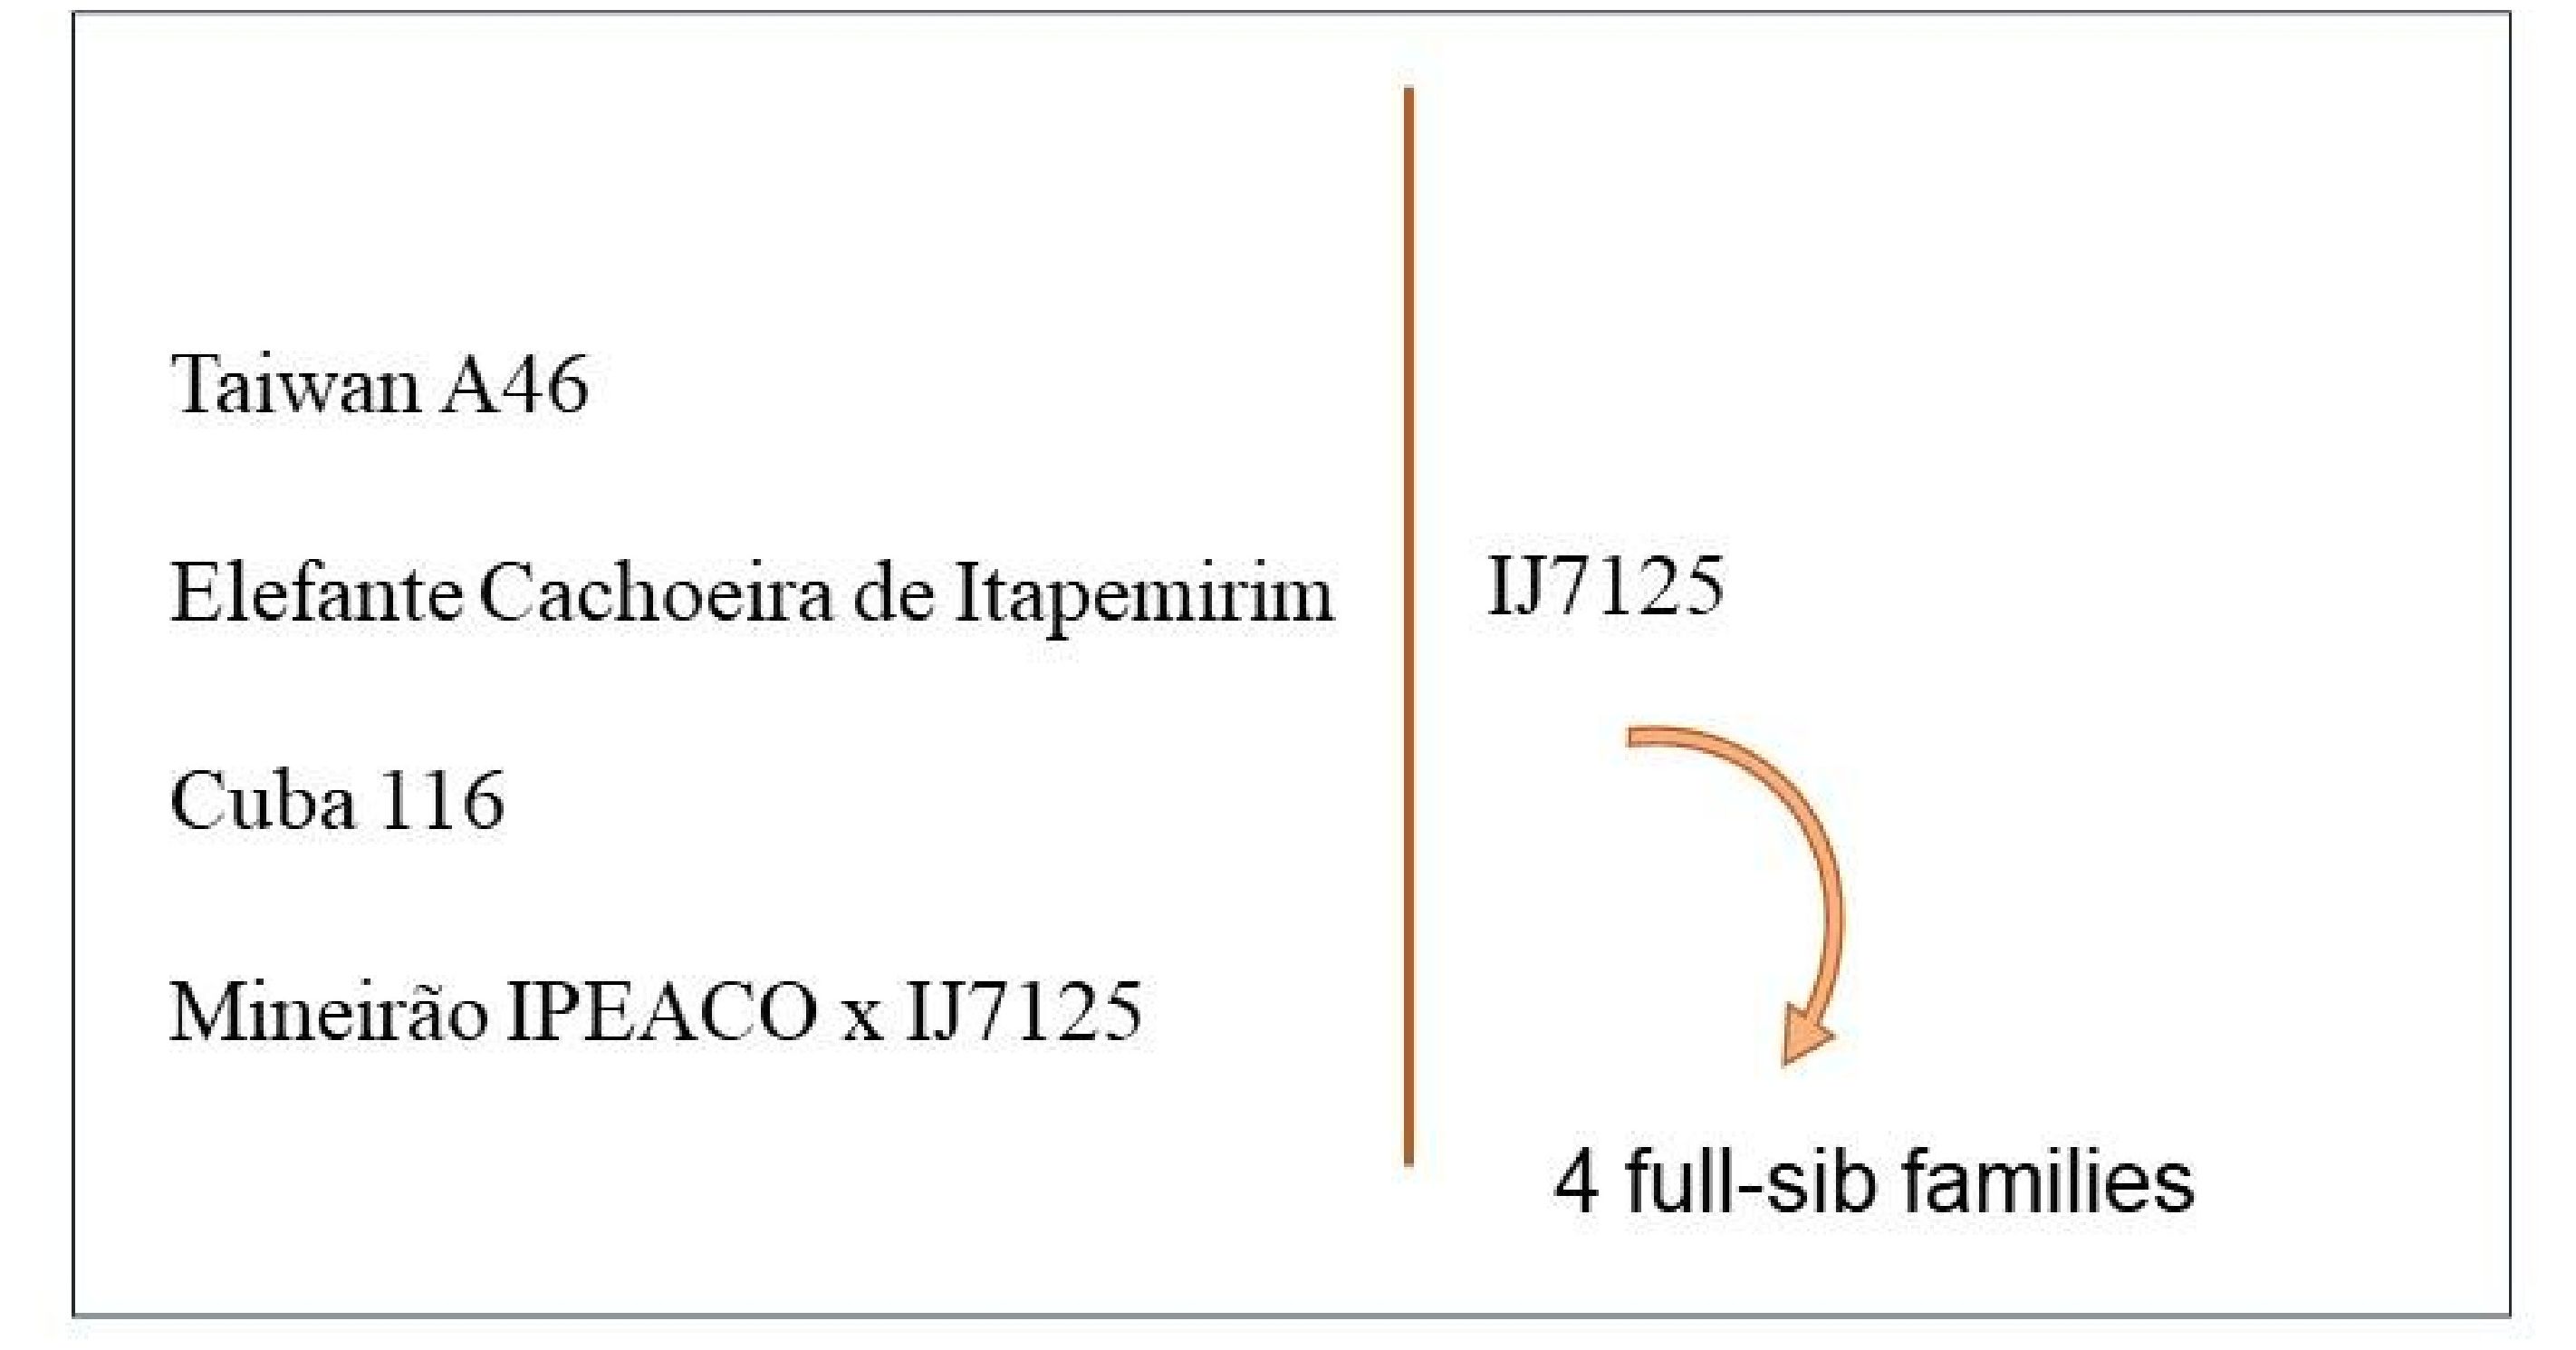
Crosses were performed using IJ7125 as the pollen donor and the other genotypes (Taiwan A46, Elefante Cachoeira de Itapemirim, Cuba 116, and Mineirão IPEACO) as recipients. After the manual crosses between the parental genotypes and seed harvest, sowing was carried out in 128-cell polystyrene trays filled with Florestal ®. The seedlings were transplanted to the field when they reached 20 cm in height, approximately 40 days after germination. The resulting full-sib families were: FI – Taiwan A46 × IJ7125; FII – Elefante Cachoeiro de Itapemirim × IJ7125; FIII – Cuba 116 × IJ7125; and FIV – Mineirão IPEACO × IJ7125 (Figure 1).

Crosses performed to generate four full-sib families (Family I: Taiwan A46 × IJ7125; Family II: Elefante Cachoeira de Itapemirim × IJ7125; Family III: Cuba 116 × IJ7125; and Family IV: Mineirão IPEACO × IJ7125). Campos dos Goytacazes, Rio de Janeiro, Brasil.
2.2. Experimental design
The experiment followed a randomized block design with three replications. Each block included 20 genotypes from four families, with five plants per plot, spaced 1.5 m apart both between and within rows. Four harvests were carried out at intervals of 8-10 months, considered optimal for biomass production (Freitas et al., 2018).
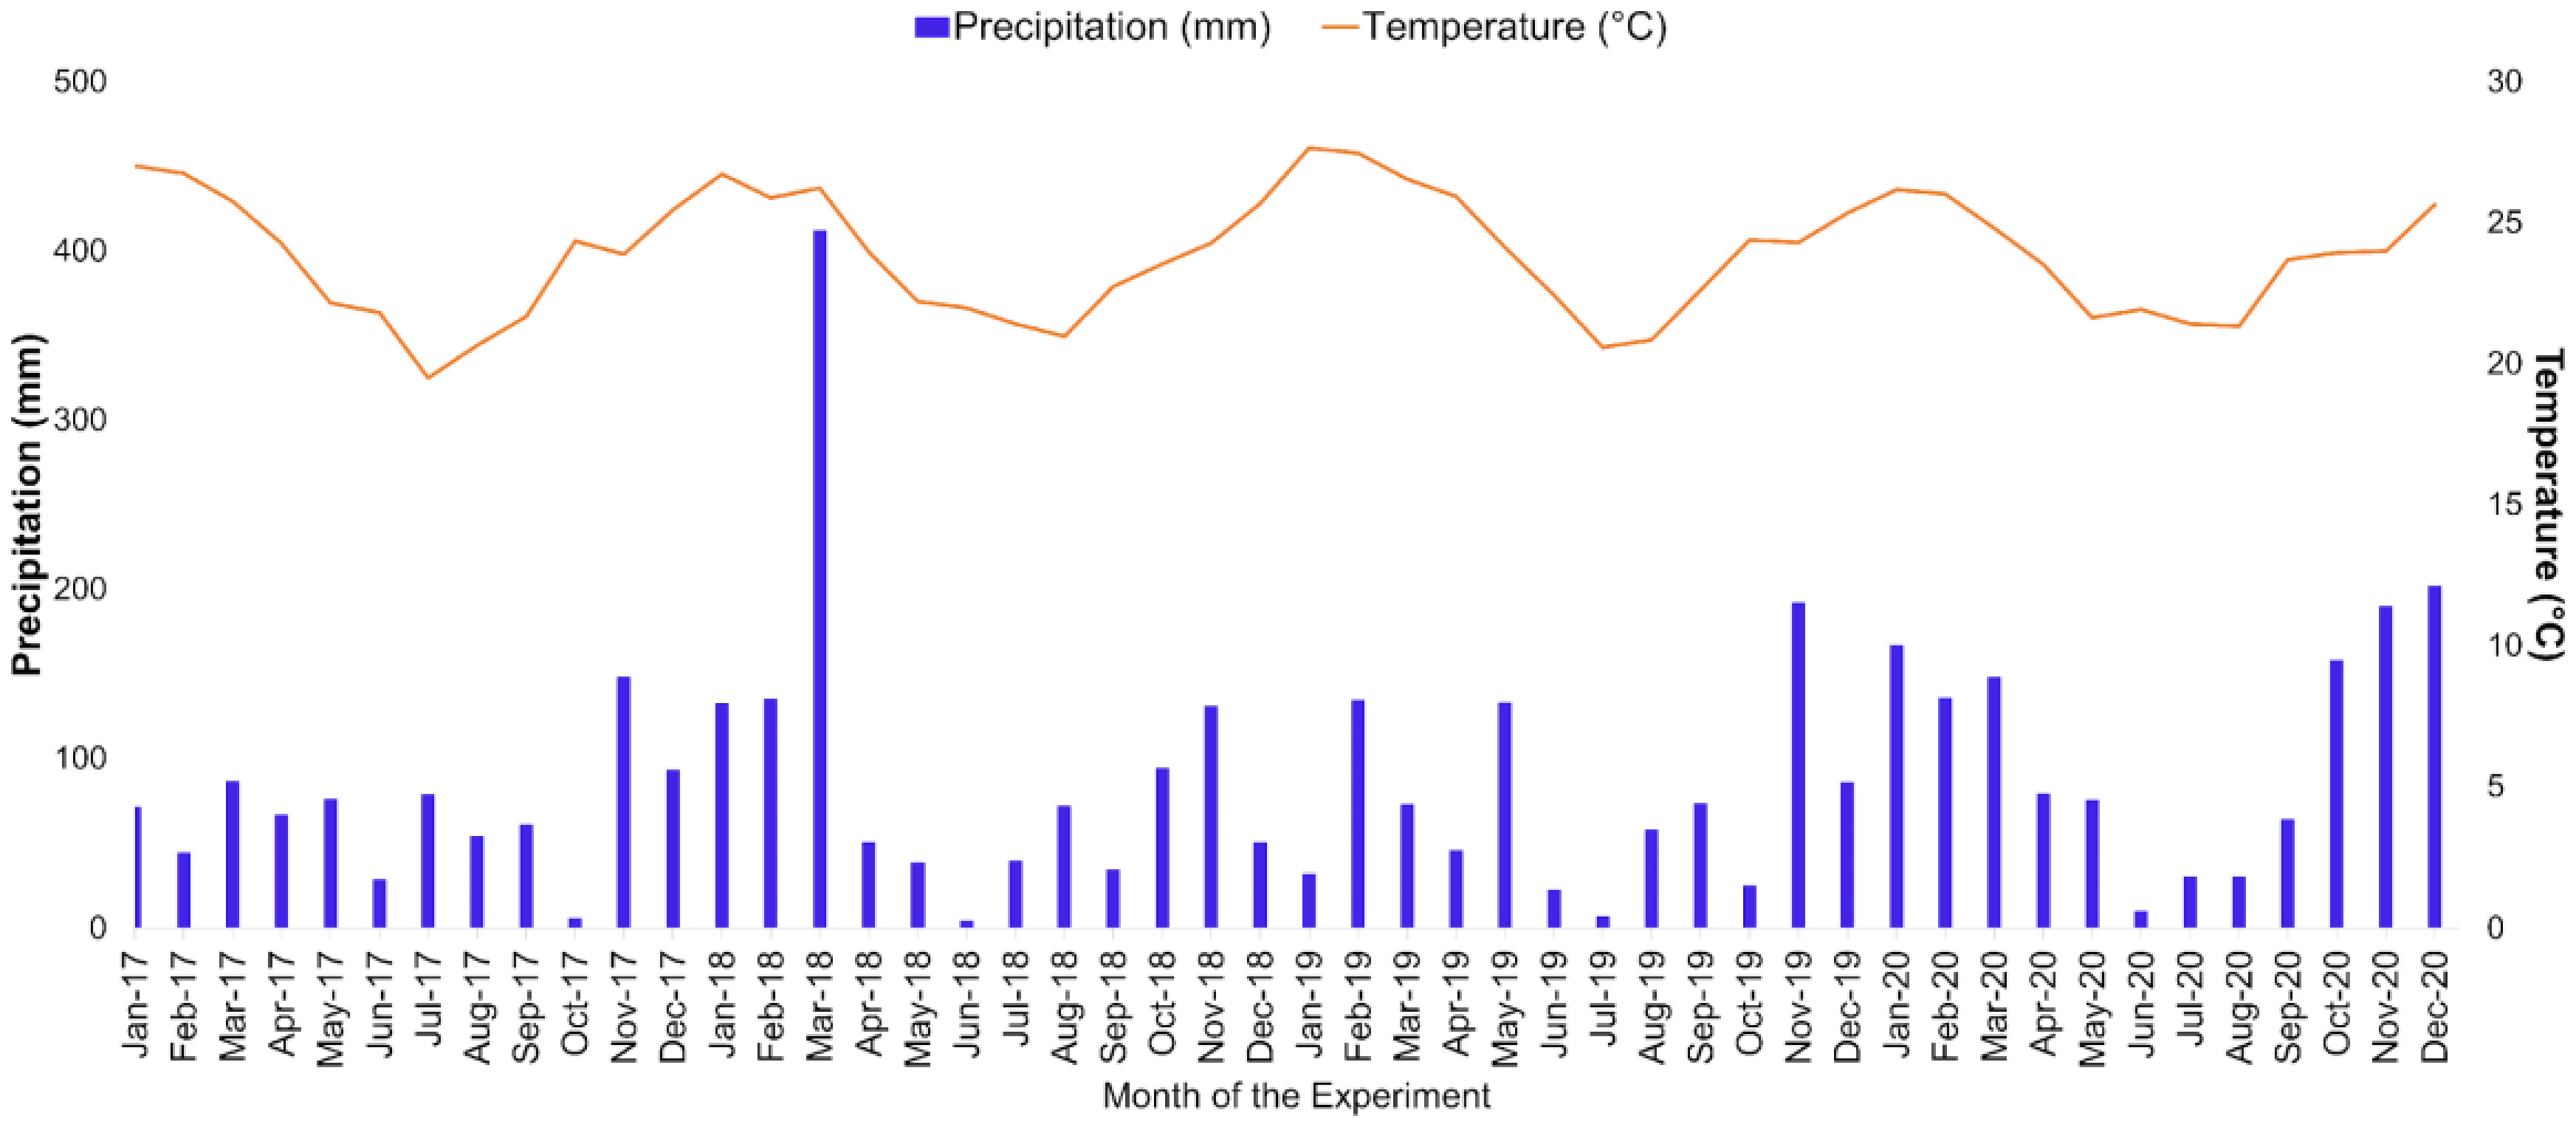
The experiment began in October 2017, and the first harvest was conducted in August 2018 (10 months later), during the period of highest rainfall. The subsequent harvests were carried out in April 2019 (eight months later), December 2019 (eight months later), and September 2020 (nine months later) (Figure 2).
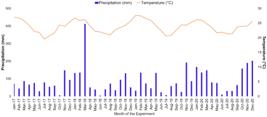
Temperature and precipitation during the months of the experiment. Campos dos Goytacazes, Rio de Janeiro, Brasil.
2.3. Evaluation of morphoagronomic traits
2.3.1. Green matter production (GMP)
This trait corresponds to the total weight of the green matter from all plants within a clump originating from a single seed. From this clump, a sample composed of three tillers was collected, chopped, and placed into a labeled paper bag for subsequent determination of dry matter content (%DM).
2.3.2. Dry matter percentage (%DM)
The harvested material was chopped, labeled, weighed, and then subjected to a drying process in an oven set at 65 °C for a period of 72 h. Following this, the samples were weighed once again to obtain the air-dried weight (ADW), according to Silva and Queiroz (2002). This measurement is expressed as a percentage. The dried material was further ground in a Wiley mill, utilizing a 1-mm sieve, and subsequently packaged in plastic bags for the determination of oven-dried weight (ODW). To determine ODW, 2 g of each ground sample were dried at 105 °C for 18 h. The re-weighed material provided the dry matter percentage, following Silva and Queiroz (2002).
2.3.3. Plant dry matter yield (DMY)
Dry matter yield is calculated by multiplying the green matter production of the plot by the dry matter percentage. Results were expressed in t ha-1 (Equation 1).
2.4. Statistical analysis
An analysis of variance (ANOVA) was first conducted using the Genes software (Cruz, 2013) to test for genetic variability among genotypes. The statistical model was (Equation 2):
where is the observed value in plot i, block j, and subplot k; μ is the overall mean; is the effect of plot i; is the effect of block j; is the residual associated with plots; is the effect of subplot k; is the residual associated with subplots; is the plot × subplot interaction; and is the residual of the interaction.
Dry matter yield (DMY) across four harvests, considered as distinct environments, was analyzed in R (version 4.5.1; R Core Team, 2025) using the GGE Biplot method, according to the model (Equation 3):
where is the mean performance of genotype i in environment j; is the overall mean; is the random effect of genotype i; is the fixed effect of environment j; and is the random interaction effect between genotype i and environment j.
In the GGE Biplot, the genotype effect (G) and the genotype × environment interaction (GE) are combined into multiplicative terms (Equation 4):
where is the main effect of environment j; and are the scores of genotype i on the first and second principal components (PC1 and PC2); and are the scores of environment j on PC1 and PC2; and is the residual. Biplots were generated using singular value decomposition (SVD) (Equation 5):
where and are the largest eigenvalues of PC1 and PC2; and are the eigenvectors of genotype ; and and are the eigenvectors of environment (Yan, 2001).
Both analyses, ANOVA and GGE Biplot, were performed for the main trait of interest, dry matter yield (DMY).
3. Results and Discussion
An analysis of variance (ANOVA) was performed to test the significance of the sources of variation. According to the F-test at the 5% probability level, the 20 evaluated genotypes showed significant differences across plot, subplot, and interaction effects, indicating substantial variability among genotypes and across harvests (Table 1). The significance of genotypes indicates the presence of genetic variability and enables the identification of promising genotypes to be used in breeding programs aimed at higher productivity (Shimoya et al., 2002). This variability directly influenced green matter production and, consequently, the dry matter yield obtained in each harvest.
A significant genotype × environment (harvest) interaction was also detected, showing that genotypic performance varied across environments and leading to different rankings of genotypes for productivity (Table 1). The detection of a significant G×E interaction highlights the environmental influence on the phenotypic expression of the evaluated traits. For breeding programs, this underscores the importance of multi-environment trials, allowing the selection of genotypes with superior mean performance for traits of interest and demonstrating stability. This emphasizes the relevance of studies like this, as the presence of G×E is a recurring challenge in plant breeding, directly impacting the release of new cultivars with the Ministry of Agriculture and Livestock (MAPA).
The coefficient of variation (CV) recorded in the multi-environment trial was 13.34%, which is considered medium. In field experiments with agricultural crops, CV values below 10% are classified as low, values between 10% and 20% as medium, 20% to 30% as high, and values above 30% as very high (Pimentel-Gomes, 2023). Thus, the present trial demonstrated acceptable experimental precision. However, it should be noted that broad classifications such as this one are often criticized for failing to consider the nature of the experiment, the crop, and the traits under evaluation. Therefore, it is of particular interest for breeding programs that each crop establishes its own specific classification.
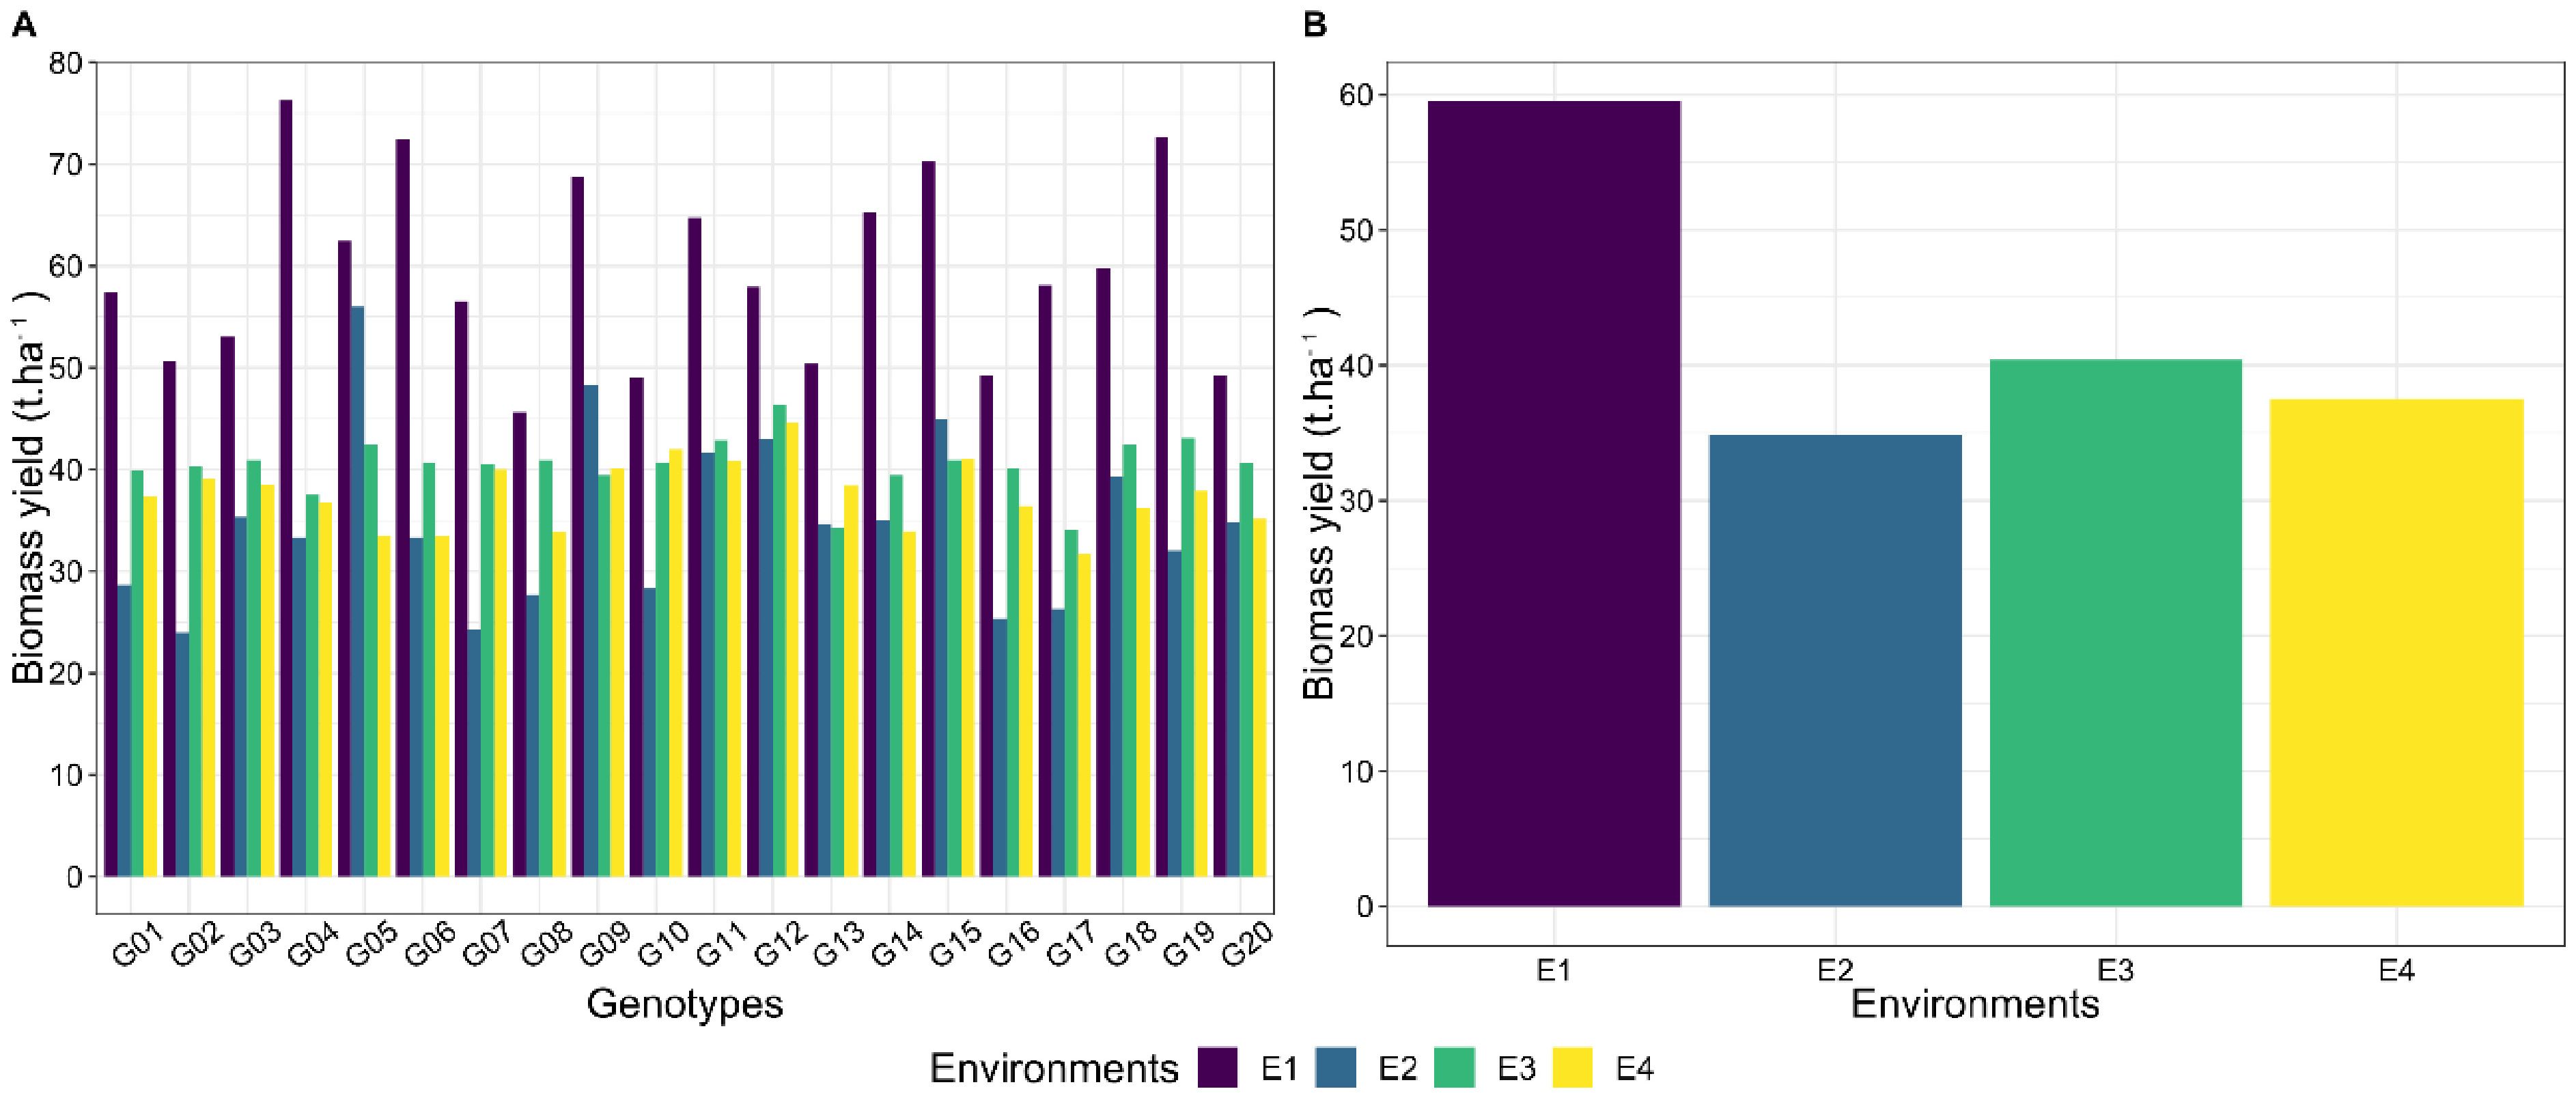
Among the evaluated materials, G04 (FI) and G19 (FIV) showed the highest dry matter yield (DMY), followed by G06 (FII). The first harvest produced the highest yields for all genotypes (Figure 3A). G04 (FI) reached its maximum DMY in this initial harvest but declined in later assessments. A similar pattern was observed for G19 (FIV) and G06 (FII), reflecting inconsistency in dry matter production across harvests (Figure 3A).
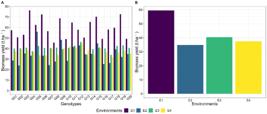
Average biomass yield of 20 genotypes in four environments (A); Yield in the four environments (harvest times) (B). Genotypes: G01, G02, G03, G04, G05 (Family - I IJ7125 × Taiwan A46); G06, G07, G08, G09, G10 (Family II - IJ7125 × Elefante Cachoeira de Itapemirim); G11, G12, G13, G14, G15 (Family III - IJ7125 × Cuba 116); and G16, G17, G18, G19, G20 (Family IV - IJ7125 × Mineirão IPEACO). Environments (harvest times): E1 (10 months), E2 (+ 8 months), E3 (+ 8 months), E4 (+ 9 months). Campos dos Goytacazes, Rio de Janeiro, Brasil.
This result contrasts with that reported by Queiroz Filho et al. (2000), who found that advancing the cutting age of purple elephant grass led to an increase (quadratic behavior) in total dry matter content. Martins-Costa et al. (2008) observed that there is no consistent trend of increase or decrease across different cutting ages, showing both rises and declines; however, their results are in agreement with those of the present study, demonstrating that the oldest cutting age presented the lowest values. This indicates that, for this trait, variations exist in relation to previously reported findings in the scientific literature.
The average dry matter yield (DMY) in harvest 1 was 59.49 t ha-1, decreasing to 34.83 t ha-1 in harvest 2, followed by 40.38 t ha-1 in harvest 3 and 37.54 t ha-1 in harvest 4 (Figure 3B). These results highlight the biomass production potential of elephant grass, which is influenced by factors such as regrowth capacity, water availability, and light conditions. For the cultivar BRS Capiaçu, Pereira et al. (2016, 2021) reported dry matter yields of approximately 50 t ha−1 yr−1 in Minas Gerais, highlighting it as the most productive cultivar among those evaluated within the genus. These results demonstrate the high productive potential of the genotypes assessed in the present study, since, in the first harvest, they achieved higher productivity than an elite cultivar, even under highly managed, technologically advanced conditions.
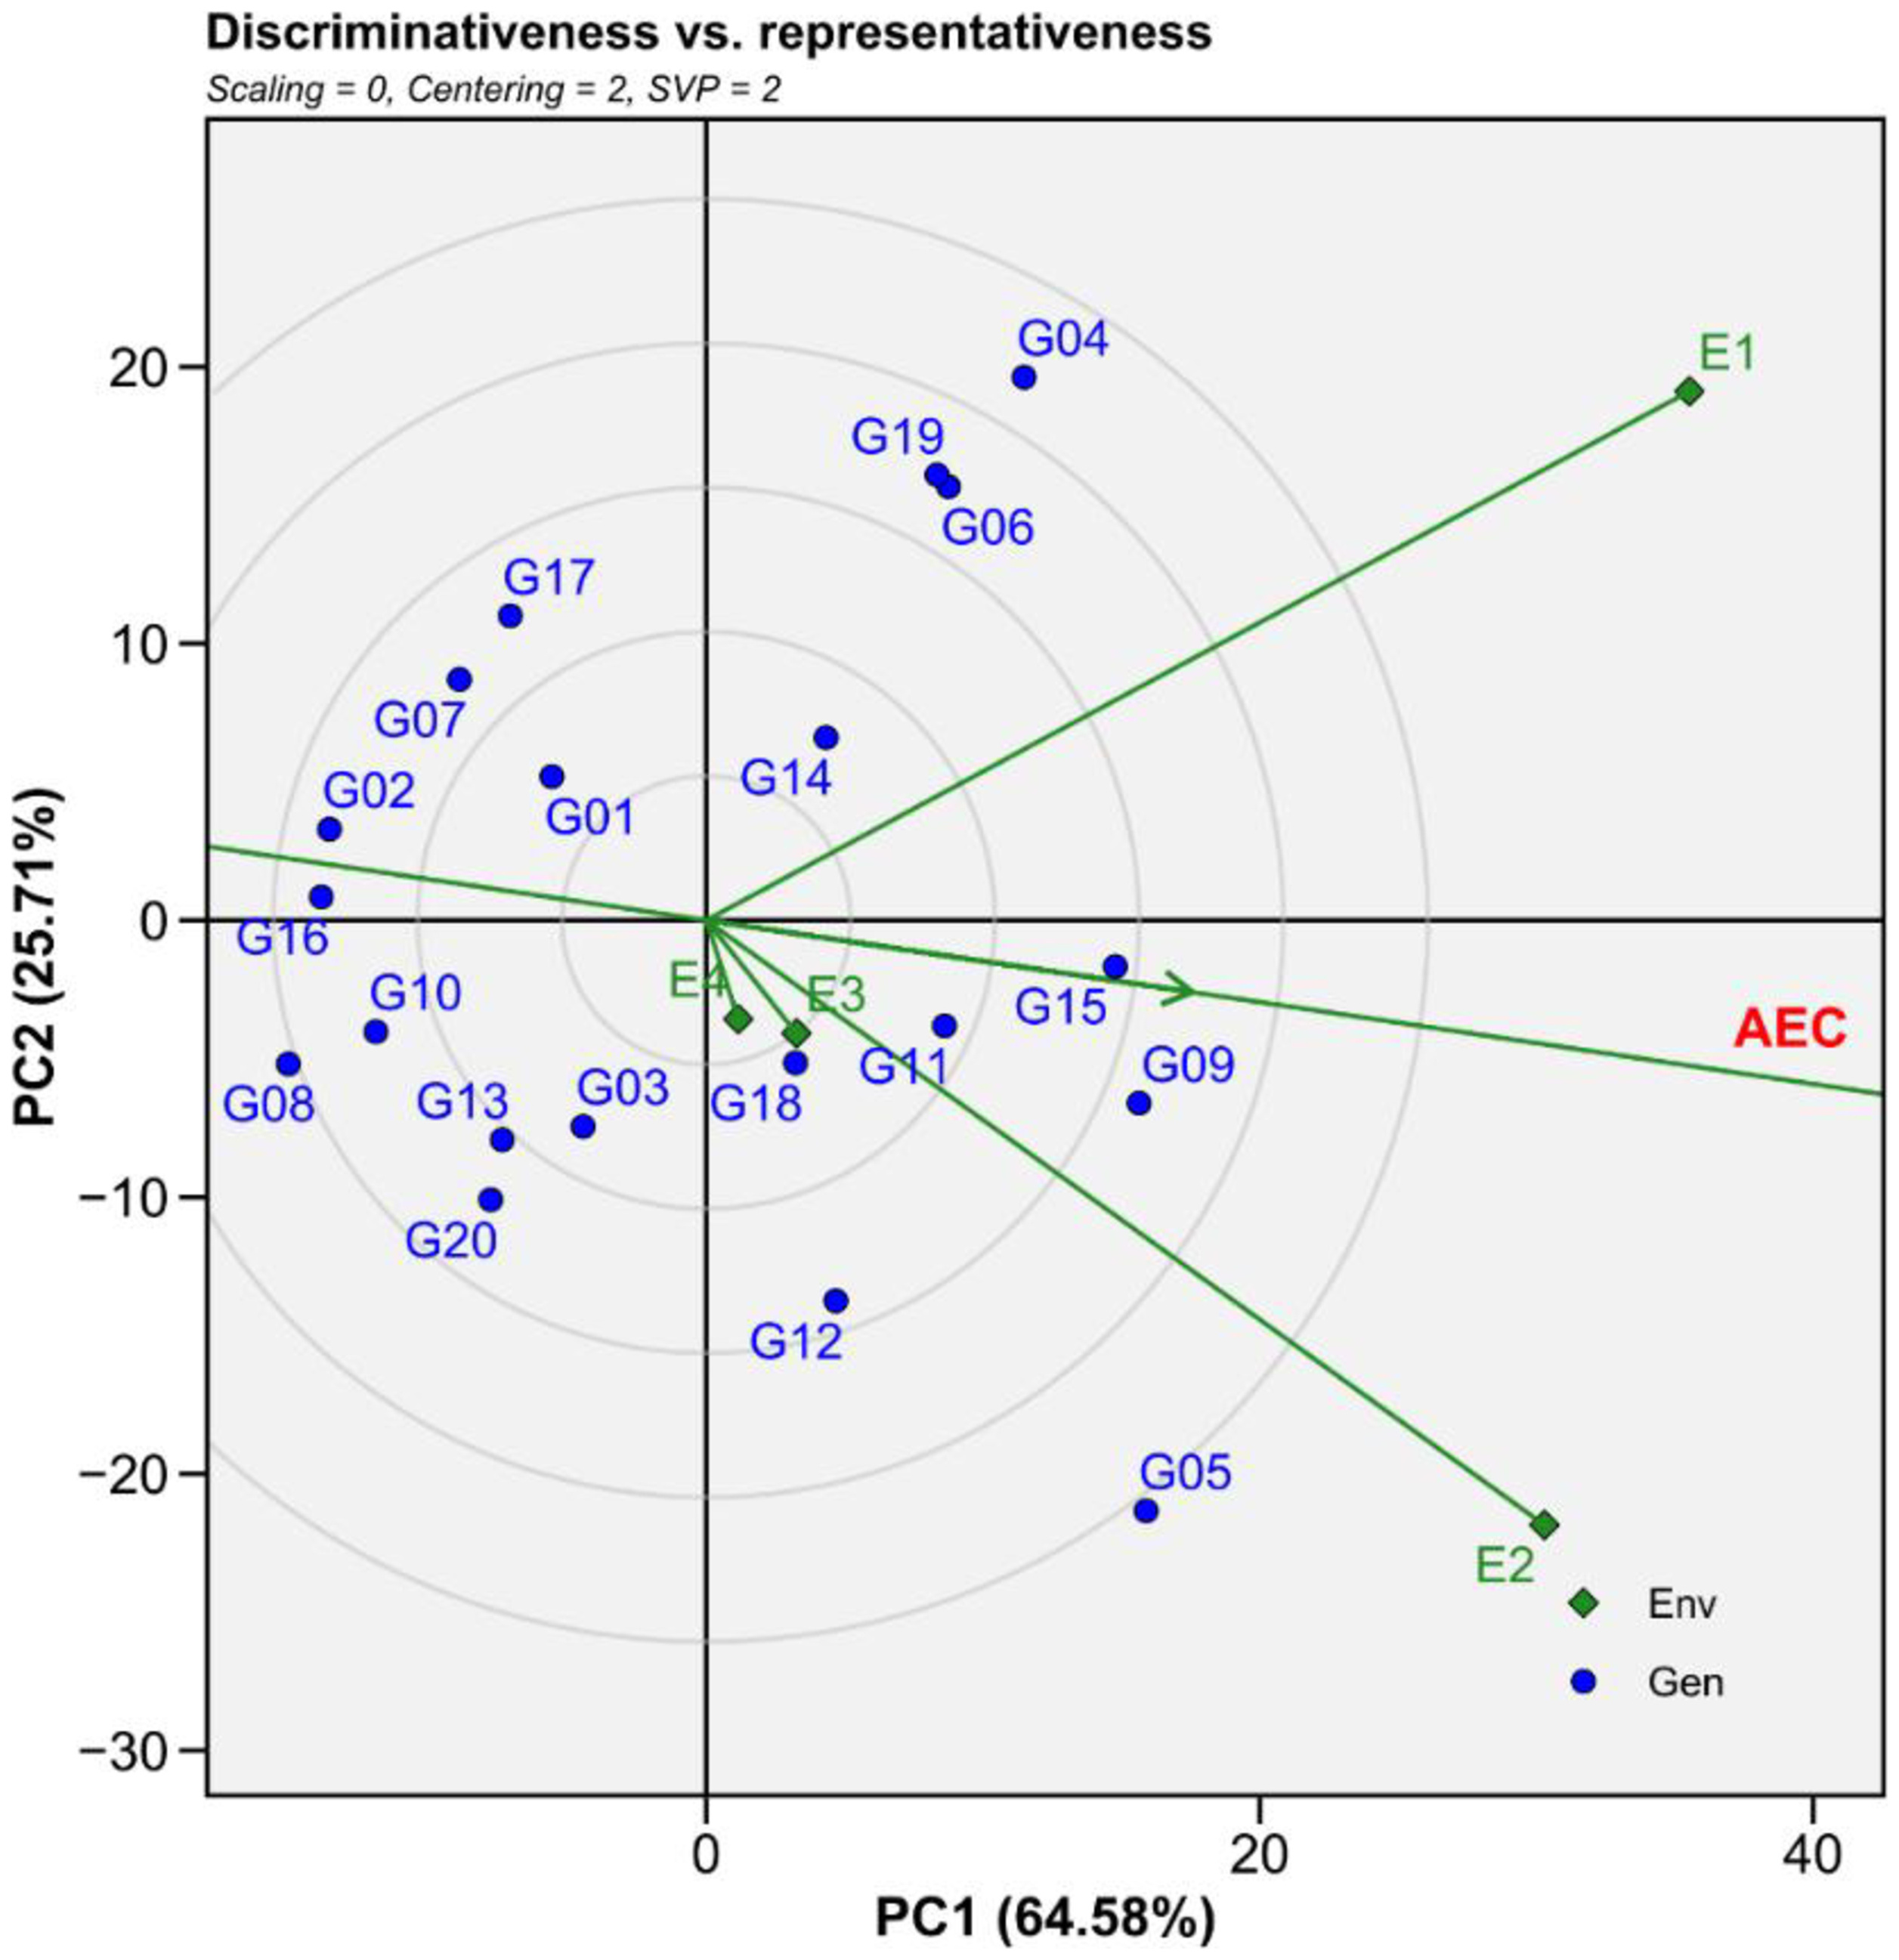
Genotype performance across harvests was further assessed using the GGE Biplot method. The first two principal components explained 64.58% and 25.71% of the variation, respectively, totaling 90.29% (Figure 4, 5, 6 and 7). In a similar study on elephant grass, Gravina et al. (2020) reported 70.07% of the variation explained by the first two components, while Yang et al. (2009) considered values above 60% reliable for interpreting genotype × environment interactions.
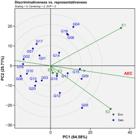
“Discriminativeness vs. Representativeness” Biplot depicting the view of environment vectors. Greater environment vector = greater discriminant power; Smaller angle between the environment vector and the AEC axis = greater representativeness. Angles between vectors <90° = positive correlation; Angles between vectors >90° = negative correlation; Angles between vectors = 90° = zero correlation; Genotypes: G01, G02, G03, G04, G05 (Family I: Taiwan A46 × IJ7125); G06, G07, G08, G09, G10 (Family II: Elefante Cachoeira de Itapemirim × IJ7125); G11, G12, G13, G14, G15 (Family III: Cuba 116 × IJ7125); and G16, G17, G18, G19, G20 (Family IV: Mineirão IPEACO × IJ7125). Environments (harvest times): E1 (10 months), E2 (+ 8 months), E3 (+ 8 months), E4 (+ 9 months). AEC (average-environment coordination). PC1: principal component 1; PC2: principal component 2. Campos dos Goytacazes, Rio de Janeiro, Brasil.
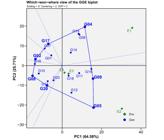
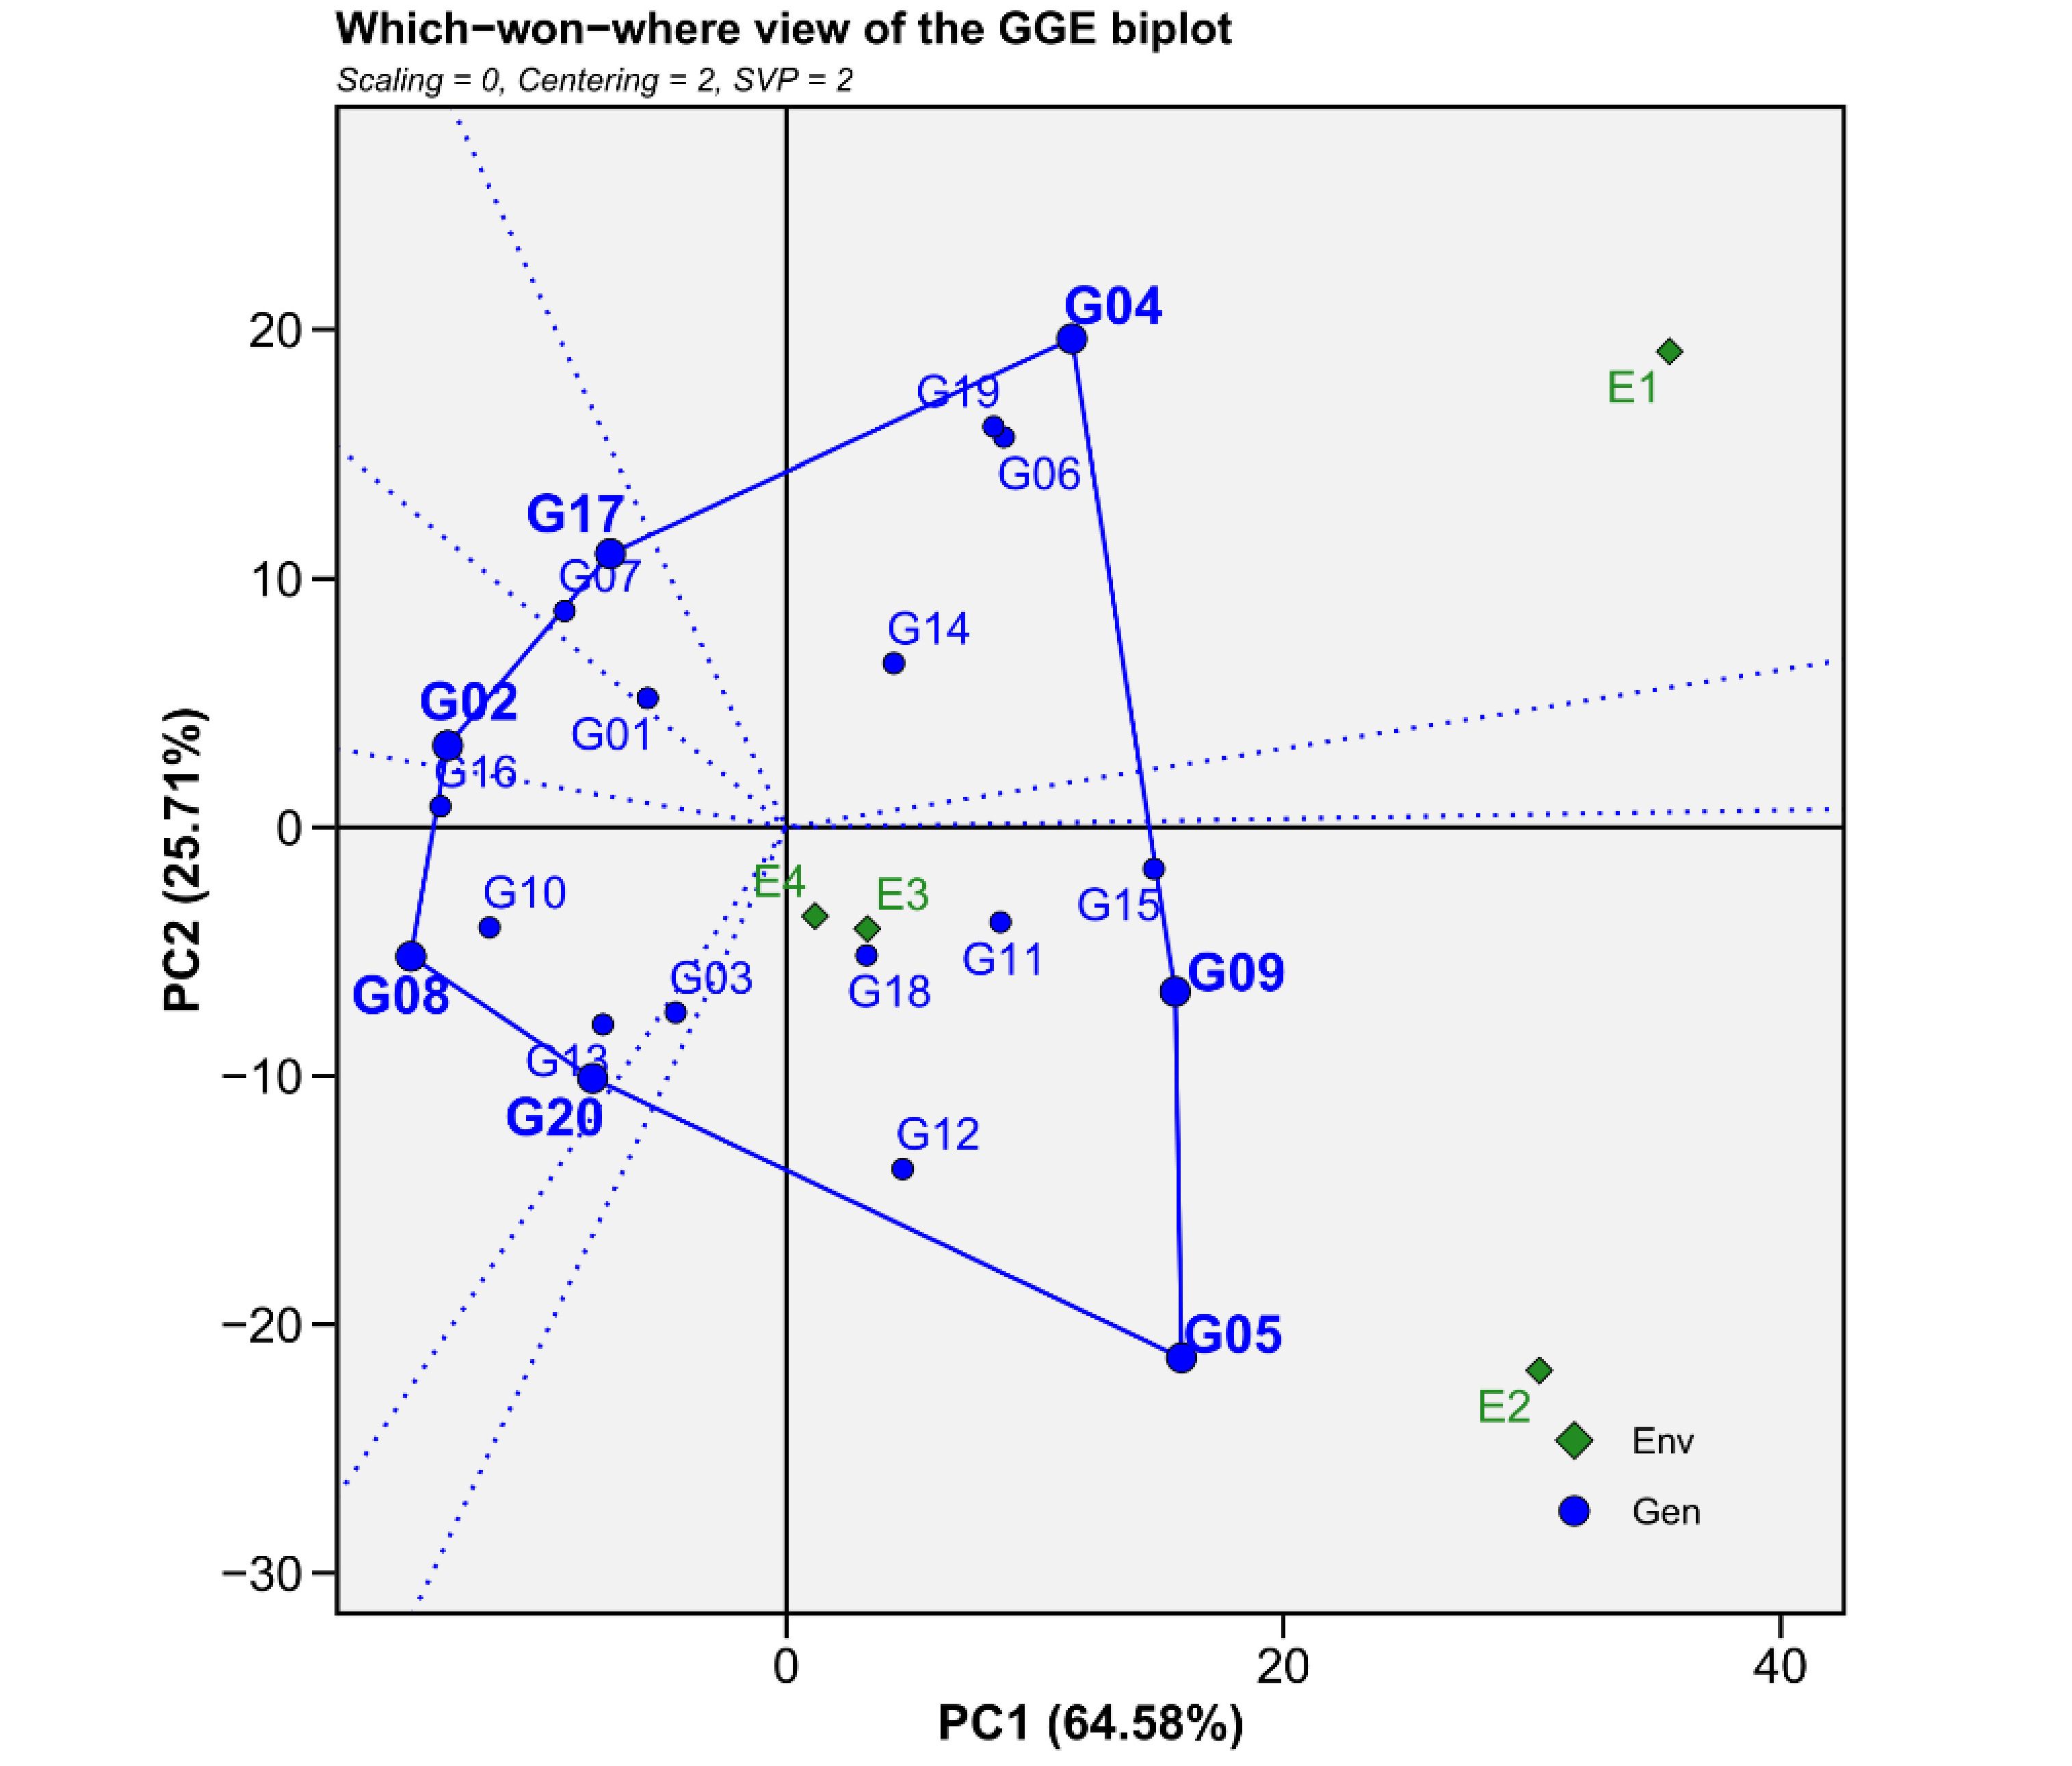
“Which-Won-Where” Biplot depicting a polygon indicating the high-performance genotypes at the vertex points. Genotypes: G01, G02, G03, G04, G05 (Family I: Taiwan A46 × IJ7125); G06, G07, G08, G09, G10 (Family II: Elefante Cachoeira de Itapemirim × IJ7125); G11, G12, G13, G14, G15 (Family III: Cuba 116 × IJ7125); and G16, G17, G18, G19, G20 (Family IV: Mineirão IPEACO × IJ7125). Environments (harvest times): E1 (10 months), E2 (+ 8 months), E3 (+ 8 months), E4 (+ 9 months). PC1: principal component 1; PC2: principal component 2. Campos dos Goytacazes, Rio de Janeiro, Brasil.
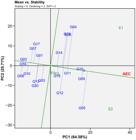
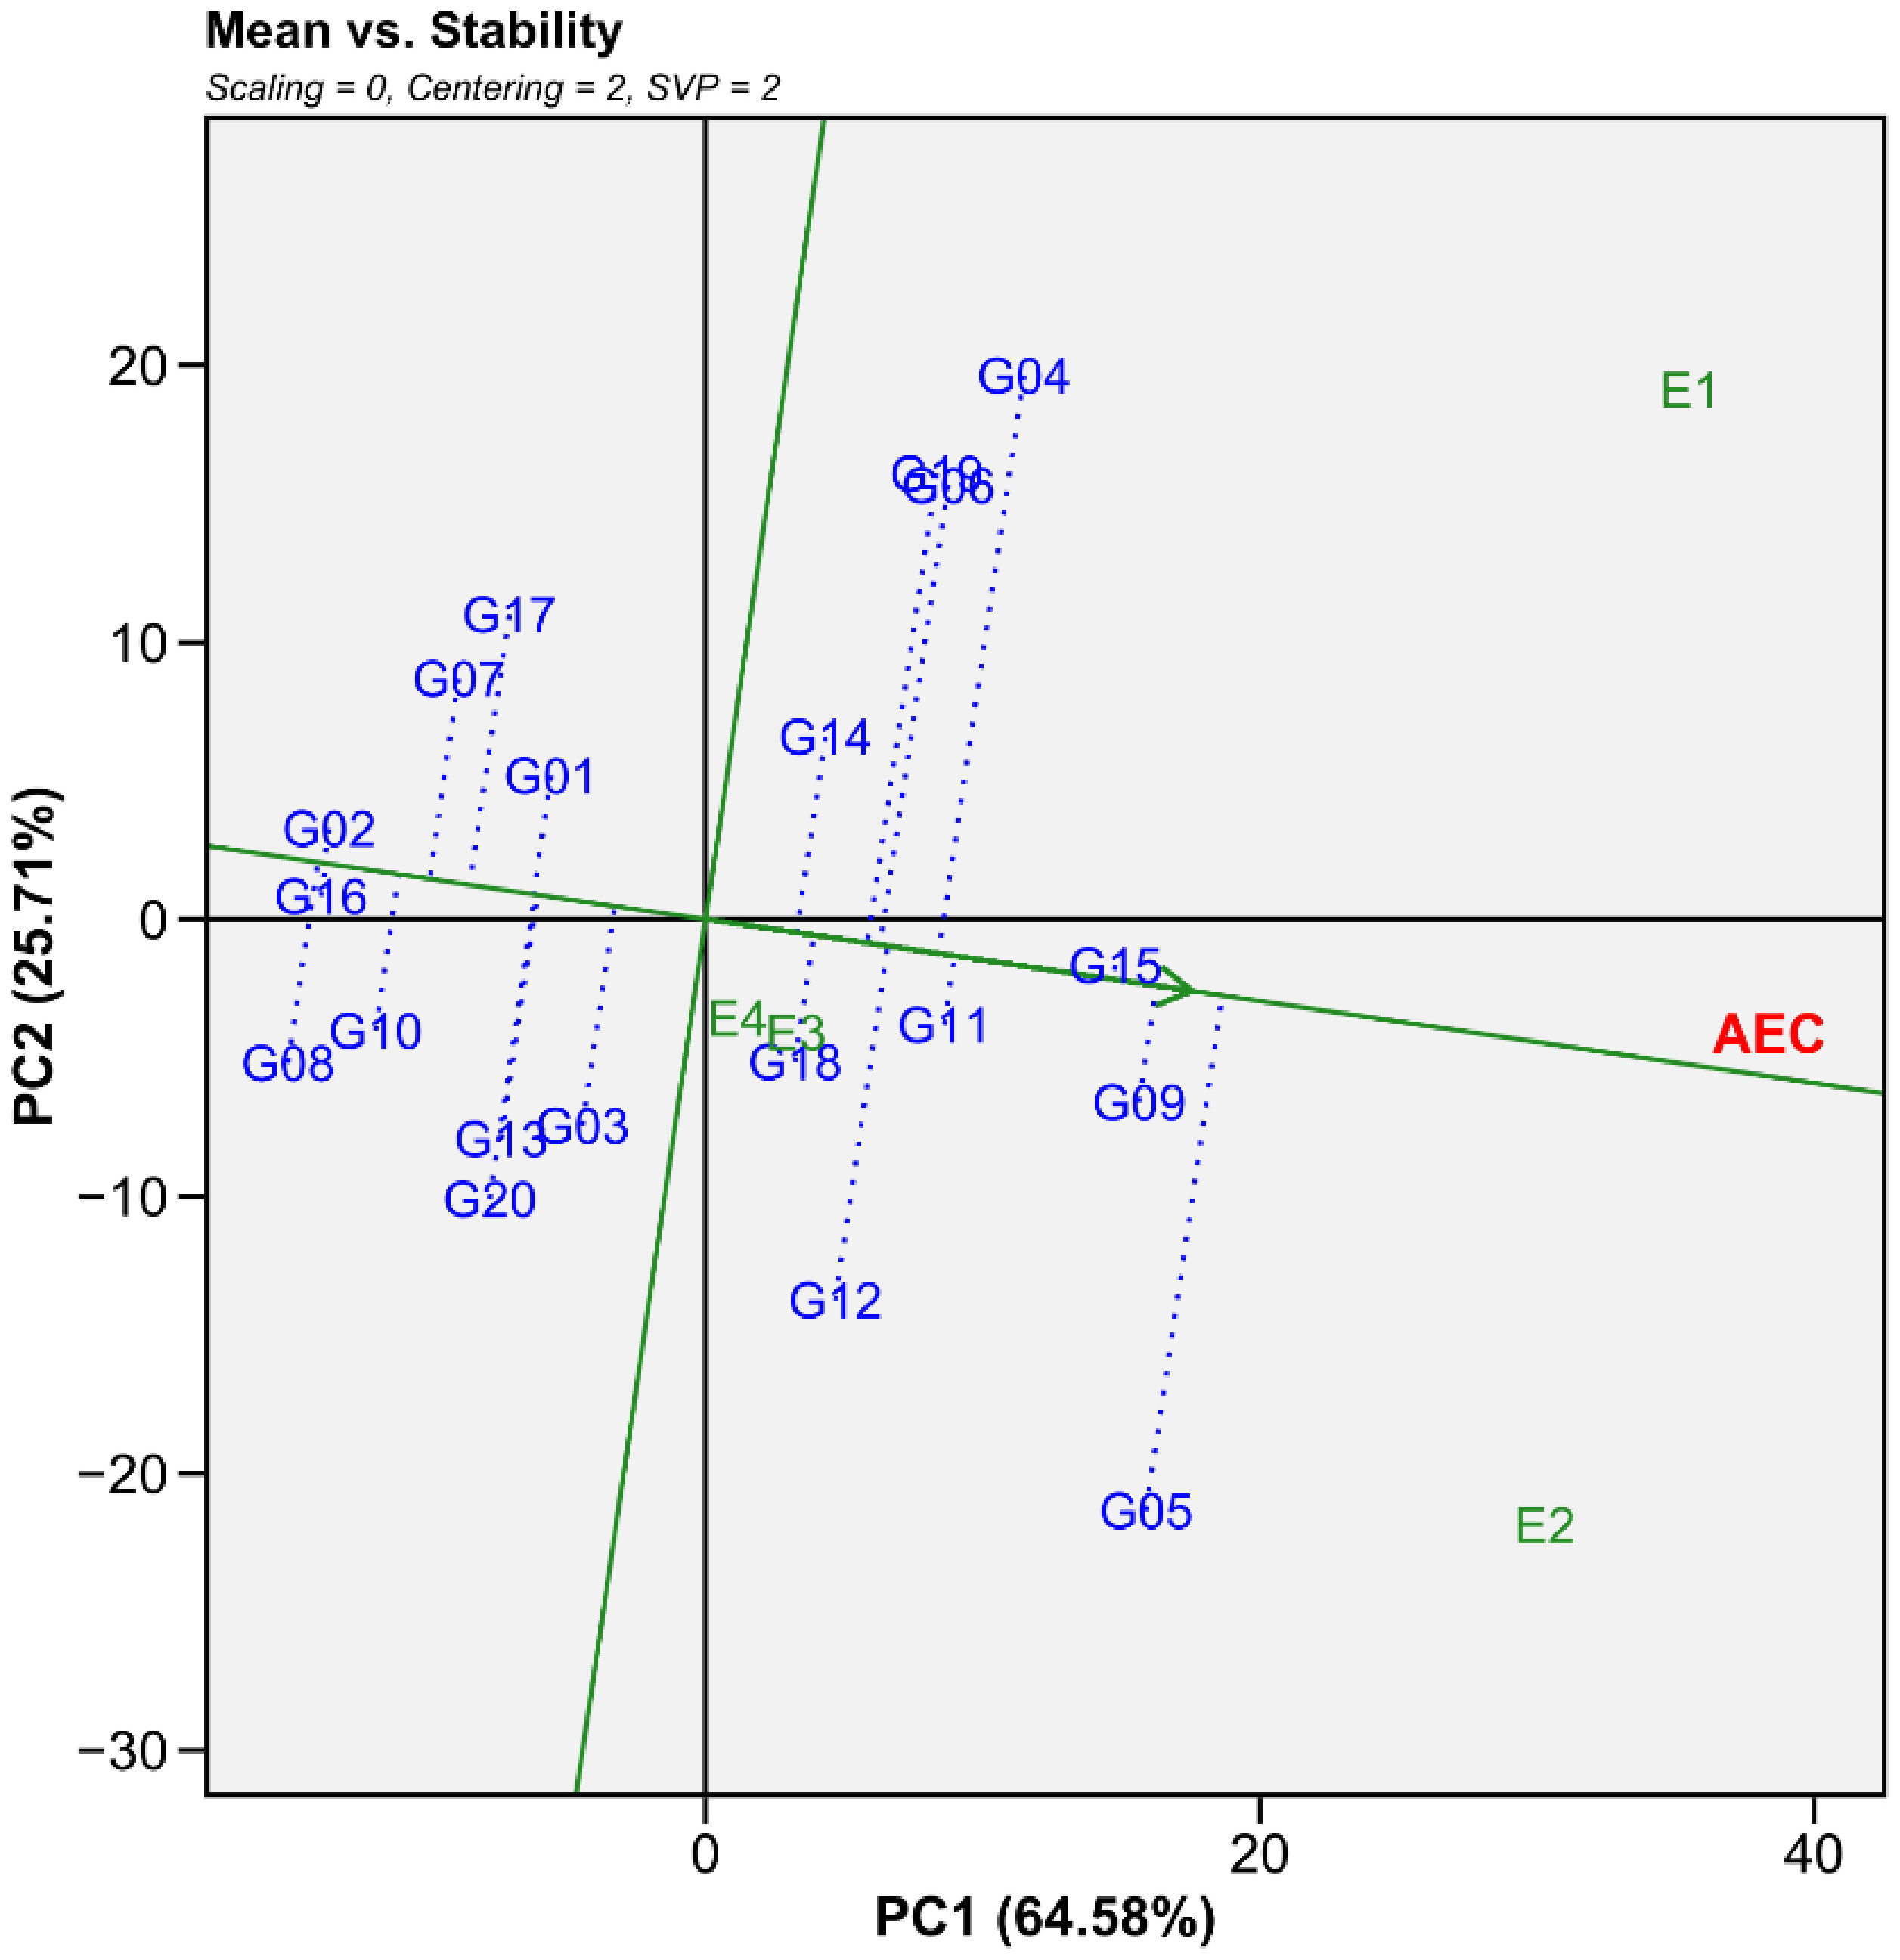
“Mean vs. Stability” Biplot showing the average performance of the genotypes along the AEC (average-environment coordination) axis, indicated by the arrow, and the stability of the genotypes according to the length of the vector that starts from the AEC axis to the genotype. Smaller vectors = greater stability. Genotypes: G01, G02, G03, G04, G05 (Family I: Taiwan A46 × IJ7125); G06, G07, G08, G09, G10 (Family II: Elefante Cachoeira de Itapemirim × IJ7125); G11, G12, G13, G14, G15 (Family III: Cuba 116 × IJ7125); and G16, G17, G18, G19, G20 (Family IV: Mineirão IPEACO × IJ7125). Environments (harvest times): E1 (10 months), E2 (+ 8 months), E3 (+ 8 months), E4 (+ 9 months). AEC (average-environment coordination). PC1: principal component 1; PC2: principal component 2. Campos dos Goytacazes, Rio de Janeiro, Brasil.
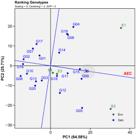
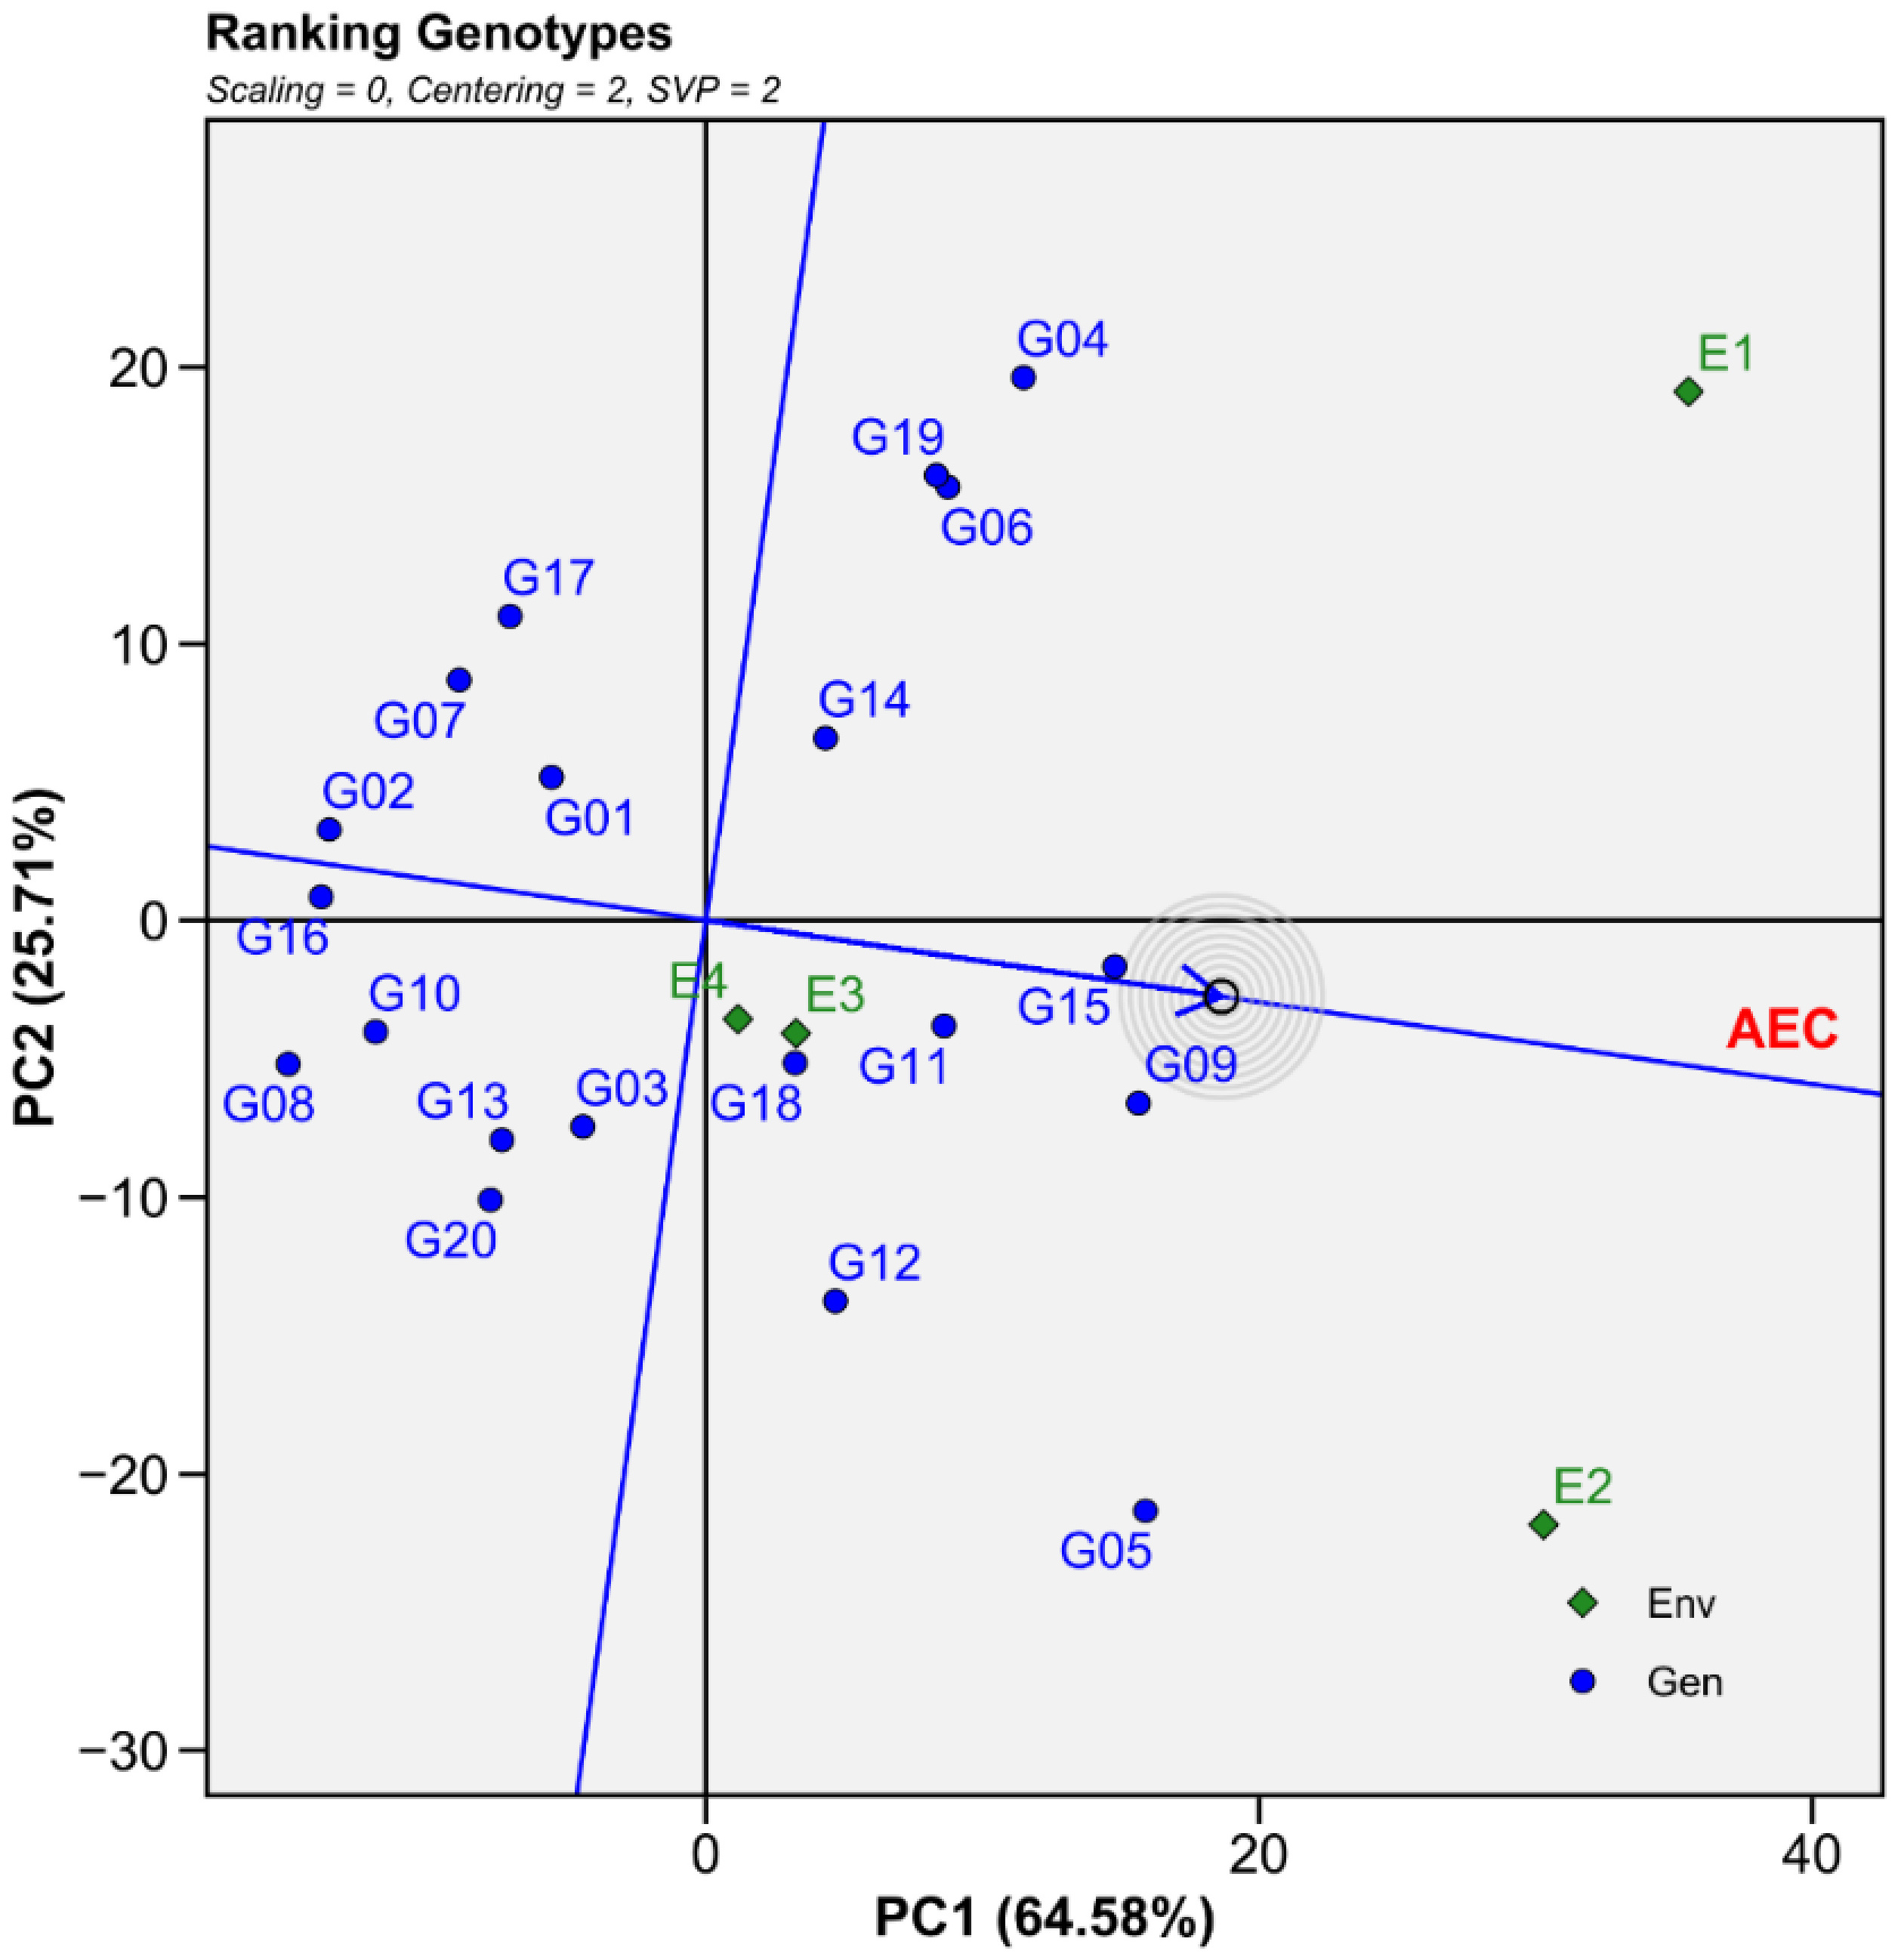
“Ranking Genotypes” Biplot (ideal genotype estimate). Genotypes: G01, G02, G03, G04, G05 (Family I: Taiwan A46 × IJ7125); G06, G07, G08, G09, G10 (Family II: Elefante Cachoeira de Itapemirim × IJ7125); G11, G12, G13, G14, G15 (Family III: Cuba 116 × IJ7125); and G16, G17, G18, G19, G20 (Family IV: Mineirão IPEACO × IJ7125). Environments (harvest times): E1 (10 months), E2 (+ 8 months), E3 (+ 8 months), E4 (+ 9 months). AEC (average-environment coordination). PC1: principal component 1; PC2: principal component 2. Campos dos Goytacazes, Rio de Janeiro, Brasil.
Figure 4 (Discriminativeness vs. Representativeness Biplot) illustrates the ability of each harvest to discriminate among genotypes and to represent the overall target environment. Longer vectors indicate greater discriminative power, while shorter vectors indicate weaker discrimination. The reliability of the biplot depends on the proportion of variation explained by the first two principal components (PC1 and PC2), which capture the main genotype effects and the G × E interaction (Yan, 2001). Environments forming smaller angles with the AEC axis are considered more representative (Hongyu et al., 2015).
Harvest 1 was the most discriminating environment, as indicated by the largest vector, while Harvest 2 was characterized by the smallest angle. Both environments were discriminative and representative for the evaluated genotypes. In contrast, Harvests 3 and 4, with their short vectors, were less representative and therefore unsuitable for genotype selection.
In the selection process, the interval between harvests and the annual environmental conditions during plant development must be considered, as they directly influence outcomes. For more robust genotype or environment selection, an extended evaluation period with a greater number of harvests is necessary (Menezes et al., 2014).
Figure 5 presents the Which-Won-Where Biplot, illustrating genotype performance across harvests and enabling the identification of distinct mega-environments. Genotype G04 (FI) performed best in environment E1 (harvest 1), while genotypes G05 and G09 (FI and FII, respectively) performed best in harvest 2 (E2). These two environments were the most representative, capturing the highest-performing genotypes. In contrast, environments E3 and E4 (also shown in Figure 4) had low representativeness, limiting their usefulness for identifying superior genotypes.
Stability is represented on the y-axis, where greater distance from the origin reflects lower stability (Gabriel, 1971; Yan and Kang, 2003; Silva and Benin, 2012). The identification of stable genotypes is essential in plant breeding programs, as stability reflects the ability of a genotype to exhibit consistent performance across different environments or over time. Unstable genotypes may show high yield under specific conditions but experience a significant reduction in productivity in adverse environments or under climatic variations, thereby compromising their practical usefulness.
Phenotypic stability is a key criterion in plant breeding programs, as it ensures that performance observed in experimental trials can be reproduced across different environments and over time. Although high-yielding genotypes may offer advantages under specific conditions, their instability limits practical adoption in cropping systems subject to climatic and edaphic variations. In this context, selecting stable genotypes not only reduces risks associated with unpredictable environmental factors but also contributes to the sustainability of agricultural production. Therefore, the recommendation of cultivars should consider, in addition to productive potential, the consistency of performance, ensuring greater reliability and confidence in yield estimates across different regions and cropping systems.
Figure 6 illustrates a key concept of stability. High stability is only meaningful when combined with above-average performance (Yan and Tinker, 2011). The average environment coordination (AEC) axis, represented by a straight line with an arrow, indicates superior mean performance in the direction of the arrow. The ideal genotype (ideotype) is positioned at the center of concentric circles, and genotypes located closest to the AEC axis are considered the best ideotypes. The line perpendicular to the AEC axis shows stability: greater distance from the origin reflects higher variability in performance and, consequently, lower stability.
Stability assessment revealed clear differences among genotypes. Genotypes with dry matter yield (DMY) above the overall mean included G04 (FI), G05 (FI), G06 (FII), G09 (FII), G11 (FIII), G12 (FIII), G14 (FIII), G15 (FIII), G18 (FIV), and G19 (FIV). Genotypes below the mean were G01 (FI), G02 (FI), G03 (FI), G07 (FII), G08 (FII), G10 (FII), G13 (FIII), G16 (FIII), G17 (FIV), and G20 (FIV) (Figure 6).
Genotypes located closest to the average environment coordination (AEC) axis demonstrated greater stability. G02 (FI) and G05 (FI) maintained consistent DMY across harvests, even under environmental variation, although G02 (FI) remained low-yielding. Other stable genotypes included G09 (FII), G11 (FIII), and G16 (FIII), all positioned near the mean axis.
The most unstable genotypes, those whose performance varied strongly across environments, were G04 (FI), G06 (FII), and G19 (FIV). These materials were highly productive in the first harvest but failed to maintain performance in later assessments. G05 (FI) and G12 (FIII) also showed instability, though they responded positively in the second harvest. Such variability is likely related to low tolerance to environmental factors such as rainfall, temperature, light availability, soil fertility, pests, and diseases, which directly affected biomass production across harvests.
Genotypes located closer to the center of the concentric circles are the most desirable and potentially commercially viable. In this study, G09 (FII) and G15 (FIII) were identified as the most stable and well-adapted genotypes (Figure 7). Importantly, high productivity alone does not ensure adaptability and stability across environments. Ideal genotypes for dry matter yield (DMY) are those that maintain consistent performance across environments, rather than those that achieve the highest yield in a single harvest. In studies using the biplot method, elephant grass genotypes are often selected based on traits such as tiller number, plant height, and dry matter yield (Gravina et al., 2020).
In multi-environment trials, complex genotype × environment interactions often reveal the inconsistency of genotype superiority, making selection and recommendation difficult (Cruz et al., 2020). To address this challenge, several strategies can be adopted, including the identification of specific genotypes for each environment, environmental stratification, and the selection of genotypes with greater phenotypic stability. In this context, the GGE Biplot approach has proven to be a practical tool in plant breeding, as demonstrated by its use in recommending superior cowpea varieties in the northeast region of Rio de Janeiro (Cruz et al., 2020).
Productivity is a fundamental criterion in evaluating heterozygous genotypes, such as clones and hybrids. However, stability is equally important, as it ensures predictable performance of the most productive genotypes. Ideally, genotypes should combine high yield with stability across environments. This has been demonstrated in studies conducted under adverse conditions (Naroui Rad and Bakhshi, 2021).
Within elephant grass breeding programs for bioenergy production, the GGE Biplot method has emerged as a robust statistical tool for genotype selection. Although relatively few studies have applied this method to elephant grass, its effectiveness has been confirmed. It is particularly valuable for identifying stable genotypes and representative environments, thereby supporting the development of cultivars suited to sustainable energy production.
4. Conclusion
The GGE Biplot approach proved effective for selecting superior elephant grass genotypes in terms of dry matter yield (t ha-1). Among the evaluated materials, G15 (family III: Cuba 116 × IJ7125) and G09 (family II: Elefante Cachoeiro de Itapemirim × IJ7125) were identified as the most stable and widely adapted. Harvests E1 (10 months) and E2 (eight months) were also the most suitable environments for genotype selection.
These findings are promising for elephant grass breeding programs aimed at bioenergy production. Given the crop’s high productivity and adaptability, the identification of stable genotypes contributes directly to biomass supply as a renewable energy source. This not only reduces dependence on fossil fuels but also supports sustainable agricultural practices, with benefits for both the environment and local communities.
Acknowledgements
This study was developed with the support of the funding agencies CAPES, CNPQ and FAPERJ through the granting of a scholarship, aid for a research project with elephant grass for a bioenergy proposal.
-
Data Availability Statement
Data generated in this project is available from the corresponding author on reasonable request.
References
-
CECCON, F., DAVIDE, L.M.C., GONÇALVES, M.C., SANTOS, A. and LOURENTE, E.P.R., 2021. GGE-biplot of multivariate index to select maize progenies for efficient association with Azospirillum brasiliense. Revista Caatinga, vol. 34, no. 4, pp. 739-751. https://doi.org/10.1590/1983-21252021v34n401rc
» https://doi.org/10.1590/1983-21252021v34n401rc -
CRUZ, C.D., 2013. GENES - Software para análise de dados em estatística experimental e em genética quantitativa. Acta Scientiarum. Agronomy, vol. 35, pp. 271-276. https://doi.org/10.4025/actasciagron.v35i3.21251
» https://doi.org/10.4025/actasciagron.v35i3.21251 - CRUZ, C.D., REGAZZI, A.J. and CARNEIRO, P.C.S., 2012. Modelos biométricos aplicados ao melhoramento genético 4. ed. Viçosa: Editora UFV, 514 p.
-
CRUZ, D.P., GRAVINA, G.A., VIVAS, M., ENTRINGER, G.C., ROCHA, R.S., COSTA JAEGGI, M.E.P.C., GRAVINA, L.M., PEREIRA, I.M., AMARAL JUNIOR, A.T., MORAES, R., OLIVEIRA, T.R.A. and DAHER, R.F., 2020. Analysis of the phenotypic adaptability and stability of strains of cowpea through the GGE biplot approach. Euphytica, vol. 216, no. 133, pp. 1-13. https://doi.org/10.1007/s10681-020-02693-9
» https://doi.org/10.1007/s10681-020-02693-9 -
DEHGHANI, H., EBADI, A. and YOUSEFI, A., 2006. Biplot Analysis of Genotype by Environment Interaction for Barley Yield in Iran. Agronomy Journal, vol. 98, no. 2, pp. 388-393. https://doi.org/10.2134/agronj2004.0310
» https://doi.org/10.2134/agronj2004.0310 -
FREITAS, R.S., BARBÉ, T.D.C., DAHER, R.F., VIDAL, A.K.F., STIDA, W.F., SILVA, V.D. and PEREIRA, A.V., 2018. Chemical composition and energy yield of elephant-grass biomass as function of five different production ages. Journal of Agricultural Science, vol. 10, no. 1, pp. 1-11. https://doi.org/10.5539/jas.v10n1p343
» https://doi.org/10.5539/jas.v10n1p343 -
GABRIEL, K.R., 1971. The biplot graphic display of matrices with application to principal component analysis. Biometrika, vol. 58, no. 3, pp. 453-467. https://doi.org/10.1093/biomet/58.3.453
» https://doi.org/10.1093/biomet/58.3.453 -
GRAVINA, L.M., OLIVEIRA, T.R.A., DAHER, R.F., GRAVINA, G.A., VIDAL, A.K.F., STIDA, W.F., CRUZ, D.P., SANT’ANNA, C.Q.S.S., ROCHA, R.S., PEREIRA, A.V. and OLIVEIRA, G.H.F., 2020. Multivariate analysis in the selection of elephant grass genotypes for biomass production. Renewable Energy, vol. 160, pp. 1265-1268. https://doi.org/10.1016/j.renene.2020.06.094
» https://doi.org/10.1016/j.renene.2020.06.094 - HONGYU, K., SILVA, F.L., SARTI, D.A., ARAÚJO, L.B. and DIAS, C.T.S., 2015. Comparação entre os modelos AMMI e GGE biplot para os dados de ensaios multi-ambientais. Revista Brasileira de Biometria, vol. 33, no. 2, pp. 139-155.
- KÖPPEN, W., 1948. Climatologia: con un estúdio de los climas de La Tierra México: Fondo de Cultura Economica.
-
MARAFON, A.C., DIAS, A., ANDRÉ, S., CÂMARA, F., ADRIANA, A., BIERHALS, N., LEÔNCIO, H., VICTOR, P. and GUIMARÃES, S., 2016 [viewed 16 October 2025]. Poder calorífico do capim-elefante para a geração de energia térmica [online]. Aracaju: Embrapa Tabuleiros Costeiros. Available from: https://www.infoteca.cnptia.embrapa.br/infoteca/handle/doc/1060103/
» https://www.infoteca.cnptia.embrapa.br/infoteca/handle/doc/1060103/ - MARTINS-COSTA, R.H.A., CABRAL, L.S., BHERING, M., ABREU, J.G., ZERVOUDAKIS, J.T., RODRIGUES, R.C. and OLIVEIRA, I.S., 2008. Valor nutritivo do capim-elefante obtido em diferentes idades de corte. Revista Brasileira de Saúde e Produção Animal, vol. 9, no. 3, pp. 397-406.
-
MENEZES, B.R.S., DAHER, R.F., GRAVINA, G.A., AMARAL JÚNIOR, A.T., OLIVEIRA, A.V., SCHNEIDER, L.S.A. and SILVA, V.B., 2014. Correlações e análise de trilha em capim-elefante para fins energéticos. Agrária, vol. 9, no. 3, pp. 465-470. https://doi.org/10.5039/agraria.v9i3a3877
» https://doi.org/10.5039/agraria.v9i3a3877 -
NADDEO, V. and TAHERZADEH, M.J., 2021. Biomass valorization and bioenergy in the blue circular economy. Biomass and Bioenergy, vol. 151, pp. 106069. https://doi.org/10.1016/j.biombioe.2021.106069
» https://doi.org/10.1016/j.biombioe.2021.106069 -
NAROUI RAD, M.R. and BAKHSHI, B., 2021. GGE biplot tool to identify melon fruit weight stability under different drought conditions. International Journal of Vegetable Science, vol. 27, no. 2, pp. 220-230. https://doi.org/10.1080/19315260.2020.1805538
» https://doi.org/10.1080/19315260.2020.1805538 -
NOVO, A.A.C., DAHER, R.F., COSTA, E.S., GRAVINA, G. and OGLIARI, J., 2016. DE A., OGLIARI, J., 2016. Situação energética no Estado do Rio de Janeiro e o Capim-elefante como fonte renovável. Vértices, vol. 18, no. 3, pp. 107-121. https://doi.org/10.19180/1809-2667.v18n32016p107-121
» https://doi.org/10.19180/1809-2667.v18n32016p107-121 -
OLIVOTO, T., LÚCIO, A.D.C., SILVA, J.A.G., MARCHIORO, V.S., SOUZA, V.Q. and JOST, E., 2019. Mean performance and stability in multi-environment trials I: combining features of AMMI and BLUP techniques. Agronomy Journal, vol. 111, no. 6, pp. 2949-2960. https://doi.org/10.2134/agronj2019.03.0220
» https://doi.org/10.2134/agronj2019.03.0220 -
PEREIRA, A.V., AUAD, A.M., BRIGHENTI, A.M., MITTELMANN, A., GOMIDE, C.A.M., MARTINS, C.E., PACIULLO, D.S.C., LEDO, J.F.S., OLIVEIRA, J.S.E., LEITE, J.L.B., MACHADO, J.C., MATOS, L.L., MORENZ, M.J.F., ANDRADE, P.J.M., BENDER, S.E. and ROCHA, W.S.D., 2021 [viewed 16 October 2025]. BRS Capiaçu e BRS Kurumi: cultivo e uso [online]. Brasília: Embrapa, 120 p. Available from: http://www.infoteca.cnptia.embrapa.br/infoteca/handle/doc/1131853
» http://www.infoteca.cnptia.embrapa.br/infoteca/handle/doc/1131853 -
PEREIRA, A.V., LEDO, F.J., MORENZ, M.J.F., LEITE, J.L.B., SANTOS, A.M.B., MARTINS, C.E. and MACHADO, J.C., 2016 [viewed 16 October 2025]. BRS Capiaçu: cultivar de capim-elefante de alto rendimento para produção de silagem [online]. Juiz de Fora: Embrapa Gado de Leite, 6 p. Comunicado Técnico, no. 79. Available from: http://www.infoteca.cnptia.embrapa.br/infoteca/handle/doc/1056288
» http://www.infoteca.cnptia.embrapa.br/infoteca/handle/doc/1056288 - PIMENTEL-GOMES, F., 2023. Curso de estatística experimental. 15. ed. Piracicaba: Digitaliza Conteúdo, 451 p.
-
QUEIROZ FILHO, J.L., SILVA, D.S. and NASCIMENTO, I.S., 2000. Produção de matéria seca e qualidade do capim-elefante (Pennisetum purpureum Schum.) cultivar Roxo em diferentes idades de corte. Revista Brasileira de Zootecnia, vol. 29, no. 1, pp. 69-74. https://doi.org/10.1590/S1516-35982000000100010
» https://doi.org/10.1590/S1516-35982000000100010 -
R CORE TEAM, 2025 [viewed 16 October 2025]. R: a language and environment for statistical computing [software]. Vienna: R Foundation for Statistical Computing. Available from: https://www.r-project.org/
» https://www.r-project.org/ -
ROCHA, J.R.A.S.C., MACHADO, J.C., CARNEIRO, P.C.S., CARNEIRO, J.C., RESENDE, M.D.V., VANDER PEREIRA, A. and CARNEIRO, J.E.S., 2017. Elephant grass ecotypes for bioenergy production via direct combustion of biomass. Industrial Crops and Products, vol. 95, pp. 27-32. https://doi.org/10.1016/j.indcrop.2016.10.014
» https://doi.org/10.1016/j.indcrop.2016.10.014 -
SHIMOYA, A., PEREIRA, A.V., FERREIRA, R.D.P., CRUZ, C.D. and CARNEIRO, P.C.S., 2002. Repetibilidade de características forrageiras do capim-elefante. Scientia Agrícola, vol. 59, no. 2, pp. 227-234. https://doi.org/10.1590/S0103-90162002000200004
» https://doi.org/10.1590/S0103-90162002000200004 - SILVA, D.J. and QUEIROZ, A.C., 2002. Análise de alimentos: métodos químicos e biológicos. 3. ed. Viçosa: Editora UFV, 235 p.
-
SILVA, R.R. and BENIN, G., 2012. Análises Biplot: conceitos, interpretações e aplicações. Ciência Rural, vol. 42, no. 8, pp. 1404-1412. https://doi.org/10.1590/S0103-84782012000800012
» https://doi.org/10.1590/S0103-84782012000800012 -
SOUZA, A.G., DAHER, R.F., SANTANA, J.G.S., AMBRÓSIO, M., NASCIMENTO, M.R., VIDAL, A.K.F., SOUZA FILHO, B.F., MELO, L., GRAVINA, G.A., SANTOS, R.M., LEITE, C.L., FARIAS, J.E.C., STIDA, W.F. and ROCHA, R.S., 2023. Adaptability and stability of black bean genotypes for Rio de Janeiro, by GGE biplot analysis. Crop Breeding and Applied Biotechnology, vol. 23, no. 2, pp. 1-8. https://doi.org/10.1590/1984-70332023v23n2a15
» https://doi.org/10.1590/1984-70332023v23n2a15 -
UCZAI, P.R., TAVARES, W.M. and QUEIROZ FILHO, A.P., 2012 [viewed 16 October 2025]. Energias renováveis: riqueza sustentável ao alcance da sociedade [online]. Brasília: Câmara dos Deputados. Available from: https://bd.camara.leg.br/bd/
» https://bd.camara.leg.br/bd/ -
UNITED NATIONS IN BRAZIL – UN BRAZIL, 2015 [viewed 16 October 2025]. A Agenda 2030 [online]. Available from: https://nacoesunidas.org/pos2015/agenda2030/
» https://nacoesunidas.org/pos2015/agenda2030/ -
YAN, W., 2001. GGEbiplot: a windows application for graphical analysis of multienvironment trial data and other types of two-way data. Agronomy Journal, vol. 93, no. 5, pp. 1111-1118. https://doi.org/10.2134/agronj2001.9351111x
» https://doi.org/10.2134/agronj2001.9351111x -
YAN, W., HUNT, L.A., SHENG, Q. and SZLAVNICS, Z., 2000. Cultivar evaluation and mega-environment investigation based on the GGE biplot. Crop Science, vol. 40, no. 3, pp. 597-605. https://doi.org/10.2135/cropsci2000.403597x
» https://doi.org/10.2135/cropsci2000.403597x - YAN, W. and KANG, M.S., 2003. GGE biplot analysis: a graphical tool for breeders, geneticists, and agronomists. 1st ed. Boca Raton: CRC Press, 288 p.
-
YAN, W. and TINKER, N.A., 2011. Biplot analysis of multi-environment trial data: principles and applications. Canadian Journal of Plant Science, vol. 86, no. 3, pp. 623-645. https://doi.org/10.4141/P05-169
» https://doi.org/10.4141/P05-169 -
YANG, R.C., CROSSA, J., CORNELIUS, P.L. and BURGUEÑO, J., 2009. Biplot analysis of genotype × environment interaction: proceed with caution. Crop Science, vol. 49, no. 5, pp. 1564-1576. https://doi.org/10.2135/cropsci2008.11.0665
» https://doi.org/10.2135/cropsci2008.11.0665
Edited by
-
Editor: Jairo Lizandro Schmitt
Data generated in this project is available from the corresponding author on reasonable request.