 Sodium-reduced bread formulated with seablite (Suaeda maritima L. Dumort) powder as salt substitution
Abstract
The objective of this study was to develop sodium-reduced bread by substituting salt with seablite powder (Suaeda maritima L. Dumort) and to evaluate its effects on physical, chemical, sensory, and storage properties. Bread samples were formulated with five levels of seablite powder replacing salt at 0, 25, 50, 75, and 100%. The samples were analyzed for color, volume, texture, moisture, pH, water activity, and sodium content. A sensory evaluation was conducted using consumer testing with 100 participants. Bread with 50% seablite substitution showed significantly reduced sodium content (1.14 g/100 g) compared to the control (1.46 g/100 g), while maintaining acceptable loaf volume, texture, and sensory attributes. Increasing substitution levels darkened crumb color and increased hardness and chewiness. Sensory scores for saltiness and sweetness declined at higher substitution levels, but 50% substitution achieved a favorable balance of health and quality. During five-day storage, texture degradation and moisture loss were more evident at room temperature than under refrigeration. These findings suggest that partial substitution of salt with seablite powder, up to 50%, is a promising strategy for sodium reduction in bread without compromising consumer acceptance.
Keywords:
Bread; Seablite; Suaeda maritima; Salt substitute; Halophyte; Sodium reduction; Sensory evaluation
Highlights
Seablite powder effectively reduced sodium in bread without affecting volume and texture
50% seablite substitution achieved optimal sodium reduction with sensory acceptance
Crumb color appears slightly faded and hardened after 5 days of storage
1 Introduction
The World Health Organization (WHO) and many other dietary guidelines recommend a reduction of sodium intake to less than 2,000 mg/day for adults (Saglimbene et al., 2021). In some countries, people consume almost 40% more sodium than the recommended 2,000 mg/day (Bassetti et al., 2023). Consuming a lot of sodium increases blood pressure, which is linked to cardiovascular disease and several other noncommunicable diseases (NCDs) (Al Jawaldeh & Al-Khamaiseh, 2018). Doyle & Glass (2010) reported that the foods with high sodium content may affect other health problems, such as stomach cancer, kidney stones, and the severity of asthma, although these relationships are not yet well documented. Bread has valuable nutrients such as starch, protein, fiber, vitamins, and minerals, and is an important food enjoyed worldwide (Mudau et al., 2021). However, bread is a major contributor to sodium intake in many countries, as it contains a relatively high concentration of salt (Codină et al., 2021). Bread samples gathered from the eight countries had mean sodium and salt contents of 3.0 and 7.63 g/kg, respectively (Al Jawaldeh & Al-Khamaiseh, 2018). Also, more people ate this category of food (Nahar et al., 2019). Considering the global efforts to reduce sodium levels in foods, there has been considerable interest in developing sodium-reduced or low-salt bread (Jachimowicz-Rogowska & Winiarska-Mieczan, 2023). There are several approaches to reduce sodium in bread, including sodium chloride replacement with different types of salts, gradual reduction of sodium chloride, inhomogeneous distribution of salt in the recipe, using encapsulated salt, using flavor enhancers, using dry sourdough, using different spices, and using B4 vitamin (Codină et al., 2021). However, these approaches may have some undesirable effects on bread quality, such as unwanted textures, bitter taste, longer production time, and higher costs (Cappelli & Cini, 2021; Walker & Dando, 2023).
In recent years, considerable efforts have been made to identify suitable salt substitutes that can be used to replace sodium chloride in bread formulation, especially natural ingredients such as seaweeds, salicornia, seablite (Marco et al., 2022), saltbush, and sea purslane (Srivarathan et al., 2023). Seablite (Suaeda sp.), another genus known for its salt content, has been highlighted for its abundance in essential minerals and trace elements, including iodine (Castañeda-Loaiza et al., 2020). Srivarathan et al. (2023) reported the nutritional composition of seablite (g/100 g DW) were 6.43 protein, 1.14 fat, 16.2 fiber, 1.24 ash, 3.00 calcium and 15.00 sodium. Given its availability and cost-effectiveness, edible halophytes are receiving significant interest due to their high salinity tolerance, a crucial trait in times of climate change, growing world population, and loss of arable land (Srivarathan et al., 2023). Hence, seablite has been thoroughly investigated for its potential integration into bakery products as a salt alternative (Lopes et al., 2023).
The objective of this study can be divided into two main objectives, which are as follows: 1) to develop sodium-reduced bread using seablite powder and evaluate the physical, chemical, and sensorial properties of the bread; 2) to evaluate the quality of bread substituted with seablite powder during storage (5 days).
2 Materials and methods
2.1 Material
Seablite (Suaeda maritima L. Dumort) was purchased from local farmers in Samut Songkhram province, Thailand. The debris and dirt were removed before being washed with water. Then soaked with a chlorine solution (50 ppm) prepared from food-grade calcium hypochlorite (65%) for 30 minutes and rinsed with water again. The samples were left to dry on the rack before the drying process.
2.2 Seablite leave preparation
The seablite was spread and placed on a tray in a hot air oven (Memmert, Germany) at 60 °C for 10 hours and flipped every 2 hours. After that, the dried seablite leaf was cooled, ground with a blender (HR2088, Philips, Thailand), and sifted through a 600-micron sieve (Retsch, Germany). The seablite powder was kept in vacuum-plastic bags with silica gel at room temperature (30-35 °C).
2.3 Production of bread
Bread samples were prepared with five levels of salt substitution: 0%, 25%, 50%, 75%, and 100%. In all formulations, the base ingredients remained constant, comprising 38.74% all-purpose flour, 9.69% cake flour, 1.45% milk powder, 0.97% dried yeast, 8.72% sugar, 7.26% whole egg, 15.50% chilled water, 9.69% evaporated milk, and 7.26% unsalted butter. Only the amounts of table salt and seablite powder varied as shown in Table 1.
For bread production, sift all-purpose flour and cake flour together, and add the yeast. Mixed ingredients include salt, sugar, seablite powder, eggs, water, and evaporated milk together. After that, pour in the flour mixture. Then add butter and let it rise for 30 minutes. Cut the dough into 150 grams, start from the short side, and roll the dough up. Pinch the ends of the dough together and form a loaf by tucking them under. Transfer the loaf to the prepared loaf pan and put it in a proofing machine for 30 minutes at 70 °C. Beat the egg and water in a small dish. Brush the dough with the egg wash using a pastry brush. Baked it at 170 °C on the top and 180 °C on the bottom for 15 minutes. Take it out and bake for another 5 minutes.
A portion of the cooked bread was used for texture measurements, sensory evaluation, and bread properties during storage. The remaining cooked bread was milled for chemical and physical properties.
2.4 Physical properties of bread
2.4.1 Determination of color
The color of crust and crumb (slice of 1 inch thickness) of bread was measured using UltraScan VIS (Hunter Associates Laboratory, Germany) and expressed in terms of CIE L*a*b*C*hº values. The color values were measured in reflectance mode using a standard observer angle of 10° and a standard illuminant of D65.
2.4.2 Determination of loaf weight, loaf volume, and specific volume
Loaf weight was measured 60 minutes after the loaves were removed from the oven. The loaf volume was measured by the modified method (10-05.01) from the American Association of Cereal Chemists (2009). The bread was placed inside the plastic container of a known volume, and the remaining sesame seeds were poured into the empty space inside the container. The remaining sesames, which were not needed for the experiment, were measured in a graduated cylinder and represented the volume of the bread. The specific volume of the bread was determined as shown in Equation 1.
2.4.3 Determination of texture
The texture profile analysis (TPA) was performed using a universal testing machine (TA.XT Plus, Stable Micro System, UK) equipped with a 500 N load cell. Measurement was made with the SMS P/100 probe, compressing bread to 60% of its height, 2.0 mm/sec test speed, and 2mm/sec post-test speed, using 1.0 inch3 from the core of the loaf.
2.5 Chemical properties of bread
2.5.1 Determination of pH
The pH value was measured in a 10% (w/v) dispersion of the bread in distilled water using a digital pH meter (SI Analytics Lab 845 pH, ORP, ISE Benchtop Meter, METTLER TOLEDO, Germany).
2.5.2 Determination of water activity (aw)
The aw was measured by an Aqua Lab (ENS/ELS, LabMaster-aw neo, Novasina, SwitZerland).
2.5.3 Determination of moisture content
The moisture contents were determined by the hot air oven (MEMMERT, Germany) following the AOAC (Association of Official Analytical Chemists, 2006). A 2-gram sample was dried in an oven at 105 °C until a constant weight was achieved. Five replicates were performed for each determination.
2.5.4 Determination of sodium content
The method used to determine the sodium content followed the in-house method WI-TMC-70 based on Standard Methods for the Examination of Water and Wastewater, American Public Health Association (APHA), American Water Works Association (AWWA), Water Environment Federation (WEF), 24th Edition, 2023, Part 4500-Cl- C and was performed at Institute of Food Research and Product Development (IFRPD), who have ISO/IEC 17025 certification.
2.6 Sensory evaluation
The consumer testing was conducted with 100 respondents (age range 21-60 years) who had consumed bread in the previous month. The evaluation was conducted in a sensory laboratory. Respondents were seated in individual sensory booths under controlled white lighting to evaluate the samples. Bread loaves were allowed to cool at room temperature for at least one hour after baking. Then, it was sliced to a thickness of 1 cm with the crust intact (approximately 3.5 cm × 3.5 cm width and length), weighed around 50-55 g, and served at room temperature (25 °C). Each sample was assigned a random three-digit code, served on a white disposable plate, and presented to consumers in a sequenced monadic order. Testing was divided into two sections (three and two samples per section), with at least a 15-minute break between sessions. Each consumer received a bread sample tagged with a random three-digit code in a sequenced monadic order. Panelists were provided with room-temperature water and instructed to cleanse their palate between samples. Bread samples were rated for crust color, crumb color, overall odor, sweetness, saltiness, overall taste, softness, and overall liking on a 9-point hedonic scale. To provide diagnostic information on the attributes most impacted by the salt substitution, only sweetness, saltiness, and softness were evaluated using a 3-point just-about-right (JAR) scale (where 1 = too little, 2 = JAR, and 3 = too much) (Civille et al., 2015). Lastly, socio-demographic data, including gender and age, were also collected.
2.7 Bread properties during storage
The breads (three loaves for each day) were stored in polyethylene bags at a refrigerator (4 °C to 10 °C) and room temperature (30-35 °C) for 5 days. During storage, the color, texture, and moisture content were measured, as described in Section 2.4.1, 2.4.3, and 2.5.3 every day at the same time.
2.8 Statistical analysis
This study was conducted using a completely randomized design (CRD) for the measurement of physical and chemical properties, with three replications and two duplications. For consumer testing, a randomized complete block design (RCBD) was employed for the experimentation. All data analyses were computed in the R environment. R base for analysis of variance and the agricolae R package for Post Hoc tests with Duncan's new multiple range test. All mean differences are considered statistically significant at 95% confidence. Penalty analysis was performed by the SensoMineR R package on JAR data and Hedonic data combined.
3 Results and discussion
3.1 Physical characteristics of bread
The results of the physical characteristics of bread containing different levels of seablite powder supplementation as compared to the control are presented in Table 2. As the amount of seablite powder was increased, no significant difference was observed in the L*, b*, C*, and hº values of bread crust. While a* values indicated a minor difference (p ≤ 0.05), but no clear tendency. Considering crumb color, the L*, a*, b*, C*, and hº were remarkably affected by the various levels of seablite powder. The L* values decreased significantly (p ≤ 0.05) with increasing levels of seablite powder, which ranged from 80.68 to 69.7. The a*, b*, and hº are indicated by the color shade found that increasing the levels of seablite powder affected a* values decreased, but b* and hº were increased. This was associated with a higher degree of greenness in the bread crumb. The bread with 100% seablite powder had the highest hº value of 94.03, while the lowest value was found on the control (Figure 1). Increasing seablite powder level tended to decrease the C* values from 17.28 to 24.52. The color of the crumb is more impacted by the addition of seablite powder than the crust. The crumb was lighter in color since it was shielded from the crust during baking, but the difference in color of the crust was not as noticeable because of the dark color.

Cross-section of bread made from the substitution of seablite leaf powder percentage at 0, 25, 50, 75, and 100, respectively.
The bread crust had greater a*, b*, and C* values than bread crumb, which was opposite the L* value. Several research studies have explained the effect of salt on bread color. Pasqualone et al. (2019) reported that the decrease in salt, which speeds up dough fermentation, also decreases the amount of sugar available for the Maillard reaction, resulting in a lighter colored crust bread. Mohd Jusoh et al. (2009) described that caramelization and the Maillard reaction that occur during baking contribute to the dark shade of bread crust. In addition to both browning reactions, the product undergoes simultaneous mass and heat transfer during baking, which results in volume change, water evaporation, texture change because of protein denaturation, and starch gelatinization (Purlis, 2010). However, the effect of sodium concentration on crust color was not observed in our work.
The loaf weight, loaf volume, and specific volume of the bread ranged from 139.45-141.36 g, to 623.00-664.33 cm3 and 4.43-4.70 cm3/g, respectively. As the amount of seablite powder was increased, loaf weight, loaf volume, and specific volume of bread did not change and were not significantly different from bread containing full salt (p ≤ 0.05). Salts inhibit the activity of yeast, which lowers the amount of CO2 produced. Furthermore, it fortifies the gluten network to reduce gas-induced expansion during proofing and baking (Reißner et al., 2019). Therefore, the bread with high sodium content should have low specific volume, but no effects were found in this work. These findings were similar to those reported by Lynch et al. (2009), who reported that there was no statistical difference (p > 0.05) in the specific volumes of breads with different salt contents due to the weaker gluten network in low-salted doughs' inability to hold onto CO2, despite the dough producing more of it. Consequently, there is less CO2 left in the dough. Our results are also in agreement with Arena et al. (2020); there were no discernible variations in the specific volumes of Durum Wheat Breads among the bread samples with varying sea salt contents (015 to 1.70%).
The specific volume is a characteristic related to bread texture, and this characteristic is highly associated with the acceptance of bread products. It could be noted the impact of different seablite powders on the texture properties of bread. There were significant differences in the textural characteristics, including hardness, springiness, and chewiness (p ≤ 0.05), with less difference in springiness. The hardness and chewiness of bread increase with a higher concentration of seablite powder. For these samples, no significant difference was observed in cohesiveness and resilience. These findings are comparable to those of Barroca et al. (2023), who observed that the amount of sodium chloride replacement did not affect the bread's springiness, cohesiveness, and resilience.
3.2 Chemical properties of bread
The results of the chemical properties of bread using seablite powder were presented in Table 3. The value of pH ranged from 6.47 to 6.59. The bread with 0, 25%, and 50% seablite powder were not significantly different (p > 0.05), but 75% and 100% were slightly lower. However, it was found that the breads enriched with seablite powder had significantly lower pH values (p ≤ 0.05) than the control breads.
The aw values ranged from 0.863 to 0.890. The aw of all samples was slightly different (p ≤ 0.05). The amount of aw increases in proportion to the amount of seablite powder due to decreased salt. These might be affected by the difference in salt content. The bread with 100% seablite powder showed the highest aw, while 0% seablite powder had the very lowest. Salt's capacity to reduce and control aw in the baked product (Damodaran et al., 2008). The aw serves as a measure of available free water in the product and is crucial in defining food quality and safety, particularly concerning microbial growth and physical and chemical attributes (De Luca et al., 2021). Furthermore, sodium chloride (NaCl) has a hygroscopic property that reduces the aw of the bread, making the environment less prone to microbial activity and increasing the shelf life of the product (Ferrari et al., 2022).
The moisture content values ranged from 24.80% to 28.96%, showing slight but statistically significant differences among samples (p ≤ 0.05). The moisture content was significantly (p ≤ 0.05) different between control and enriched breads. As a result of the amount of salt used in its production. Dough prepared without salt makes gluten proteins hydrate faster since they repulse each other. But, when salt is added to the formulation, the gluten proteins associate with each other and make them hydrate more slowly (Miller & Hoseney, 2008; Tuhumury, 2020). Mondal & Datta (2008) reported that salt reduces moisture loss.
The sodium content of bread containing different levels of seablite powder supplementation was significantly affected (p ≤ 0.05). The sodium decreases as the amount of seablite increases, while the bread with 0% seablite powder had the highest, and 100% seablite powder showed the lowest, because salt contains a higher concentration of sodium than seablite powder. Srivarathan et al. (2023) reported that the seablite had a sodium (Na) concentration of 15.0 g/100 g (DW). According to the dietary guidelines, the suggested dietary target (SDT) for sodium is 2,000 mg/day (equivalent to less than 5 g/day salt) (World Health Organization, 2012).
The bread with 50% seablite powder substituted was kept for five days at room temperature and in the refrigerator to observe any changes in color, texture, and moisture content. The color of the bread crumb is shown in Table 4. During five days of storage, there were slight differences in the color values between the room temperature and the refrigerator. Moreover, there were rare changes in the color values in the whole storage period. Similar minor changes in color were reported by Pająk et al. (2012), who stored bread in polyethylene bags and vacuum containers at room temperature. They found that L* and b* values were negligibly changed, while a* values showed no significant change. Arena et al. (2020) reported that adding sea salt with less sodium had no discernible impact on the L* values of durum wheat bread crumb over the storage period.
Changes in L*a*b*C*hº, moisture content values, and texture properties of bread crumb with 50% seablite powder substituted during storage.
Table 4 presents the moisture content of bread that had 50% seablite powder substituted during storage at the refrigerator (4 °C) and room temperature (30 °C to-35 °C). The results from days 0 to 4 showed no significant differences between the two temperatures (p > 0.05), whereas a significant difference was observed on day 5 (p ≤ 0.05). The moisture content changed more slowly until the 5th day. However, when studying the amount of moisture in storage at room temperature and the refrigerator. The moisture content of days 0 to 4 were not significantly different (p > 0.05), but day 5 had a significantly difference (p ≤ 0.05) of both temperatures. According to reports, the incorporation of water into crystalline starch and the potential transition of water within the amorphous domains, some of which undergo aging, result in a change in the hydration behavior of bread during staling, causing it to become more bound or immobilized (Besbes et al., 2014; Czuchajowska & Pomeranz, 1989; He & Hoseney, 1990; Ribotta & Le Bail, 2007).
The change of texture properties of bread that had 50% seablite powder substituted during storage is shown in Table 4. As the storage duration increased, both hardness and chewiness significantly increased (p ≤ 0.05), while cohesiveness and resilience decreased (p ≤ 0.05) accordingly. Changes in texture properties were minimal between day 0 and day 1, but more pronounced differences were observed between days 4 and 5 of storage. These findings were consistent with those of Lynch et al. (2009), who used a trained sensory panel to conclude that the largest texture alterations occurred between 18 and 72 hours after baking. The texture properties were observed between room temperature and refrigerated storage. The samples stored at room temperature exhibited slightly higher values than those stored under refrigeration (p ≤ 0.05).
3.3 Sensory testing
The participants were 44% male and 56% female. The primary age groups of the participants were 21-30 years (30.0%) and 31-40 years (26.0%), which together constituted more than half of the participants. The others are 41-50 years (20.0%) and 50-60 years (24.0%), respectively.
3.3.1 Color and appearance perception
As the percentage of seablite powder substitution increased, the hedonic score for crust color slightly decreased. However, the objective measurements of crust color parameters were not significantly different across the different substitution levels. These measurements of instrumental readings provide precise, objective data about the physical appearance of the crust. On the other hand, hedonic scores reflect consumer perceptions and preferences. Even if there is no significant difference in the instrumental measurements, consumers may still perceive a subtle change in the product’s appearance that affects their liking. Instrumental measurements are useful for quantifying physical changes in product appearance, but they do not always correspond to consumer perception, which is influenced by more complex factors such as expectation, prior experiences, and context. The lack of a significant change in crust color parameters indicates that the addition of seablite powder had a negligible effect on the bread crust's physical appearance.
However, humans can be sensitive to slight visual differences that instruments may not capture effectively (Foroni et al., 2016). Small changes in crust color due to the increasing percentage of seablite powder might not be large enough to register as statistically significant in instrumental readings but may still impact consumer perceptions. Consumers may expect that as more seablite powder is added, the bread will appear different or less like traditional bread. This expectation can influence their perception of the crust color, even if the objective color has not changed much. This psychological effect can cause a small decline in hedonic scores even when the physical parameters stay stable.
In contrast to crust color parameters, crumb color parameters varied significantly across samples. This suggests that seablite powder affected crumb color more than crust color. As seablite powder substitution increased, L* crumb darkened. Since seablite powder has a darker pigment than the other base ingredients, the crumb will appear darker. As seablite powder substitution increased, a* decreased, making the crumb greener. This shift may be due to seablite's green or brownish color. As seablite powder increased, the crumb color shifted toward yellow and the b* value increased. Adding seablite powder resulted in significant changes in C* and hº, indicating a shift in crumb intensity and hue.
Significant crumb color changes may have affected consumer perceptions of bread quality, flavor, and appeal. As seablite powder increased, the crumb may have become darker and yellow/greenish, deviating from consumer expectations of traditional bread. Seablite powder is more thoroughly mixed and incorporated into the crumb, so it may affect it more. The crust's caramelization and Maillard reactions during baking may mask or neutralize the seablite's color effect. However, the crumb retains pigments and shows seablite color changes. Table 5 shows significant crumb color differences, which consumers may notice more easily when cutting or breaking the bread, influencing their liking or expectations. Consumer expectations and hedonic ratings may change as the crumb darkens and turns yellow-green.
Hedonic score of bread with different percentages of salt substitution with seablite powder (n=100).
3.3.2 Odor perception
The overall odor liking in the bread decreased slightly as the seablite substitution increased, as shown in Table 5. This reduction in overall odor liking is likely related to the increasing substitution of seablite for salt, which might alter the aromatic profile of the bread. Higher concentrations of NaCl facilitate the formation of more volatile compounds, especially pyrazines (which provide nutty and roasted notes), furans (offering sweet, caramel-like aromas), and aldehydes (which contribute to more complex aroma profiles) (Pasqualone et al., 2019). These volatiles are critical for creating the “toasted” or “baked” aroma that is characteristic of bread crusts (Sinesio et al., 2019).
In typical bread formulations, salt enhances flavor and stabilizes the dough, contributing to the overall sensory experience, including aroma. When salt is reduced or replaced with an ingredient like seablite, it may not have the same ability to enhance the Maillard reaction or other aroma-enhancing reactions, potentially leading to a weaker or different aroma profile. This change could explain the slight decline in overall odor liking as more seablite is substituted for salt. Additionally, seablite itself may introduce new or unfamiliar odors that could be less appealing to some consumers.
3.3.3 Sweetness and taste
The observed decrease in sweetness and overall taste scores with increasing seablite substitution, as shown in Table 5, is most likely due to the multifaceted roles of NaCl in food, particularly baked products. Salt is well-known not only for its contribution to taste (O’Sullivan, 2020) but also for its ability to enhance and balance flavors (Kilcast & Den Ridder, 2007). This is critical in bread, where both taste and texture play an important influence in consumer preference. Salt's primary function in bread is to improve flavors, including sweetness, by influencing taste perception mechanisms. Salt can increase the perceived intensity of certain desirable flavors while reducing potentially unpleasant or bitter notes (Miller & Hoseney, 2008). In bread, sodium ions interact with sweetness receptors, enhancing sweetness perception (Bartoshuk et al., 1978), resulting in a more balanced flavor profile that consumers prefer. As a result, replacing salt with seablite disrupts this balance, likely reducing the intensity of sweetness, which is critical in producing an overall pleasant taste in bread.
Seablite contains compounds that can impart earthy or mineral flavors. At higher substitution levels, these flavors become more pronounced, altering the bread’s sensory profile. Increased seablite substitution may reduce the perception of natural sweetness, resulting in lower taste scores. Additionally, seablite can introduce secondary flavors perceived as off-notes, which disrupt the bread’s balanced flavor and lead to decreased consumer satisfaction. Unlike salt, seablite lacks strong flavor-enhancing properties, which may contribute to a flatter taste profile and lower overall scores.
3.3.4 Saltiness perception
A minor decrease in sodium may go unnoticed. However, significant reduction can result in marked alterations in flavor, contingent upon the specific food item (Trumbo et al., 2023). The sensory characteristics of seablite significantly influence consumer perceptions of saltiness as the content of seablite in bread increases. Increased seablite content in bread led consumers to perceive less saltiness. Despite its natural salt content of approximately 0.73% salinity (Matta & Panchapakesan, 2021), seablite’s milder flavor profile contrasts with the sharper saltiness of NaCl. Its additional minerals and compounds (Sudjaroen, 2015) contribute to a complex flavor that does not deliver the familiar, direct saltiness of NaCl, thereby reducing perceived saltiness in the bread as shown in Table 3.
Salt perception relies on sodium ions activating epithelial channels on taste receptors, creating a gustatory signal (Liem et al., 2011). When seablite replaces NaCl, overall sodium levels drop, making it less likely to meet the recognition threshold needed for strong salt perception. Additionally, seablite’s compounds with bitter, umami, and vegetal notes may mask saltiness, leading consumers to find the bread less salty than expected.
Familiarity with traditional NaCl-based bread plays a role in perception. Studies, such as Sinesio et al. (2019), could identify distinct consumer groups with varying salt preferences, suggesting individual sensitivity to salt reduction strategies. Some consumers find enhanced flavors (e.g., using Pansalt®) saltier than professional assessments, indicating that factors beyond sodium content influence salt perception. Seablite’s interaction with other flavors can affect saltiness perception. Salt enhances other flavors and balances bitterness; replacing NaCl with seablite may disrupt this balance, with seablite’s slight bitterness potentially accentuating reduced saltiness. Salt also contributes to texture, so reduced NaCl may alter mouthfeel, further impacting perceived saltiness.
Psychological factors, like familiarity bias and labeling expectations, also affect perception. Consumers expecting traditional saltiness may rate seablite-substituted bread as less salty, especially if they know it contains a salt substitute. The trend of “too little” salt ratings with increased seablite substitution likely stems from reduced sodium content, seablite’s distinct profile, and consumer expectations. While seablite could replace up to 50% of sea salt in bread formulations, achieving expected saltiness might require flavor adjustments or enhancers.
Although reducing salt content is technically feasible, it may negatively affect flavor, impacting consumer preference (Lynch et al., 2009). Seablite offers a promising sodium-reduction alternative, potentially more effective than potassium-based substitutes like KCl, which can leave bitter or metallic aftertastes at higher concentrations (Sinopoli & Lawless, 2012).
3.4 JAR test
The results from JAR, which are categorical percentages for each sensory attribute of all samples, are shown in Table 6. Most of the samples, particularly 0% seablite substitute, received high JAR ratings for sweetness, with 82% of participants indicating the sweetness was at an optimal level. However, as the seablite powder increased (e.g., 100% seablite substitute), the percentage of “too little” sweetness responses increased. This shift suggests that consumers perceived a decrease in sweetness as the seablite substitute increased. Balanced sweetness is critical because it directly affects product acceptance, and sweetness perception can have a significant impact on overall liking (Stone & Sidel, 2004). According to Souza-Borges & Conti-Silva (2017) study, sweetness was the primary distinguishing factor between the bread samples, increasing from standard bread to inulin-enriched bread and peaking in oligofructose/inulin bread. This suggests that sweetness was an important variable in the sensory profile. Furthermore, the internal preference mapping shifted the consumer's preferences closer to the two fructan-enriched breads, implying that both samples with added sweetness matched consumer preferences. This study found that sweetness has a significant impact on consumer preferences for bread.
The JAR scale for saltiness showed a clear trend in Table 6. As the seablite powder increased, the percentage of respondents who rated the saltiness as “too little” also increased. For example, in 100% seablite substitute bread, 34% of participants found the saltiness too little. This suggests that samples with a higher seablite substitute might not match consumer expectations. According to Lawless & Heymann (2010), such imbalances in key sensory attributes can lead to diminished product acceptability. Achieving the right balance of saltiness is crucial, as it significantly affects the overall flavor profile. The increasing trend of “too little” responses indicates that the salt content may need to be raised as seablite substitute increase to maintain optimal flavor balance. However, in the hedonic test results shown in Table 5, the saltiness of the bread samples with varying ratios of seablite powder substitution was reported as non-significant (ns), meaning there were no statistically significant differences between the samples in terms of saltiness preference (p > 0.05). On the other hand, an increase in “too little” responses for saltiness as the seablite substitute increased, this apparent contradiction can be explained by a few factors.
Hedonic testing measures consumer liking or preference rather than the intensity of specific attributes like saltiness. The fact that saltiness was non-significant suggests that the difference in liking for saltiness between the samples was not strong enough to impact overall consumer preference. However, it does not necessarily mean that consumers did not perceive differences in saltiness intensity.
While the hedonic scores for saltiness showed no significant differences, the JAR scale (which was likely used to assess specific attribute intensity) revealed an increase in “too little” responses as the seablite substitute increased. This indicates that consumers were noticing a reduction in saltiness as the seablite substitute increased, but this reduction was not strong enough to significantly affect their overall liking of the product in the hedonic test.
Consumers may have detected a change in saltiness, but that change was not noticeable enough to affect their overall taste preference. This could be due to other compensating factors in the bread’s formulation, such as sweetness or texture, which balanced the experience and kept overall hedonic scores steady.
3.5 Penalty analysis
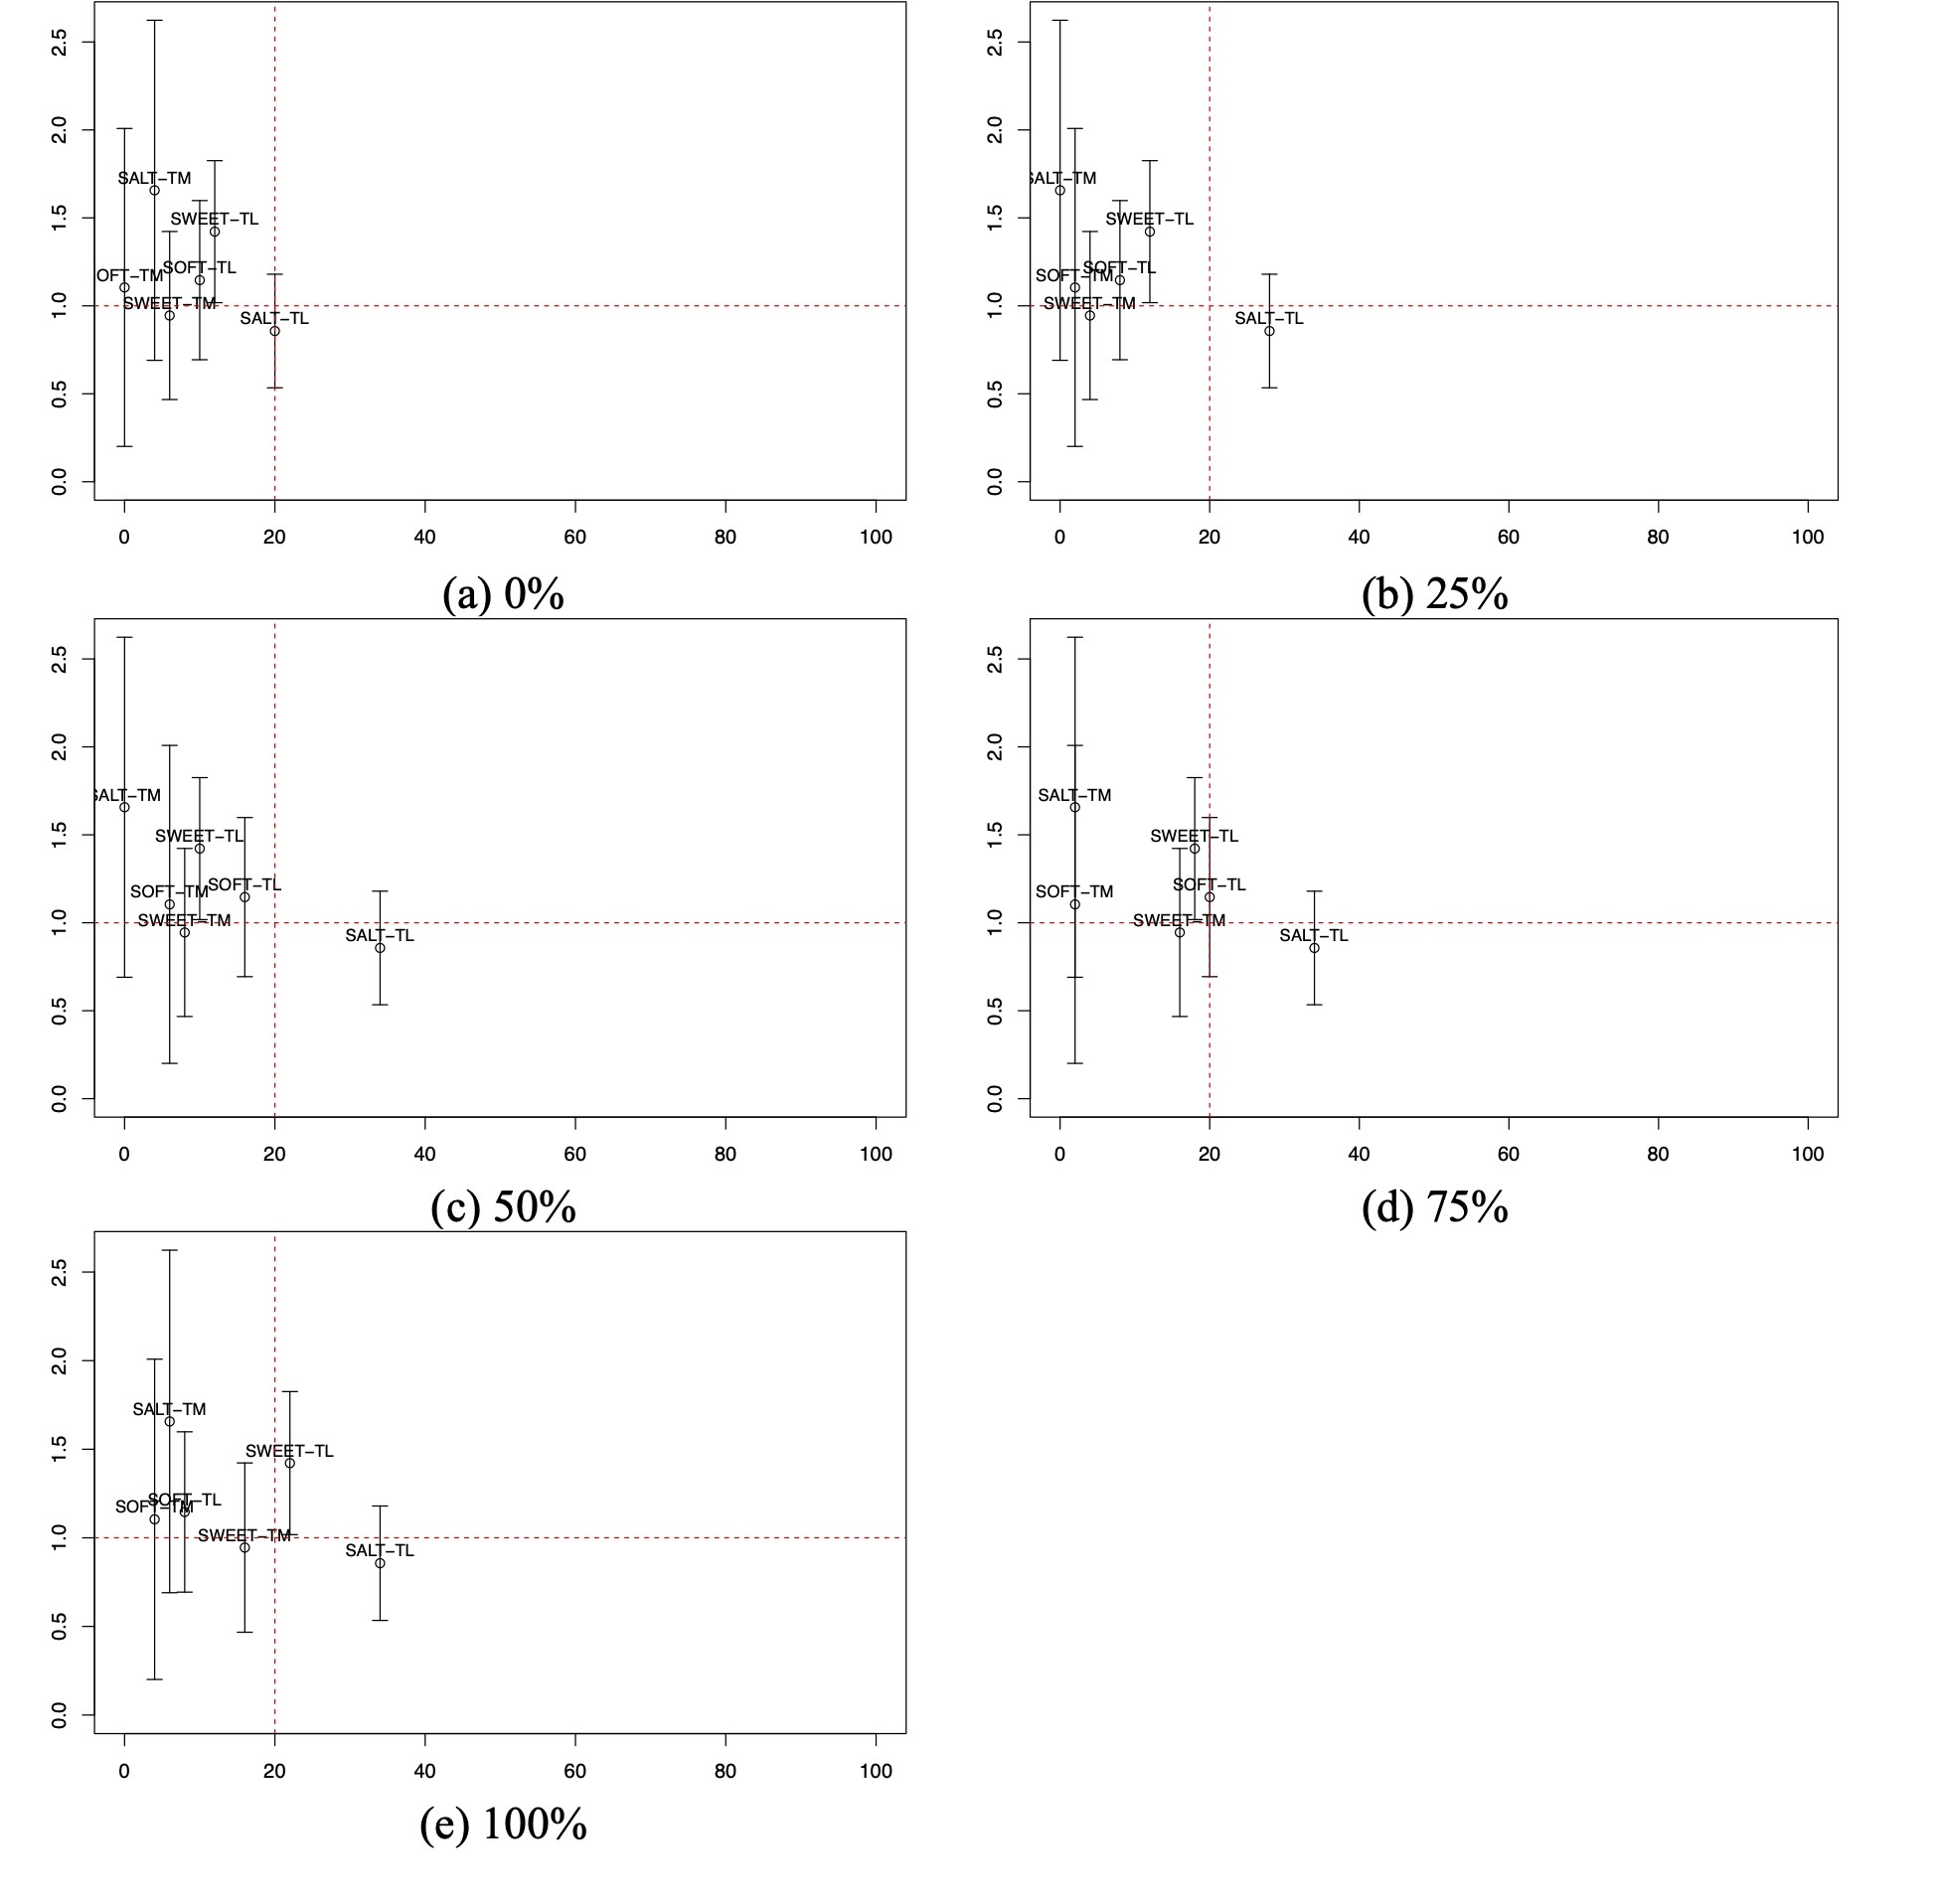
Figure 2 presents a penalty plot illustrating the relationship between the mean drop in sensory liking and the frequency of consumer responses for each non-JAR sensory attribute. The vertical red dashed line, set at the 20% frequency threshold, is commonly applied in penalty analysis as a critical indicator for potential attribute modification (Lawless & Heymann, 2010). This threshold serves as a practical guideline for determining whether an attribute’s deviation from the “JAR” level significantly influences consumer dissatisfaction. When more than 20% of consumers rate an attribute as either “too much” or “too little,” it signals a substantial deviation from consumer expectations. In contrast, if fewer than 20% of respondents express dissatisfaction, the attribute is generally deemed acceptable and unlikely to necessitate modification (Lawless, 2013). This 20% cut-off effectively identifies the attributes that exert the most considerable impact on overall product acceptance.
(a-e) represented the penalty score for each sensory attribute of bread substitution salt with seablite at 0, 25, 50, 75, and 100%, respectively; SWEET, SALY, and SOFT mean sweetness, saltiness, and softness, respectively; TL and TM mean too little and too much in the JAR rating.
The results from the penalty plots indicate that as the substitution level of seablite increases (from 0% to 100%), there is a noticeable impact on the perception of saltiness. Specifically, the “too little” ratings for saltiness show significant shifts across the substitution levels. For example, as the substitution levels up from 50% to 100% seablite, saltiness likely decreases due to the reduction of actual salt content, leading to a higher frequency of “too little” in saltiness ratings. This could suggest that seablite alone may not compensate for the sensory perception of salt.
The gradual substitution of seablite for salt has a marked impact on the overall sensory profile of bread. Penalty analysis offers valuable insights into the substitution levels that sustain consumer acceptance and those that lead to significant reductions in liking. The results indicate that a 50% seablite substitution provides an optimal balance between sodium reduction and sensory quality. This is further supported by the hedonic testing results in Table 5, which show no statistically significant differences in sensory attributes between 25% and 50% seablite substitution. Based on these findings, a seablite substitution level of up to 50% appears feasible without compromising sensory acceptance.
However, higher seablite substitution levels (75% and 100%) are less suitable. While the perception of “too little” saltiness did not significantly differ from that of the 25% or 50% seablite substitution, the hedonic test results in Table 5 reveal a considerable decline in overall liking scores for all sensory attributes when the substitution level increased from 50% to 75% and 100%. These results suggest that while moderate seablite substitution is viable, higher levels adversely affect consumer acceptance and product appeal. According to the results from the hedonic testing presented in Table 5, the saltiness of the bread samples showed no statistically significant difference (as indicated by “ns”). However, in the penalty analysis, more than 20% of consumers rated the saltiness as “too little.” The discrepancy between the results of hedonic testing and penalty analysis can be explained by differences in methodology, consumer expectations, and how individual attributes are perceived relative to the overall product.
In hedonic testing, the scores reflect overall liking of specific attributes such as saltiness, but do not explicitly assess whether an attribute is perceived as “too little” or “too much.” As a result, consumers may find the product acceptable even if there are deviations in saltiness. In contrast, penalty analysis specifically measures how deviations from the “JAR” level affect consumer liking (Lawless & Heymann, 2010). Thus, even if consumers do not express dissatisfaction with the saltiness in the hedonic test, they may still notice that it is less than expected or desired, leading them to rate it as “too little” in the penalty analysis.
Furthermore, penalty analysis is more focused on consumer expectations for specific attributes (Lawless & Heymann, 2010), like saltiness in this case. If consumers are used to a particular level of saltiness in bread, any reduction caused by seablite substitution, even if slight, might result in higher reports of “too little” saltiness in penalty analysis. This can occur even if consumers do not significantly dislike the bread overall, as reflected in the hedonic test results. Finally, hedonic testing involves an overall evaluation of multiple sensory attributes, such as crust color, texture, and taste. Even if the saltiness is not ideal, other sensory attributes may compensate, resulting in no significant drop in hedonic scores. In contrast, penalty analysis isolates each attribute, making deviations in saltiness more noticeable, which could explain the higher frequency of “too little” responses in the penalty.
4 Conclusion
This study demonstrated the feasibility of using seablite (Suaeda maritima L. Dumort) powder as a partial salt substitute in bread formulation to reduce sodium content. Substitution of up to 50% of the salt with seablite powder successfully reduced sodium levels without significantly compromising physical, chemical, or sensory properties of bread. Bread with 50% seablite substitution maintained acceptable texture, moisture, and sensory acceptance, while higher substitution levels (75% to 100%) negatively affected attributes such as taste, color, and overall liking. The results suggest that 50% substitution strikes an optimal balance between sodium reduction and consumer acceptance, providing a promising approach for developing healthier bread formulations aligned with global sodium reduction goals.
Acknowledgements
The author would like to offer particular thanks to Rajamangala University of Technology Krungthep and Kasetsart University for the research facilities. And all so to thank Ms.Nalin Athikarun, Ms.Samatchaya Hatthara and Mr.Naruphol Suantako for supporting this research.
-
Ethical statement
This project was approved by the Naresuan University-Network of Research Ethics Committee (NU-NREC) (COE No. 001/2024, NREC No. 0015/2567).
-
Data Availability Statement
All data generated or analyzed in this study are included in this published article.
-
Cite as:
Singti, W., Prachongpun, P., Sarasuk, C., Ngoenchai, P., & Niamsuk, J. (2026). Sodium-reduced bread formulated with seablite (Suaeda maritima L. Dumort) powder as salt substitution. Brazilian Journal of Food Technology, 29, e2025047. https://doi.org/10.1590/1981-6723.4725
-
Funding:
None.
References
-
Al Jawaldeh, A., & Al-Khamaiseh, M. (2018). Assessment of salt concentration in bread commonly consumed in the Eastern Mediterranean Region. Eastern Mediterranean Health Journal, 24(1), 18-24. PMid:29658617. https://doi.org/10.26719/2018.24.1.18
» https://doi.org/10.26719/2018.24.1.18 -
American Association of Cereal Chemists – AACC. (2009). Guidelines for Measurement of Volume by Rapeseed Displacement. In American Association of Cereal Chemists (Ed.), AACC International approved methods (11th ed.). St. Paul: AACC. https://doi.org/10.1094/AACCIntMethod-10-05.01
» https://doi.org/10.1094/AACCIntMethod-10-05.01 -
Arena, E., Muccilli, S., Mazzaglia, A., Giannone, V., Brighina, S., Rapisarda, P., Fallico, B., Allegra, M., & Spina, A. (2020). Development of durum wheat breads low in sodium using a natural low-sodium sea salt. Foods, 9(6), 752. PMid:32517162. https://doi.org/10.3390/foods9060752
» https://doi.org/10.3390/foods9060752 - Association of Official Analytical Chemists – AOAC. (2006). Official methods of analysis of AOAC International (18th ed.). Arlington: AOAC International.
-
Barroca, M. J., Flores, C., Ressurreição, S., Guiné, R., Osório, N., & Moreira Da Silva, A. (2023). Re-thinking table salt reduction in bread with halophyte plant solutions. Applied Sciences, 13(9), 5342. https://doi.org/10.3390/app13095342
» https://doi.org/10.3390/app13095342 -
Bartoshuk, L. M., Murphy, C., & Cleveland, C. T. (1978). Sweet taste of dilute NaCl: Psychophysical evidence for a sweet stimulus. Physiology & Behavior, 21(4), 609-613. PMid:740780. https://doi.org/10.1016/0031-9384(78)90138-5
» https://doi.org/10.1016/0031-9384(78)90138-5 -
Bassetti, E., Blankenship, J., White, J. M., Sweet, L., Threapleton, D., & Pries, A. M. (2023). Benchmarking the nutrient composition and labelling practices of dry or instant cereals for older infants and young children across seven Southeast Asian countries. Maternal & Child Nutrition, 19(Suppl 2), e13603. PMid:38092376. https://doi.org/10.1111/mcn.13603
» https://doi.org/10.1111/mcn.13603 -
Besbes, E., Jury, V., Monteau, J.-Y., & Le Bail, A. (2014). Effect of baking conditions and storage with crust on the moisture profile, local textural properties and staling kinetics of pan bread. Lebensmittel-Wissenschaft + Technologie, 58(2), 658-666. https://doi.org/10.1016/j.lwt.2014.02.037
» https://doi.org/10.1016/j.lwt.2014.02.037 -
Cappelli, A., & Cini, E. (2021). Challenges and opportunities in wheat flour, pasta, bread, and bakery product production chains: A systematic review of innovations and improvement strategies to increase sustainability, productivity, and product quality. Sustainability, 13(5), 2608. https://doi.org/10.3390/su13052608
» https://doi.org/10.3390/su13052608 -
Castañeda-Loaiza, V., Oliveira, M., Santos, T., Schüler, L., Lima, A. R., Gama, F., Salazar, M., Neng, N. R., Nogueira, J. M. F., Varela, J., & Barreira, L. (2020). Wild vs cultivated halophytes: Nutritional and functional differences. Food Chemistry, 333, 127536. PMid:32707417. https://doi.org/10.1016/j.foodchem.2020.127536
» https://doi.org/10.1016/j.foodchem.2020.127536 -
Civille, G. V., Carr, B. T., & Meilgaard, M. (2015). Sensory evaluation techniques (5th ed). Boca Raton: CRC Press. https://doi.org/10.1201/b19493
» https://doi.org/10.1201/b19493 -
Codină, G. G., Voinea, A., & Dabija, A. (2021). Strategies for reducing sodium intake in bakery products, a review. Applied Sciences, 11(7), 3093. https://doi.org/10.3390/app11073093
» https://doi.org/10.3390/app11073093 - Czuchajowska, Z., & Pomeranz, Y. (1989). Differential scanning calorimetry, water activity, and moisture contents in crumb center and near-crust zones of bread during storage. Cereal Chemistry, 66(4), 305-309.
- Damodaran, S., Parkin, K. L., & Fennema, O. R. (2008). Fennema’s food chemistry (4th ed.). Boca Raton: CRC Press/Taylor & Francis.
-
De Luca, L., Aiello, A., Pizzolongo, F., Blaiotta, G., Aponte, M., & Romano, R. (2021). Volatile organic compounds in breads prepared with different sourdoughs. Applied Sciences, 11(3), 1330. https://doi.org/10.3390/app11031330
» https://doi.org/10.3390/app11031330 -
Doyle, M. E., & Glass, K. A. (2010). Sodium reduction and its effect on food safety, food quality, and human health. Comprehensive Reviews in Food Science and Food Safety, 9(1), 44-56. PMid:33467812. https://doi.org/10.1111/j.1541-4337.2009.00096.x
» https://doi.org/10.1111/j.1541-4337.2009.00096.x -
Ferrari, G. T., Proserpio, C., Stragliotto, L. K., Boff, J. M., Pagliarini, E., & Oliveira, V. R. D. (2022). Salt reduction in bakery products: A critical review on the worldwide scenario, its impacts and different strategies. Trends in Food Science & Technology, 129, 440-448. https://doi.org/10.1016/j.tifs.2022.10.013
» https://doi.org/10.1016/j.tifs.2022.10.013 -
Foroni, F., Pergola, G., & Rumiati, R. I. (2016). Food color is in the eye of the beholder: The role of human trichromatic vision in food evaluation. Scientific Reports, 6(1), 37034. PMid:27841327. https://doi.org/10.1038/srep37034
» https://doi.org/10.1038/srep37034 - He, H., & Hoseney, R. C. (1990). Changes in bread firmness and moisture during long-term storage. Cereal Chemistry, 67, 603-608.
-
Jachimowicz-Rogowska, K., & Winiarska-Mieczan, A. (2023). Initiatives to reduce the content of sodium in food products and meals and improve the population’s health. Nutrients, 15(10), 2393. PMid:37242276. https://doi.org/10.3390/nu15102393
» https://doi.org/10.3390/nu15102393 -
Kilcast, D., & Den Ridder, C. (2007). Sensory issues in reducing salt in food products. In D. Kilcast & F. Angus (Eds.), Reducing salt in foods: Practical strategies (pp. 201-220). Boca Raton: Woodhead. https://doi.org/10.1533/9781845693046.2.201
» https://doi.org/10.1533/9781845693046.2.201 -
Lawless, H. T. (2013). Laboratory exercises for sensory evaluation (Vol. 2). New York: Springer. https://doi.org/10.1007/978-1-4614-5713-8
» https://doi.org/10.1007/978-1-4614-5713-8 -
Lawless, H. T., & Heymann, H. (2010). Sensory evaluation of food: Principles and practices (2nd ed.). New York: Springer. https://doi.org/10.1007/978-1-4419-6488-5
» https://doi.org/10.1007/978-1-4419-6488-5 -
Liem, D. G., Miremadi, F., & Keast, R. S. J. (2011). Reducing sodium in foods: The effect on flavor. Nutrients, 3(6), 694-711. PMid:22254117. https://doi.org/10.3390/nu3060694
» https://doi.org/10.3390/nu3060694 -
Lopes, M., Sanches-Silva, A., Castilho, M., Cavaleiro, C., & Ramos, F. (2023). Halophytes as source of bioactive phenolic compounds and their potential applications. Critical Reviews in Food Science and Nutrition, 63(8), 1078-1101. PMid:34338575. https://doi.org/10.1080/10408398.2021.1959295
» https://doi.org/10.1080/10408398.2021.1959295 -
Lynch, E. J., Dal Bello, F., Sheehan, E. M., Cashman, K. D., & Arendt, E. K. (2009). Fundamental studies on the reduction of salt on dough and bread characteristics. Food Research International, 42(7), 885-891. https://doi.org/10.1016/j.foodres.2009.03.014
» https://doi.org/10.1016/j.foodres.2009.03.014 -
Marco, E. R., Navarro, J. L., León, A. E., & Steffolani, M. E. (2022). Sodium chloride replacement by potassium chloride in bread: Determination of sensorial potassium threshold and effect on dough properties and breadmaking quality. International Journal of Gastronomy and Food Science, 27, 100486. PMid:36568859. https://doi.org/10.1016/j.ijgfs.2022.100486
» https://doi.org/10.1016/j.ijgfs.2022.100486 -
Matta, R., & Panchapakesan, P. (2021). Deflated Michelin: An exploration of the changes in values in the culinary profession and industry. Gastronomica, 21(3), 45-55. https://doi.org/10.1525/gfc.2021.21.3.45
» https://doi.org/10.1525/gfc.2021.21.3.45 -
Miller, R. A. & Hoseney, R. C. (2008). Role of salt in baking. Cereal Foods World, 53(1), 4-6. https://doi.org/10.1094/CFW-53-1-0004
» https://doi.org/10.1094/CFW-53-1-0004 -
Mohd Jusoh, Y. M., Chin, N. L., Yusof, Y. A., & Abdul Rahman, R. (2009). Bread crust thickness measurement using digital imaging and L a b colour system. Journal of Food Engineering, 94(3-4), 366-371. https://doi.org/10.1016/j.jfoodeng.2009.04.002
» https://doi.org/10.1016/j.jfoodeng.2009.04.002 -
Mondal, A., & Datta, A. K. (2008). Bread baking: A review. Journal of Food Engineering, 86(4), 465-474. https://doi.org/10.1016/j.jfoodeng.2007.11.014
» https://doi.org/10.1016/j.jfoodeng.2007.11.014 -
Mudau, M., Ramashia, S. E., Mashau, M. E., & Silungwe, H. (2021). Physicochemical characteristics of bread partially substituted with finger millet (Eleusine corocana) flour. Brazilian Journal of Food Technology, 24, e2020123. https://doi.org/10.1590/1981-6723.12320
» https://doi.org/10.1590/1981-6723.12320 -
Nahar, N., Madzuki, I. N., Nur, B. I., Ab Karim, S., Ghazali, M. H., & Karim, R. (2019). Bakery science of bread and the effect of salt reduction on quality: A review. Borneo Journal of Sciences and Technology, 1(1), 9-14. https://doi.org/10.35370/bjost.2019.1.1-03
» https://doi.org/10.35370/bjost.2019.1.1-03 - O’Sullivan, M. G. (2020). Salt, fat, and sugar reduction: Sensory approaches for nutritional reformulation of foods and beverages. Boca Raton: Woodhead Publishing.
-
Pająk, P., Habryka, C., & Fortuna, T. (2012). Changes in the physical properties of bread during storage. Potravinárstvo, 6(2), 42-45. https://doi.org/10.5219/194
» https://doi.org/10.5219/194 -
Pasqualone, A., Caponio, F., Pagani, M. A., Summo, C., & Paradiso, V. M. (2019). Effect of salt reduction on quality and acceptability of durum wheat bread. Food Chemistry, 289, 575-581. PMid:30955651. https://doi.org/10.1016/j.foodchem.2019.03.098
» https://doi.org/10.1016/j.foodchem.2019.03.098 -
Purlis, E. (2010). Browning development in bakery products: A review. Journal of Food Engineering, 99(3), 239-249. https://doi.org/10.1016/j.jfoodeng.2010.03.008
» https://doi.org/10.1016/j.jfoodeng.2010.03.008 -
Reißner, A.-M., Wendt, J., Zahn, S., & Rohm, H. (2019). Sodium-chloride reduction by substitution with potassium, calcium and magnesium salts in wheat bread. Lebensmittel-Wissenschaft + Technologie, 108, 153-159. https://doi.org/10.1016/j.lwt.2019.03.069
» https://doi.org/10.1016/j.lwt.2019.03.069 -
Ribotta, P. D., & Le Bail, A. (2007). Thermo-physical assessment of bread during staling. Lebensmittel-Wissenschaft + Technologie, 40(5), 879-884. https://doi.org/10.1016/j.lwt.2006.03.023
» https://doi.org/10.1016/j.lwt.2006.03.023 -
Saglimbene, V. M., Su, G., Wong, G., Natale, P., Ruospo, M., Palmer, S. C., Craig, J. C., Carrero, J. J., & Strippoli, G. F. M. (2021). Dietary intake in adults on hemodialysis compared with guideline recommendations. Journal of Nephrology, 34(6), 1999-2007. PMid:33591554. https://doi.org/10.1007/s40620-020-00962-3
» https://doi.org/10.1007/s40620-020-00962-3 -
Sinesio, F., Raffo, A., Peparaio, M., Moneta, E., Saggia Civitelli, E., Narducci, V., Turfani, V., Ferrari Nicoli, S., & Carcea, M. (2019). Impact of sodium reduction strategies on volatile compounds, sensory properties and consumer perception in commercial wheat bread. Food Chemistry, 301, 125252. PMid:31374532. https://doi.org/10.1016/j.foodchem.2019.125252
» https://doi.org/10.1016/j.foodchem.2019.125252 -
Sinopoli, D. A., & Lawless, H. T. (2012). Taste properties of potassium chloride alone and in mixtures with sodium chloride using a check‐all‐that‐apply method. Journal of Food Science, 77(9), S319-S322. PMid:22901084. https://doi.org/10.1111/j.1750-3841.2012.02862.x
» https://doi.org/10.1111/j.1750-3841.2012.02862.x -
Souza-Borges, P. K. D., & Conti-Silva, A. C. (2017). Sensory profile and evaluation of the degree of acceptability of bread produced with inulin and oligofructose. Brazilian Journal of Food Technology, 21(0), https://doi.org/10.1590/1981-6723.4016
» https://doi.org/10.1590/1981-6723.4016 -
Srivarathan, S., Phan, A. D. T., Hong, H. T., Netzel, G., Wright, O. R. L., Sultanbawa, Y., & Netzel, M. E. (2023). Nutritional composition and anti-nutrients of underutilized Australian indigenous edible halophytes – Saltbush, Seablite and Seapurslane. Journal of Food Composition and Analysis, 115, 104876. https://doi.org/10.1016/j.jfca.2022.104876
» https://doi.org/10.1016/j.jfca.2022.104876 - Stone, H., & Sidel, J. L. (2004). Sensory evaluation practices. New York: Springer.
-
Sudjaroen, Y. (2015). Evaluation for nutritive values and antioxidant activities of dried seablite (Suaeda maritima). Scientific Research and Essays, 10(9), 306-312. https://doi.org/10.5897/SRE2015.6203
» https://doi.org/10.5897/SRE2015.6203 -
Trumbo, P. R., Kirkpatrick, K. M., Roberts, J., Smith, P., & Zecca, P. (2023). Perspective: Challenges and strategies to reduce the sodium content of foods by the food service industry. Advances in Nutrition, 14(4), 592-598. PMid:37149264. https://doi.org/10.1016/j.advnut.2023.04.013
» https://doi.org/10.1016/j.advnut.2023.04.013 -
Tuhumury, H. (2020). The Effects of Salt on Bread: Technological Considerations for Reduced Salt Levels. AGRICA, 4(2), 134-141. https://doi.org/10.37478/agr.v4i2.458
» https://doi.org/10.37478/agr.v4i2.458 -
Walker, J. C., & Dando, R. (2023). Sodium replacement with KCl and MSG: Attitudes, perception and acceptance in reduced salt soups. Foods, 12(10), 2063. PMid:37238881. https://doi.org/10.3390/foods12102063
» https://doi.org/10.3390/foods12102063 -
World Health Organization – WHO. (2012). Report of the Formal Meeting of Member States to conclude the work on the comprehensive global monitoring framework, including indicators, and a set of voluntary global targets for the prevention and control of noncommunicable diseases (No. A/NCD/2). Geneva. Retrieved in 2025, May 14, from https://apps.who.int/gb/NCDs/pdf/A_NCD_2-en.pdf
» https://apps.who.int/gb/NCDs/pdf/A_NCD_2-en.pdf
Edited by
-
Associate Editor:
Juliano Lemos Bicas.
All data generated or analyzed in this study are included in this published article.