 Detection of adulteration in pasteurized milk using a non-targeted electrochemical methodology
Abstract
Milk is one of the most adulterated foods in the world. Water, urea, sucrose, or cheese whey are added to increase the volume of milk, cheat quality analysis methods, and achieve greater economic gains, which can affect the consumers’ health. Many analytical methodologies can be used to check for adulteration. Still, they focus on one or a few parameters and may not be disseminated in the production chain, due to their cost or complexity. Non-targeted methods, in turn, can be an alternative, as they determine the sample profile through chemometrics and allow discrimination between adulterated and unadulterated samples. This study proposes the use of the electrochemical methodology of differential pulse voltammetry and principal component analysis for the detection of adulterations of pasteurized milk with water, urea, and cheese whey. With the use of a homemade Cu/CuO electrode and differential pulse voltammetry, through changes in the electrical current at some applied potentials, it was possible to differentiate milk samples that were adulterated with reagent grade-urea, commercial urea, and cheese whey, from unadulterated samples, used as a reference. The inclusion of substances such as sucrose and sodium hypochlorite was also detected. The proposed methodology proved to be an efficient tool to assist the milk production chain in guaranteeing the quality of its products.
Keywords:
Chemical profile; Differential pulse voltammetry; Food quality; Urea, Cheese whey; Chemometrics
Highlights
Non-targeted electrochemical analysis combined with principal component analysis enabled discrimination between adulterated and unadulterated milk samples
Milk adulteration with urea, and cheese whey was detected using differential pulse voltammetry and a homemade Cu/CuO electrode
The proposed methodology is a cost-effective and efficient tool to ensure milk quality in the production chain
1 Introduction
The world milk production was 950 million tons in 2023, a 1.3% increase compared to 2022 and, in this context, Brazil produced 36.65 million tons (Food and Agricultural Organization, 2023). Consumption in Brazil reached 116.7 liters per inhabitant in 2022 (Empresa Brasileira de Pesquisa Agropecuária, 2023).
Among the most consumed foods in the world and often with a low market value, milk is also highly susceptible to fraud and adulteration. Milk is considered fraudulent when substances prohibited by law are added, such as water, acidity neutralizers, density restorers, preservative substances, or any foreign elements to its composition (Brasil, 2010).
These adulterations involve the addition of low-cost, low-quality, and sometimes dangerous products to increase volume, mask inferior quality, or replace natural substances in milk for economic gain. The most common practice is the addition of water, alongside masking agents such as sucrose, common salt, and cheese whey, used to achieve the desired density and cryoscopy measurements (Ferrão et al., 2007). Additionally, formaldehyde, hydrogen peroxide, hypochlorites, and salicylic acid are added to extend product shelf life (Souza et al., 2014; Jeong et al., 2015; Beloti, 2015; Vidal & Saran Netto, 2018), and cheese whey and urea are also used to control the protein content that was modified by dilution with water (Carvalho et al., 2015; Jha et al., 2015; Toledo et al., 2017).
Detecting these adulterations is a constant challenge given the audacity and knowledge of scammers in circumventing traditional analysis methods, requiring the development of new technologies. These include multi-optical sensors (Müller-Maatsch et al., 2021); diffuse reflectance spectroscopy (Toledo et al., 2017; Shalileh et al., 2023), and techniques highlighted in a review by Vinothkanna et al. (2024), such as 3D paper-based milk adulteration detection devices, smartphone-based digital image colorimetry (DIC), and laser-induced breakdown spectrophotometry (LIBS).
An interesting analytical approach is the non-targeted method, also known as profile analysis. This method involves analyzing a sample not to identify a specific analyte, but by utilizing various analytical signals obtained from different techniques in conjunction with chemometrics. The objective is to create a profile of the sample that can be compared to standards. This technique proves useful in discovering unknown compounds or detecting contaminants in a sample (Ballin & Laursen, 2019).
Within this approach, the utilization of electrochemical techniques employing low-cost electrodes, such as Cu/CuO, is noteworthy due to their electrical conductivity, high surface area, and biocompatibility (Leonardi et al., 2017). This study employed a non-targeted methodology utilizing a Cu/CuO electrode and differential pulse voltammetry to detect adulteration with urea or cheese whey, and other substances in pasteurized milk.
2 Material and methods
All reagents used are of analytical-grade purity. The water to prepare solutions was purified using a deionization column (Lucaderma) and a Milli-Q system (MilliPore®, water resistance of 18.2 MΩ cm-1 at 25.0 °C). A Shimadzu analytical balance, model ATY224r, was used with an error of ± 0.1 mg.
For adulteration analysis, three sources of nitrogen were used: reagent-grade urea (BIOTEC, 99.0%), commercial urea (45% N w/w), and cheese whey obtained from a cheesemaker. The addition of urea or whey as a nitrogen source is carried out in adulterations to simulate the protein content and cheat the physico-chemical analysis.
To check whether the urea sources contained impurities that could alter the results, the thermal properties of urea used as adulterant were analyzed using thermal gravimetric analysis (TGA) in a Perkin Elmer STA 6000 instrument. The mass of the samples placed in the porcelain crucible ranged from 5 to 10 mg, and the temperature was ramped from 30 °C to 550 °C at a heating rate of 10 °C min-1, with a nitrogen flow rate of 50 mL min-1. The derivative thermal gravimetric of the curve (DTGA) was then obtained through mathematical treatment.
Samples adulterated with urea were prepared with pasteurized milk with a fat content of 3% w/v, obtained from local stores. The milk samples were within their expiration date and registered with the Ministry of Agriculture and Livestock of Brazil. The pasteurized milk was adulterated with water in proportions between 7% w/v and 11% w/v. Next, reagent-grade urea or commercial urea was added (to simulate the protein content of 2.9% w/v), totaling five samples adulterated with analytical grade urea and five samples adulterated with commercial urea, as well as one sample without adulteration (reference). The final volume was 200 mL, obtained from a calibrated volumetric flask (± 0.15 mL).
Another adulteration was carried out through the simultaneous addition of water, urea, and substances normally used to correct density and cheat cryoscopic methods (sugar), in addition to masking the poor quality of the milk. Thus, 200 mL of pasteurized milk was mixed with 20 mL of purified water and 0.2222 g of urea (reagent grade or commercial grade). Commercial crystal sugar and sodium hypochlorite (NaClO) (Neon, 6% v/v content) were added to the adulterated sample until the concentrations were 1% w/v and 5% w/v for sucrose and a concentration of 1% v/v for hypochlorite until the density equals the reference sample.
Finally, the milk was also adulterated with cheese whey obtained from a cheesemaker, in a proportion of 10% v/v, in four independent adulterated samples.
In all procedures, the adulterated samples and reference samples were measured for pH, density, and ionic conductivity parameters, using a Bel Engineering PHS3BW pH meter, calibrated with reference buffer solution pH 10.01 (Elus instrumentation, batch: 0822-ELPHS10-0964), buffer solution pH 6.86 (Elus instrumentation batch: 1221-ELPHS6-0786) and buffer solution pH 4.00 (Neon, batch: 61847), and Digimed Dm-32 conductivity meter, calibrated with a reference electrolytic solution (MRC ISO 17034) of 1,408 μS cm-1 (Ellus instrumentation, batch: 0622-ELCOND1408-0915) and calibrated with a standard conductivity solution of 1,412 μS cm-1 (SpecSol batch: F22D0688G) obtaining a constant (k) of 1.03. Density was measured using a densimeter with a measuring range from 1,000 to 1,050 g mL-1.
Statistical tests (ANOVA, Tukey, Levene) were used to check the significance of the results at the 95% confidence level, using the Origin 9.0 software.
Before voltammetric measurements, all milk samples were treated to eliminate the fat and protein fraction, according to procedure 038/IV of the manual of physico-chemical methods for food analysis, from the Adolfo Lutz Institute (Zenebon et al., 2008). In 100 mL volumetric flasks, 10 mL of the adulterated milk sample, 50 mL of purified water, 2 mL of 30% zinc sulfate (w/v), and 2 mL of 15% (w/v) potassium ferrocyanide were homogenized; the meniscus was measured and left to rest for five minutes. Then, the solution was filtered through qualitative filter paper, and the filtrate was added with 0.4 g of sodium hydroxide reagent grade, and filtered again, obtaining a clear solution.
To produce the homemade working electrode, used in the electrochemical measurements, a copper wire with a purity of 99% and a diameter of 0.37 mm was initially treated with 400-grit sandpaper, and immersed in purified water in an ultrasonic bath for 10 minutes. Subsequently, the cleaned copper wire was submerged in a solution consisting of 10.0 mol L-1 sodium hydroxide (NaOH), 1.0 mol L-1 ammonium persulfate (NH4)2S2O8), and purified water (Milli-Q) in the ratio 4:2:9, respectively. After 1 hour, the copper wire was removed from the solution, rinsed with distilled water, and air-dried in a desiccator for 72 hours to form copper oxide, limiting the oxide contact area to 6.9 cm2 to fit in the electrochemical cell. Subsequently, the electrode was immersed in a 0.1 mol L-1 NaOH solution to maintain surface hydration with OH- ions (Guellis et al., 2020).
All voltammetric measurements were taken using the Autolab/PGSTAT101 potentiostat and the NOVA 1.12 software, with a three-electrode electrochemical cell. The reference electrode used was saturated Ag/AgCl/KCl, the auxiliary electrode was a stainless-steel plate, and the working electrode was homemade Cu/CuO. Differential pulse voltammetry (DPV) was used in a NaOH solution with a concentration of 0.1 mol L-1 as a supporting electrolyte. The study conditions were potentials between 0.0 and 1.1 V, sweep speed of 100 mV s-1, with a step of 0.005 V, modulation of 0.1 V, time modulation of 0.05 s, and 0.5 s interval.
The results obtained from DPV experiments and ionic conductivity were used in the non-targeted analysis using statistical tools of principal component analysis (PCA) to detect adulterations in the samples, with the Origin® 9 and Past® 4.03 software.
3 Results and discussion
During the production of the working electrode, the development of a blue film at the metal-solution interface was observed due to the formation of Cu(OH)2 with the presence of bubbles, indicating the formation of ammonia gas (NH3), as suggested by Equation 1. The occurrence of the reaction of the copper wire with the alkaline solution of sodium hydroxide and ammonium persulfate was evidenced by the appearance of the dark blue film. The copper hydroxide formed on the surface is a metastable phase and is quickly converted into black copper oxide. The metastable phase is converted into a stable phase by dehydration when drying is carried out under controlled conditions, according to Equation 2.
The characterization of the CuO film formed on the copper electrode can be found elsewhere (Peiter et al., 2017; Guellis et al., 2020).
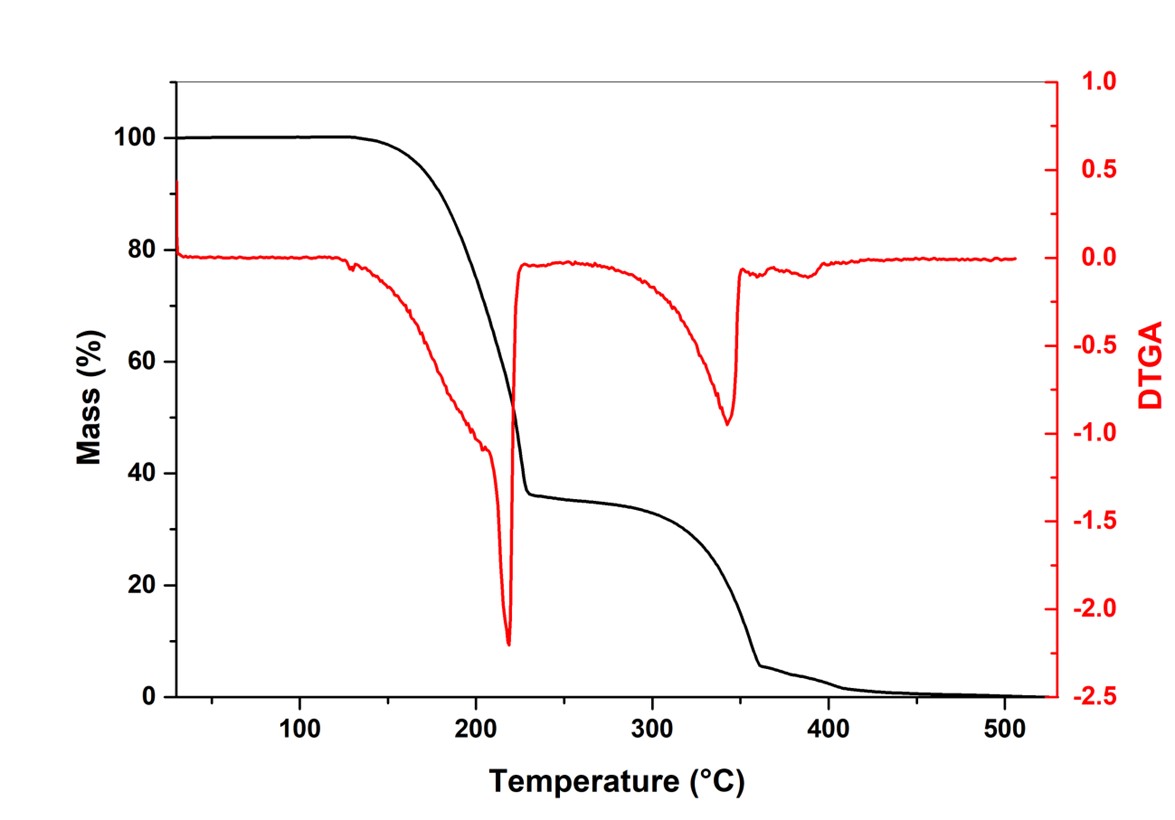
Figures 1 and 2 show thermograms (TGA) for reagent grade urea and commercial urea. Table 1 lists the results obtained from the derivative thermograms (DTGA).
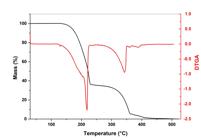
Thermal gravimetric curves (black) and derived from the thermal gravimetric curves (red) of the urea reagent grade.

Thermal gravimetric curves (black) and derived from the thermal gravimetric curves (red) of the commercial urea.
t 134.0 °C, reagent grade urea melts (135.0 °C, according to the manufacturer), and at 125.0 °C, for commercial urea. Then, the vaporization and decomposition of urea begins, with a maximum at T1, which generates ammonium cyanate, which, in turn, generates ammonia gas and cyanic acid, according to Equation 3 (Schaber et al., 2004).
AA series of complex reactions occurred, according to Schaber et al. (2004), with recombination of urea with cyanic acid to form biuret, decomposition of biuret, and cyanic acid (in T2) obtaining the species ammelide, cyanuric acid, ammeline, and melamine as decomposition products, until total decomposition and volatilization of the species. At 500.0 °C, virtually all urea (both reagent grade and commercial) decomposed, and the products were volatilized. The differences in temperatures obtained by TGA between reagent grade urea and commercial urea were of the order of 1.2% for T1 and 0.4% for T2, with no significant impurities being detected in commercial urea. These differences may be due to the difference in particle size and morphology of each urea (Rahmanian et al., 2015).
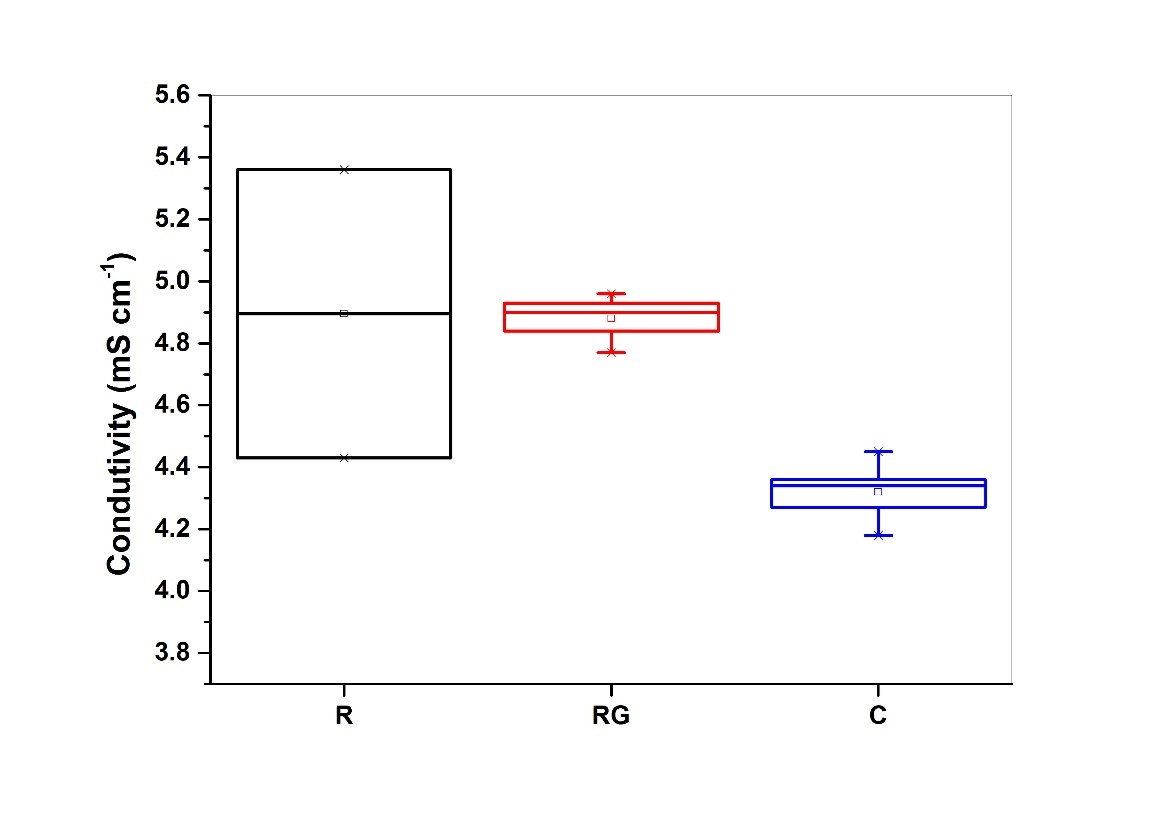
Table 2 lists the absolute conductivity of milk samples diluted with water in a proportion between 7 and 11% v/v, with correction for nitrogen content by adding reagent grade (RG) or commercial urea (C). Figure 3 illustrates the variability of the results using a boxplot.
Ionic conductivity of five samples adulterated with reagent grade urea and five samples adulterated with commercial urea, after diluting the milk with water between 7 and 11% v/v.

Ionic conductivity of fresh milk samples without added urea (R), with added reagent grade urea (RG) and commercial urea (C).
In Figure 3, a notable disparity in both the mean and median was observed in the ionic conductivity of commercial urea compared to the reference. Raw milk contains more than 80% water molecules (Zhu et al., 2014). Due to its solubility in water, urea tends to form large urea-water or urea-urea molecular aggregates, which depend on the amount added to milk (Lee et al., 1995; Grdadolnik & Maréchal, 2002). With the formation of these large molecular aggregates, the migration of ions in the milk-urea solution is affected (Mabrook & Petty, 2003; Henningsson et al., 2005).
According to Tukey’s test, there was a significant difference at the 95% confidence level between milk samples with commercial urea and reagent grade urea, and between commercial urea and the reference sample. The Analysis of Variance (ANOVA) evidenced a statistically significant difference between treatments, with a p-value < 0.05. Levene's test also showed a significant difference between variances.
The pH of homogenized milk ranges between 6.6 and 6.8, with an average of 6.7 at 20 °C or 6.6 at 25 °C (Silva, 1997). Table 3 presents the absolute pH values measured in the samples. Figure 4 shows the results of pH variation in the milk samples diluted with water in a proportion between 7 and 11% v/v, with correction for nitrogen content by adding reagent grade (RG) or commercial urea (C).
pH of five milk samples adulterated with reagent grade urea (RG) and five milk samples adulterated with commercial urea (C), after diluting the milk with water between 7 and 11% v/v.

Values of pH in milk samples without added urea (R), with added reagent grade urea (RG) and commercial urea (C).
The variation between the quartiles for commercial urea was small, whereas, for reagent grade urea, the quartiles were far from the average and with outliers. There was no significant difference between the pairs at the 95% confidence level, using Tukey’s test. The ANOVA indicated no significant difference between treatments, with a p-value < 0.05. Levene's test similarly showed no significant difference between variances.
Urea hydrolyzes slowly at room temperature, generating ammonia and carbon dioxide gases. Ammonia in an aqueous medium dissociates into ammonium and hydroxyl ions, which can change the pH of the medium, according to Equations 4 and 5 (Boggs et al., 2009). Kb values at 25.0 °C.
However, the pH of the adulterated samples changed minimally, likely due to two factors: the slow hydrolysis kinetics of urea, which generated minimal amounts of hydroxyl ions during the test period, and the possible presence of traces of lactic acid in the milk samples resulting from the gradual degradation of lactose. Nevertheless, the pasteurization of milk adulterated with urea can accelerate its hydrolysis and alter the physical-chemical and organoleptic characteristics of the product. Therefore, the pH variable is not the most effective measure to evaluate milk adulteration.
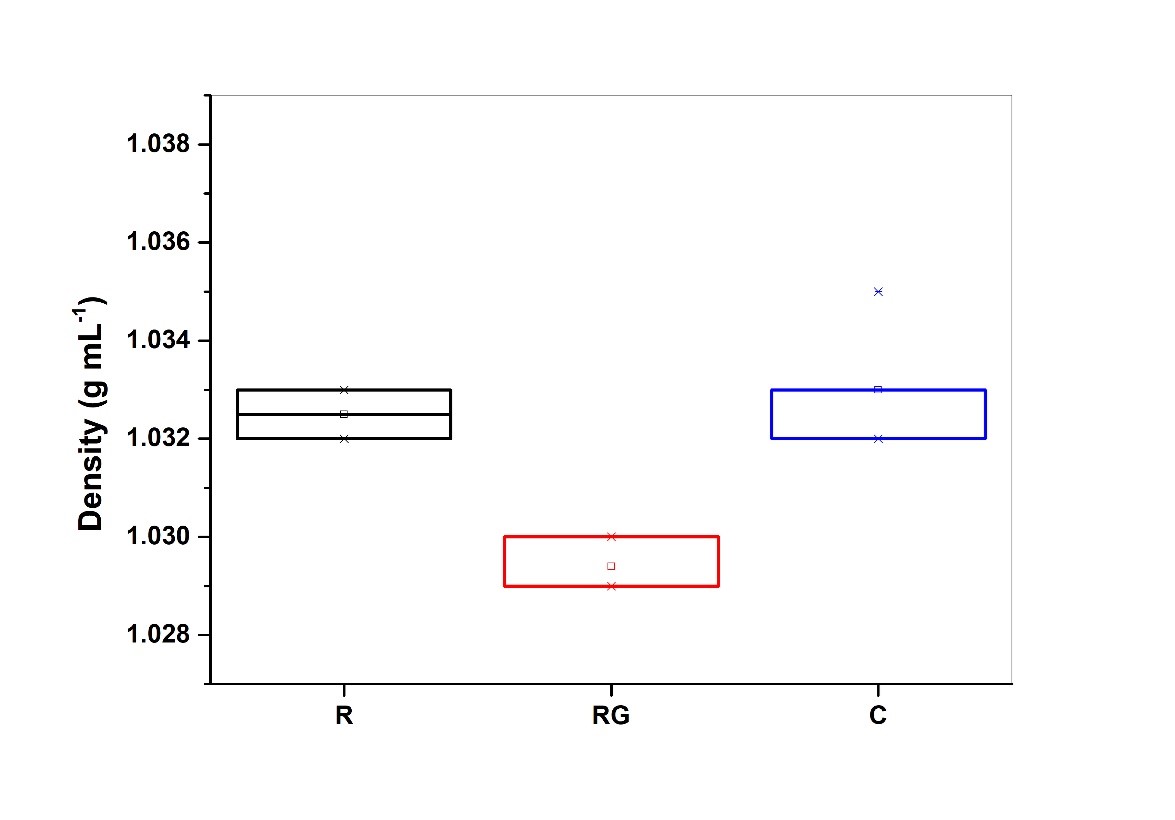
Figure 5 presents the results of density variation with urea adulteration. There was a significant difference between the pairs of commercial urea and reagent grade urea, and between reagent grade urea and reference, at the 95% confidence level, according to Tukey’s test. The ANOVA results evidenced a significant difference between treatments, with a p-value < 0.05. Levene's test showed no significant difference between variances. Table 4 presents the results of the absolute density of milk samples.

Density of milk samples without added urea (R), with added reagent grade urea and commercial urea (C).
According to the Regulation for the Industrial and Sanitary Inspection of Products of Animal Origin, the minimum and maximum limits of the relative density of milk at 15 °C are 1.028 and 1.034 g mL-1, respectively (Brasil, 2002). In the present study, the reduction observed in adulterated samples was 0.29%, indicating that density is an ineffective parameter for detecting adulterations.
The cheese whey used in adulteration had pH = 6.66 ± 0.02, with electrical conductivity of 7.97 ± 0.01 mS cm-1, and density of 1.034 ± 0.001 g mL-1 (triplicate).
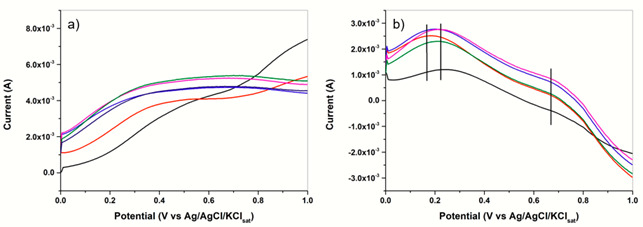
The characteristic DPV of the pasteurized milk samples adulterated with reagent-grade urea is shown in Figure 6a, and the DPV corrected for the supporting electrolyte signal is shown in Figure 6b.

(a) Differential pulse voltammetry (DPV) of the five milk samples adulterated (color lines) with reagent grade-urea, in 0.1 mol L-1 NaOH supporting electrolyte. Applied potential between 0.0 and 1.1 V, sweep speed of 100 mV s-1, with a step of 0.005 V, modulation of 0.1 V, time modulation of 0.05 s, and interval of 0.5 sec. Ag/AgCl/KClsat reference electrode. Temperature 25.0 °C. The black line is the supporting electrolyte; (b) DPV normalized by the supporting electrolyte curve. The black line is the signal from the unadulterated milk sample. The bars indicate the potentials used in the PCA.
The peak at 0.180-0.22 V indicates the oxidation of urea in a basic medium, according to Equation 6 (Zhu et al., 2020). The increase in current potential above 0.85V refers to the oxidation of the electrolyte, with the evolution of gaseous oxygen (Skoog et al., 2007).
In the PCA analysis, DPV potentials of 0.180 V (E1); 0.220V (E2); 0.660 V (E3), and ionic conductivity values were used. Figure 7 illustrates the PCA results for adulterations with reagent grade urea and commercial urea in dilution proportions with water between 7 and 11% v/v.
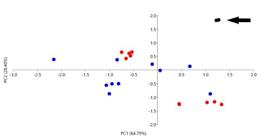
Score plots of PCA (correlation and auto-scaled) for pasteurized milk adulterated with reagent grade urea (RG - Red) and commercial urea (C - Blue). The arrow indicates the reference samples of pasteurized milk (unadulterated). Currents obtained from potentials of 0.180 V (E1); 0.220V (E2); 0.660 V (E3), and ionic conductivity values were used for PCA matrix construction.
Figure 7 shows the distribution of milk samples, which distinguished the group of unadulterated milk samples from those adulterated with either reagent grade-urea or commercial urea. This latter is used in adulterations in the milk production chain.
The observed dispersion of samples adulterated with commercial urea may be related to the sample matrix, as the manufacturer only provides a guarantee for the nitrogen content (45% N w/w), with no information on purity, additives, or particle size.
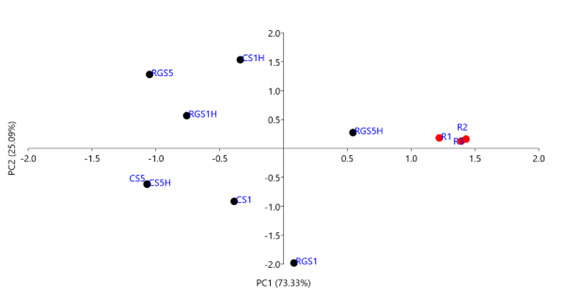
Figure 8 illustrates the PCA results for samples adulterated with reagent grade urea and commercial urea, with the addition of sucrose at 1% w/v and 5% w/v, and sodium hypochlorite at 1% v/v.

Score plots of PCA (correlation and auto-scaled) for pasteurized milk adulterated with reagent grade urea and commercial urea, with the addition of sucrose and sodium hypochlorite. Currents obtained from potentials of 0.180 V (E1); 0.220 V (E2); 0.660 V (E3), and ionic conductivity values were used for PCA matrix construction. RG are samples adulterated with reagent grade urea, and C are samples adulterated with commercial urea. S1 and S5 are samples adulterated with sucrose at 1% w/v and 5% w/v, respectively, and H refers to the addition of sodium hypochlorite at 1% v/v. R1 to R3 (in red) are pasteurized milk samples used as references (unadulterated).
The characteristic DPV of pasteurized milk samples adulterated with 10% v/v cheese whey is shown in Figure 9a, and the DPV corrected for the supporting electrolyte signal is shown in Figure 9b. The DPV current values were obtained from the same potential values used in the other adulterations. Figure 10 presents the PCA score plots for milk samples adulterated only with cheese whey.
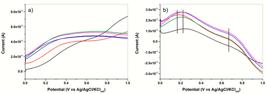
(a) Differential pulse voltammetry (DPV) of the five milk samples adulterated (color lines) with cheese whey, in 0.1 mol L-1 NaOH supporting electrolyte. Applied potential between 0.0 and 1.1 V, sweep speed of 100 mV s-1, with a step of 0.005 V, modulation of 0.1 V, time modulation of 0.05 s, and interval of 0.5 sec. Ag/AgCl/KClsat reference electrode. Temperature 25.0 °C. The black line is the supporting electrolyte; (b) DPV normalized by the supporting electrolyte curve. The black line is the signal from the unadulterated milk sample. The bars indicate the potential used in the PCA.

Score plots of PCA analysis (correlation and auto-scaled) for pasteurized milk samples adulterated with 10% v/v cheese whey (CW1 to CW4, in red). R1, R2, and R3 (black) refer to reference pasteurized milk (unadulterated). Currents obtained from potentials of 0.180 V (E1); 0.220V (E2); 0.660 V (E3), and ionic conductivity values were used for PCA matrix construction.
Whey, a residual byproduct of cheese production, predominantly consists of lactose, protein, salts, and water (Carvalho et al., 2007), facilitating the milk adulteration process. Brazilian legislation determines that milk with a glycomacropeptide (GMP) content above 30 mg L-1 cannot be used for consumption, as it indicates that cheese whey has been added or that is poor quality milk. The method for detecting GMP is expensive (High Performance Liquid Chromatography - HPLC) and is not available at all points in the milk production chain (Andrade, 2014), which shows the importance of the non-targeted electrochemical methodology developed.
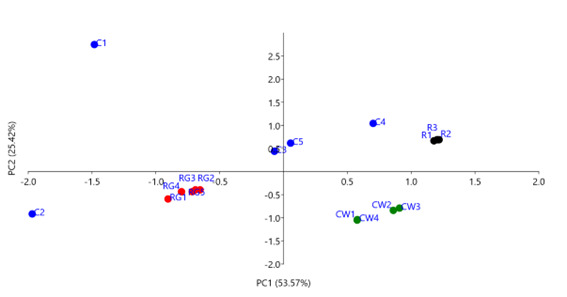
Figure 11 presents in a single plot the PCA results for all samples adulterated with commercial urea, reagent grade urea, and cheese whey, showing the feasibility of the methodology in discriminating adulterated from unadulterated samples.
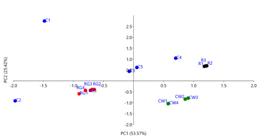
Score plots of PCA (correlation and auto-scaled) for pasteurized milk samples adulterated with reagent grade urea (RG - Red), commercial urea (C - Blue), and cheese whey (CW - Green). R1, R2, and R3 refer to reference pasteurized milk (unadulterated). Currents obtained from potentials of 0.180 V (E1); 0.220 V (E2); 0.660 V (E3), and ionic conductivity values were used for PCA matrix construction.
Compared to unadulterated milk samples, adulterations made by adding water and correcting the nitrogen content (an indicator of protein content) with urea were detected by the chemometric method (PCA) and the electrochemical technique. Samples adulterated with reagent grade urea were more clustered, while the samples adulterated with commercial urea were more dispersed, but they all differed from the reference samples. Samples adulterated with cheese whey differed from the other groups, indicating the possibility of detecting alterations in the milk by adding urea or cheese whey, both low-cost products used to correct the protein content in adulterated milk.
4 Conclusions
The proposed non-targeted method detected adulteration in pasteurized milk with urea, sucrose, and cheese whey. This method does not require high-cost or complex equipment and can be used for field measurements (in situ). Therefore, the combination of voltammetric technique and chemometrics can be a valuable tool for ensuring product quality and combating fraud in the milk production chain.
-
Cite as:
Fagundes, C. A., Pinheiro, V. L. R., & Lindino, C. A. (2025). Detection of adulteration in pasteurized milk using a non-targeted electrochemical methodology. Brazilian Journal of Food Technology, 28, e2024034. https://doi.org/10.1590/1981-6723.03424
-
Funding:
Coordenação de Aperfeiçoamento de Pessoal de Nível Superior - Brasil (CAPES) - Código de Financiamento 001
References
-
Andrade, R. B. (2014). Método de ensaio: MET POA/04/03/01: Determinação de Índice de CMP por SEC. Porto Alegre: Laboratório Nacional Agropecuário. Retrieved in 2024, April 05, from https://wikisda.agricultura.gov.br/pt-br/Laborat%C3%B3rios/Metodologia/POA/moapoa-qui
» https://wikisda.agricultura.gov.br/pt-br/Laborat%C3%B3rios/Metodologia/POA/moapoa-qui -
Ballin, N. Z., & Laursen, K. H. (2019). To target or not to target? Definitions and nomenclature for targeted versus non-targeted analytical food authentication. Trends in Food Science & Technology, 86, 537-543. http://doi.org/10.1016/j.tifs.2018.09.025
» http://doi.org/10.1016/j.tifs.2018.09.025 - Beloti, V. (2015). Leite: Obtenção, inspeção e qualidade. Londrina: Editora Planta.
-
Boggs, B. K., King, R. L., & Botte, G. G. (2009). Urea electrolysis: Direct hydrogen production from urine. Chemical Communications, 32(32), 4859-4861. PMid:19652805. http://doi.org/10.1039/b905974a
» http://doi.org/10.1039/b905974a -
Brasil. Ministério da Agricultura, Pecuária e Abastecimento. (2002, setembro 20). Aprova os regulamentos técnicos de produção, identidade e qualidade do leite tipo A, do leite tipo B, do leite tipo C, do leite pasteurizado e do leite cru refrigerado e o regulamento técnico da coleta de leite cru refrigerado e seu transporte a granel (Instrução normativa nº 51, de 18 de setembro de 2002). Diário Oficial [da] República Federativa do Brasil, Brasília. Retrieved in 2024, April 05, from https://www.camara.leg.br/proposicoesWeb/prop_mostrarintegra?codteor=141673&filename=LegislacaoCitada%20INC%20611/2003
» https://www.camara.leg.br/proposicoesWeb/prop_mostrarintegra?codteor=141673&filename=LegislacaoCitada%20INC%20611/2003 -
Brasil. Ministério da Agricultura Pecuária e Abastecimento. (2010, março 3). Regulamenta a Instrução Normativa nº 7, de 2 de março de 2010, que dispõe sobre aprovar o método oficial de determinação de CMP em leite, por HPLC, eletroforese capilar e espectrometria de massas em leite, em apresentações integrais, semidesnatadas e desnatadas, tratados por processos de UHT ou pasteurização (Instrução normativa MAPA nº 7 de 02/03/2010). Diário Oficial [da] República Federativa do Brasil, Brasília. Retrieved in 2024, April 05, from https://www.legisweb.com.br/legislacao/?id=78484
» https://www.legisweb.com.br/legislacao/?id=78484 -
Carvalho, B. M. A., Carvalho, L. M., Alcântara, L. A. P., & Bonomo, R. C. F. (2007). Métodos de detecção de fraude em leite por adição de soro de queijo. Revista Electrónica de Veterinaria, 8(6), 1-7. Retrieved in 2024, April 05, from https://www.redalyc.org/pdf/636/63612660004.pdf
» https://www.redalyc.org/pdf/636/63612660004.pdf -
Carvalho, B. M. A., Carvalho, L. M., Coimbra, J. S. R., Minim, L. A., Barcellos, E. S., Silva Júnior, W. F., & Carvalho, G. G. P. (2015). Rapid detection of whey in milk powder samples by spectrophotometric and multivariate calibration. Food Chemistry, 174, 1-7. PMid:25529644. http://doi.org/10.1016/j.foodchem.2014.11.003
» http://doi.org/10.1016/j.foodchem.2014.11.003 -
Empresa Brasileira de Pesquisa Agropecuária – Embrapa. (2023). Anuário Leite 2023. Embrapa Gado de Leite. Retrieved in 2024, April 05, from https://www.infoteca.cnptia.embrapa.br/infoteca/bitstream/doc/1154264/1/Anuario-Leite-2023.pdf
» https://www.infoteca.cnptia.embrapa.br/infoteca/bitstream/doc/1154264/1/Anuario-Leite-2023.pdf -
Ferrão, M. F., Mello, C., Borin, A., Maretto, D. A., & Poppi, R. J. (2007). LS-SVM: Uma nova ferramenta quimiométrica para regressão multivariada. Comparação de modelos de regressão LS-SVM e PLS na quantificação de adulterantes em leite em pó empregando NIR. Química Nova, 4(30), 852-859. http://doi.org/10.1590/S0100-40422007000400018
» http://doi.org/10.1590/S0100-40422007000400018 - Food and Agricultural Organization – FAO. (2023). Dairy market review: Emerging trends and outlook in 2023 Rome: FAO.
-
Grdadolnik, J., & Maréchal, Y. (2002). Urea and urea-water solutions: An infrared study. Journal of Molecular Structure, 615(1-3), 177-189. http://doi.org/10.1016/S0022-2860(02)00214-4
» http://doi.org/10.1016/S0022-2860(02)00214-4 -
Guellis, C., Valério, D. C., Bessegato, G. G., Boroski, M., Dragunski, J. C., & Lindino, C. A. (2020). Non-targeted method to detect honey adulteration: Combination of electrochemical and spectrophotometric responses with principal component analysis. Journal of Food Composition and Analysis, 89, 103466. http://doi.org/10.1016/j.jfca.2020.103466
» http://doi.org/10.1016/j.jfca.2020.103466 -
Henningsson, M., Östergren, K., & Dejmek, P. (2005). The electrical conductivity of milk: The effect of dilution and temperature. International Journal of Food Properties, 8(1), 15-22. http://doi.org/10.1081/JFP-200048143
» http://doi.org/10.1081/JFP-200048143 -
Jeong, H., Chung, H., Song, S., Kim, C., Lee, J., & Kim, Y. (2015). Validation and determination of the contents of acetaldehyde and formaldehyde in foods. Toxicological Research, 31(3), 273-278. PMid:26483886. http://doi.org/10.5487/TR.2015.31.3.273
» http://doi.org/10.5487/TR.2015.31.3.273 -
Jha, S. N., Jaiswal, P., Borah, A., Gautam, A. K., & Srivastava, N. (2015). Detection and quantification of urea in milk using attenuated total reflectance-fourier transform infrared spectroscopy. Food and Bioprocess Technology, 8(4), 926-933. http://doi.org/10.1007/s11947-014-1455-y
» http://doi.org/10.1007/s11947-014-1455-y -
Lee, C., Stahlberg, E. A., & Fitzgerald, G. (1995). Chemical structure of urea in water. Journal of Physical Chemistry, 99(50), 17737-17741. http://doi.org/10.1021/j100050a011
» http://doi.org/10.1021/j100050a011 -
Leonardi, S. G., Marini, S., Espro, C., Bonavita, A., Galvagno, S., & Neri, G. (2017). In-situ grew flower-like nanostructured CuO on screen-printed carbon electrodes for non-enzymatic amperometric sensing of glucose. Mikrochimica Acta, 184(7), 2375-2385. http://doi.org/10.1007/s00604-017-2232-1
» http://doi.org/10.1007/s00604-017-2232-1 -
Mabrook, M. F., & Petty, M. C. (2003). Effect of composition on the electrical conductance of milk. Journal of Food Engineering, 60(3), 321-325. http://doi.org/10.1016/S0260-8774(03)00054-2
» http://doi.org/10.1016/S0260-8774(03)00054-2 -
Müller-Maatsch, J., Alewijn, M., Wijtten, M., & Weesepoel, Y. (2021). Detecting fraudulent additions in skimmed milk powder using a portable, hyphenated, optical multi-sensor approach in combination with one-class classification. Food Control, 121, 107744. http://doi.org/10.1016/j.foodcont.2020.107744
» http://doi.org/10.1016/j.foodcont.2020.107744 -
Peiter, A., Fiuza, T. E. R., de Matos, R., Antunes, A. C., Antunes, S. R. M., & Lindino, C. A. (2017). System development for concomitant degradation of pesticides and power generation. Water, Air, and Soil Pollution, 228(3), 114. http://doi.org/10.1007/s11270-017-3298-4
» http://doi.org/10.1007/s11270-017-3298-4 -
Rahmanian, N., Naderi, S., Supuk, E., Abbas, R., & Hassanpour, A. (2015). Urea Finishing process: Prilling versus granulation. Procedia Engineering, 102, 174-181. http://doi.org/10.1016/j.proeng.2015.01.122
» http://doi.org/10.1016/j.proeng.2015.01.122 -
Schaber, P. M., Colson, J., Higgins, S., Thielen, D., Anspach, B., & Brauer, J. (2004). Thermal decomposition (pyrolysis) of urea in an open reaction vessel. Thermochimica Acta, 424(1-2), 131-142. http://doi.org/10.1016/j.tca.2004.05.018
» http://doi.org/10.1016/j.tca.2004.05.018 -
Shalileh, F., Sabahi, H., Dadmehr, M., & Hosseini, M. (2023). Sensing approaches toward detection of urea adulteration in milk. Microchemical Journal, 193, 108990. http://doi.org/10.1016/j.microc.2023.108990
» http://doi.org/10.1016/j.microc.2023.108990 -
Silva, P. H. F. (1997). Leite: Aspectos de composição e propriedades. Química Nova, 6, 3-5. Retrieved in 2024, April 05, from http://qnesc.sbq.org.br/online/qnesc06/quimsoc.pdf
» http://qnesc.sbq.org.br/online/qnesc06/quimsoc.pdf - Skoog, D. A., Holler, F. J., & Crouch, S. R. (2007). Principles of Instrumental Analysis (6th ed.). New York: Thomson Brooks/Cole.
-
Souza, G. C. S., Silva, P. A. B., Leotério, D. M. S., Paim, A. P. S., & Lavorante, A. F. (2014). A multicommuted flow system for fast screening/sequential spectrophotometric determination of dichromate, salicylic acid, hydrogen peroxide, and starch in milk samples. Food Control, 46, 127-135. http://doi.org/10.1016/j.foodcont.2014.05.021
» http://doi.org/10.1016/j.foodcont.2014.05.021 -
Toledo, P. R. A. B., Toci, A. T., Pezza, H. R., & Pezza, L. (2017). A fast and simple method for identification of adulteration of cow’s milk with urea using diffuse reflectance spectroscopy. Analytical Methods, 9(45), 6357-6364. http://doi.org/10.1039/C7AY02354E
» http://doi.org/10.1039/C7AY02354E - Vidal, A. M. C., & Saran Netto, A. (2018). Obtenção e processamento do leite e derivados. Pirassununga: Faculdade de Zootecnia e Engenharia de Alimentos, Universidade de São Paulo.
-
Vinothkanna, A., Dar, O. I., Liu, Z., & Jia, A.-Q. (2024). Advanced detection tools in food fraud: A systematic review for holistic and rational detection method based on research and patents. Food Chemistry, 446, 138893. http://doi.org/10.1016/j.foodchem.2024.138893
» http://doi.org/10.1016/j.foodchem.2024.138893 - Zenebon, O., Pascuett, N. S., & Tiglea, P. (2008). Métodos físico-químicos para análise de alimentos. São Paulo: Instituto Adolfo Lutz.
-
Zhu, B., Liang, Z., & Zou, R. (2020). Designing advanced catalysts for energy conversion based on urea oxidation reaction. Small, 16(7), e1906133. PMid:31913584. http://doi.org/10.1002/smll.201906133
» http://doi.org/10.1002/smll.201906133 -
Zhu, X., Guo, W., Jia, Y., & Kang, F. (2014). Dielectric properties of raw milk as functions of protein content and temperature. Food and Bioprocess Technology, 8(3), 670-680. http://doi.org/10.1007/s11947-014-1440-5
» http://doi.org/10.1007/s11947-014-1440-5
Edited by
-
Associate Editor:
Marlon Martins dos Reis.