 Simultaneous determination of venetoclax and obinutuzumab by LC-MS/MS and its application to pharmacokinetic drug interaction studies
Abstract
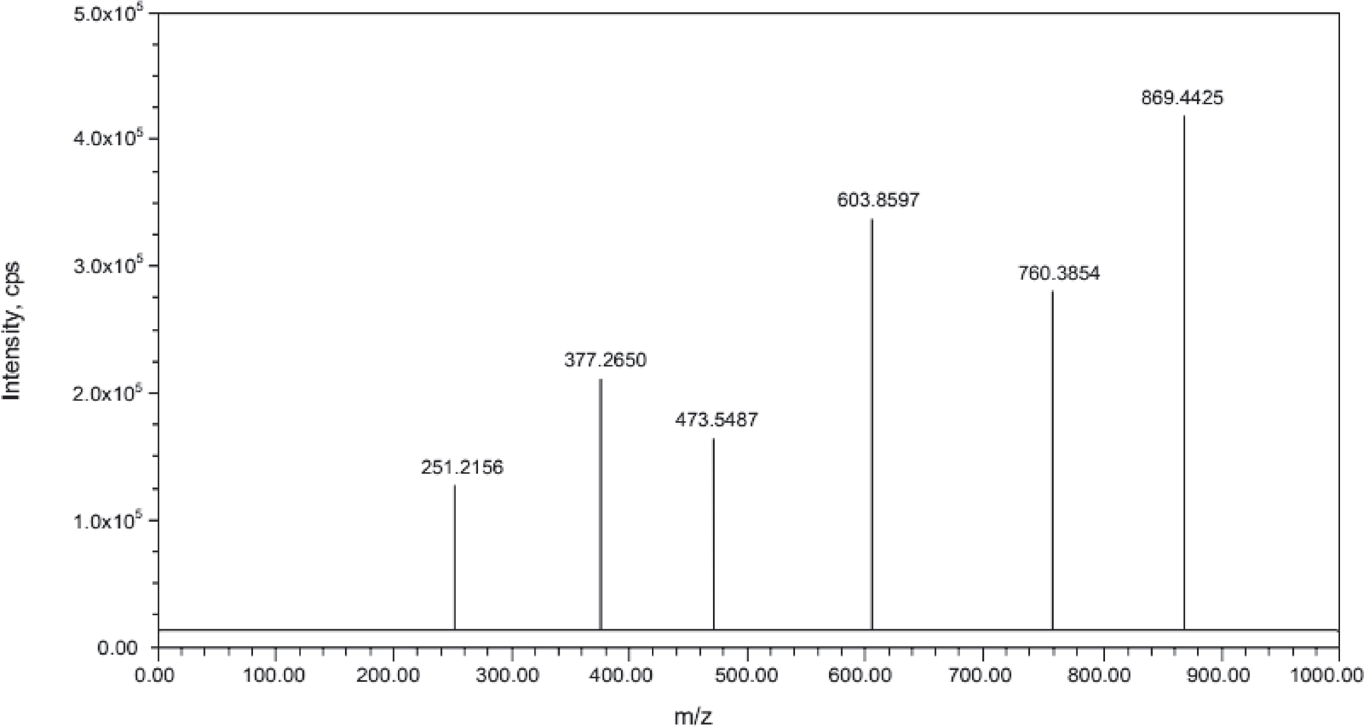
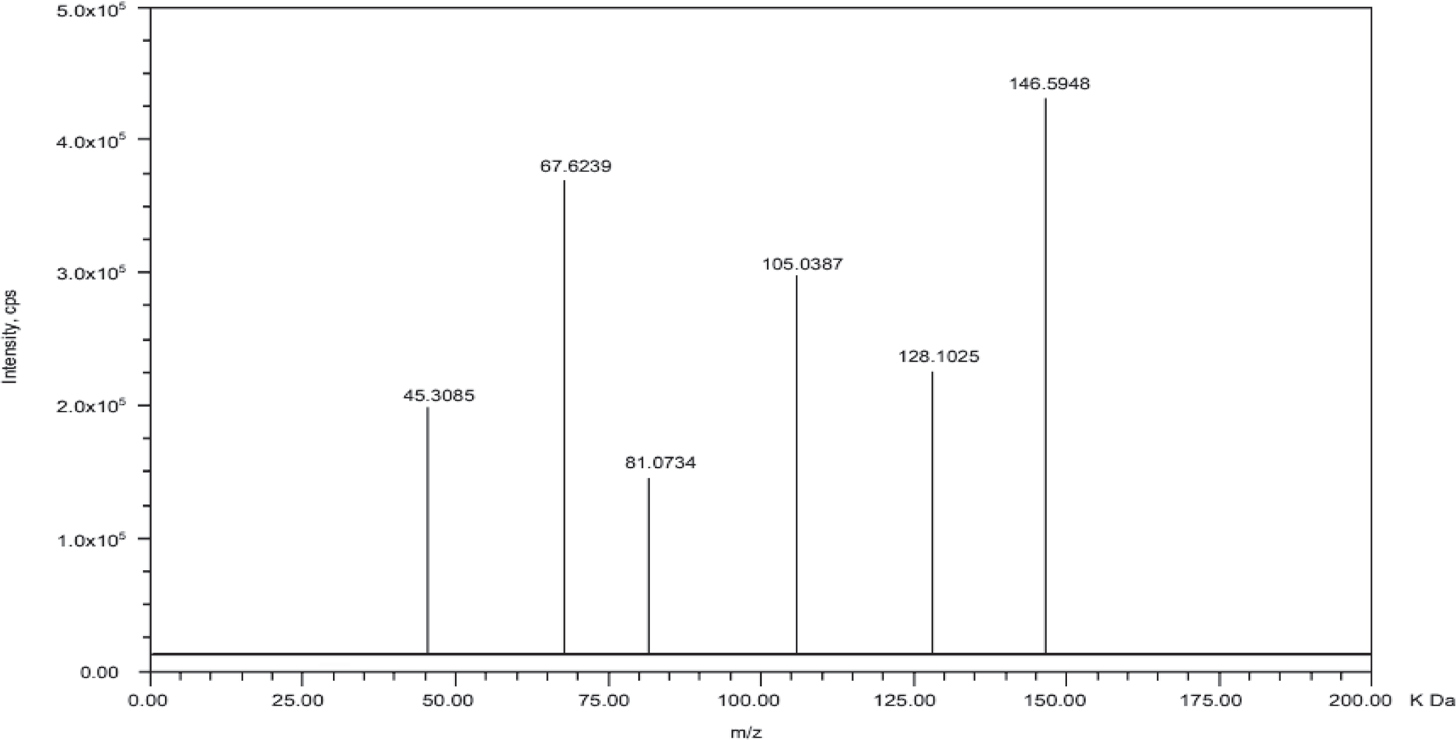
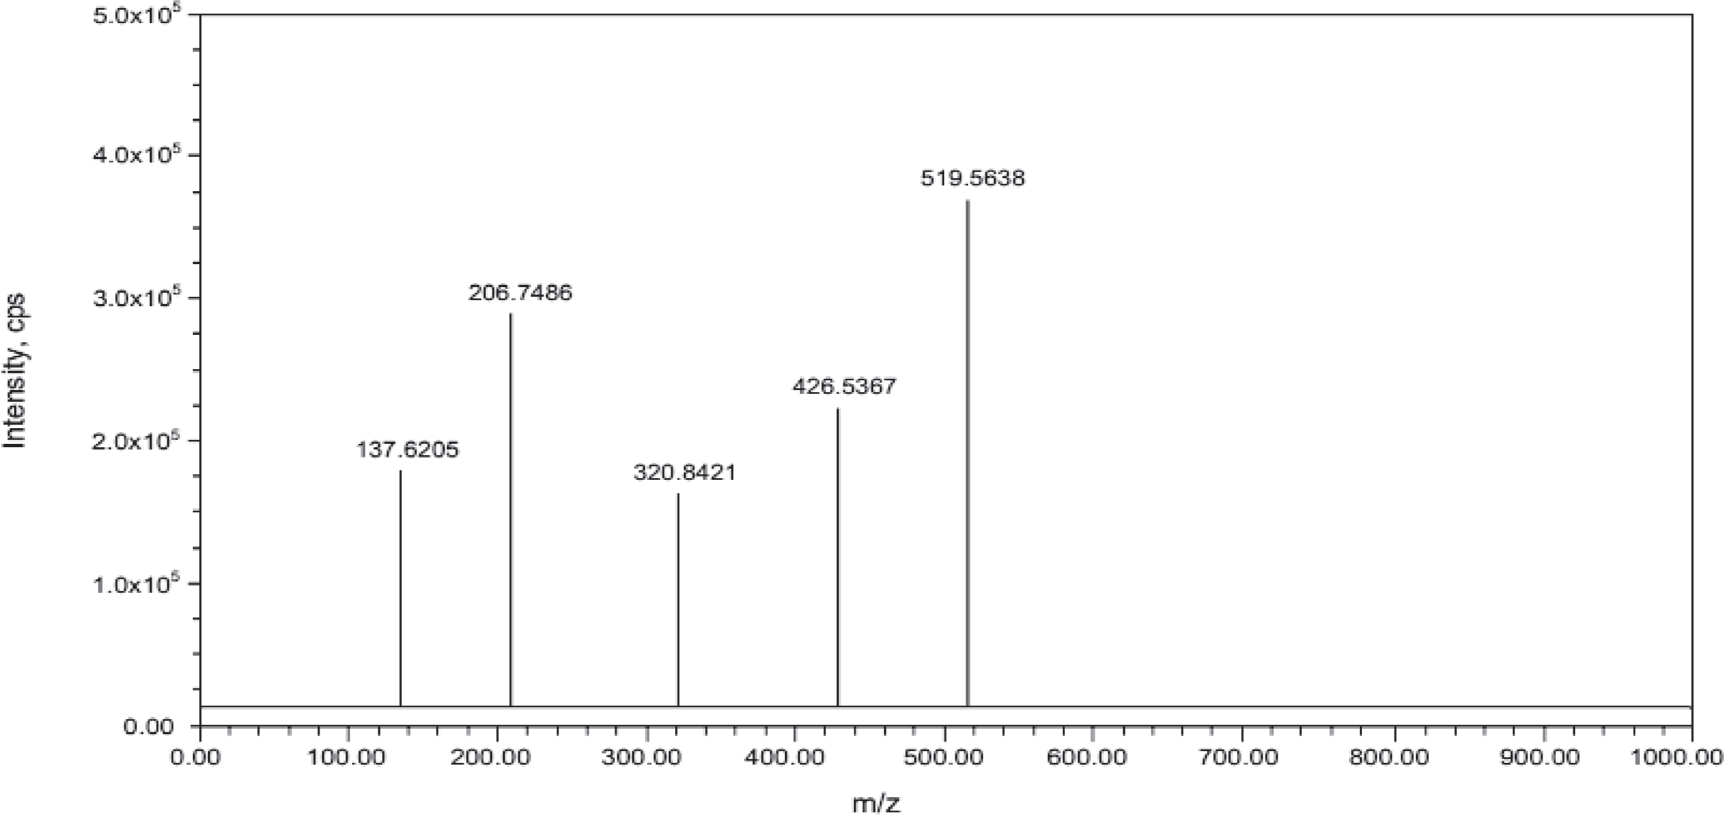
A novel LC-MS/MS method was developed and validated for the simultaneous quantification of venetoclax and obinutuzumab in rat plasma and successfully applied to pharmacokinetic investigations in male wistar rats. Chromatography was performed on a Symmetry C18 column (150 x 4.6 mm, 3.5 µm) column utilizing multiple-reaction monitoring (MRM) mode to evaluate venetoclax, obinutuzumab, and the internal standard gossypol, following which they were extracted using liquid-liquid extraction. The assay demonstrated high sensitivity, excellent reproducibility, and full compliance with FDA bioanalytical validation criteria, with venetoclax exhibiting a linear range of 25-200 ng/mL and obinutuzumab 6.25-50 ng/mL, respectively. The high-abundant mass transitions were seen starting from 869.4425 and 603.8597 m/z for venetoclax and 146.5948 and 67.6239 m/z for obinutuzumab and Gossypol (IS) 519.5638 and 206.7486 m/z, respectively. Upon application, the study successfully characterized the pharmacokinetic profiles of venetoclax and obinutuzumab in Wistar rats, revealing differences in absorption and systemic exposure between the two compounds. Venetoclax demonstrated a higher Cmax and AUC with a delayed Tmax compared to obinutuzumab, although both shared a similar elimination half-life of 20 hours. The results indicate consistent and stable pharmacokinetic behaviour under the tested conditions, supporting future therapeutic drug monitoring and preclinical drug development.
Keywords:
Venetoclax; Obinutuzumab; Gossypol; Rat plasma; Pharmacokinetics.
INTRODUCTION
Venetoclax (Figure. 1), sold under the brand names Venclexta and Venclyxto, is indicated for the treatment of chronic lymphocytic leukaemia (CLL) (Reddy et al., 2022; Hallek, 2017). It is also prescribed for adults with small lymphocytic lymphoma or CLL, regardless of mutation status. Additionally, venetoclax is used in combination therapy for the treatment of acute myeloid leukaemia (AML) (Tresckow et al., 2019; Döhner, Weisdorf, Bloomfield, 2015; Bolouri et al., 2017). In this context, it is often administered alongside azacitidine, decitabine, or low-dose cytarabine in patients over 75 years of age who are not candidates for intensive chemotherapy (Kayser, Levis, 2014; Johnstone, Ruefli, Lowe, 2002). Venetoclax is associated with several common side effects, including neutropenia (low white blood cell count) (Hsieh et al., 2007; Newburger, Dale, 2013), nausea (Scorza et al., 2007; Singh, Yoon, Kuo, 2016), anaemia (Janz, Johnson, Rubenstein, 2013; Peek, 2014), diarrhoea (Stein et al., 2016), upper respiratory tract infections (Smalley et al., 2019), and thrombocytopenia (low platelet count) (Smith et al., 2016). Two major adverse effects of this treatment are tumour lysis syndrome (Guida et al., 2003) and severe neutropenia (Howard, Jones, Pui, 2011). Moreover, it is important to note that venetoclax (European Pharmacopoeia) may have a detrimental impact on male fertility.

Obinutuzumab is a humanized anti-CD20 monoclonal antibody developed by Roche, originally created by GlycArt Biotechnology AG. Obinutuzumab is approved for use in combination with chemotherapy or venetoclax as a first-line treatment for chronic lymphocytic leukaemia. Furthermore, when administered with chemotherapy, it is also approved for the treatment of follicular lymphoma. Notably, obinutuzumab can be used in combination with bendamustine chemotherapy for the treatment of relapsed or refractory follicular lymphoma.
Based on a comprehensive review of the literature, only a limited number of methodologies have been reported for the individual or combined determination of the cited drugs in biological fluids (Alnasser et al., 2023; Andersen et al., 2016; Murthy Boddapati, Kola, Suggisetti, 2020; Yasu et al., 2023; Fukuda et al., 2023; Yang et al., 2023; Trabik et al., 2020). To address this gap, for the first time, LC-MS/MS method was developed and validated and applied to pharmacokinetic drug interaction studies i.e., for the simultaneous determination of venetoclax and obinutuzumab by LC-MS/MS in rat plasma.
MATERIAL AND METHODS
Reagents and chemicals
Samples of Venetoclax, Obinutuzumab, and Gossypol were purchased from Zydus Cadila, Health Care Ltd., Ahmedabad, INDIA. All of the chemicals we used were provided by Merck Chemical Division in Mumbai, including LCMS-grade methanol, acetonitrile and formic acid. We used HPLC-grade water from a Milli-Q water purification system for our investigation.
Preparation of stock solution, calibration standards and quality control samples
Standard stock solutions containing 1 mg/mL of Venetoclax, Obinutuzumab, and Gossypol (IS) were made in methanol. Before being used, these solutions were kept between 2 and 8°C. To get a final concentration of 250 ng/mL, the IS stock solution was diluted using methanol as the diluent. Intermediate standards were prepared in methanol: water (70:30 v/v) with serial dilutions to be used for quality control (QC) standards at different concentration levels of Venetoclax (25, 50, 75, 100, 125, 150, 200 ng/mL) and Obinutuzumab (6.25, 12.50, 18.75, 25.0, 31.25, 37.5, 50 ng/mL) as LLOQ QC, low QC (LQC), middle QC (MQC) and high QC (HQC), respectively. During analysis, these QC standards were spaced after every six to seven unknown samples.
Preparation of Sample solution
Sample preparation involved a protein precipitation extraction method using acetonitrile containing 250 ng/mL of IS as an extraction solvent. The processing volume of plasma was fixed as 200 µl. Before the 150 milliliters of extraction solvent were added, the samples were vortexed (Genius 3, IKA Vortex India). The supernatant was injected into the LC-MS/MS system after being mixed completely with the vortex mixer for three minutes and centrifuged (Eppendorf centrifuge 5810 R, Germany) for fifteen minutes at 4000 rpm.
Instrumentation and LC-MS/MS conditions
The HPLC system utilized in this investigation comprised a Shimadzu LC 20AD pump (Kyoto, Japan) equipped with a vacuum degasser (DGU 20A5), a high speed autosampler (Model SIL-20AC HTc), a flow control valve, and a temperature controller chamber for the column (CTO-10Avp). The separation was done in gradient mode using a reversed phase C18 column (150 x 4.6 mm i.d., 3.5 μm) (YMC-Pack ODS-AM) at a flow rate of 1.0 ml/min for a duration of 5 minutes. Chromatograms were obtained using the LC Quan software.
Using a heated ESI probe as the ionization source and a triple quadrupole analyzer in positive ionization mode, a Thermo Scientific Quantum Ultra system was employed for MS detection. Impact energy, capillary voltage, and cone voltage were among the MS parameters that were specifically adjusted for every analyte. 150°C was the temperature used. Nitrogen, flowing at 800 L/h, was the desolvation gas used. It was decided to set the cone gas flow rate at 150 L/h and the collision gas flow rate at 0.15 ml min-1. For the nebulizing, sheath, and ion sweep operations of the mass spectrometer, a gas generator supplied a steady supply of nitrogen gas (Peak Scientific, USA). A constant supply of argon gas was supplied by an argon gas cylinder and used as a collision activated dissociation (CAD) gas. For pure standards of Venetoclax, Obinutuzumab, and IS, continuous infusion at 5 ml min-1 was utilized to optimize the MS and MS/MS conditions using a syringe pump (Model 11, Harvard equipment, Inc., Holliston, MA, USA).
Method Validation
Selectivity
This is the capacity of a method to separate and measure the drug in the presence of different endogenous substances in the sample. Usually get at least six individual biological matrix lots (plasma, serum, blood or urine). In order to check the intended retention time, the aqueous mixture of the compound and IS is prepared and injected. The chosen blank matrices were extracted and injected together with the LLOQ samples. The interference at the analyte and internal standard retention times was then ascertained by comparing the mean LLOQ response with the blank response.
Sensitivity
Sensitiveness of the method is determined with regards to the “LLOQ - Lower Limit of Quantification”. The intensity of a lower calibration standard ought to be a minimum of 5 times higher than the response seen in the blank matrix used in the same analytical batch. Likewise, the signal-to-noise (S/N) ratio must be ≥ 5:1. This same stock solution must be used to prepare a set of calibration curve standards and the six replicates of LLOQ samples. Extract them and inject them onto LC-MS, then determine the %CV as precision and %nominal as accuracy.
Linearity
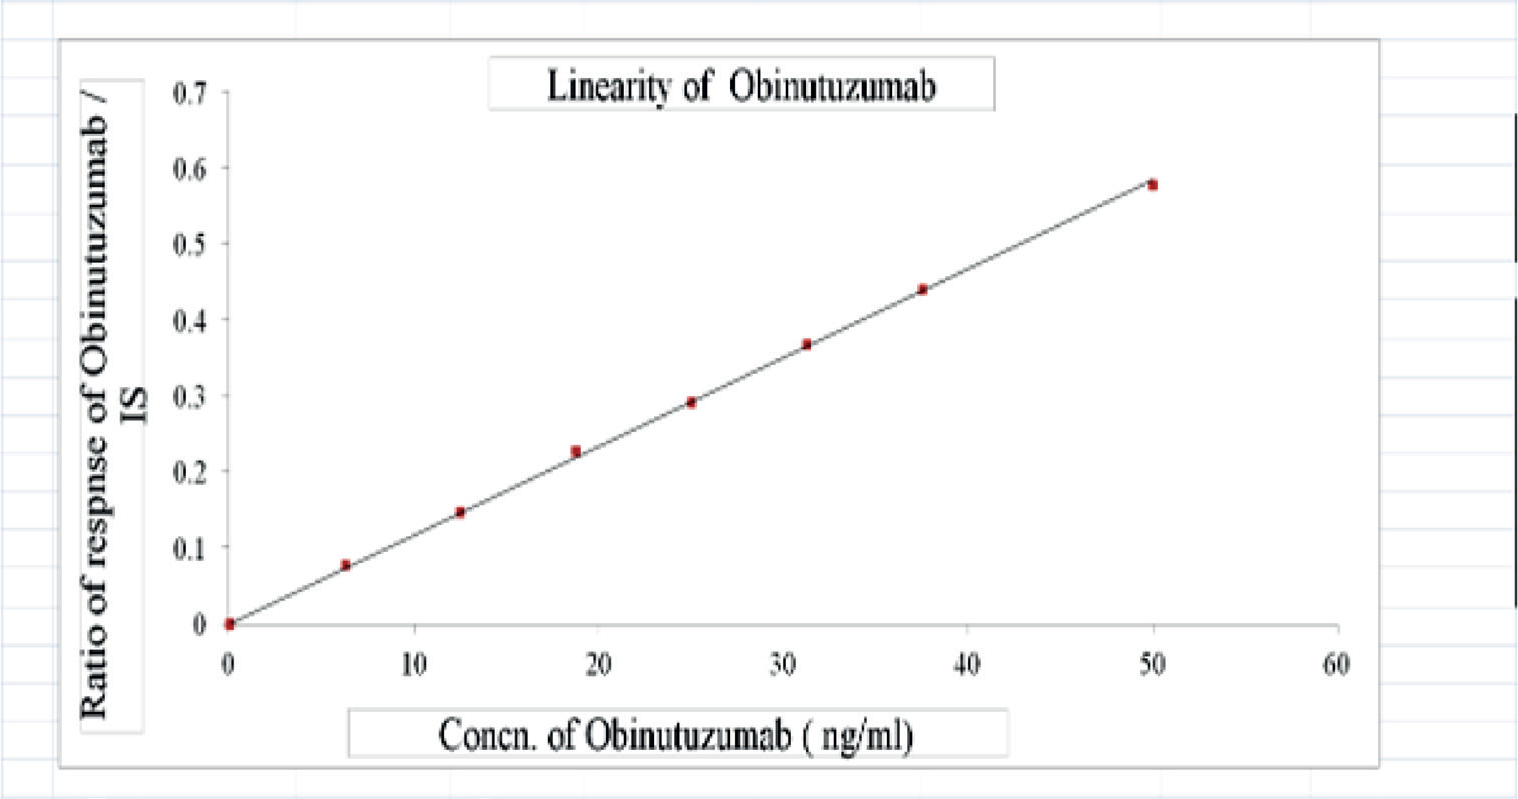
A calibration curve, or standard curve, is the relationship between the experimental response and the known concentration of the drug of choice. This should be prepared and analyzed for each intended compound of the sample and moreover, the calibration curve is supposed to be prepared in the same biological matrix as the study samples. The linearity of the method was determined by using a 1/x2 weighted least square regression analysis of standard plots associated with an eight-point standard curve at a 25-200 ng/mL range for venetoclax and a 6.25 - 50 ng/mL range for obinutuzumab, respectively.
Precision and Accuracy
The repeatability of a scientific technique is nothing but the tight connection in the values of the independent determinations of the measured analyte if the analysis is performed repeatedly for a multiple sampling of a single uniform mixture of the sample. The accurate determinations of the methodology state the resemblance of mean test outcomes acquired by the technique to the actual concentration of the compound. Both within batch and between batch - accuracy and precision measurements are dictated by close examination of tests containing known measures of the analyte. Exactness and precision ought to be estimated utilizing at least five findings for each fixation.
Matrix Effect
To avoid any compromise on the precision, selectivity, and sensitivity, we need to investigate the matrix effect. Low QC and high QC samples need to be extracted as three samples with different lots of drug-free biological matrices and analyzed the specified QC samples against standard line results.
Recovery
This is nothing but the capacity of the extraction method, which could get from the study sample and detect using the instrument when compared to a neat sample, which otherwise will not undergo the extraction process. In theory, the recovery of an analyte is supposed to be 100%, however in practical terms it is an impossible task as there would be wastage and degradation in the process of extraction. Furthermore, the resultant recovery for the ISTD and the intended drug must be identical, accurate, and repeatable. This particular test is executed by making the comparison of the results of the extracted samples to the unextracted samples at three QC concentration levels (low, medium, and high). The unextracted aqueous/ organic sample represents the 100% recovery.
Dilution integrity
The accuracy and precision of samples should not be affected by dilution. If necessary, it is important to demonstrate the integrity of dilution by adding a higher concentration of the analyte to the matrix, above the ULOQ. This sample should then be diluted with blank matrix, and at least five determinations should be made for each dilution factor.
Stability Studies
Sample stability after the sample collection, storage, transport, and during the extraction procedure must be tested. Therefore, in order to find the intactness of the test compounds in the biological matrix, the method validation is designed with various testing procedures as follows:
Benchtop stability
This stability is assessed to cover the sample being left on the laboratory benches for a long time (on a few occasions, up to 24 hours). Low-QC and high-QC sets of the samples are usually prepared and kept in the freezer during bulk spiking. In the case of the benchtop (short-term) stability, 6 replicates of those two QC sets will be removed from the appropriate storage and left on the bench to at least cover the extraction duration (may be 6 hours), in some instances up to 24 hours, and then extracted with the freshly spiked calibration standards and analyzed in the LC-MS/MS instrument.
Autosampler stability
This is also called injector stability. This stability is conducted at a set temperature for both analyte and IS. The duration of the experimental time is based on the expected run time of the analytical batch. Extract six replicas of lower and higher quality control samples and analyze with freshly prepared and extracted calibration standards. Before doing the analysis, the processed QC samples are kept in the autosampler at the intended temperature. The autosampler stability period is calculated by noting the first injection time of the first quality control sample, less the time of their placement in the autosampler.
Wet extract stability
This stability is assessed to cover any duration where after extracting the samples, the batch is left at room temperature or in the freezer to analyze later (may be due to instrument issues or availability issues because of the busy schedule). Adequate QC samples are extracted and stored at the appropriate condition as per the bioanalytical method and analyzed in the instrument later after the intended period together with fresh, fortified, and extracted calibration points. Usually, the wet-extract stability period is calculated by taking the time of sample load to the instrument and taking off the sample extraction completion time.
Freeze and thaw stability
This is executed to see the stability nature for the intended drug during several conditions, like transit and samples taken in the lab, stored at room temperature, and stored back in the freezer for various analytical reasons. After preparing the low and high QC samples, they were stored in the intended storage condition (-20°C, -40°C, -70°C) for at least 24 hours. Furthermore, based on the need for at least 3 cycles of thaw and freeze performed (samples would be taken out of the freezer kept at room temperature to thaw the samples and stored back in freezer - the cycle repeated for a different set of samples to have three freeze-thaw (FT) cycle sets (FT-1, FT-2, FT-3). Then they will be analyzed together with a freshly prepared standard line.
Long term stability
This stability experiment is conducted to prove the reliability of study sample concentration after appropriate storage for a particular period. Therefore, the quality control samples (lower and higher) must be extracted and stored in the freezer (commonly -70°C or as per the method) for the duration to cover the period of intended clinical/preclinical sample storage period since the exact sample collecting time and up to the actual study sample extraction and run. This could vary from a few weeks up to a year in some cases. After the storage period of the intended duration, those stored QC samples are extracted together with freshly spiked calibration standards. Then the extracted batch is analyzed using an appropriate analytical instrument.
Application of bioanalytical method to pharmaco kinetics drug-interaction study
The pharmacokinetic investigations were conducted on a set of six adult male Wistar rats, each weighing 180-220 g. Before the analysis began, the animals were kept for seven days in cages with adequate food and water and good ventilation. The rats fasted for the whole night before receiving their dose. Six rats were used in a pharmacokinetic investigation of obinutuzumab with venetoclax. The Institute of Animal Ethics Committee has authorized the animal study protocol (Registration Number: 1250/PO/RcBi/s/18/CPCSEA).
Venetoclax and obinutuzumab were administered to rats in this trial as a single dose. The rats were sampled at different intervals, namely 1, 2, 5, 10, 20, and 30 hours following the administration of the dose. Using K2EDTA vacutainer tubes, a 1 ml sample of blood was taken at each interval. Additionally, a predose sample was collected to assess potential plasma interferences. The samples were centrifuged to separate the plasma, which was subsequently stored at -70°C. After the plasma samples were mixed with quality control (QC) samples at four different concentrations, the internal standard (IS) was added. The pharmacokinetic parameters for venetoclax and obinutuzumab were calculated using the WinNonlin software program (Version 5.2). The study samples were examined for stability using Incurred Sample Reanalysis (ISR). For ISR, two samples were chosen from each participant. These samples were obtained throughout the pharmacokinetic profile’s elimination phase and close to the maximum concentration (Cmax). After assessing the samples’ stability, it was determined that the percentage difference shouldn’t be more than 20%.
RESULTS AND DISCUSSIONS
Method Development
Optimization of mass spectrometric parameters
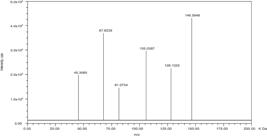
Mass spectrometry scanning parameters were trailed, and the compounds were scanned in both ionization modes (“+” ve and “-” ve). The more reproducible area was achieved in positive-polarity ionization mode for the drug and internal standard. A better selectivity was observed with the MRM mode. As the nature of the +ve ionization mode, the protonated form of each drug (M+1) and the internal standard were considered as the parent ion in the first quadrupole (Q1 spectrum). The same was considered as the precursor ion for the daughter ions (Q3 product ion) spectra. In order to achieve the highest intensity of protonated molecular ions, various optimizations of the MS/MS conditions of source temperature and desolvation gas flow rate were examined. It was found that the optimal ESI source temperature was 150°C, and the optimal desolvation gas flow rate was 800 L/h. Similarly, because an increase or decrease from an ideal value tends to result in a drop in intensity, the collision energy and cone voltage have a crucial impact on the reactions of the daughter fragment ions. Figures 2 through 4 display the collision energy and cone voltage values that resulted in the highest intensities of the selected daughter ions of venetoclax, obinutuzumab, and IS. As illustrated in Figures 2 to 4, the high-abundant mass transitions were observed starting at 869.4425 and 603.8597 m/z for venetoclax and 146.5948 and 67.6239 m/z for obinutuzumab and Gossypol (IS) 519.5638 and 206.7486 m/z, respectively.


Optimization of LC-MS/MS chromatographic conditions
The analysis and successful quantification of any analyte depend on three major parameters which are the proper MS parameters optimisation, chromatography setup and exact sample extraction process with interference free detection. During the method development process of venetoclax and obinutuzumab, chromatographic separation was trialled with various combinations of organic solvents like acetonitrile with buffers of varying concentration on different types of analytical columns (C8 and C18) of different makes. 1 mL of triethylamine was dissolved in 1 ltr of water, and the pH was adjusted to 2.5 with formic acid, which was useful in achieving an optimum reproducible response. Therefore, the mobile phase, consisting of acetonitrile and 1 mL of triethylamine dissolved in 1 L of water, was adjusted to pH 2.5 using formic acid. This buffer (40:60, v/v) was found to be well-suited for the analysis. Symmetry C18 column (150 x 4.6 mm, 3.5 µm) showed a sharp peak with a high response. The total chromatographic runtime is 5.0 min with the retention time for venetoclax at 2.213 and obinutuzumab at 4.008 min, respectively. Finally, Gossypol was found to be the best to use as an internal standard after testing with a number of available chemical compounds.
Method validation
Selectivity
Selectivity was determined by analyzing six separate lots of drug-free plasma. The selected rat blank plasma lot was spiked with the analyte and internal standard at the LLOQ level. These samples were subjected to an extraction procedure and run under a calibration standard curve to determine the extent of endogenous interference in the optimized chromatographic method for the drug and internal standard.
Typical chromatograms of extracted blank rat plasma (Figure 5) and a blank processed sample spiked with the internal standard (Figure 6). As per Figure 5, no considerable noise/interference in the blank was seen caused by any endogenous matrix contents in the blank human whole blood at the retention time of the drug and internal standard. In the same way, Figure 6 depicts the absence of any noise/interference due to the internal standard in the retention time window of the drug. Figure 7 shows a chromatogram for the LLOQ-QC sample (10 ng/mL).


Linearity
The eight-point calibration curve for venetoclax (0, 25, 50, 75, 100, 125, 150, 200 ng/mL) and obinutuzumab (0, 6.25, 12.50, 18.75, 25.0, 31.25, 37.5, 50 ng/mL) was made based on the area ratio of the chromatogram of the analyte vs. the internal standards in the rat plasma against the nominal value (Figures 8 and 9). After investigating with various regression models, the linear regression analysis using the 1/x2 (x: concentration) weighting factor was found to have the best fit. The calibration curve has a correlation coefficient (r2) of 0.99 or better. A summary of calibration curve parameter data is given below Table I.


Precision and accuracy
To evaluate the accuracy and precision of the intra-assay, six duplicates containing venetoclax and obinutuzumab were analyzed at three different quality control (QC) levels. The inter-assay precision was also ascertained by analyzing the three levels of QC samples on separate runs (n=6). The intra-batch precision (% CV for LQC, MQC, and HQC was 0.25 to 2.94%, while the percent mean accuracy of the proposed method ranged from 95.10% to 98.81% for venetoclax. The intra-batch precision (% CV for LQC, MQC, and HQC was 0.66 to 7.62%, whereas the percent mean accuracy of the proposed method ranged from 91.97% to 98.88% for obinutuzumab. The data are compiled in Tables II and III.
Recovery
The extraction recoveries of venetoclax, obinutuzumab, and IS were determined by calculating their values at the three-quality control (QC) levels (LQC, MQC and HQC) with each level having six duplicates (n=6). The recovery of analytes from samples is a measure of the effectiveness of their separation as represented in Tables IV & V. The % mean recovery at LQC, MQC and HQC levels were found to be 95.39, 97.26, and 97.78% for venetoclax, 94.86, 96.35, and 98.00% for obinutuzumab and 92.83, 92.53 and 90.54% for IS, respectively. Thus, extraction recovery was >95, 94 and 90% for venetoclax, obinutuzumab, and IS, respectively.
Matrix Effect
There wasn’t any significant matrix effect shown in all six lots of whole rat plasma for the drug at lower and higher QC level concentrations. The matrix effect of venetoclax at low QC concentration was found to be 96.12% and 0.73%; at high QC level, the results were 97.90% and 0.22%. The accuracy and precision for Obinutuzumab at low QC concentration were found to be 96.93% and 4.0%, and at the high QC level, the results were 97.71% and 0.28%. Results showed that no considerable matrix effect was seen in all six lots of rat plasma for both the drug and internal standard.
Dilution integrity (DI)
50 µL of rat plasma with 320 ng/mL of venetoclax and 80 ng/mL of obinutuzumab was used to assess dilution integrity at a concentration that was around 1.6 times that of ULOQ. The extracts were diluted two times and four times using drug-free plasma that contained an internal standard that was also extracted in the same batch. The results, which are shown in Table VI, were within the acceptability limit.
Stability
The stability of venetoclax and obinutuzumab in plasma was assessed using six quality control (QC) sample replicates at low and high concentrations. Venetoclax and obinutuzumab standard solutions were added in appropriate amounts to drug-free plasma samples. The results shown in Tables VII and VIII indicate that venetoclax and obinutuzumab have excellent stability since they were found to be within an acceptable range.
Carry-over Effect
Three blank samples were injected one after the other to evaluate the internal standard’s response and three blank samples in succession after the injection of a ULOQ sample to observe the analytes response in order to determine the extent of the carry over impact. The conclusion was that the experiment’s carry-over effect would be minimal because neither the analytes nor IS’s elution peaks appeared in the blank plasma sample chromatogram with peak areas more than 5% for IS and more than 20% for LLOQ.
Pharmacological Properties and Mechanisms of Action with potential interactions of Venetoclax and Obinutuzumab
Venetoclax and obinutuzumab, while both used in the treatment of haematologic malignancies, exhibit distinct pharmacological properties and mechanisms of action. Venetoclax acts intracellularly as a BCL-2 inhibitor, triggering apoptosis in BCL-2-dependent cells like CLL by displacing pro-apoptotic proteins (Salem, Rajeev, 2024). Its metabolism is primarily hepatic via CYP3A4, leading to potential drug interactions (Bose, Varsha, Marina, 2017). Conversely, obinutuzumab is an extracellularly acting anti-CD20 monoclonal antibody that induces B-cell death through ADCC, CDC, and direct apoptosis (Hallek et al., 2013) and is cleared proteolytically, independent of the CYP450 system (Gibiansky et al., 2019). Consequently, no direct metabolic interaction is expected between these two drugs (Flinn et al., 2017; Salem, Rajeev, 2024). Notably, clinical trials incorporated safety protocols like gradual venetoclax titration and prophylactic strategies to effectively prevent tumor lysis syndrome (Fischer et al., 2019).
Pharmacokinetic Study
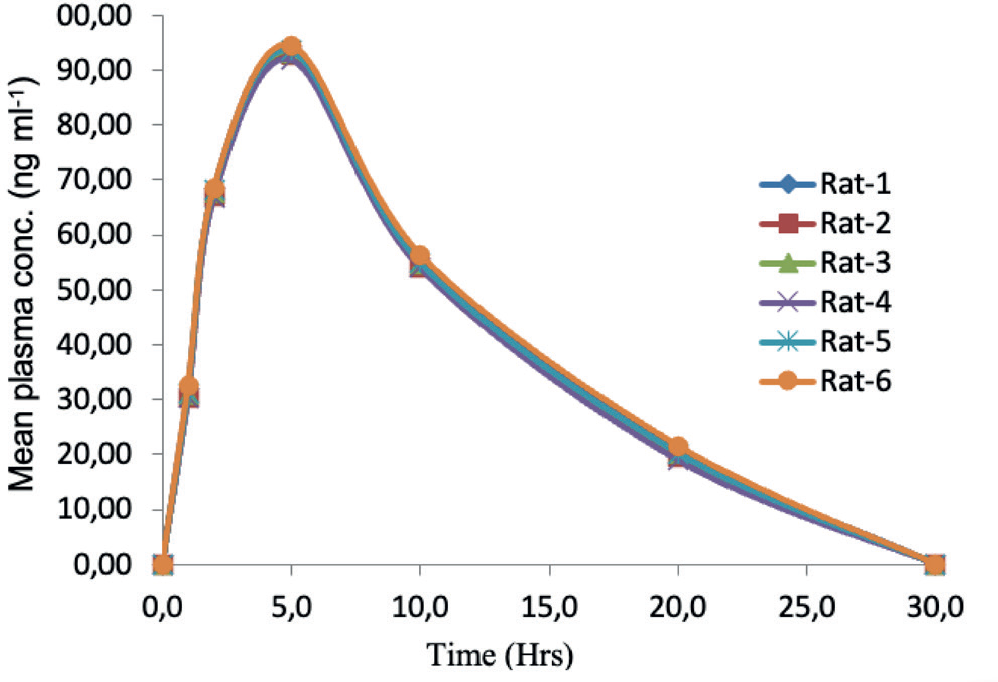
The pharmacokinetics of Venetoclax and obinutuzumab were successfully investigated in adult male Wistar rats (n = 6) using a validated method. Plasma analyte concentrations were measured at predose and at 1, 2, 5, 10, 20, and 30 hours following simultaneous injection. Pharmacokinetic parameters for Venetoclax and obinutuzumab were determined using WinNonlin software (Version 5.2). Incurred sample reanalysis (ISR) was employed to assess the stability of the research samples. The calculated pharmacokinetic parameters, including AUC0-t, AUC0-∞, t1/2, Cmax, Tmax, clearance (CL(inf)/F), and MRTlast, were derived using the linear trapezoidal method and are summarized in Table IX. Figures 10 and 11 illustrate the mean plasma concentration-time profiles for venetoclax and obinutuzumab, respectively.


Table IX clearly shows that this study successfully characterized the pharmacokinetic profiles of venetoclax and obinutuzumab in Wistar rats. The results reveal distinct absorption and systemic exposure patterns: venetoclax exhibited a higher Cmax and AUC but a delayed Tmax compared to obinutuzumab, despite both exhibiting an elimination half-life of around 20 hours. This consistent and stable pharmacokinetic behavior under the tested conditions supports future therapeutic drug monitoring and preclinical drug development.
CONCLUSION
For the first time, a rapid, efficient, and cost-effective liquid-liquid extraction LC-MS/MS method was developed for the simultaneous determination of venetoclax and obinutuzumab, offering advantages over previously reported venetoclax assays. Utilizing gossypol as an internal standard, the method achieved baseline separation of venetoclax (retention time: 2.236 minutes), venetoclax (retention time: 4.014 minutes), and gossypol (retention time: 3.129 minutes) within a 5-minute chromatographic run. The method demonstrated excellent linearity over the dynamic ranges of 25-200 ng/mL for venetoclax and 6.25-50 ng/mL for obinutuzumab, with a correlation coefficient (r2) of 0.999, meeting USFDA guidelines. Validation parameters, including precision (%CV < 15% at LQC, MQC, and HQC levels for both intraand inter-batch assays) and stability, were within acceptable limits. This validated method was successfully applied to a pharmacokinetic study in male Wistar rats, effectively quantifying venetoclax and obinutuzumab in plasma. The calculated pharmacokinetic parameters, including AUC0-t, AUC0-∞, t1/2, Cmax, Tmax, CL(inf)/F, and MRTlast, successfully characterized the pharmacokinetic profiles of venetoclax and obinutuzumab. The results revealed distinct absorption and systemic exposure patterns: venetoclax exhibited a higher Cmax and AUC but a delayed Tmax compared to obinutuzumab, despite both demonstrating an elimination half-life of approximately 20 hours. These findings suggest that co-administration of venetoclax and obinutuzumab is unlikely to result in significant pharmacokinetic drug interactions. This consistent and stable pharmacokinetic behavior under the tested conditions supports future therapeutic drug monitoring and preclinical drug development.
ACKNOWLEDGEMENTS
The authors PMK, HND and all authors of the manuscript, extend their appreciation to BET®, RIE (NCERT), Bhubaneswar, University of Mysore and JSS College for Women, Saraswathipuram, Mysuru for providing necessary facilities to carry out the Research work.
DATA AVAILABILITY STATEMENT
The data supporting the conclusions of this study are available from the corresponding author upon reasonable request, subject to ethical considerations and data sharing agreements.
REFERENCES
- Alnasser AI, Hefnawy MM, Al-Hossaini AM, Bin Jardan YA, El-Azab AS, Abdel-Aziz AM, Al-Obaid AM, Al-Suwaidan IA, Attwa MW, El-Gendy MA. LC-MS/MS method for the quantitation of decitabine and venetoclax in rat plasma after SPE: Application to pharmacokinetic study. Saudi Pharm J. 2023;31(9):101693.
- Andersen CL, Tesfa D, Siersma VD, Sandholdt H, Hasselbalch H, Bjerrum OW, et al. Prevalence and clinical significance of neutropenia discovered in routine complete blood cell counts: a longitudinal study. J Int Med. 2016;279(6):566-575.
- Bolouri H, Farrar JE, Triche Jr T, Ries RE, Lim EL, Alonzo TA, et al. The molecular landscape of pediatric acute myeloid leukemia reveals recurrent structural alterations and age-specific mutational interactions. Nature Med. 2017;24(1):103-112.
- Bose P, Varsha VG, Marina YK. Pathways and mechanisms of venetoclax resistance. Leuk Lymphoma. 2017;58(9):1-17.
- Dohner H, Weisdorf DJ, Bloomfield CD. Acute Myeloid Leukemia, N Engl J Med. 2015;373(12):1136-1152.
- European Pharmacopoeia. EuropPharm.10th Edition 2020.
- Fischer K, Al-Sawaf O, Bahlo J, Fink AM, Tandon M, Dixon M, et al. Venetoclax and Obinutuzumab in Patients with CLL and Coexisting Conditions. N Engl J Med. 2019;380(23):2225-2236.
- Flinn IW, Gribben JG, Dyer MJS, Wierda WG, Maris MB, Furman RR, et al. Safety, efficacy and MRD negativity of a combination of venetoclax and obinutuzumab in patients with previously untreated chronic lymphocytic leukemia - results from a phase 1b study (GP28331). Blood 2017;130(Suppl_1):430.
- Fukuda N, Kobayashi T, Sato H, Akamine Y, Takahashi N, Miur M. Quantitation of Venetoclax in Human Plasma by High-Performance Liquid Chromatography with Ultraviolet Detection. J Chromatogr Sci. 2023;62(1):58 - 64.
- Gibiansky E, Gibiansky L, Buchheit V, Frey N, Brewster M, Fingerle-Rowson G, Jamois C. Pharmacokinetics, exposure, efficacy and safety of obinutuzumab in rituximab-refractory follicular lymphoma patients in the GADOLIN phase III study. Br J Clin Pharmacol. 2019 Sep;85(9):1935-1945.
- Guida JD, Kunig AM, Leef KH, McKenzie SE, Paul DA. Platelet count and sepsis in very low birth weight neonates: is there an organism-specific response. Pediatrics. 2003;111(6):1411-1415.
- Hallek M, Fischer K, Humphrey K,Asikanius E, Busch R, Engelke A. Obinutuzumab (GA101) plus chlorambucil (Clb) or rituximab (R) plus Clb versus Clb alone in patients with chronic lymphocytic leukemia (CLL) and preexisting medical conditions (comorbidities): final stage 1 results of the CLL11 (BO21004) phase III trial. Hematol Oncol. 2013;(31):7004.
- Hallek M. Chronic lymphocytic leukemia: 2017 update on diagnosis, risk stratification, and treatment. Am J Hematol. 2017;92(9): 946-965.
- Howard SC, Jones DP, Pui CH. The tumor lysis syndrome. N Engl J Med. 2011;364(19):1844-1854.
- Hsieh MM, Everhart JE, Byrd-Holt DD, Tisdale J, Rodgers, GP. Prevalence of neutropenia in the U.S. population: age, sex, smoking status, and ethnic differences. Ann Intern Med. 2007;146(7):486-492.
- Janz TG, Johnson RL, Rubenstein SD. Anemia in the emergency department: evaluation and treatment. Emerg Med Pract. 2013;15(11): 1-15.
- Johnstone RW, Ruefli AA, Lowe SW. Apoptosis: a link between cancer genetics and chemotherapy. Cell. 2002;108(2):153-164.
- Kayser S, Levis MJ. FLT3 tyrosine kinase inhibitors in acute myeloid leukemia: clinical implications and limitations. Leuk Lymphoma. 2014;55(2):243-255.
- Murthy Boddapati SN, Kola E, Suggisetti VM. Development and validation of RP-HPLC method for the simultaneous determination of venetoclax and obinutuzumab in bulk and pharmaceutical dosage form. J Adv Scient Res. 2020;11(2):76-80.
- Newburger PE, Dale DC. Evaluation and management of patients with isolated neutropenia. Semin Hematol. 2013;50(3):198-206.
- Peek SF. Chapter hemolytic disorders. In sprayberry KA, Robinson NE. Robinson’s current therapy in equine medicine. Elsevier health sciences. 2014; 7th Edition: 492-496.
- Reddy KTK, Gandla K, Vijaya Babu P, Vinay Kumar Chakravarthy M, Chandrasekhar P, Sagapola RA. Critical Review on Bioanalytical Method Development and Validation of Few Oncology Drugs by Using LC-MS-MS. J Pharm Neg Results. 2022a;13(1):16-27.
- Salem AH, Rajeev MM. Clinical pharmacokinetics and pharmacodynamics of venetoclax, a selective B-cell lymphoma-2 inhibitor. Clin Transl Sci. 2024;17(5):e13807
- Smalley W, Falck-ytter C, Carrasco-labra A, Wani S, Lytvyn L, Falck-ytter Y. AGA Clinical Practice Guidelines on the Laboratory Evaluation of Functional Diarrhea and Diarrhea-Predominant Irritable Bowel Syndrome in Adults (IBS-D). Gastroenterol. 2019;157(3):851-854.
- Scorza K, Williams A, Phillips JD, Shaw J. Evaluation of nausea and vomiting, Am Fam Physician. 2007;76(1):76-84.
- Singh P, Yoon SS, Kuo B. Nausea: a review of pathophysiology and therapeutics, Therap Adv Gastroenterol. 2016;9(1):98-112.
- Smith JD, Mac Dougall CC, Johnstone J, Copes RA, Schwartz B, Garber GE. Effectiveness of N95 respirators versus surgical masks in protecting health care workers from acute respiratory infection: a systematic review and meta-analysis. Canadian Med Assoc J. 2016;188(8):567-574.
- Stein J, Connor S, Virgin G, Ong DE, Pereyra L. Anemia and iron deficiency in gastrointestinal and liver conditions. World J Gastroenterol. 2016;22(35):7908-7925.
- Trabik YA, Moenes EM, Al-Ghobashy MA, Nebsen, M, Ayad MF. Analytical comparability study of anti-CD20 monoclonal antibodies rituximab and obinutuzumab using a stability-indicating orthogonal testing protocol: Effect of structural optimization and glycoengineering. J Chromatogr B. 2020;1159:122359.
- Tresckow JV, Eichhorst B, Bahlo J, Hallek M. The Treatment of Chronic Lymphatic Leukemia. Dtsch Arztebl Int. 2019;116(4):41-46.
- Yasu T, Gando Y, Nomura Y, Kosugi N, Kobayashi M. Determination of venetoclax concentration in plasma using High-performance liquid chromatography. J Chromatogr Sci. 2023;61(5):480-483.
- Yang YL, Qian ZY, Zhao Y, Chen XL, Huang Y, Guo JY, et al. LC-MS/MS methods for determination of venetoclax in human plasma and cerebrospinal fluid. Biomed Chromatogr. 2023;37(12):e-5738.
Edited by
-
Associate Editor:
Aníbal de Freitas Santos Júnior