 ClimaPlots: an open-source tool for meteorological series analysis and extreme indices
ABSTRACT
Climate data is essential for agriculture, supporting resilience, decision-making and food security under both current conditions and climate change scenarios. It is also essential for research, education, and applied sciences. However, its use is often limited by sparse monitoring networks, time series that are not continuous, platforms that handle immense volumes of data, and technical barriers that require programming and statistical expertise. These challenges are particularly pronounced in developing countries. To address these issues, we have developed ClimaPlots: an open-source QGIS plugin that simplifies the access to, and analysis of, temperature, precipitation, solar radiation, and relative humidity data from NASA’s POWER database. The tool enables users to extract data from any location, generate interactive visualisations, analyse trends and calculate climate extremes. While not a complete solution to all limitations in accessing data, ClimaPlots reduces technical and economic barriers, thus improving the usability of global climate data for agriculture, research, education, and planning in regions where data is scarce. ClimaPlots is freely available in the QGIS repository, promoting open and reproducible science by transforming large datasets into actionable knowledge.
Key words
climate index detection; democratization of data; agriculture; ecosystem management; risk assessment
INTRODUCTION
Interest in climate dates back to ancient times, with Aristotle’s Meteorologica (c. 340 BC) among the earliest studies of atmospheric phenomena (Neves et al. 2017). Nowadays, understanding climate remains vital for society, particularly in agriculture, in which historical, real-time, and predictive data support resilience, decision-making, and food security under current and future climate conditions. Large datasets and smart systems enhance crop forecasting and resource management, while analyses of climate trends and extremes provide essential insights for agricultural planning (Ademe et al. 2020, Pathak et al. 2018). Climate smart agriculture databases guide local adaptation (e.g., Nyakundi et al. 2020), and improved climate services strengthen resilience in developing countries. Equally important is communicating these data in ways aligned with agricultural practices and risk management (Wilke and Morton 2015), while democratized access empowers local and vulnerable communities to participate in monitoring, decision-making, and advocacy, ensuring their perspectives and needs are considered (Guldi 2021).
A central approach to understanding climate variability, trends, and extremes relies on statistical analysis of historical time series and standardized climate indices (Costa et al. 2020, Manica et al. 2022, Torres et al. 2022). However, such analyses depend on reliable observational data, which remain limited in many regions of the Global South due to sparse networks, heterogeneous record quality, restricted access, and infrastructural or technical constraints (Dinku 2019, Gebrechorkos et al. 2017, Lennard et al. 2018). In Brazil, these challenges are evident in insufficient station coverage, discontinuous historical series, and pronounced spatial-temporal variability, especially in semiarid and remote areas (Costa et al. 2021, Pugas et al. 2023). These limitations are shared by other regions with high climate vulnerability (Dinku et al. 2014), paradoxically where reliable data are most needed for adaptation and resilience planning.
To address these gaps, several institutions have developed climate datasets based on models, reanalyses, satellite observations, and interpolation techniques. Among these, NASA POWER stands out for filling observational gaps in remote regions (Sparks 2018, Rodrigues and Braga 2021), though accessing and processing these data still requires programming and statistical expertise, limiting broader use by students, practitioners, and policymakers.
In this context, we present ClimaPlots, an open-source plugin for QGIS that integrates NASA POWER meteorological data into an interactive, georeferenced environment. The tool enables users to visualise and analyse climate indices, as well as long-term climate trends in variables such as temperature, precipitation, relative humidity, and solar radiation. The extreme indices that have been implemented are those which were proposed by the Expert Team on Climate Change Detection and Indices (ETCCDI). The ClimaPlots system automates data processing, thereby reducing the need for programming skills and climatological statistical expertise. Consequently, it expands and democratises access to climate information. The utilisation of this instrument confers significant insights, which are pertinent to a wide range of applications in research, agriculture, public policy, and other domains of societal activity.
METHODS
Plugin structure
ClimaPlots was implemented as a plugin within QGIS (QGIS Development Team 2024), an open-source geographic information system widely used for handling and analysing spatial information. The software runs on multiple operating systems and benefits from continuous improvements made by an active international developer community (Bhatt et al. 2014). The plugin’s interface was designed with the Qt Design framework (The Qt Company 2024), allowing for an integrated and user-friendly layout. Climate data used by ClimaPlots come from the NASA POWER Python API, which provides global daily estimates (0.5° × 0.625°) from 1981 to the present, including variables such as minimum and maximum temperature, precipitation, solar radiation, and relative humidity.
Climate index
Climate indices are essential for describing climate variability and identifying extreme events. They allow researchers to recognize patterns at regional and local scales through objective, comparable measures (Nash et al. 2021). Among these, the indices proposed by the ETCCDI are particularly relevant, as they offer standardized methods to quantify changes in temperature and precipitation extremes (Chervenkov and Slavov 2021).
In this study, ClimaPlots integrates a selection of ETCCDI indices related to temperature and precipitation, as summarized in Table 1. To enhance accessibility for non-specialist users, Table 1 also summarizes the practical implications of each ETCCDI index, highlighting their relevance for agricultural planning, climate risk assessment, and decision-making processes.
Statistical analyses
ClimaPlots includes statistical tools to analyse both annual climate variables and ETCCDI indices, allowing users to assess long-term trends and possible shifts in the data. Two non-parametric tests are available: the Mann–Kendall’s test (Mann 1945, Kendall 1975), commonly used to identify monotonic trends in time series, implemented through the pyMannKendall package (Hussain and Mahmud 2019); and the Pettitt’s test (Pettitt 1979), which detects potential change points in the data, implemented using pyHomogeneity (Hussain et al. 2023). Both analyses were conducted with a 5% significance level to maintain consistency and facilitate comparison among results.
AVAILABILITY
Source code:
https://github.com/caioarantes/climaplots;
Documentation:
https://caioarantes.github.io/climaplots/
(Available online via GitHub Pages and in multiple languages)
License:
GNU General Public License v2 or later
RESULTS AND DISCUSSION
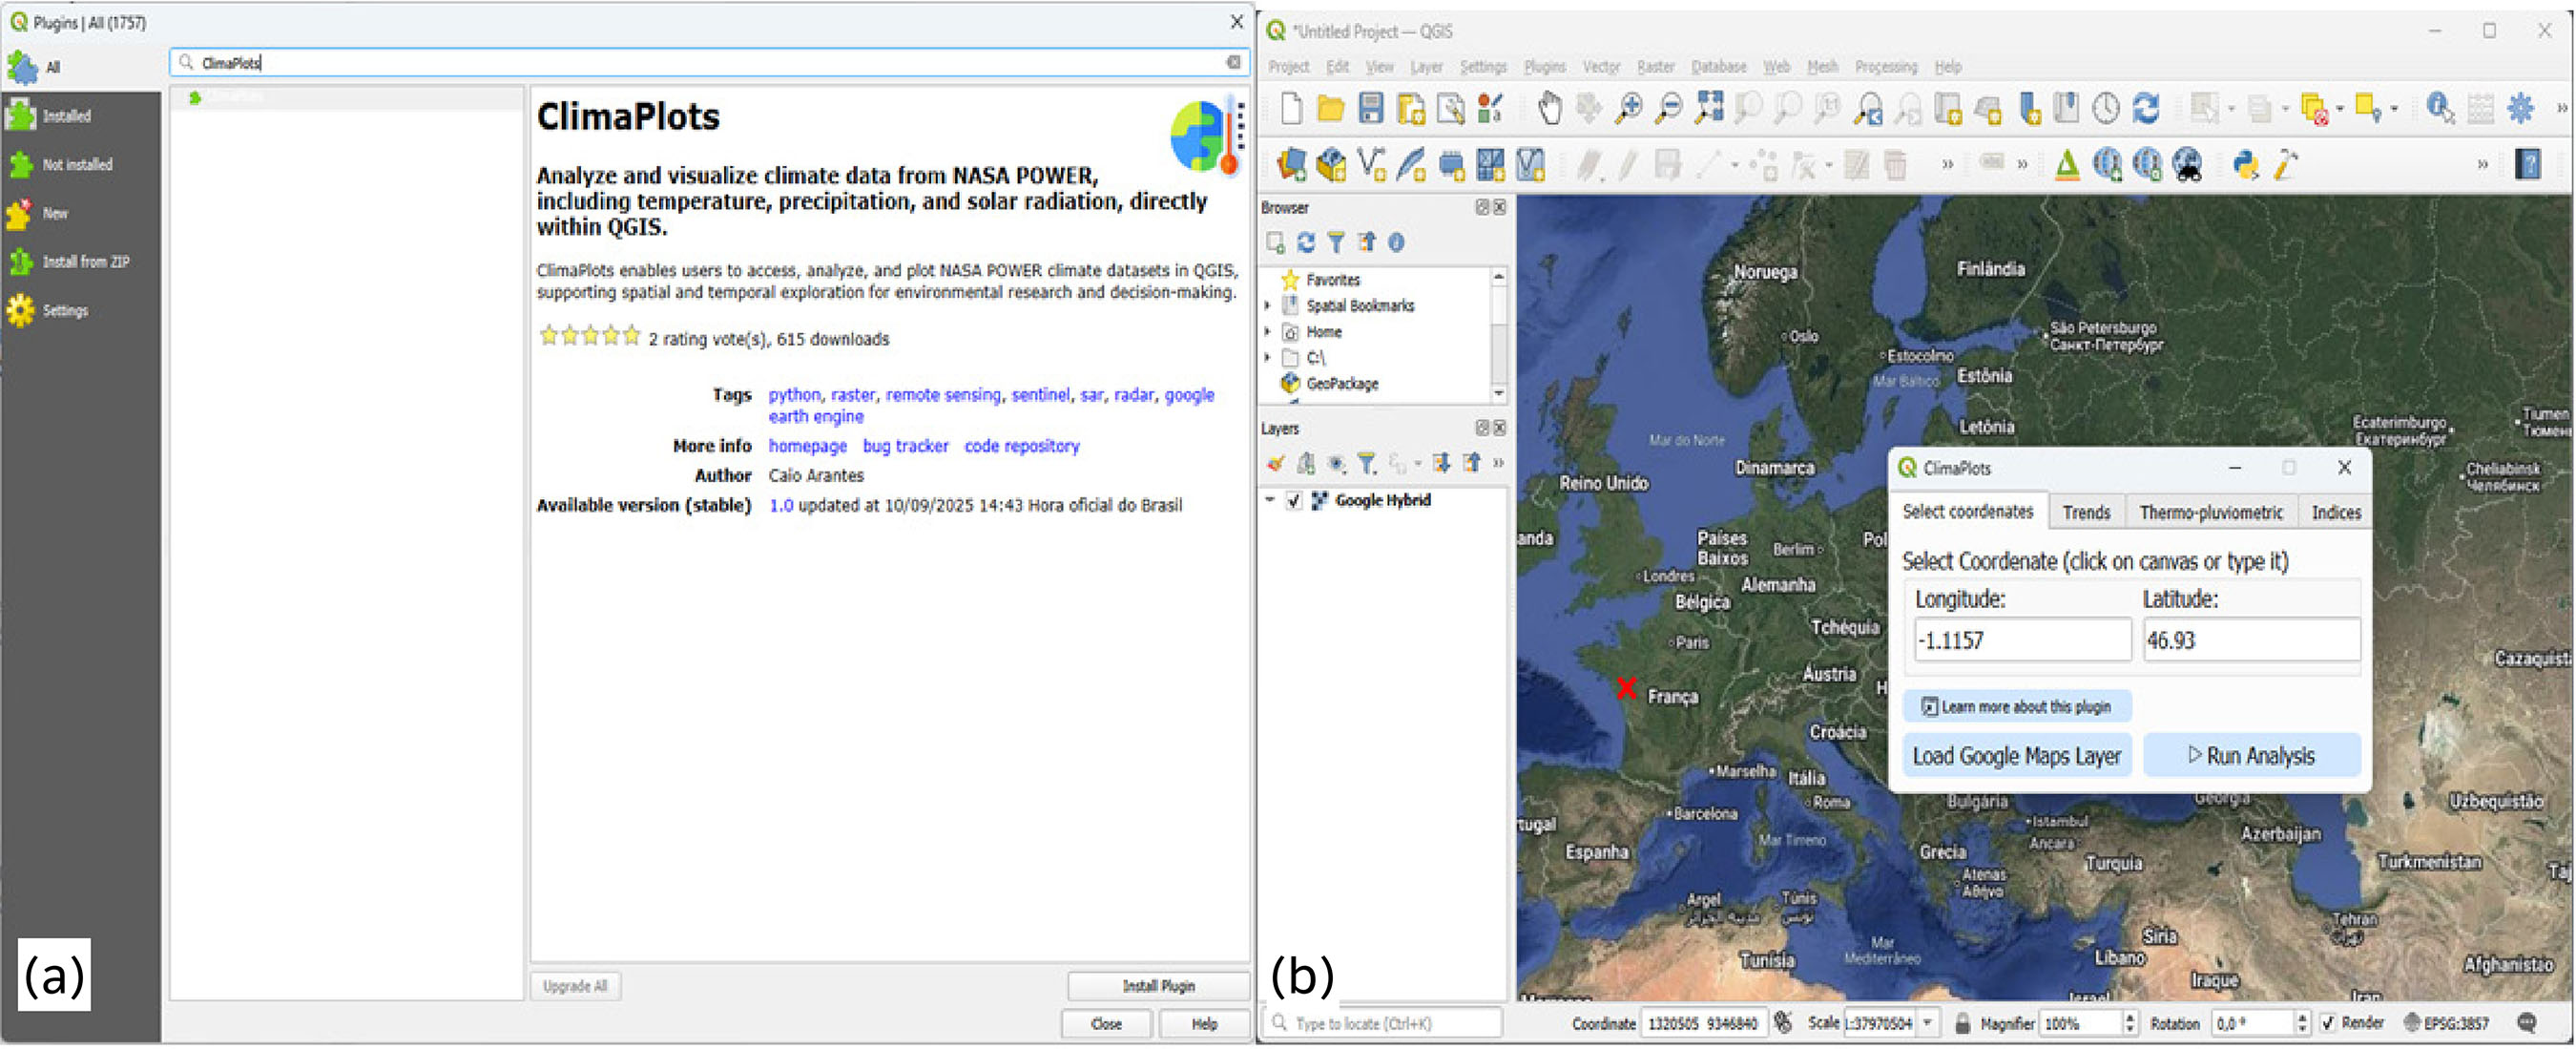
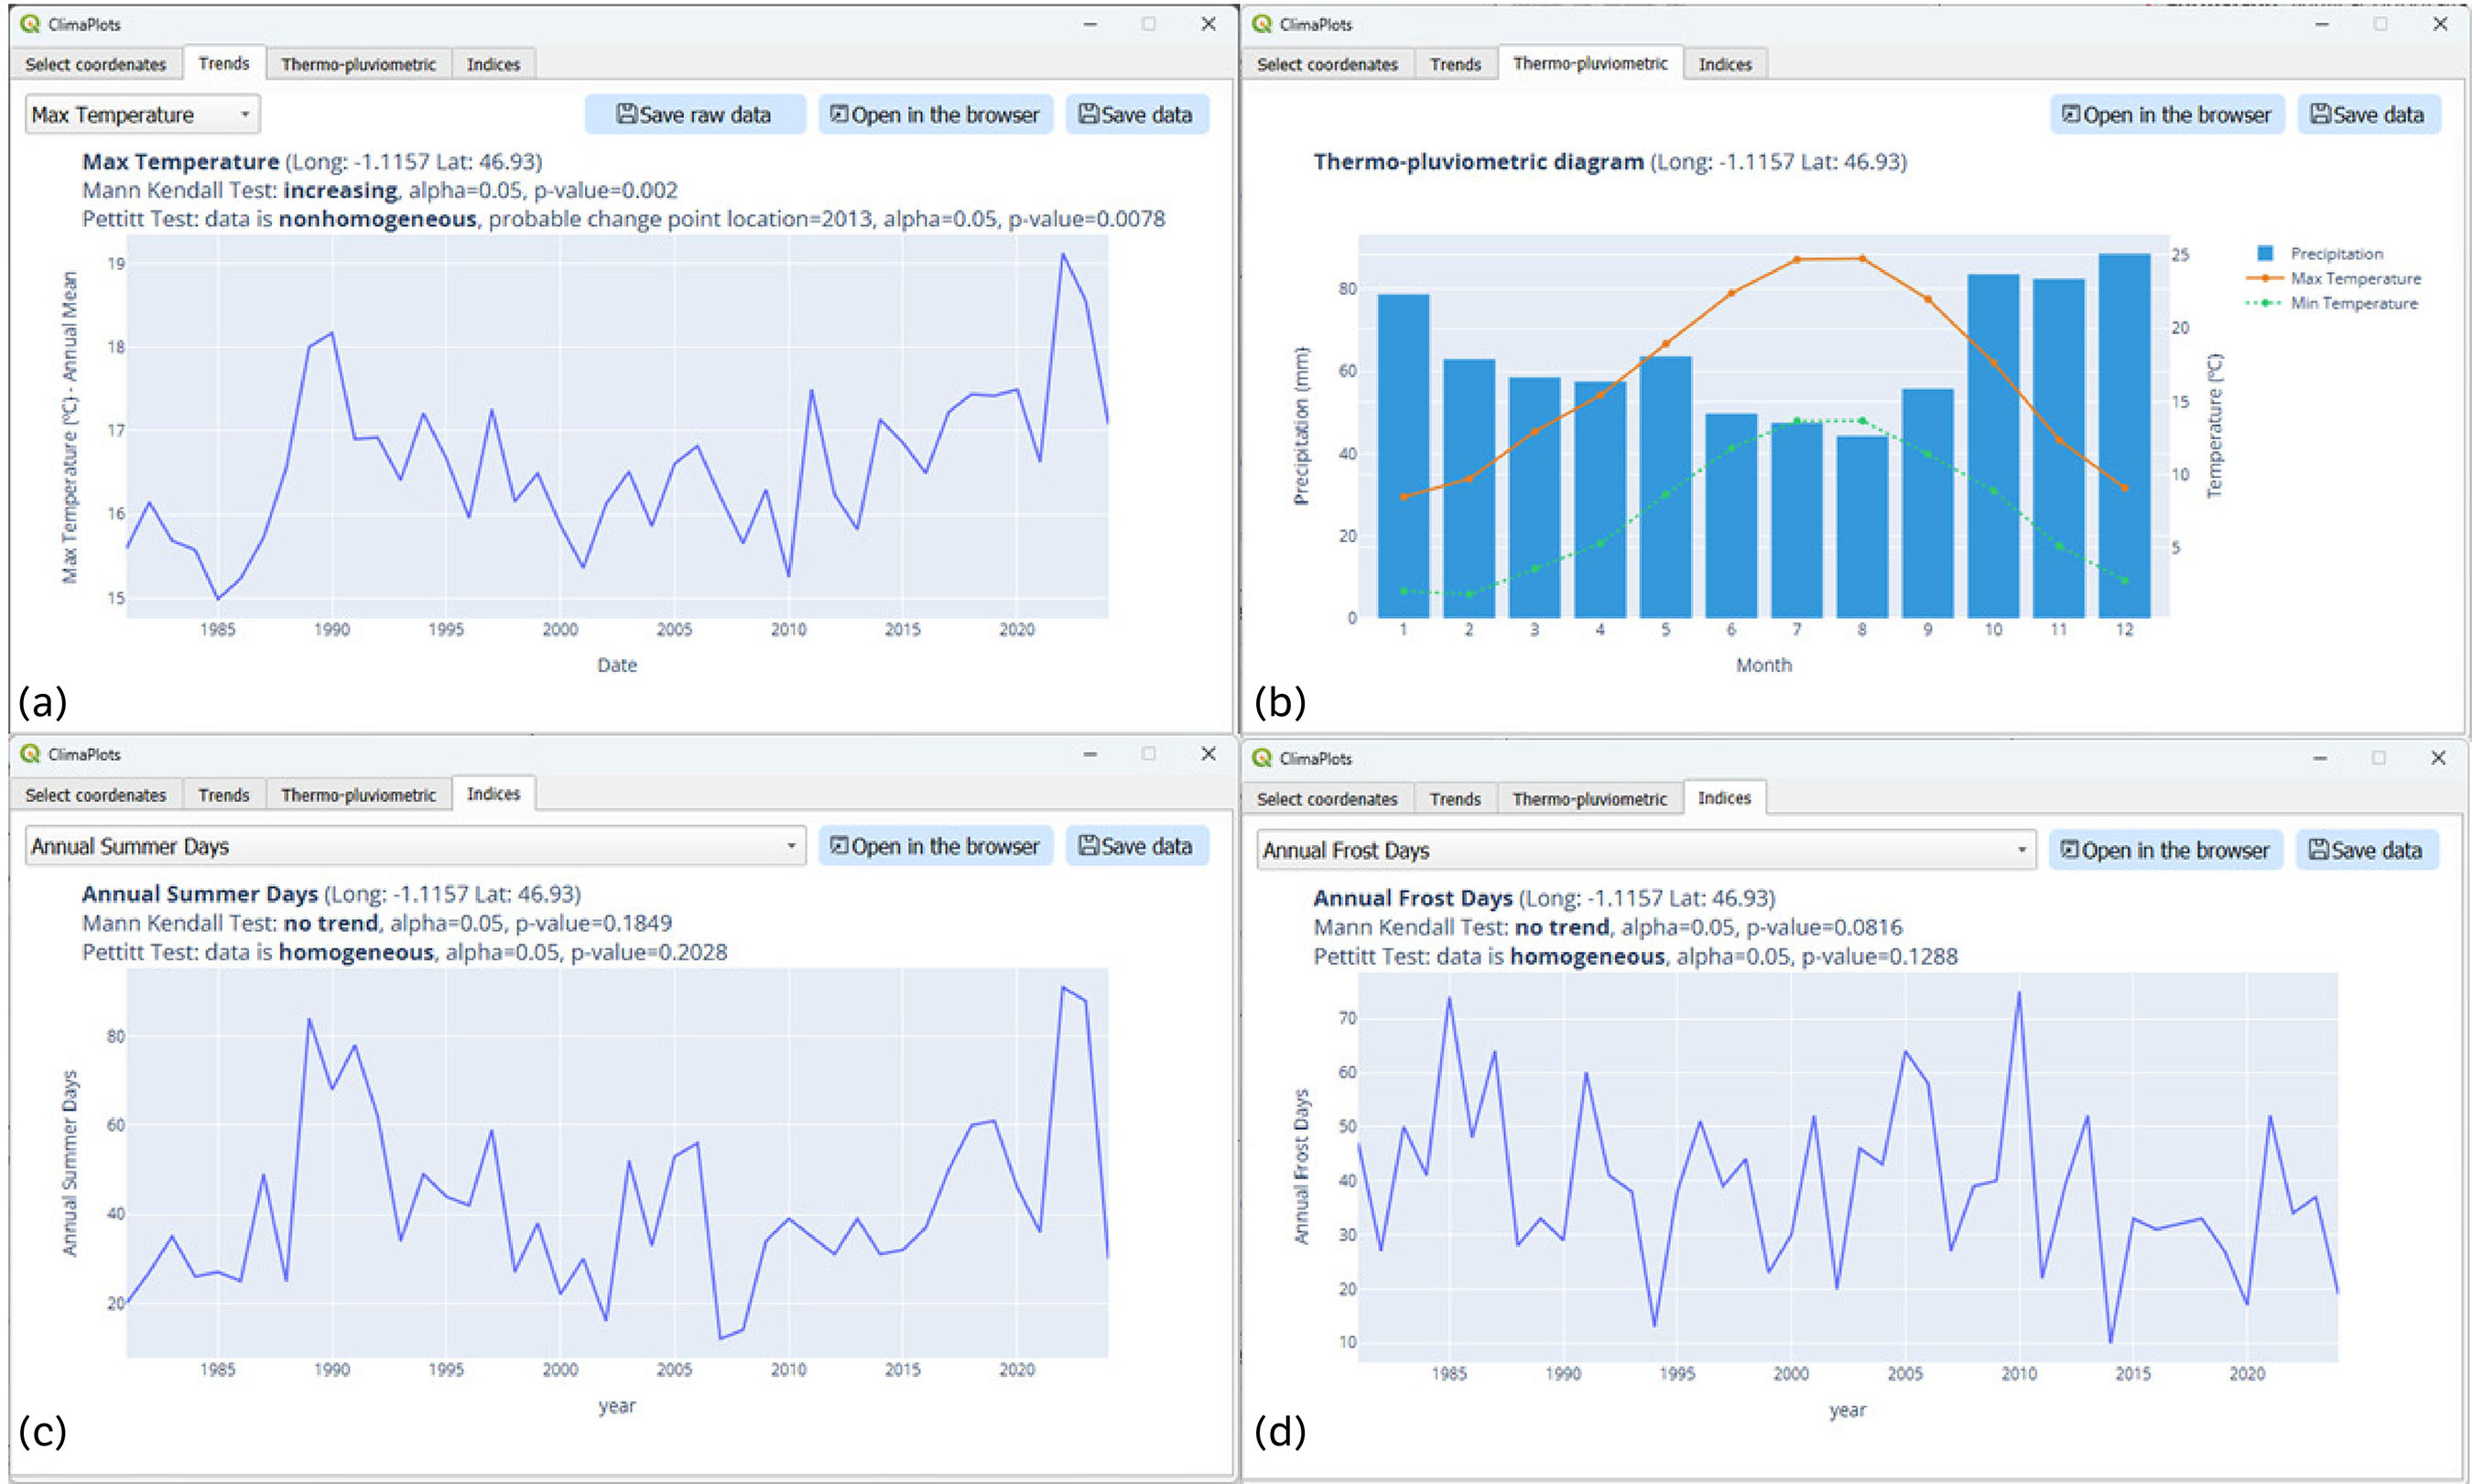
ClimaPlots is available through the official QGIS plugin repository and can be installed directly within the platform. Once installed, users can define geographic coordinates manually or select locations interactively on the map, with the option to overlay Google Maps layers (Figs. 1a and 1b). The plugin generates three main outputs:
-
Statistical tests for climate variables, including Mann-Kendall’s test for trends and Pettitt’s one for change points (Fig. 2a);
-
Climograms visualizing temporal variation (Fig. 2b);
-
ETCCDI indices with associated statistics (Figs. 2c and 2d).
Some indices showed stable behaviour over the analysed period. These outputs enable efficient assessment of climate variability, extremes, and trends, supporting applications in research, education, agriculture, and forest management.
QGIS, as an open-source GIS platform, provides a wide range of plugins for climate-related analyses, including surface temperature mapping (Ndossi and Avdan 2016), evapotranspiration estimation (Ellsäßer et al. 2020), land use and cover simulations (Touati et al. 2020, Isinkaralar 2024), time series forecasting (Naciri et al. 2024), and urban energy modelling. However, existing tools do not specifically address the detection of trends, extremes, and standardized climate indices, an aspect incorporated in ClimaPlots.
Developed as an open-source and user-friendly plugin, ClimaPlots simplifies the processing of climate information and extends access to advanced analyses across sectors such as agriculture, forestry, ecology, bioclimatology, and land use. It also supports applications in hydrology and ecosystem management. More broadly, ClimaPlots bridges climate data science and societal needs by transforming technical datasets into actionable information. In doing so, it contributes to the democratization of climate analysis and strengthens evidence-based decision-making in both research and environmental management.
Despite its relevance, ClimaPlots has limitations that must be critically considered, as they stem directly from the characteristics of the NASA POWER dataset on which it relies. Although NASA POWER is widely recognized for its accessibility, global coverage, and long-term historical records (Sparks 2018, Rodrigues and Braga 2021), these advantages do not eliminate inherent constraints associated with variable performance, spatial resolution, and the nature of data assimilation from reanalysis and satellite products. Consequently, the dataset’s reliability varies with region, climate type, and variable, and tends to be particularly limited in areas with sparse in situ observations, the very regions where accurate climate data are most needed (Sparks 2018, Marzouk 2021). This reflects a broader challenge in climate science: while open-access datasets expand availability, they cannot fully replace high-quality local measurements.
When evaluated by variable, temperature (both maximum and minimum) and solar radiation generally align well with station-based data in tropical and temperate regions, including Brazil, especially when aggregated at daily or monthly scales (Barboza et al. 2024, Rodrigues and Braga 2021). Their accuracy can be further improved through local bias correction (Monteiro et al. 2018, Rodrigues and Braga 2021, Rosa et al. 2023). In contrast, precipitation, wind speed, and relative humidity show greater discrepancies relative to ground observations, particularly in coastal or lowland areas, limiting their application to hydrological, agricultural, or risk-management studies unless corrected through statistical or downscaling methods (Faccin et al. 2024, Marzouk 2021, Rodrigues and Braga 2021). Spatial and temporal resolution constraints also hinder detailed local analyses, especially in tropical and semi-arid regions (Tan et al. 2023). Nonetheless, NASA POWER remains a valuable resource for filling meteorological gaps in remote or data-scarce areas.
In this context, ClimaPlots helps bridge technical constraints and user needs by enhancing the interpretability and usability of global climate datasets. By integrating accessible climate data with standardized ETCCDI indices, it advances the democratization of climate information across research, educational, and applied contexts. However, its outputs must be interpreted with caution, acknowledging variable-dependent accuracy and potential regional biases.
Therefore, users are strongly advised to perform local validation and, where possible, apply bias correction against ground-based meteorological observations before using the outputs for critical hydrological analyses, risk assessment, or decision-making processes.
When properly validated and bias-corrected, ClimaPlots serves as a robust tool for evidence-based decision-making in agriculture, hydrology, ecology, and land-use planning, while promoting transparency and reproducibility in climate data analysis.
CONCLUSION
This study presents ClimaPlots, an open-source plugin developed for QGIS with the goal of making meteorological and climate data more accessible. The tool offers an intuitive interface that helps users (such as researchers, planners, and decision-makers) obtain and visualize climate information without the need for coding or advanced statistical training.
By combining standard climate indices with graphical representations of trends and extremes, ClimaPlots supports analyses that can inform studies, public policies, and management practices in agriculture, urban areas, and forestry.
In the agricultural context, the plugin also serves as a practical climate service, helping small farmers interpret climate risks and plan crop management to improve resilience and food security. Although its results depend on the quality and resolution of the data sources used, ClimaPlots provides a straightforward way to transform large datasets into information that can guide adaptation and planning actions, particularly when its outputs are interpreted in conjunction with local knowledge or observation data.
ACKNOWLEDGMENTS
Not applicable.
-
How to cite:
Coltri, P. P. and Arantes, C. S. (2026). ClimaPlots: an open-source tool for meteorological series analysis and extreme indices. Bragantia, 85, e20250223. https://doi.org/10.1590/1678-4499.20250223
-
DECLARATION OF USE OF ARTIFICIAL INTELLIGENCE TOOLS
Artificial intelligence tools were used solely for language editing and grammatical correction of the manuscript. The authors are fully responsible for the content, interpretations, and conclusions presented in this work.
-
FUNDING
Fundo de Apoio ao Ensino, Pesquisa e Extão, Universidade Estadual de CampinasGrant No.: 519.287Brazilian Institute of Data ScienceGrant No.: 20/09838-0
DATA AVAILABILITY STATEMENT
All processed data and source code are openly available at https://github.com/caioarantes/climaplots, with full documentation at https://caioarantes.github.io/climaplots/.
REFERENCES
-
Ademe, D., Ziatchik, B., Tesfaye, K., Simane, B., Alemayehu, G. and Adgo, E. (2020). Climate trends and variability at adaptation scale: Patterns and perceptions in an agricultural region of the Ethiopian Highlands. Weather and Climate Extremes, 29, 100263. https://doi.org/10.1016/j.wace.2020.100263
» https://doi.org/10.1016/j.wace.2020.100263 -
Barboza, T., Ferraz, M., Pilon, C., Vellidis, G., Valeriano, T. and Santos, A. (2024). Advanced farming strategies using NASA POWER data in peanut-producing regions without surface meteorological stations. AgriEngineering, 6, 438-454. https://doi.org/10.3390/agriengineering6010027
» https://doi.org/10.3390/agriengineering6010027 -
Bhatt, G., Kumar, M. and Duffy, C. J. (2014). A tightly coupled GIS and distributed hydrologic modelling framework. Environmental Modelling & Software, 62, 70-84. https://doi.org/10.1016/j.envsoft.2014.08.003
» https://doi.org/10.1016/j.envsoft.2014.08.003 -
Chervenkov, H. and Slavov, K. (2021). ETCCDI climate indices for assessment of the recent climate over Southeast Europe. In I. Dimov and S. Fidanova (eds.). Advances in high performance computing (v. 902, p. 398-412). Cham: Springer. https://doi.org/10.1007/978-3-030-55347-0_34
» https://doi.org/10.1007/978-3-030-55347-0_34 -
Costa, R., Baptista, G., Gomes, H., Silva, F., Rocha Júnior, R., Salvador, M. and Herdies, D. (2020). Analysis of climate extremes indices over northeast Brazil from 1961 to 2014. Weather and Climate Extremes, 28, 100254. https://doi.org/10.1016/j.wace.2020.100254
» https://doi.org/10.1016/j.wace.2020.100254 -
Costa, R., Gomes, H., Pinto, D., Rocha Júnior, R., Silva, F., Gomes, H., Silva, M. and Herdies, D. (2021). Gap filling and quality control applied to meteorological variables measured in the Northeast Region of Brazil. Atmosphere, 12, 1278. https://doi.org/10.3390/atmos12101278
» https://doi.org/10.3390/atmos12101278 -
Dinku, T. (2019). Challenges with availability and quality of climate data in Africa. Extreme Hydrology and Climate Variability, 71-80. https://doi.org/10.1016/b978-0-12-815998-9.00007-5
» https://doi.org/10.1016/b978-0-12-815998-9.00007-5 -
Dinku, T., Block, P., Sharoff, J., Hailemariam, K., Osgood, D., Corral, J., Cousin, R. and Thomson, M. C. (2014). Bridging critical gaps in climate services and applications in Africa. Earth Perspectives, 1, 15. https://doi.org/10.1186/2194-6434-1-15
» https://doi.org/10.1186/2194-6434-1-15 -
Ellsäßer, F., Röll, A., Stiegler, C. H. and Hölscher, D. (2020). Introducing QWaterModel, a QGIS plugin for predicting evapotranspiration from land surface temperatures. Environmental Modelling & Software, 130, 104739. https://doi.org/10.1016/j.envsoft.2020.104739
» https://doi.org/10.1016/j.envsoft.2020.104739 -
Faccin, C., Specht, L., Almeida Júnior, P., Schuster, S. and Pacheco, L. (2024). Comparison of climate data from NASA POWER reanalysis and data measured at surface weather stations for application in Brazilian paving projects. Anuário do Instituto de Geociências, 47, 1-18. https://doi.org/10.11137/1982-3908_2024_47_60749
» https://doi.org/10.11137/1982-3908_2024_47_60749 -
Gebrechorkos, S., Hülsmann, S. and Bernhofer, C. (2017). Evaluation of multiple climate data sources for managing environmental resources in East Africa. Hydrology and Earth System Sciences, 22, 4547-4564. https://doi.org/10.5194/HESS-22-4547-2018
» https://doi.org/10.5194/HESS-22-4547-2018 -
Guldi, J. (2021). What kind of information does the era of climate change require? Climatic Change, 169, 3. https://doi.org/10.1007/s10584-021-03243-5
» https://doi.org/10.1007/s10584-021-03243-5 -
Hussain, M. and Mahmud, I. (2019). pyMannKendall: a python package for non-parametric Mann Kendall family of trend tests. Journal of Open Source Software, 4, 1556. https://doi.org/10.21105/joss.01556
» https://doi.org/10.21105/joss.01556 -
Hussain, M., Mahmud, I. and Bari, S. H. (2023). pyHomogeneity: A Python Package for Homogeneity Test of Time Series Data. Journal of Open Research Software, 11, 1-5. https://doi.org/10.5334/jors.427
» https://doi.org/10.5334/jors.427 -
Isinkaralar, O. (2024). QGIS-based modeling and analysis of urban dynamics affecting land surface temperature towards climate hazards in coastal zones of Portugal. Natural Hazards, 120, 7749-7764. https://doi.org/10.1007/s11069-024-06519-y
» https://doi.org/10.1007/s11069-024-06519-y - Kendall, M. G. (1975). Rank correlation measures. London: Charles Griffin.
-
Lennard, C., Nikulin, G., Dosio, A. and Moufouma‐Okia, W. (2018). On the need for regional climate information over Africa under varying levels of global warming. Environmental Research Letters, 13, 06040. https://doi.org/10.1088/1748-9326/aab2b4
» https://doi.org/10.1088/1748-9326/aab2b4 -
Manica, E., Coltri, P. P., Pacheco, V. M. and Martello, L. S. (2022). Changes in the pattern of heat waves and the impacts on Holstein cows in a subtropical region. International Journal of Biometeorology, 66, 2477-2488. https://doi.org/10.1007/s00484-022-02374-3
» https://doi.org/10.1007/s00484-022-02374-3 -
Mann, H. B. (1945). Nonparametric tests against trend. Econometrica, 13, 245-259. https://doi.org/10.2307/1907187
» https://doi.org/10.2307/1907187 -
Marzouk, O. (2021). Assessment of global warming in Al Buraimi, Sultanate of Oman based on statistical analysis of NASA POWER data over 39 years, and testing the reliability of NASA POWER against meteorological measurements. Heliyon, 7, e06625. https://doi.org/10.1016/j.heliyon.2021.e06625
» https://doi.org/10.1016/j.heliyon.2021.e06625 -
Monteiro, L., Sentelhas, P. and Pedra, G. (2018). Assessment of NASA/POWER satellite‐based weather system for Brazilian conditions and its impact on sugarcane yield simulation. International Journal of Climatology, 38, 1571-1581. https://doi.org/10.1002/joc.5282
» https://doi.org/10.1002/joc.5282 -
Naciri, H., Achhab, N., Ezzaher, F. and Raissouni, N. (2024). AIRS: A QGIS plugin for time series forecasting using deep learning models. Environmental Modelling & Software, 177, 106045. https://doi.org/10.1016/j.envsoft.2024.106045
» https://doi.org/10.1016/j.envsoft.2024.106045 -
Nash, D., Adamson, G., Ashcroft, L., Bauch, M., Camenisch, C., Degroot, D., Gergis, J., Jusopović, A., Labbé, T., Lin, K., Nicholson, S., Pei, Q., Prieto, M., Rack, U., Rojas, F. and White, S. (2021). Climate indices in historical climate reconstructions: a global state of the art. Climate of the Past, 17, 1273-1314. https://doi.org/10.5194/CP-17-1273-2021
» https://doi.org/10.5194/CP-17-1273-2021 -
Ndossi, M. and Avdan, U. (2016). Application of open source coding technologies in the production of land surface temperature (LST) maps from landsat: a PyQGIS plugin. Remote Sensing, 8, 413. https://doi.org/10.3390/rs8050413
» https://doi.org/10.3390/rs8050413 -
Neves, G. Z. D. F., Gallardo, N. P. and Vecchia, F. A. D. S. (2017). A short critical history on the development of meteorology and climatology. Climate, 5, 23. https://doi.org/10.3390/cli5010023
» https://doi.org/10.3390/cli5010023 -
Nyakundi, F., Osiemo, J., Grosjean, G., Nguyen, T. N., Girvetz, E., Jaquet, S., Lizarazo, M., Mburu, R., Grey, S., Röhrig, F., Giles, J., Nowak, A., Imbach, P., Corner-Dolloff, C., Baedeker, T., Konnonen, M. and Jarvis, A. (2020). Climate smart agriculture country profile data. Cambridge: Harvard Dataverse. https://doi.org/10.7910/DVN/FO42EP
» https://doi.org/10.7910/DVN/FO42EP -
Pathak, T., Maskey, M., Dahlberg, J., Kearns, F., Bali, K. and Zaccaria, D. (2018). Climate Change Trends and Impacts on California Agriculture: A Detailed Review. Agronomy, 8, 25. https://doi.org/10.3390/AGRONOMY8030025
» https://doi.org/10.3390/AGRONOMY8030025 -
Pettitt, A. N. (1979). A non-parametric approach to the change-point problem. Journal of the Royal Statistical Society: Series C (Applied Statistics), 28, 126-135. https://doi.org/10.2307/2346729
» https://doi.org/10.2307/2346729 -
Pugas, A. (2023). The hunt for data: obstacles faced by researchers in the search for accurate information on precipitation in Brazil. International Journal of Hydrology, 7, 88-91. https://doi.org/10.15406/ijh.2023.07.00344
» https://doi.org/10.15406/ijh.2023.07.00344 - QGIS Development Team (2024). QGIS Geographic Information System. Version 3.36. QGIS Association.
-
Rodrigues, G. and Braga, R. (2021). Evaluation of NASA POWER reanalysis products to estimate daily weather variables in a hot summer mediterranean climate. Agronomy, 11, 1207. https://doi.org/10.3390/AGRONOMY11061207
» https://doi.org/10.3390/AGRONOMY11061207 -
Rosa, S., Souza, J. and Santos, A. (2023). Data from NASA Power and surface weather stations under different climates on reference evapotranspiration estimation. Pesquisa Agropecuária Brasileira, 58, e03261. https://doi.org/10.1590/S1678-3921.pab2023.v58.03261
» https://doi.org/10.1590/S1678-3921.pab2023.v58.03261 -
Sparks, A. (2018). nasapower: A NASA POWER Global Meteorology, Surface Solar Energy and Climatology Data Client for R. Journal of Open Source Software, 3, 1035. https://doi.org/10.21105/JOSS.01035
» https://doi.org/10.21105/JOSS.01035 -
Tan, M., Armanuos, A., Ahmadianfar, I., Demir, V., Heddam, S., Al-Areeq, A., Abba, S., Halder, B., Kilinc, H. and Yaseen, Z. (2023). Evaluation of NASA POWER and ERA5-Land for estimating tropical precipitation and temperature extremes. Journal of Hydrology, 624, 129940. https://doi.org/10.1016/j.jhydrol.2023.129940
» https://doi.org/10.1016/j.jhydrol.2023.129940 - The Qt Company (2024). Qt: Cross-Platform Application and UI Framework. Version 6.x. The Qt Company.
-
Torres, G. A. L., Zezzo, L. V., São José, R. V., Greco, R. and Coltri, P. P. (2022). Exposure to climate risk: A case study for coffee farming in the region of Alta Mogiana, São Paulo. Anais da Academia Brasileira de Ciências, 94, e20211379. https://doi.org/10.1590/0001-3765202220211379
» https://doi.org/10.1590/0001-3765202220211379 -
Touati, N., Gardes, T., & Hidalgo, J. (2020). A GIS plugin to model the near surface air temperature from urban meteorological networks. Urban Climate, 34, 100692. https://doi.org/10.1016/J.UCLIM.2020.100692
» https://doi.org/10.1016/J.UCLIM.2020.100692 -
Wilke, A. K., & Morton, L. W. (2015). Climatologists’ communication of climate science to the agricultural sector. Science Communication, 37, 371-395. https://doi.org/10.1177/1075547015581927
» https://doi.org/10.1177/1075547015581927
Edited by
-
Section Editor:
Gabriel Constantino Blain https://orcid.org/0000-0001-8832-7734