 Avian influenza surveillance in wild birds using different diagnostic techniques in Costa Rica
Abstract
Avian influenza virus (AIV) surveillance is essential for monitoring outbreaks in wild bird populations. This study evaluated the performance of a rapid immunochromatographic test (RIT) compared to real-time PCR (qRT-PCR) and the agar gel immunodiffusion (AGID) test for AIV detection. RIT demonstrated greater sensitivity than AGID, detecting antigens at dilutions up to 1:512, whereas AGID only reached 1:16. At 1:512 dilution, qRT-PCR confirmed RIT results with a Ct value of 34.5, equivalent to 22 viral DNA copies/µL. The qRT-PCR detection limit for the AIV matrix gene was 2.57 DNA copies/µL. A total of 61 wild birds were reported to the National Animal Health Service in Costa Rica in 2023. Of these, 47 (77.0 %) exhibited clinical signs of avian influenza, while 14 (23.0 %) were dead. Thirteen taxonomic orders and 22 bird species were identified. with 32.2 % of the samples belonging to Pelecaniformes. Using qRT-PCR, 17 birds (27.9 %) tested positive for influenza A H5N1 virus. 76.5 % were Pelecanus occidentalis, 11.8 % Falco peregrinus, 5.9 % redfooted boobies (Sula sula), and 5.9 % great frigatebirds (Fregata minor). Fourteen (7 positive and 7 negative) were tested by RIT and qRT-PCR, showing 100 % concordance between the two methods. Brain tissue showed the highest viral load (918,847 copies/µL), while cloacal swabs had the lowest (1,450 copies/µL). Tracheal samples were most frequently submitted (94.1 %) and had a 93.8 % positive rate. Geospatial analysis revealed most positive cases were from the Pacific Coast. Organspecific testing highlighted the risk of false negatives, emphasizing the need for optimized tissue sampling. Additionally, 200 cloacal swabs from birds in four rescue centers in Costa Rica’s Central Valley tested negative by RIT. These findings support the complementary use of RIT with qRT-PCR for effective field and laboratory AIV surveillance. Monitoring and improved diagnostic strategies are critical for early detection and control of outbreaks. in Costa Rica.
Keywords:
Zoonosis; avian; H5N1; wild birds.
Resumo
A vigilância do vírus da influenza aviária (VIA) é essencial para detectar precocemente surtos em aves silvestres. O presente estudo comparou a eficácia do teste rápido imunocromatográfico (TRI) com a PCR em tempo real (qRT-PCR). O TRI demonstrou maior sensibilidade que o teste de imunodifusão em gel de ágar (TIGA), detectando antígenos até a diluição 1:512, contra 1:16 do TIGA. Esses resultados foram confirmados por qRT-PCR, com valor médio de Ct de 34,5 (22 cópias de DNA viral/µL), e limite de detecção de 2,57 cópias/µL. Um total de 61 aves silvestres foram reportadas ao Serviço Nacional de Saúde Animal (SENASA) da Costa Rica entre janeiro e dezembro de 2023. Destas, 47 (77,04 %) apresentaram sinais clínicos compatíveis com influenza aviária, enquanto 14 (22,96 %) foram encontradas mortas. Foram identificadas treze ordens taxonômicas e 22 espécies de aves, sendo que 32,20 % das amostras pertenciam à ordem Pelecaniformes. Utilizando a técnica de qRT-PCR, 17 das 61 aves (27,86 %) testaram positivo para o vírus da influenza A (H5N1). Entre os casos positivos, 76,47 % eram Pelecanus occidentalis, 11,77 % Falco peregrinus, 5,88 % atobásde-pé-vermelho (Sula sula) e 5,88 % fragatas-grandes (Fregata minor). Das 61 aves silvestres, 14 (7 positivas e 7 negativas) foram testadas tanto por RIT quanto por qRT-PCR, mostrando 100 % de concordância entre os dois métodos. A análise geoespacial indicou maior concentração de casos na costa do Pacífico. A variação na carga viral entre diferentes tecidos reforça o risco de falsos negativos e a necessidade de otimização da coleta. Nenhuma das 200 amostras de suabes cloacais de aves em centros de resgate testou positivo por RIT. Os achados destacam a importância de métodos diagnósticos combinados e de vigilância contínua para o controle eficaz da influenza aviária na Costa Rica.
Palavras-chave:
Zoonoses; aves; H5N1; aves silvestres.
1. Introduction
The avian influenza virus (AIV), belonging to the genus Influenza virus A within the family Orthomyxoviridae, is a segmented, enveloped RNA virus with negative polarity. This virus encodes 10 proteins and is classified into subtypes based on the combination of two surface glycoproteins: hemagglutinin (HA) and neuraminidase (NA), of which 16 (H1-H16) and 9 (N1-N9), respectively, are known. They are categorized as highly pathogenic avian influenza viruses (HPAIV) or low pathogenic avian influenza viruses (LPAIV) based on their ability to cause disease and mortality (1). Mutations and gene reassortment frequently occur among these viruses, allowing LPAIV to potentially evolve into HPAIV. Avian influenza is highly contagious and affects both domestic and wild birds. Although less frequently, avian influenza viruses have also been identified in mammals, including humans (1).
Wild migratory and aquatic birds, particularly those from the orders Anseriformes (ducks, geese, and swans) and Charadriiformes (gulls, terns, and shorebirds), are recognized as the primary reservoirs of LPAIV. Many of these birds frequently interact with other species, enabling the virus to spread easily to domestic poultry through fecal-oral or aerosol transmission routes. Once the virus enters a poultry flock, it can mutate into HPAIV, potentially causing widespread disease and mortality among the birds. This increases the risk of zoonosis for human who have contact with domestic poultry. Moreover, the migratory routes of terrestrial and aquatic wild birds can facilitate the virus's spread from North America to South America (2).
In Guatemala, LPIAV have been detected in eight of 22 species of wild birds by real-time reverse transcription polymerase chain reaction (qRT-PCR) (3). Additionally, passerine species, such as common reed buntings, brown-eared bulbuls, and pale thrushes, are susceptible to infection by H5N1 HPAI viruses, which emphasizes that continued surveillance of species other than waterfowl is crucial for effective monitoring of H5N1 HPAI virus outbreaks (4).
Although it is known that wetland and aquatic birds, such as Anseriformes, constitute the primary natural reservoir for avian influenza A virus (AIV), the epidemiological dynamics in wild birds and the actual reservoir of this virus remain unclear. Therefore, understanding the epidemiological dynamics of avian influenza in wild birds and, consequently, continuous surveillance of wild birds for influenza is essential to address many unanswered questions about the zoonotic spread of avian influenza. This will aid in developing effective surveillance and control measures aimed at safeguarding the health of poultry and human populations (5).
Given the competitive demands for limited resources, it is essential to identify optimal approaches for avian influenza surveillance in wild birds that not only effectively detect outbreaks but also consider cost efficiency. A rapid immunochromatographic test (RIT) for diagnosing type A influenza offers several advantages, including ease of implementation, quick results within minutes, high specificity, and low cost. However, the sensitivity of this test is relatively low. Therefore, using it as a preliminary screening tool, followed by validation with more sensitive diagnostic techniques, appears to be a cost-effective and efficient method for sampling wild birds (6-8).
This study aims to validate RIT by comparing it with other diagnostic methods, i.e., the agar gel immunodiffusion (AGID) test and qRT-PCR. Furthermore, it seeks the usefulness of the RIT for AIV surveillance in wild birds at rescue centers in the Central Valley of Costa Rica. However, qRTPCR was used for the surveillance of sick birds reported to the National Animal Health Service (SENASA) in 2023.
2. Material and methods
2.1 Study Area
This study was conducted as part of the Avian Influenza surveillance program during 2023. The first part was the evaluation of healthy birds at four wildlife rescue centers in the provinces of Alajuela, and Heredia, situated in the central valley of Costa Rica. These areas have an average temperature ranging 19.5-29.0°C, with annual precipitation varying 24-2,699 mm. These rescue centers are located at elevations above 638 m above sea level. The second part was the sampling of sick or dead wild birds delivered to SENASA.
2.2 Samples
For the first part of the surveillance, cloacal swab samples were collected from wild birds admitted to and residing at the wildlife rescue centers during January-August 2023. The samples were identified, and their data, which included animal identification number, life stage (chick, juvenile, or adult), taxonomic order, species, and origin, were recorded in Microsoft Excel® spreadsheets.
For the second part of the study, several samples (tracheal or cloacal swabs, organs including the brain, trachea, spleen, liver, and tonsil cecal or bowel samples (in the case of pelicans) from sick or dead wild birds were collected from January to December 2023 and sent to the virology laboratory (LSE) of the National Veterinary Services Laboratory (LANASEVE) of SENASA. In some cases, when two birds were found dead at the same location, swabs or tissue from the same organ were pooled into a single sterile tube and refrigerated during transport to the laboratory. All samples were extracted and analyzed by the AIV type A matrix qRT-PCR (9). Fourteen of these samples (with positive and negative results) were also analyzed by RIT (Bionote, Gyeonggi-do, Korea) as part of the RIT validation.
2.3 Rapid immunochromatographic test
The procedure outlined in the Antigen Rapid AIV Ag® kit (Bionote, Gyeonggi-do, Korea) was followed. The samples were immersed in the assay diluent tube and mixed for 10 seconds. After allowing the solution to settle for 1 minute, four drops of the supernatant were dispensed into the designated well on the device using a dropper. The fluid flow was verified, and the results were read after a 20-minute waiting period. A test was interpreted as negative if only the control line "C" was marked, while it was considered positive if both the control line "C" and the test line "T" were visible. The test was deemed invalid if the control line "C" did not appear (8).
2.4 RNA extraction
RNA extraction from tissue and swab samples was performed using the IndiSpin® Pathogen kit (Qiagen, Leipzig, Germany). The cloacal or tracheal swab sample was placed in a storage tube with transport medium, followed by centrifugation. Next, 20 µl of proteinase K, 200 µl of the sample, and 100 µl of Buffer VXL were added to an Eppendorf tube. The mixture was thoroughly mixed and incubated at 20-25 °C for 15 minutes. Subsequently, 350 µl of Buffer ACB was added and mixed. The solution was transferred to a 2-ml collection tube and centrifuged at 8,000 rpm for 1 minute. The supernatant was carefully transferred to a new tube, discarding the tube containing the filtrate. This process was repeated twice, each time adding 600 µl of Buffer AW1 and 600 µl of Buffer AW2, followed by centrifugation at 14,000 rpm for 2 minutes. The resulting solution was transferred to a 1.5 ml Eppendorf tube, discarding the tube containing the filtrate. Finally, 150 µl of Buffer AVE was added to the column, incubated at 15-25 °C for 1 minute, and then centrifuged at 14,000 rpm for 1 minute.
2.5 Real-time reverse transcription polymerase chain reaction
The One-Step RT-PCR® kit (Qiagen, Valencia, CA, USA) was used for amplification and reverse transcription of the extracted samples. Each 13-µl reaction tube contained 7 µl of the RNA, 0.254 µl of diethyl pyrocarbonate-treated water, 2.6 µl of One-step buffer, 0.65 µl of MgCl2, 0.416 µl of deoxynucleoside triphosphates, 0.26 µl of primer M+25-F, 0.52 µl of primer M124R (2002), 0.26 µl of primer M124R (2009), 0.52 µl of One-step qRT-PCR enzyme, 0.26 µl of ROX Dye, and 0.26 µl of TaqMan M+64 probe (9) modified in 2009 by the US Department of Agriculture (Table 1). The thermal cycling was performed in an Applied Biosystems thermocycler, starting with reverse transcription at 50 °C for 30 minutes. This was followed by deactivation of the reverse transcriptase and activation of the polymerase at 95 °C for 15 minutes. Subsequently, 40 cycles were carried out with denaturation at 94 °C for 1 second to separate DNA strands and annealing/ extension at 60 °C for 31 seconds to allow primer binding, resulting in an amplified product (9,10).
Number of samples by taxonomic order from birds from Costa Rican wildlife rescue centers, which were subjected to a rapid immunochromatograpic test.
The amplification curve was generated by detecting fluorescence signals in each cycle. Starting from a baseline fluorescence defined in the initial cycle, a threshold was set just above this baseline to determine the cycle threshold (Ct) (11-13). For a Ct value ≤35.0, the sample was classified as positive, while a Ct value >35.0 was considered suspicious. Samples with an undetectable Ct value were classified as negative (10).
2.6 Rapid immunochromatography test validation
2.6.1 Sensitivity versus agar gel immunodiffusion test
The Influenza type A strong positive antigen reference control 300-EXP (US Department of Agriculture, Ames, IA, USA) used in the avian influenza immunodiffusion was diluted from 1:2 to 1:1,024 at 1:2-fold intervals. These dilutions were tested in parallel with RIT and the AGID test.
2.6.2 Detection limit of RIT and AGID test expressed in DNA copies/µl
A qRT-PCR-amplified, AIV-positive sample was analyzed on an agarose gel, and the resulting band was excised. DNA was extracted using the QIAquick Gel Extraction Kit (Qiagen, Leipzig, Germany), and the eluted DNA concentration was measured at 2.8 ng/μl, quantified in duplicate using a Nanodrop spectrophotometer. The fragment size was 101 bp, determined using the sequence OM965828 as a reference. The number of DNA copies/μl was estimated to be 2.57 × 10¹⁰ copies/μl, calculated using the DNA Copy Number Calculator. To determine the detection limit of the AIV RIT in terms of viral DNA copy numbers, the highest detectable twofold dilution obtained from the comparison of the RIT and AGID test using the reference control 300-EXP was extracted using the DNeasy Blood & Tissue Kit (Qiagen, Leipzig, Germany) following the manufacturer’s instructions.
The extracted samples were processed twice using the AIV Matrix qRT-PCR described above. The average Ct value was used to calculate the viral DNA copy number, as previously described. Serial 1:10 dilutions of the eluted DNA were prepared, and two standard curves, ranging from 2.57 × 10⁸ to 2.57 copies/μl, were generated. These curves were used to establish the detection limit of the Influenza type A real-time qRT-PCR, RIT, and AGID assays.
The number of AIV DNA copies was calculated using the slope of the standard curve obtained from the previously described tenfold dilutions from the following standard curve mathematic formula: (C = a × (N) + b, where C is the Ct and N is the viral DNA load expressed in DNA copies/µl at the given Ct. The parameters a and b were determined by fitting the linear model to the dilution data. To obtain the number of viral DNA copies present in the sample based on the Ct values obtained from the qRT-PCR assay, the model was inverted .
Two distinct approaches were used to obtain the regression model. The first approach employed the QuantStudio 6 Flex Thermocycler software to process the qRT-PCR data and derive and for the standard curve. Also, the same analysis was done using R software with linear regression fitting functions. There was consistency in the results from both programs, which validated the model.
To determine the detection limit of the AIV RIT in terms of viral DNA copy number, the highest detectable twofold dilution, obtained from the comparison of the RIT and AGID test using the reference control 300-EXP, was extracted using the DNeasy Blood & Tissue Kit (Qiagen, Leipzig, Germany) according to the manufacturer's instructions. The extracted samples were processed in duplicate using the matrix AIV qRT-PCR described above. The average Ct value was used to calculate the viral DNA copy number as previously described.
2.6.3 RIT sensitivity and specificity compared to qRT-PCR
A total of 14 samples, 7 positive and 7 negative, were randomly selected from the first 10 positive and first 10 negative cases diagnosed by qRT-PCR. These samples, collected from tracheal or cloacal swabs or from the tracheae of sick or deceased wild birds, were also tested using the AIV RIT. For cloacal or tracheal swabs, clean swabs were rubbed over the tracheal tissue to collect mucus when present.
2.7 Ethics approval and consent to participate
The animal rescue centers provided consent for the collection of cloacal samples from the wild birds for the detection of AIV. Ethics approval was not required for sampling sick, dead, or healthy wild birds, as this activity falls under the mandate of SENASA according to Law 8495.
3. Results
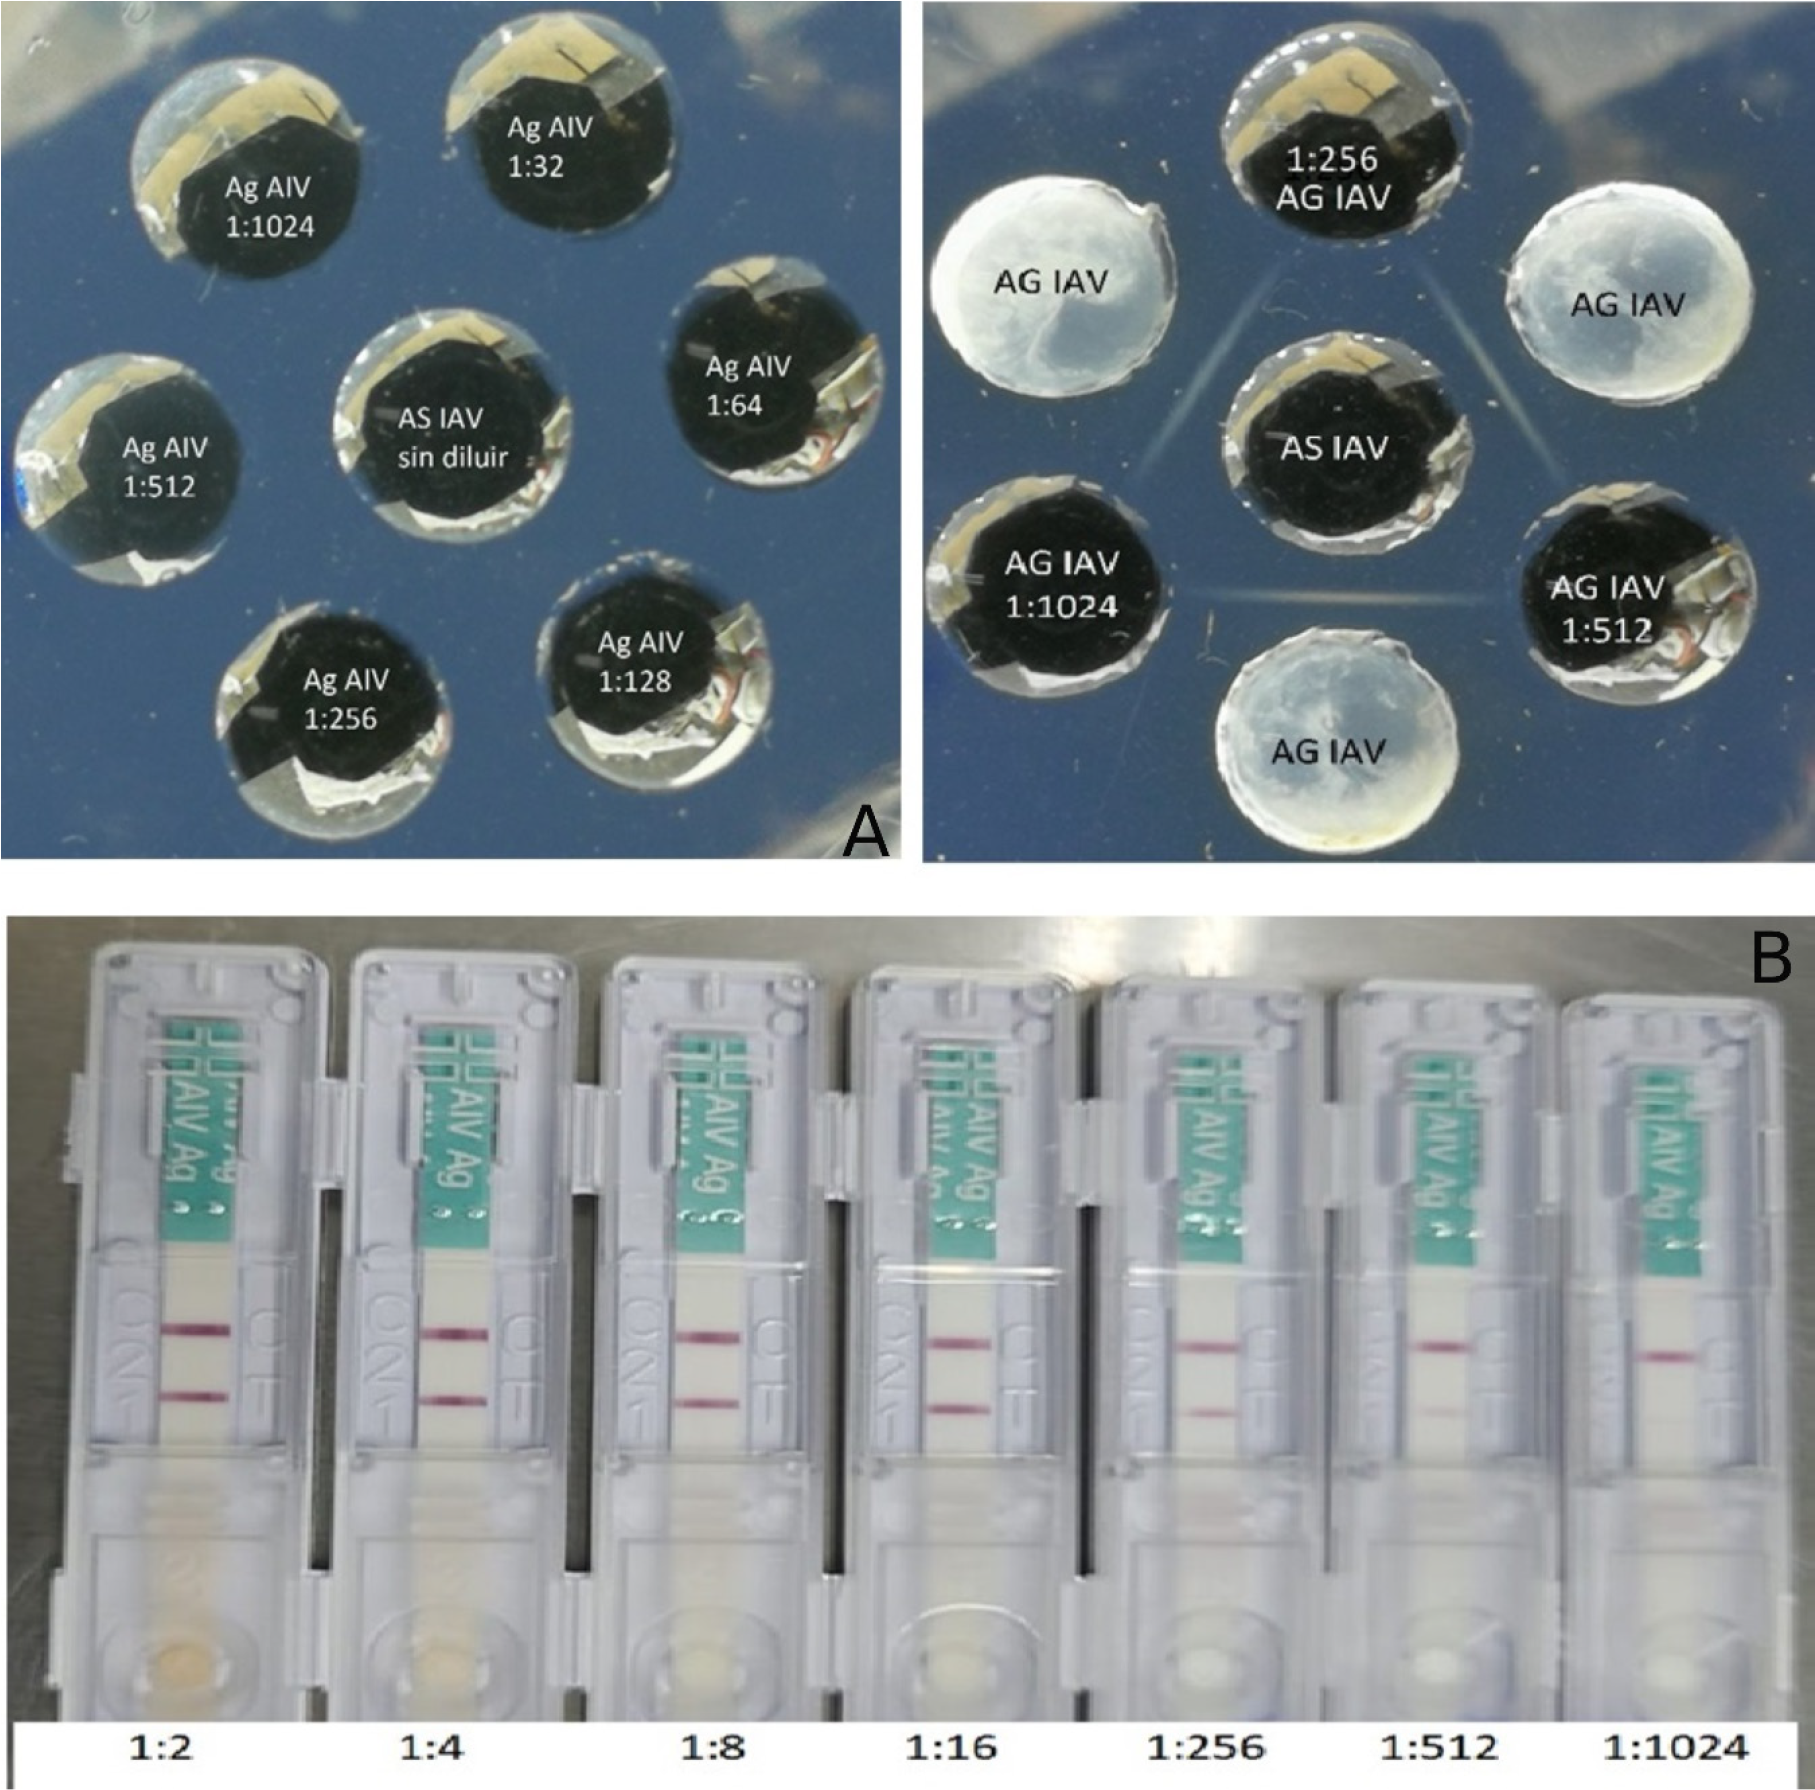
From the two-fold dilutions ranging from 1:2 to 1:1,024, the AGID test detected the Ag AIVpositive sample (300-EXP) only in dilutions from 1:2 to 1:16, with no detectable data beyond this range. The remaining dilutions, from 1:32 to 1:1,024, were negative (Figure 1A). In contrast, the RIT detected positive results across all dilutions ranging from 1:2 to 1:512 (Figure 1B).
A - Left: Agar gel immunodiffusion (AGID) test results using serial dilutions (1:32 to 1:1,024) of the influenza type A strong positive antigen reference control 300-EXP (IAV). Right: Only the undiluted IAV produced a reaction against the avian influenza virus (AIV) antiserum. No identity bands were observed when the same dilutions from 1:256 to 1:1,024 of the control were tested; B - Results of the reference control 300-EXP evaluated by the rapid immunochromatographic test using dilutions ranging from 1:2 to 1:1,024 in the AGID test.
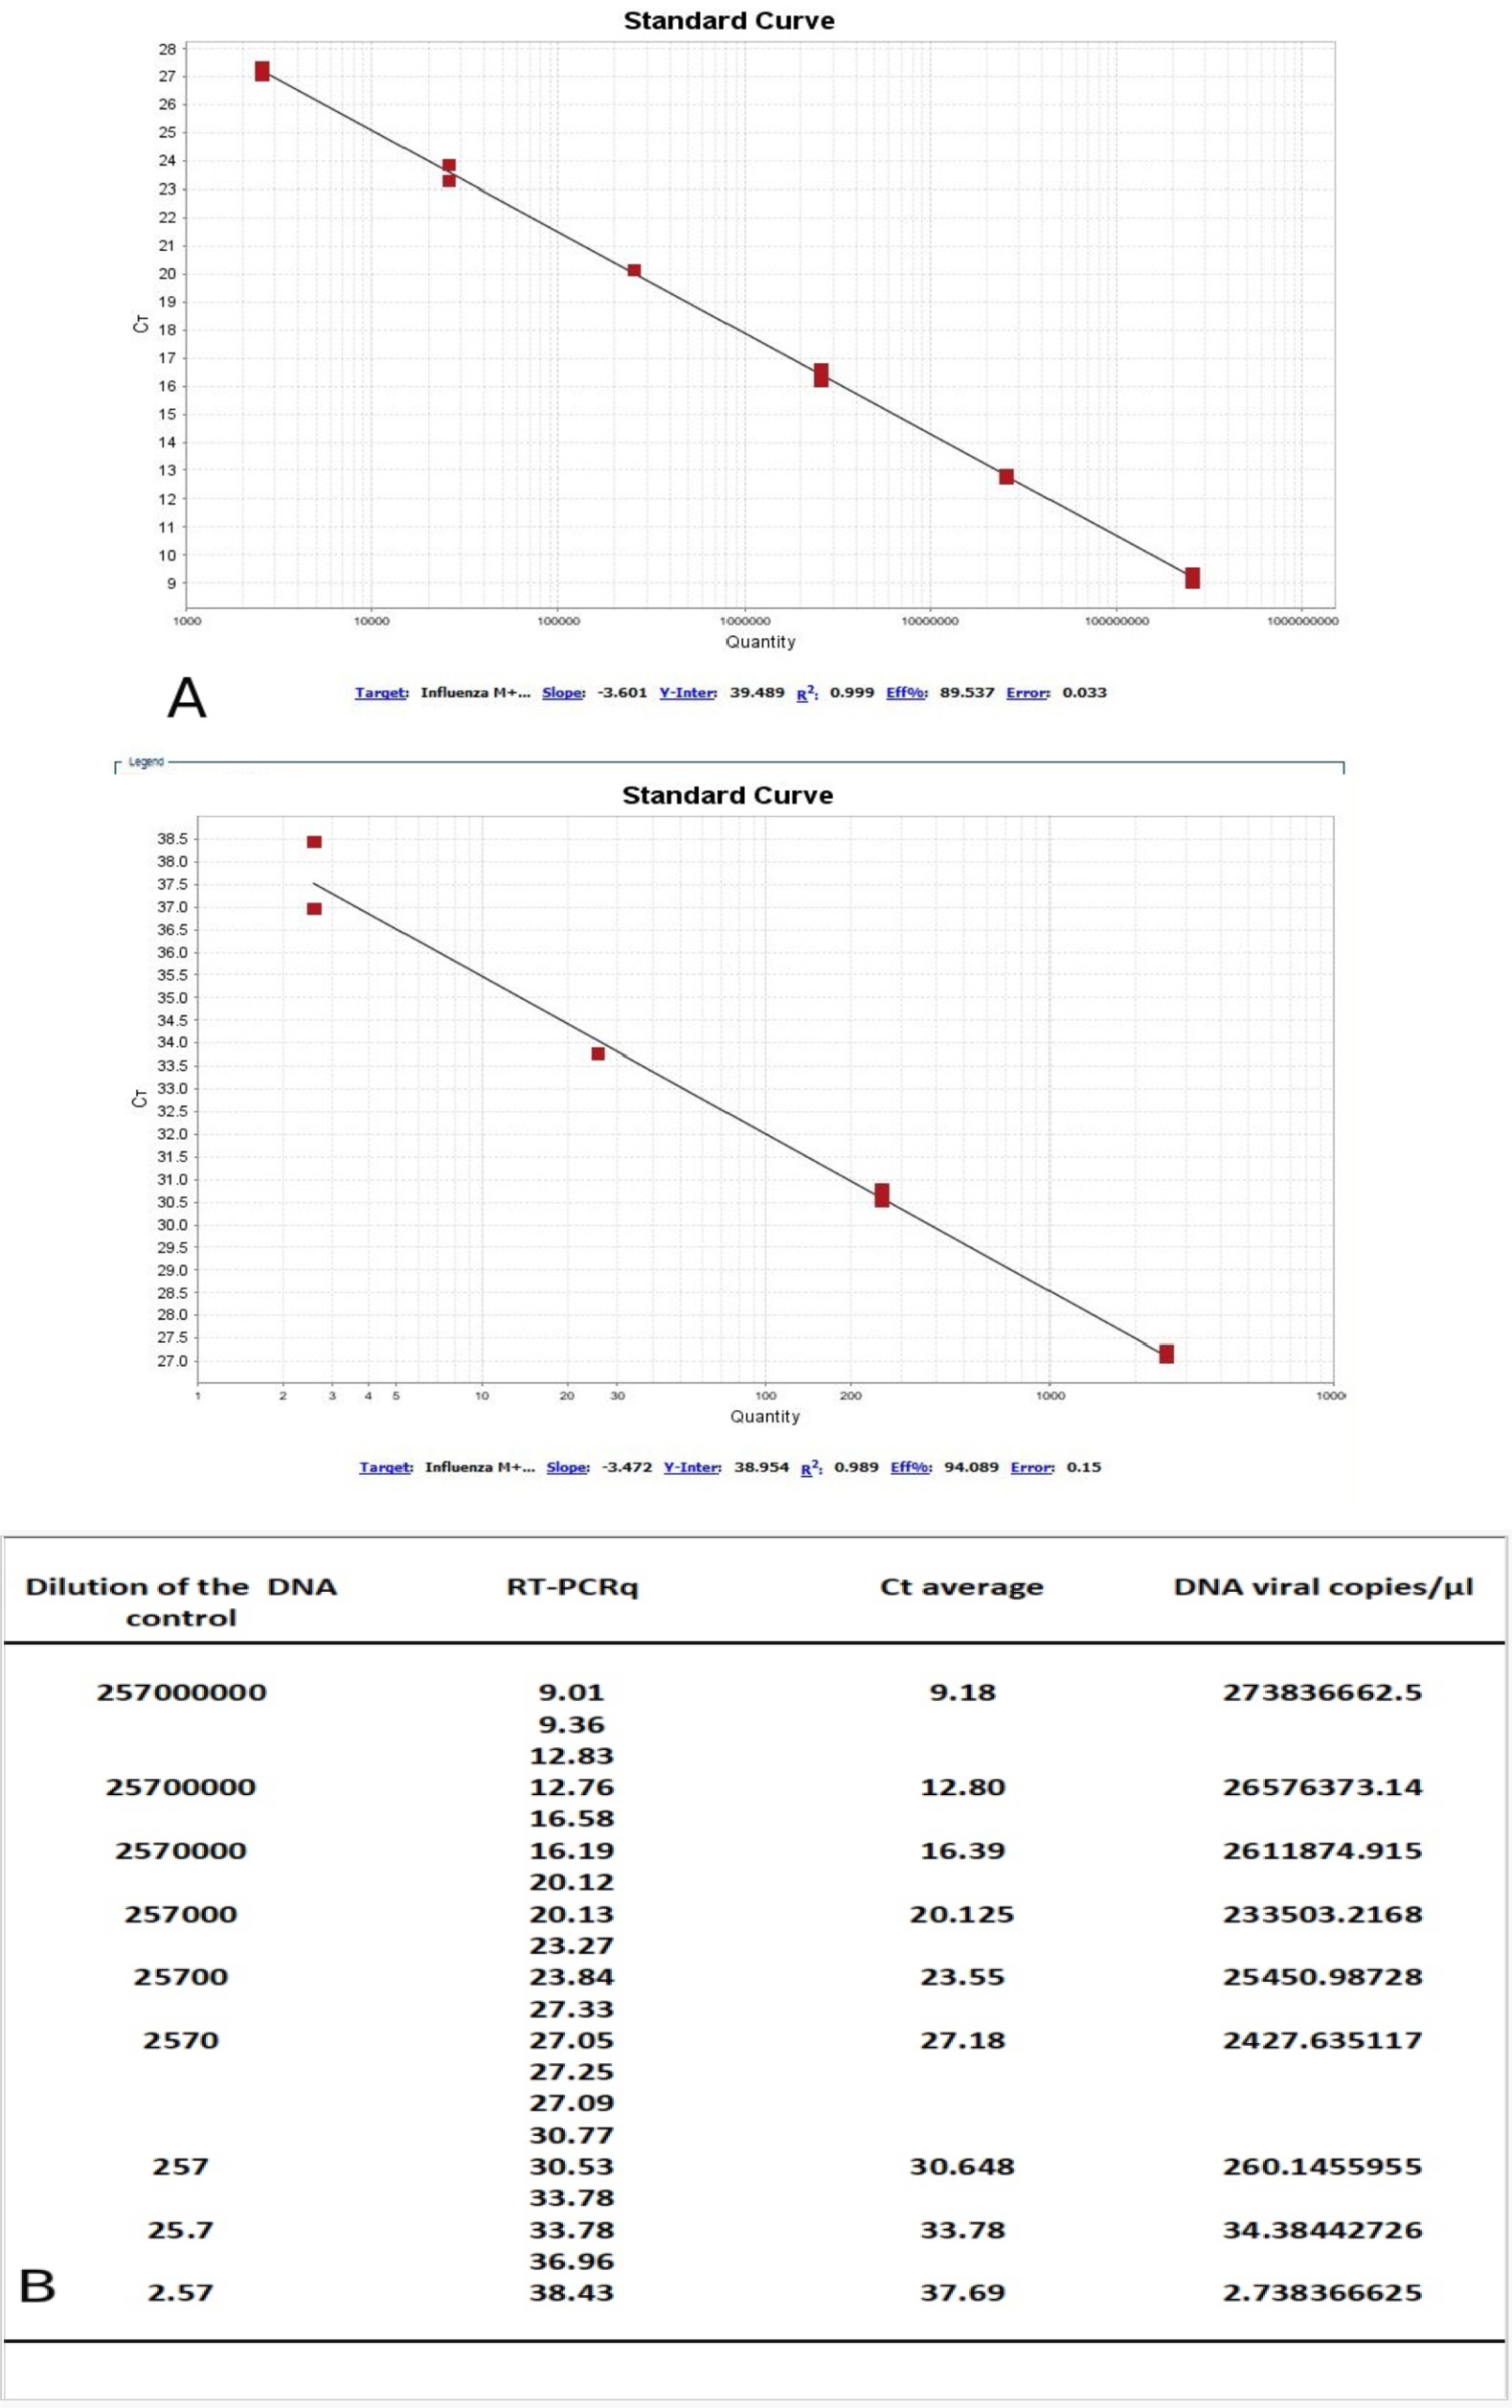
Figure 2A displays two standard curves constructed using tenfold dilutions of a positive control with an estimated concentration of 2.57 × 10⁸ DNA copies/µl to determine the detection limit of the AIV matrix qRT-PCR. The slope of the upper curve was -3.601, with a Y-intercept of 39.49, an R2 (correlation coefficient) of 0.99, an efficiency of 89.54 %, and an error of 0.03. The slope of the lower curve was -3.472, with a Y-intercept of 38.95, an R2 value of 0.99, an efficiency of 94.09 %, and an error of 0.15. Using the combined data from both standard curves (Figure 2B), the derived linear model y ≈ -3.5453x + 39.1329, with an R2 = 0.9988. The 95 % confidence intervals for the slope and intercept were -3.607246--3.483296 and 38.825086-39.440675, respectively. This linear model is statistically equivalent to the previously mentioned models.

A - Two standard curves constructed using tenfold dilutions of a positive control with an estimated concentration of 2.57 × 10⁸ DNA copies/µl. The upper curve was constructed using six tenfold dilutions ranging from 2.57 × 10⁸ DNA copies/µl to 2,570 DNA copies/µl. The lower curve was created with four tenfold dilutions ranging from 2,750 DNA copies/µl to 2.57 DNA copies/µl; B - Cycle threshold (Ct) values for each replicate sample, along with the average Ct and the corresponding DNA viral copies/µl.
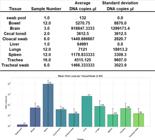
A - The types of samples from bird tissues, the number of each sample, their respective mean viral loads, and standard deviations; B - presents a graphical representation of this information.
Based on the results obtained using this formula, the detection limits of the RIT for the 1:512 and 1:1,024 dilutions were determined. Using the model, the DNA copies/µl values were calculated and rounded to the nearest integer. For the 1:512 dilution, the Ct values were 34.4 and 34.6 (average 34.5), corresponding to 22 viral DNA copies/µl. For the 1:1,024 dilution, the Ct values were 35.64 and 35.65 (average 35.645), corresponding to 10 viral DNA copies/µl.
In 2023, 61 suspected cases of AIV in wild birds were reported to SENASA. Of these, 14 cases were tested using the RIT and qRT-PCR. Both methods yielded consistent results, either positive or negative, in all 14 cases. The seven negative cases included one pelican, two grackles, one owl, one black guan, one duck, and one frigatebird. The seven positive cases are highlighted in red in Table S1.
Of the 61 wild bird cases submitted to SENASA, 17 (27.9 %) tested positive for AIV by qRT-PCR and were confirmed by sequencing. Among the positive cases, 13 (76 %) were brown pelicans (Pelecanus occidentalis ), two (11.7 %) were peregrine falcons (Falco peregrinus), 1 (5.88 %) was red-footed booby (Sula sula ), and one (5.88 %) was great frigatebird (Fregata minor ). Of these, seven cases were tested by RIT, and all tested positive. Additionally, seven of the first 10 qRT-PCR-negative birds also tested negative by RIT. The Ct (DNA viral copies/µl) in the positive cases ranged from 16.3 (2,756,156 copies/µl) in a brain sample from a brown pelican to 38.7 (1 copy/µl) in a spleen sample from another brown pelican.
The most frequently submitted sample to the laboratory in these 17 AIV-positive birds was the trachea, with 16 of 17 samples (94.1 %). Of these, 15 tracheal samples (93.8 %) tested positive for AIV by qRT-PCR. Bowel samples from pelicans were the second most frequently analyzed tissue, with 13 of 14 samples (92.8 %) testing positive for AIV. Spleen samples ranked third, with 12 of 13 samples (92.3 %) testing positive, followed by lung samples, of which 10 of 11 samples (90.9 %) were positive. The brain and liver were the least frequently submitted tissues, with three and one samples, respectively, all of which tested positive for AIV. In contrast, swab samples were the least effective in detecting AIV. Only 42.9 % (3/7) of tracheal swabs and 37.5 % (3/8) of cloacal swabs tested positive for AIV.
Among the analyzed tissues, the brain had the highest average number of DNA copies/µl, followed by the liver, lung, bowel, and trachea (Table 3). The spleen had the lowest DNA copies/µl among the tissues. Interestingly, the tracheal and cloacal swabs had similar numbers of copies/µl. The lowest viral load detected was 132 copies/µl, found in a swab pool taken from two deceased pelicans. In contrast, the highest viral load was detected in the tracheal pool (1,262 copies/µl), followed by the lung pool (305 copies/µl), bowel pool (149 copies/µl), and spleen pool (22 copies/µl).
Of the 61 cases reported, 47 (77.0 %) exhibited clinical signs of avian influenza, while 14 (23.0 %) were dead,31 birds were from the Costa Rican coasts. Of these, 14 of 22 cases from the Pacific coast tested positive by qRT-PCR, while four of nine cases from the Atlantic coast were positive.
For the positive cases, some tests on specific organs yielded false negatives, suggesting that certain organs may be less reliable for detection. This highlights the need for more rigorous studies to generate statistical evidence identifying which organs are more likely to produce true positives and which are prone to false negatives. Such data would help streamline the testing process by prioritizing the use of more reliable tissues and avoiding those prone to false negatives (Table S1).
3.1 Results of the RIT in wildlife rescue centers
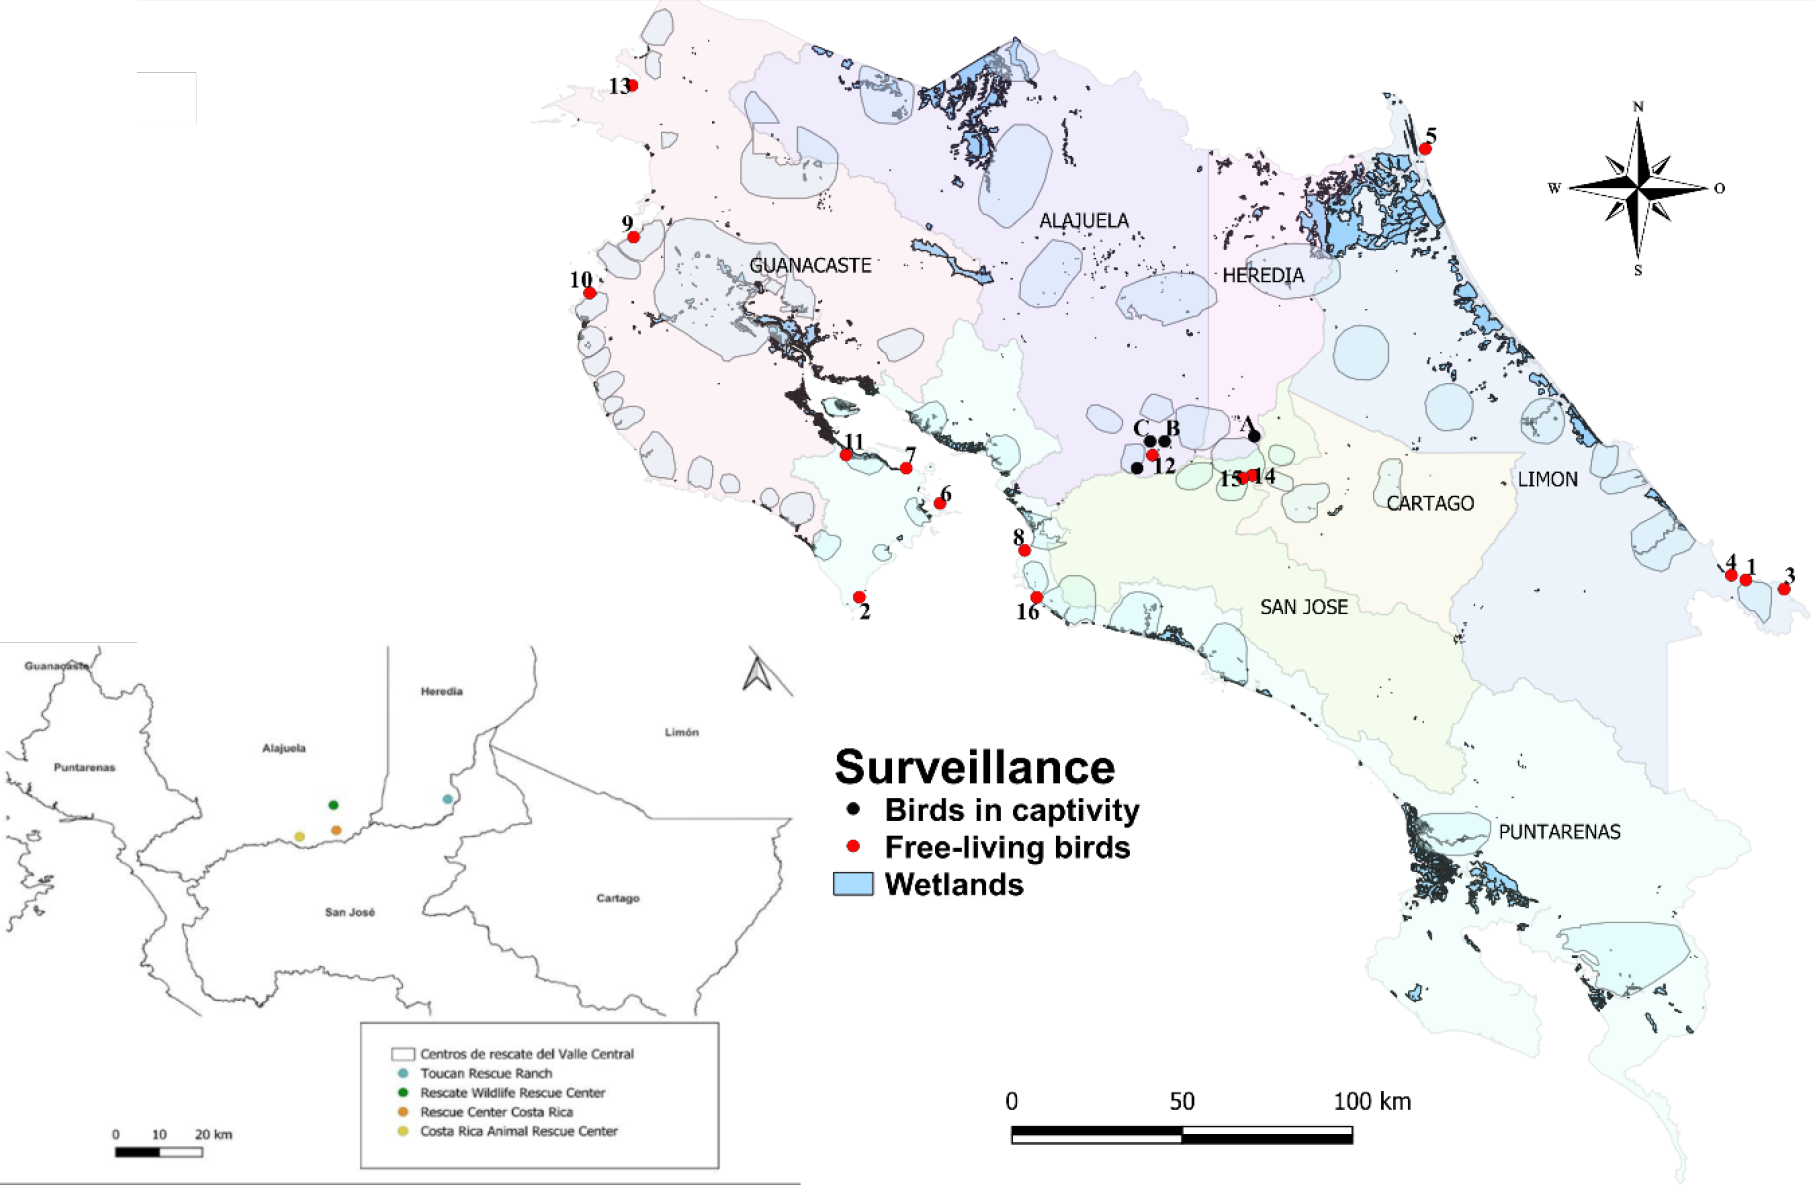
From January to August 2023, 200 cloacal swab samples were collected from resident or rescued birds at four wildlife rescue centers: 10 from the Costa Rica Animal Rescue Center; 47 from Rescue Center Costa Rica; 61 from Wildlife Rescue Center; and 82 from Toucan Rescue Ranch. A total of 51 bird species representing 12 taxonomic orders were identified (Table 4). No positive results for AIV were detected by RIT. Figure 4 shows the locations of AIV-positive cases in wild birds and the locations of the rescue centers.
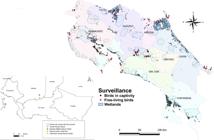
Map showing the locations of four wildlife rescue centers in the Central Valley of Costa Rica (small map), which are represented by black dots on the large map. The red dots represent the location of positive cases of wild birds with avian influenza virus.
4. Discussion
The RIT can detect AIV type A in samples with a minimum of 22 DNA copies/µl. According to the manufacturer’s manual, four sample drops, about 200 µl, must be dispensed in the RIT. Therefore, RIT is able to detect at least 4,400 DNA copies. Other studies have reported detection thresholds of 24 hemagglutinating units (8) or expressed the limit as 50 % embryo infectious dose (104.8 EID50/ml) (16). We analyzed one tracheal swab and fourteen tracheae from 14 diseased wild birds using both the RIT and qRT-PCR, obtaining consistent results by the two methods. In some cases, the intensity of the positive test line on the RIT varied from strong to faint, correlating with the viral load detected by qRT-PCR.
During the 2023 AIV surveillance in wild birds, 17 cases of AIV type A were detected by qRT-PCR and confirmed by sequencing as the H5N1 clade 2.3.4.4b. In contrast to the RIT, the detection limit for the AIV matrix gene using qRT-PCR was 2.57 DNA copies/µl, or 18 DNA copies per PCR reaction, demonstrating significantly higher sensitivity compared to the 1,000 gene copies reported for this method in 2002 (9). Despite the superior sensitivity of qRT-PCR, the method failed to detect the virus in certain samples, likely due to a low viral load (17). This may result from variations in viral replication rates across tissues or the compromised quality of tissues at the time of RNA extraction.
Brain tissue appeared to support better viral replication, making it an excellent sample source for detecting AIV, alongside lung, tracheal, liver, and spleen tissues. Similar findings have been reported in other studies (17). We recommend that, in cases where wild birds show neurological signs, brain tissue should be collected and sent to the laboratory in double containment bags or a plastic sample bottle. The samples should be kept at 2-8 °C. For swabs, the detection of AIV is uncertain. The reports from LANASEVE indicated that 90-100 % of the tracheal and cloacal swab samples tested positive by both virus isolation and qRT-PCR, regardless of media volume, if the samples are collected 2-4 days post-infection (DPI). For routine surveillance in commercial chickens, pooled swabs from 5-11 birds is more effective than individual swabs because the viral titers at 2-4 DPI are significantly lower in individual swabs compared to pooled swabs (18). This might explain why no virus was detected in the swabs collected from a pelican reported on 19 January 2023. This observation is further supported by the low viral load detected in the tracheal and cecal tonsil samples, measured at 85 and 9 DNA copies/µl, respectively.
Of the 17 free-living wild birds that tested positive for AIV, 13 were pelicans. A study assessing the spread of HPAIV among six avian host groups of waterfowl, resident waterfowl, captive birds, raptors, pelicans, and other wild birds found that pelicans (Pelecanus spp.) were the earliest species detected with HPAIV in California, appearing 29 days before detections in commercial facilities. These detections in pelicans and resident waterfowl/captive birds preceded those in migratory waterfowl, suggesting that they may serve as better indicators of HPAIV spread to commercial facilities. This indicates that certain taxa, such as pelicans and resident waterfowl, are primary agents of disease dynamics in the Pacific Flyway when migratory waterfowl are absent(19).
Pelicans breed in large, dense colonies, mainly on isolated islands in freshwater lakes, and forage in inland marshes, lakes, and rivers, particularly favoring shallow waters. This behavior likely facilitates the infection and circulation of AIV within populations of these birds (20). High mortality caused by AIV H5N1 clade 2.3.4.4b has also been reported in pelicans, such as in Greece and Montenegro in 2022, where 60 % of a colony succumbed to the virus (21, 22). Additionally, the occurrence of encephalitis in Dalmatian pelicans, along with high viral loads detected by qRTPCR, suggests that the virus is highly neurotropic (23).
In our study, none of the 200 samples collected from birds belonging to 12 different orders at wildlife rescue centers tested positive for AIV. AIV has been detected in turkeys, ducks, parrots, crows, orioles, Amazon parrots, finches, woodpeckers, grackles, owls, psittacines, cockatoos, and some naturally infected mammals, with a wide variety of strains (24). Our findings are consistent with similar studies where no virus circulation was observed in captive wild birds in management centers (25-27).
The absence of AIV-positive birds at wildlife management sites in the Central Valley of Costa Rica could be linked to strengthened biosecurity protocols following the epidemiological alert prompted by avian influenza outbreaks in Latin American countries during 2022 and 2023. Some rescue centers restricted the entry of potential reservoir birds, such as Anseriformes, thereby reducing the likelihood of disease propagation. Furthermore, the centers' locations away from coastal areas may have contributed to the absence of AIV-positive birds, resulting in fewer aquatic birds in their stock and reducing contact between free-ranging wild birds and captive birds. However, one diseased falcon was included in one of the four centers sampled here.
A review of 60 publications from 1975-2012 containing surveillance data on AIV in passerines and associated terrestrial birds included 829 species from four orders: Columbiformes, Cuculiformes, Passeriformes, and Piciformes. Passeriformes accounted for most birds, with 745 of 829 species (89.9 %). Testing methods varied across studies, though most utilized virus isolation (VI) or molecular diagnostics. Among these, nine publications reported 74 PCR-positive results from 10,477 samples (0.7 %), but only nine viruses were successfully isolated. Additionally, during 2010 and 2011, researchers collected serum samples from 3,558 terrestrial wild birds in four US states, Georgia (n = 1,200), New Jersey/Delaware (n = 280), and Minnesota (n = 2,078), representing 102 species and 22 families. Of the 236 samples tested using qRT-PCR and VI, and an additional 353 samples tested using VI, all were negative for AIV.
Molecular surveillance studies have reported higher detection rates of AIV in passerines compared to traditional VI-based surveillance. These findings have led some researchers to suggest that passerines may serve as AIV reservoirs. However, issues were noted in studies relying solely on molecular diagnostics. Notably, none of the studies that concluded that passerines were AIV reservoirs provided confirmatory virus isolation data from PCR-positive birds, raising questions about the validity of these interpretations (27).
Studies have shown that infected birds can excrete high concentrations of AIV for up to 14 DPI, without displaying overt clinical signs of disease (28, 29). Our findings demonstrate that the RIT has a detection limit of 22 DNA copies/µl. If any of the birds sampled tested negative but were indeed infected, this method should have been capable of detecting the virus in the cloacal swabs. A possible explanation for the negative results is the sensitivity of the RIT. It has been established that the median infectious dose in birds exceeds 102 embryo infectious doses. Therefore, the negative results could be attributed to low viral concentration, suggesting a reduced likelihood of transmission to other animals or humans and indicating no active virus circulation in these wildlife management centers. Although none of the captive wild birds exhibited clinical signs of AIV, the fact that cloacal swabs from these birds were not tested by qRT-PCR represents a major limitation of this study.
5. Conclusion
The RIT is more sensitive than the AGID test and is, therefore, a reliable tool for analyzing bird samples in the field to detect AIV in diseased wild birds, provided the viral load is sufficiently high. However, it is not suitable for use in deceased animals, especially when the tissue is severely autolytic. Additionally, the RIT is straightforward to execute and interpret, requiring minimal training. Coupled with its low acquisition cost, this test serves as a valuable tool for avian influenza surveillance systems. However, due to its limited sensitivity and reduced ability to detect low viral loads in cloacal swab samples, the data do not provide sufficient evidence to support claims of an absence of viral circulation in the captive birds sampled from the rescue centers. We recommend prioritizing brain, liver, lung, bowel, and tracheal tissues for submitting samples from sick and dead birds to the diagnostic laboratory. In the case of autolytic birds, samples should include at minimum the brain, lungs, trachea, and cecal tonsils. Negative results in these cases should be interpreted with caution.
Supplementary material
Supplementary material 1
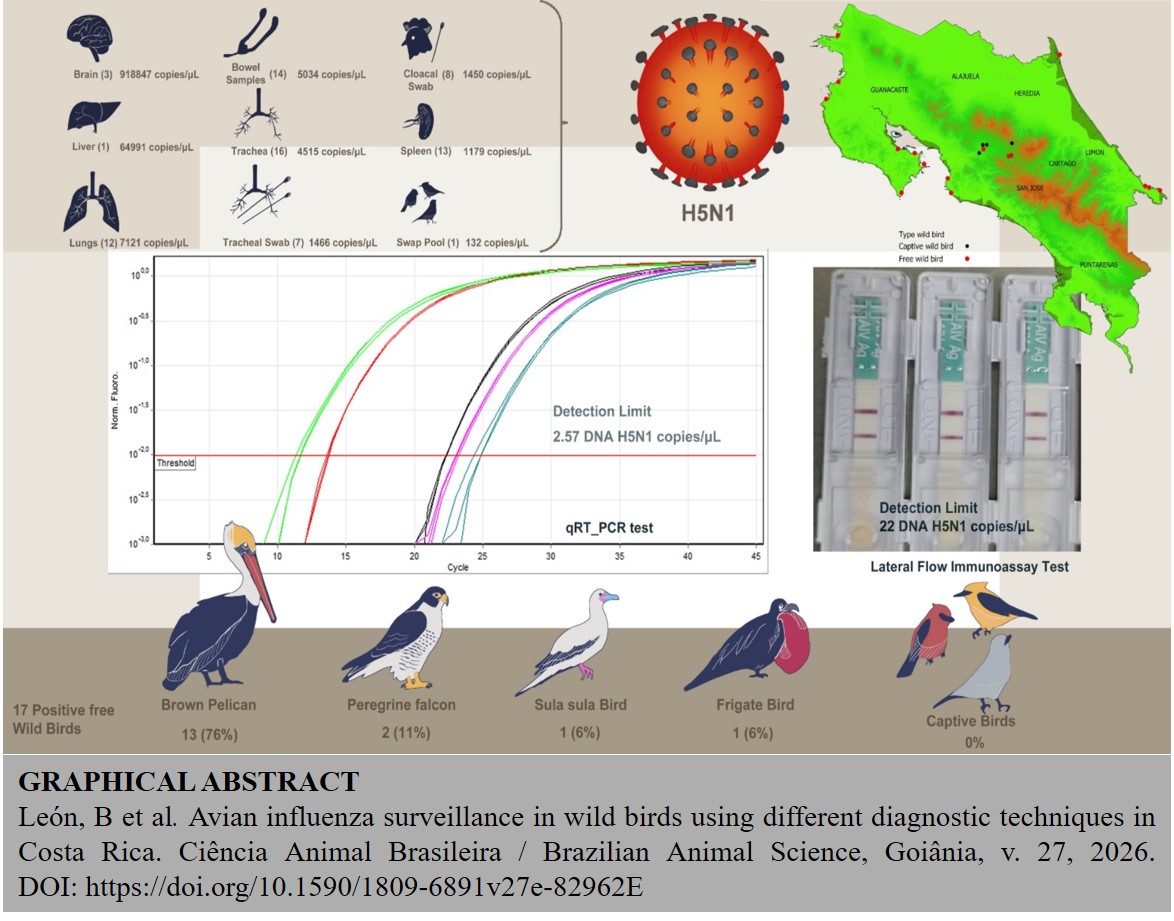
Graphical Abstract (only available in the electronic version).
Generative AI use statement
During the preparation of this manuscript, the authors used ChatGPT TOOL to assist with grammar checking. After using this tool, the authors reviewed and edited the content appropriately and assume full responsibility for the content of the publication.
Acknowledgements
We thank the SENASA staff for collecting the samples in accordance with SENASA's responsibilities as the competent authority and in support of the Epidemiology Department's programs. We also acknowledge the technical staff of the LSE laboratory for processing, by PCR, the samples that routinely arrive at the laboratory. We also thank Natalia León Vargas for creating the graphical abstract.
Data availability statement
The complete dataset supporting the results of this study are published in the article itself and in the supplementary material.
References
-
1 Hill NJ, Bishop MA, Trovão NS, Ineson KM, Schaefer AL, Puryear WB, et al. Ecological divergence of wild birds drives avian influenza spillover and global spread. PLoS Pathog. 2022;18:e1010062. Available at: https://doi.org/10.1371/journal.ppat.1010062
» https://doi.org/10.1371/journal.ppat.1010062 -
2 Venkatesh D, Poen MJ, Bestebroer TM, Scheuer RD, Vuong O, Chkhaidze M, et al. Avian influenza viruses in wild birds: virus evolution in a multihost ecosystem. J. Virol. Amer. Soc. Microbiol. 2018;92:10.1128/jvi.00433-18. Available at: https://doi.org/10.1128/jvi.00433-18
» https://doi.org/10.1128/jvi.00433-18» https://doi.org/10.1128/jvi.00433-18 -
3 Gonzalez-Reiche AS, Müller ML, Ortiz L, Cordón-Rosales C, Perez DR. Prevalence and diversity of low pathogenicity avian influenza viruses in wild birds in Guatemala, 2010-2013. Avian Dis. 2016;60:359-364. Availble at: https://doi.org/10.1637/11130-050715-Reg
» https://doi.org/10.1637/11130-050715-Reg -
4 Fujimoto Y, Usui T, Ito H, Ono E, Ito T. Susceptibility of wild passerines to subtype H5N1 highly pathogenic avian influenza viruses. Avian Pathol. J, WVPA. 2015;44:243-247. Available at: https://doi.org/10.1080/03079457.2015.1043235
» https://doi.org/10.1080/03079457.2015.1043235 -
5 Munster VJ, Baas C, Lexmond P, Waldenström J, Wallensten A, Fransson T, et al. Spatial, temporal, and species variation in prevalence of influenza A viruses in wild migratory birds. PLoS Pathog. 2007;3:e61. Available at: https://doi.org/10.1371/journal.ppat.0030061
» https://doi.org/10.1371/journal.ppat.0030061 -
6 Knight-Jones TJD, Hauser R, Matthes D, Stärk KDC. Evaluation of effectiveness and efficiency of wild bird surveillance for avian influenza. Vet. Res. 2010;41:50. Available at: https://doi.org/10.1051/vetres/2010023
» https://doi.org/10.1051/vetres/2010023 -
7 Perera CL, Díaz de Arce H, Pérez LJ. Actualización y perspectivas en el diagnóstico del virus de la influenza aviar. Rev. Salud Anim. 2011;33:01-7. Available at: https://www.produccion-animal.com.ar/produccion_aves/enfermedades_aves/112-influenza_actualizacion.pdf
» https://www.produccion-animal.com.ar/produccion_aves/enfermedades_aves/112-influenza_actualizacion.pdf -
8 Wibowo MH, Untari T, Artanto S, Putri K, Amanu S, Asmara W. Evaluation of rapid detection kit against avian influenza A virus and H5 subtype for field sample. Indones. J. Biotechnol. 2016;21:48-55. Available at: https://doi.org/10.22146/ijbiotech.26792
» https://doi.org/10.22146/ijbiotech.26792 -
9 Spackman E, Senne DA, Myers TJ, Bulaga LL, Garber LP, Perdue ML, et al. Development of a real-time reverse transcriptase PCR assay for type A influenza virus and the avian H5 and H7 hemagglutinin subtypes. J. Clin. Microbiol. 2002;40:3256-3260. Available at: https://doi.org/10.1128/JCM.40.9.3256-3260.2002
» https://doi.org/10.1128/JCM.40.9.3256-3260.2002 - 10 León B, Chaves G, Koster LG, Jenkins-Moore M, Carrillo C, Méndez D. Isolation and identification of pandemic influenza virus H1N1 / 2009 S-OIV from commercial and backyard swine in Costa Rica. Rev. Cienc. Vet. 2011;29:53-81.
-
11 Bustin SA, Mueller R. Real-time reverse transcription PCR (qRT-PCR) and its potential use in clinical diagnosis. Clin. Sci. 2005;109:365-379. Available at: https://doi.org/10.1042/CS20050086
» https://doi.org/10.1042/CS20050086 -
12 Yuan JS, Reed A, Chen F, Stewart CN. Statistical analysis of real-time PCR data. BMC Bioinform. 2006;7:85. https://doi.org/10.1186/1471-2105-7-85
» https://doi.org/10.1186/1471-2105-7-85 -
13 Nassiri M, Torshizi, ME, Ghovvati S, Doosti M. Evaluation of different statistical methods using SAS software: an in silico approach for analysis of real-time PCR data. J. Appl. Stat. 2018;45:306-319. Available at: https://doi.org/10.1080 /02664763.2016.1276890
» https://doi.org/10.1080/02664763.2016.1276890 -
14 Gall A, Hoffmann B, Harder T, Grund C, Beer M. Universal primer set for amplification and sequencing of HA0 cleavage sites of all influenza A viruses. J. Clin. Microbiol. 2008;46:2561-2567. Available at: https://doi.org/10.1128/JCM.00466-08
» https://doi.org/10.1128/JCM.00466-08 -
15 Zhou B, Donnelly ME, Scholes DT, George KS, Hatta M, Kawaoka Y, et al. Single-reaction genomic amplification accelerates sequencing and vaccine production for classical and swine origin human influenza A viruses. J. Virol. 2009;83:10309-10313. Available at: https://doi.org/10.1128/jvi.01109-09
» https://doi.org/10.1128/jvi.01109-09 -
16 Chua T-H, Ellis TM, Wong CW, Guan Y, Ge SX, Peng G, et al. Performance evaluation of five detection tests for avian influenza antigen with various avian samples. Avian Dis. 2007;51:96-105. Available at: https://DOI.org/10.1637/0005-2086(2007)051[0096:PEOFDT]2.0.CO;2
» https://DOI.org/10.1637/0005-2086(2007)051[0096:PEOFDT]2.0.CO;2 -
17 Slomka MJ, Pavlidis T, Banks J, Shell W, McNally A, Essen S, et al. Validated H5 Eurasian real-time reverse transcriptase-polymerase chain reaction and its application in H5N1 outbreaks in 2005-2006. Avian Dis. 2007;51:373- 377. Available at: https://doi.org/10.1637/7664-060906R1.1
» https://doi.org/10.1637/7664-060906R1.1 -
18 Spackman E, Pedersen JC, McKinley ET, Gelb J. Optimal specimen collection and transport methods for the detection of avian influenza virus and Newcastle disease virus. BMC Vet. Res. 2013;9:35. Available at: https://doi.org/10.1186/1746-6148-9-35
» https://doi.org/10.1186/1746-6148-9-35 -
19 McDuie F, T. Overton C, A. Lorenz A, L. Matchett E, L. Mott A, A. Mackell D, et al. Mitigating risk: predicting H5N1 avian influenza spread with an empirical model of bird movement. Transbound Emerg Dis. 2024;2024:5525298. Available at: https://doi.org/10.1155/2024/5525298
» https://doi.org/10.1155/2024/5525298 -
20 Lebarbenchon C, Sreevatsan S, Ramakrishnan MA, Poulson R, Goekjian V, Di Matteo JJ, et al. Influenza A viruses in American white pelican (Pelecanus erythrorhynchos). J. Wildl. Dis. 2010;46:1284-1289. Available at: https://doi.org/10.7589/0090-3558-46.4.1284
» https://doi.org/10.7589/0090-3558-46.4.1284 -
21 Adzic B, Goletic S, Pejoviс N, Vizi A, Yolshin N. First case of highly pathogenic avian influenza H5N1 in Montenegro. Acta Vet.-Beogr. 2024;74:145-158. Available at: https://doi.org/10.2478/acve-2024-0011
» https://doi.org/10.2478/acve-2024-0011 -
22 Alexandrou O, Malakou M, Catsadorakis G. The impact of avian influenza 2022 on Dalmatian pelicans was the worst ever wildlife disaster in Greece. Oryx. 2022;56:813-813. Available at: https://doi.org/10.1017/S0030605322001041
» https://doi.org/10.1017/S0030605322001041 -
23 Stoimenov GM, Goujgoulova GV, Nikolov B, Petrova R, Teneva A, Dimitrova I. Histopathological findings in Dalmatian pelicans (Pelecanus crispus) naturally infected with avian influenza subtype A H5N1 in Bulgaria. J. Hell. Vet. Med. Soc. 2018;68:369-376. Available at: https://doi.org/10.12681/jhvms.15493
» https://doi.org/10.12681/jhvms.15493 -
24 Cardona CJ, Xing Z, Sandrock CE, Davis CE. Avian influenza in birds and mammals. Comp. Immunol. Microbiol. Infect. Dis. 2009;32:255-273. Available at: https://doi.org/10.1016/j.cimid.2008.01.001
» https://doi.org/10.1016/j.cimid.2008.01.001 -
25 Lara Rivera DA. Determinación de anticuerpos circulantes contra el virus de influenza aviar en aves del Centro de Rehabilitación de Vida Silvestre ARCAS, Flores, Petén, Guatemala. [Thesis]: Guatemala: Universidad de San Carlos; 2008. Available at: http://www.repositorio.usac.edu.gt/7406/
» http://www.repositorio.usac.edu.gt/7406/ -
26 Neu Toscano AE. Determinación de anticuerpos circulantes contra el virus de influenza aviar en aves del Parque Zoológico Minerva de Quetzaltenango, Guatemala. [Thesis]: Guatemala: Universidad de San Carlos; 2016. Available at: http://biblioteca.usac.edu.gt/tesis/10/10_1589.pdf
» http://biblioteca.usac.edu.gt/tesis/10/10_1589.pdf -
27 Slusher MJ, Wilcox BR, Lutrell MP, Poulson RL, Brown JD, Yabsley MJ, et al. Are passerinae bords reservoirs for influenza A viruses? J. Wildl. Dis. 2014;50:792-809. Available at: https://doi.org/10.7589/2014-02-043
» https://doi.org/10.7589/2014-02-043 -
28 Brown JD, Berghaus RD, Costa TP, Poulson R, Carter DL, Lebarbenchon C, et al. Intestinal excretion of a wild bird-origin H3N8 low pathogenic avian influenza virus in mallards (Anas platyrhynchos). J. Wildl. Dis. 2012;48:991-998. Available at: https://doi.org/10.7589/2011-09-280
» https://doi.org/10.7589/2011-09-280 -
29 Swayne DE, Slemons RD. Using mean infectious dose of highand low-pathogenicity avian influenza viruses originating from wild duck and poultry as one measure of infectivity and adaptation to poultry. Avian Dis. 2008;52:455- 460. Available at: https://doi.org/10.1637/8229-012508-Reg.1
» https://doi.org/10.1637/8229-012508-Reg.1
Edited by
-
Editor:
Luiz Augusto B. Brito