 Assessing the performance stability of new CMS lines through AMMI and GGE methods in sunflower
Abstract
This study evaluated the stability of 21 CMS lines of sunflower across six environmental conditions. The genotype × environment interaction component accounted for the largest proportion of variation in seed yield, oil content, and other morphological traits. The first two interaction principal components accounted for the majority of variation, explaining days to 50% flowering (94.8%), days to maturity (90.7%), seed yield per plant (89.7%) and oil content (88.6%). The GGE biplot indicated that NDLA 21 for seed yield per plant and NDLA 6, NDLA 13 and NDLA 19 for oil content performed above average across the testing environments. The E3 and E5 environments are relatively discriminating for identifying stable lines in the study. Considering all the quantitative traits, the NDLA 21, NDLA 9, NDLA 17, NDLA 22, NDLA 5 and NDLA 20 CMS lines were identified as stable and can be used in the development of potential hybrids in sunflower.
Keywords:
CMS line × Environment interaction; AMMI; GGE; G × E; stability
INTRODUCTION
Sunflower is a versatile oilseed crop primarily cultivated in countries such as Russia, Ukraine, the European Union, Argentina and Turkey. According to USDA data, the global sunflower cultivation area in 2024-25 was estimated at about 28.30 million hectares. Global sunflower production for that period was projected at around 51.9 million metric tons (www.fas.usda.gov). Sunflower is currently cultivated in India over an area of 0.15 million hectares, with a production of 1.47 lakh tons and a mean productivity of 980 kg ha⁻¹ (www.indiastat.com). Moreover, sunflower is the fourth most important oilseed crop in India, following soybean, mustard and groundnut. Increasing the productivity of the crop remains a primary challenge in any breeding program. Sunflower crop improvement through breeding is challenging due to their self-incompatibility and outcrossing nature (Reddy et al. 2024).
The benefits of heterosis breeding in sunflower were realized with the earliest discovery of a cytoplasmic male sterility (CMS) source from the interspecific cross Helianthus petiolaris × Helianthus annuus, coupled with the identification of corresponding fertility restorers. Using PET cytoplasm-based CMS lines to exploit heterosis has led to develop commercially successful sunflower hybrids. However, over-reliance on a limited number of available CMS lines has narrowed the genetic base, increased the likelihood of genetic vulnerability and reduced adaptive potential. Thus, it is vital to develop new parental lines using suitable breeding strategies to overcome these limitations. Accomplishing heterosis breeding largely relies on identifying parental combinations which maximize the hybrid vigour for seed yield, oil content and yield attributing traits.
Sunflower productivity primarily depends on the consistent performance of hybrids and their CMS lines in varying environmental conditions. Moreover, the genotype × environment (G × E) interaction is a crucial factor arising from uncontrolled variations across locations, seasons and years (Guedes et al. 2025). Therefore, assessment of the stability of CMS lines enables detecting desirable genotypes, offering an effective approach to exploit heterosis in sunflower. Although many models have been developed to study G × E interactions, multivariate approaches such as Additive Main Effects and Multiplicative Interaction (AMMI) and Genotype plus Genotype × Environment interaction (GGE) are among the most effective for visualizing the influence of G × E interactions (Kurt 2023). Several studies have utilized AMMI and GGE methods to identify stable CMS-based hybrids in crops such as rice (John et al. 2025), pearl millet (Sagar et al. 2024) and sunflower (Reddy et al. 2025). Unlike previous studies primarily focusing on hybrids, the present study emphasizes the stability of CMS parental lines, which are the foundation of heterosis breeding, thereby providing a strategic advantage for hybrid development. However, only a limited number of studies have focused on a stability analysis of CMS lines for exploiting hybrid vigour in sunflower. Therefore, this study was primarily aimed at identifying stable CMS lines for seed yield, oil content and other key morphological traits in varying environmental conditions by assessing G × E interaction effects using AMMI and GGE biplot analyses.
MATERIAL AND METHODS
Plant material and field experiment
This study evaluated 22 CMS lines, including 21 newly developed lines derived from indigenous germplasm at the Regional Agricultural Research Station, Nandyal, India, along with one control comparator, NDCMS 30A (Table S1). The study was undertaken over three Rabi seasons 2022-23 (E1), 2023-24 (E2) and 2024-25 (E3) at Regional Agricultural Research Station, Nandyal, India and 2022-23 (E4), 2023-24 (E5) and 2024-25 (E6) at the Agricultural Research Station, Utukur, Kadapa, India. Nandyal is located at 15° 28’ N latitude and 78° 28’ E longitude from an altitude of 211.76 m above mean sea level and has a black soil (vertisols) type with a deep and cracking clay texture. Utukur is located at 14.43° N latitude, 78.80° E longitude, and at an altitude of 150 m above mean sea level and has a red sandy loam (Alfisols) soil type with moderate soil depth. The seasonal average maximum and minimum temperature, relative humidity and total precipitation during the experimental years in both locations are presented in Table S2. The 21 CMS lines, their corresponding maintainer lines and the check CMS line were evaluated for stability across environments using a randomized complete block design with three replications and a plot size of 5.4 m².
Trait measurement
Morphological data were recorded on five plants selected randomly per CMS line in all replications, except for days to 50% flowering and days to maturity, which were measured on a plot basis. Oil content (%) was determined using a Nuclear Magnetic Resonance (NMR) Spectrometer at ICAR-Indian Institute of Oilseeds Research, Hyderabad, on randomly selected samples of cleaned and dried seeds from each entry.
Statistical analysis
The collected data were analyzed using a combined analysis of variance in R software with the ‘agricolae’ package (Shitta et al. 2022). The performance of CMS lines across environments was evaluated using multivariate analyses, specifically the AMMI model and the GGE model implemented through the ‘metan’ package.
The AMMI analysis utilized the following model to estimate the performance of CMS lines across six environments (Gauch et al. 1992):
in which: Yij = yield of the ith genotype in jth environment; µ = overall mean; gi = effect of ith genotype; ej = effect of jth environment; λn = singular value of the nth axis in the PCA; ϒin = eigen vector of ith genotype for the nth axis; δjn = eigen vector of jth environment for the nth axis; ρij = AMMI residual; ϵij = error effect.
The GGE biplot analysis utilized the following model to estimate the performance of CMS lines across six environments (Yan et al. 2001):
in which: Yij = yield of ith genotype in the jth environment; µ = grand mean; βj = main effect of environment j; λ1 and λ2 = singular values for the first and second principal components (PC1 and PC2); ξi1 and ξi2 = eigen vectors of genotype i for PC1 and PC2, respectively; ηj1 and ηj2 = eigen vectors of environment j for PC1 and PC2, respectively; ϵij = residual error.
RESULTS AND DISCUSSION
Stability analysis
Analysis of variance
Significant differences among the CMS lines for both morphological and yield-related traits were observed, as indicated by the least significant difference (LSD) test (Table S3). The pooled ANOVA results showed that genotype (G), environment (E) and G × E interaction significantly contributed to all the studied traits (Table 1). Furthermore, the largest portion of variation was attributed to the G × E interaction, followed by genotype and environmental contribution for all the traits except for days to 50% flowering and days to maturity. This could be attributed to the differential performance of CMS lines across testing environmental conditions, leading to changes in the magnitude, ranking, and stability of traits (Giang et al. 2024). This underscores the need for stability analysis in the study. The variance analysis using the AMMI model indicated that IPCA I and IPCA II were found to be significant for all the measured traits. The IPCA I accounted for the largest proportion of variation in oil content (73.2%), followed by days to 50% flowering (65.4%) and days to maturity (62.8%). The IPCA II accounted for the highest proportion of variation in days to 50% flowering (29.4%), 100-seed weight (29.2%), plant height (28.7%) and seed yield per plant (28.7%). Together, IPCA I and IPCA II explained the largest cumulative variation for days to 50% flowering (94.8%), followed by days to maturity (90.7%), seed yield per plant (89.7%) and oil content (88.6%). This supports earlier findings that the first two interaction principal components are adequate for identifying stable and widely adapted genotypes (Mukri et al. 2024).
Stability analysis by AMMI model
The mean values and IPCA scores for the recorded quantitative traits in sunflower CMS lines are depicted in Tables 2 and 3. The AMMI biplot 1 showed that the lines: NDLA 13, NDLA 6, and NDLA 3 for days to 50 % flowering; NDLA 12 for days to maturity; NDLA 21 for plant height; NDLA 4 and NDLA 17 for head diameter; NDLA 16, NDLA 10 and NDLA 17 for 100-seed weight; NDLA 13, NDLA 21 and NDLA 19 for oil content; and NDLA 22, NDLA 13 and NDLA 5 for seed yield per plant exhibited high mean values with IPCA scores near zero, indicating stability across the tested environments for these traits.
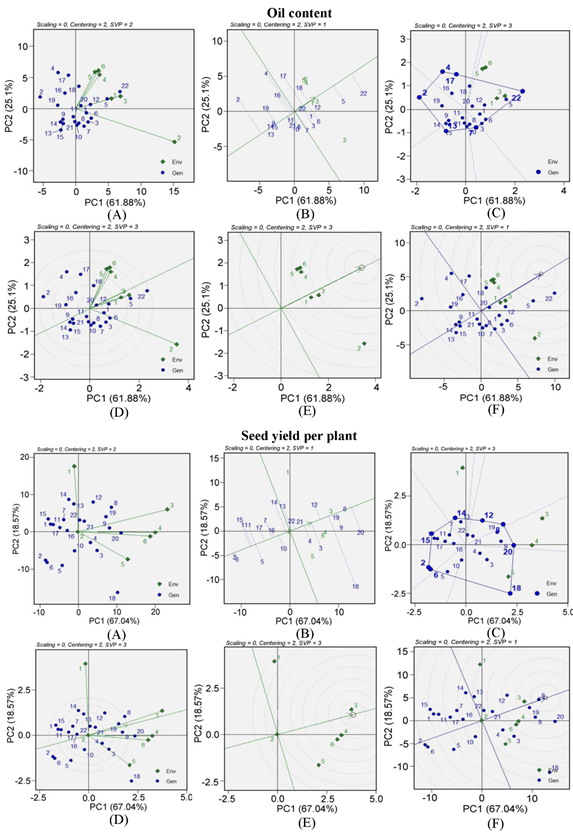
GGE biplots for oil content and seed yield per plant. A. Genotypic view of biplot; B. Mean vs Stability; C. Which-won-where biplot; D. Discriminativeness vs representativeness; E. Ranking environments; F. Ranking genotypes.
In turn, the AMMI biplot 2 indicated that the lines: NDLA 19, NDLA 6 and NDLA 3 for days to 50% flowering; NDLA 12, NDLA 8, NDLA 19 and NDLA 4 for days to maturity; NDLA 11, NDLA 3, NDLA 21 and NDLA 16 for plant height; NDLA 8, NDLA 11 and NDLA 12 for head diameter; NDLA 14, NDLA 4, NDLA 20, NDLA 9 and NDLA 10 for 100-seed weight; NDLA 13, NDLA 10, NDLA 16, NDLA 15, NDLA 8 and NDLA 21 for oil content; and NDLA 8, NDLA 16, NDLA 18 and NDLA 11 for seed yield per plant had IPCA values close to zero, indicating minimal interaction with the different testing environments. However, the NDLA 8, NDLA 16, NDLA 18 and NDLA 11 lines recorded lower mean seed yield per plant (<25 g). This distinction is critical, as selection based solely on stability may lead to inclusion of genotypes with suboptimal yield potential (Kumar et al. 2024). It further indicates that certain CMS lines maintain greater buffering capacity and exhibit reduced response to fluctuations across the testing environmental conditions.
Stability analysis by the GGE model
In the present study, the findings of the GGE analysis were consolidated into six biplots. The biplot analyses, including genotypic view, mean vs. stability, which-won-where pattern, discriminativeness vs. representativeness, and ranking of environments and genotypes, are presented for days to 50% flowering, days to maturity, plant height, head diameter and 100-seed weight in Figs. S1, S2 and S3, whereas the corresponding analyses for oil content and seed yield per plant are shown in Fig. 1. Thus, the CMS lines: NDLA 9, NDLA 12, NDLA 14 and NDLA 16 for days to 50% flowering; NDLA 8, NDLA 9, NDLA 12, NDLA 14 and NDLA 16 for days to maturity; NDLA 5 and NDLA 21 for plant height; NDLA 6, NDLA 17 and NDLA 19 for head diameter; NDLA 3, NDLA 10 and NDLA 18 for 100-seed weight; NDLA 6, NDLA 13 and NDLA 19 for oil content; and NDLA 21 for seed yield per plant performed above average across the six tested environments. This variation in performance of CMS lines may be due to differences in factors such as temperature, relative humidity, rainfall, and soil type, which can significantly impact growth and development (Yathish et al. 2024). Furthermore, the presence of trait-specific superior genotypes also indicates the possibility of selecting parental lines tailored for targeted trait improvement rather than relying on a single genotype for all traits. Therefore, simultaneous consideration of mean performance and stability is crucial to identify truly superior genotypes, as also suggested by Yan et al. (2023).
The mean performance and stability of the CMS lines for recorded quantitative traits indicated that the Average Environmental Coordination (AEC) line, passing through the origin, reflects higher mean performance across the tested environmental conditions. Considering the AEC line, the CMS lines: NDLA 6, NDLA 9, NDLA 14, NDLA 15 and NDLA 17 for days to 50% flowering; NDLA 8, NDLA 9, NDLA 12 and NDLA 16 for days to maturity; NDLA 21 for plant height; NDLA 4, NDLA 5, NDLA 14, NDLA 17 and NDLA 18 for head diameter; NDLA 5, NDLA 10 and NDLA 22 for 100-seed weight; NDLA 12, NDLA 13 and NDLA 21 for oil content; and NDLA 9, NDLA 20, NDLA 21 and NDLA 22 for seed yield per plant exhibited high mean values with minimal variation across the tested environmental conditions. This stability of CMS lines may be due to the predominance of additive genetic effects, physiological mechanisms which ensure efficient resource utilization and uniform expression across diverse environments (Singh et al. 2024). The identification of CMS lines such as NDLA 9, NDLA 21, and NDLA 22 for seed yield per plant, along with stable performers for key component traits, underscores their potential as elite parental lines and dependable genetic resources for developing high-yielding and widely adaptable sunflower hybrids.
The GGE biplot “which-won-where” analysis revealed that: NDLA 16 (E3, E4, E5, E6) for days to 50% flowering and days to maturity; NDLA 5, NDLA 9 and NDLA 17 (E1, E4, E5, E6) for plant height; NDLA 19 and NDLA 22 (E1, E3, E4, E6) for head diameter; NDLA 6 and NDLA 10 (E3, E4, E5, E6) for 100-seed weight; and NDLA 19 and NDLA 21 (E4, E5, E6) for seed yield per plant were the top-performing CMS lines across environments. The control comparator NDCMS 30A (E1, E3, E4, E5, E6) and NDLA 8 (E2) were identified as the best performers for oil content. The superiority of CMS lines such as NDLA 16 and NDLA 19 across environments indicates their broad adaptability and stability for hybrid development, whereas the environment-specific performance of NDLA 8 for oil content highlights the importance of targeted breeding strategies for quality traits under specific agro-climatic conditions. The presence of distinct winning genotypes across different biplot sectors indicates crossover interactions, highlighting that CMS line performance varies across environments and emphasizing the need for multi-environment evaluation to reliably identify superior genotypes (Reddy et al. 2025).
The influence of different testing environments on the recorded quantitative traits indicated that the E3, E4, E5 and E6 environments for days to 50% flowering, days to maturity and 100-seed weight; E1, E3, E4, E5 and E6 for oil content; and E4, E5 and E6 for seed yield per plant exhibited a correlation among the testing environmental conditions. The trait plant height showed correlations among the E1, E4, E5 and E6 conditions, as well as between E2 and E3. Additionally, the trait head diameter exhibited correlations among the E1, E3, E4 and E6 conditions, as well as between E2 and E5. The clustering pattern indicates that E4, E5, and E6 are highly correlated and stable environments, suitable for future multi-location trials, which can be grouped into a single mega-environment, thereby eliminating redundant testing sites and improving evaluation efficiency. The present findings underscore the importance of selecting suitable test environments in crop breeding programs that can effectively differentiate among genotypes (Moura et al. 2026).
The analysis of representativeness showed that E5 (days to 50% flowering and plant height), E3 (days to maturity, oil content, and seed yield per plant), E6 (head diameter), and E4 (100-seed weight) formed small acute angles with the AEC line, indicating that these environments are representative for their respective traits. The E3 and E5 conditions are the most discriminative and can therefore be used to identify the most adaptable and stable CMS lines. The variation in representative environments across traits suggests that phenological traits are mainly influenced by thermal time and photoperiod sensitivity, while yield and oil-related traits are driven by moisture, radiation, and nutrient dynamics, highlighting the need for multi-trait and multi-environment evaluation in sunflower breeding programs (Reis et al. 2025).
The E3, E4, E5 and E6 environments together constituted one mega-environment for the days to 50% flowering, days to maturity and 100-seed weight traits, while E1 and E2 each formed separate mega-environments. Additionally, the E1, E4, E5 and E6 conditions formed a single mega-environment for plant height, while E2 and E3 each constituted separate mega-environments. Similarly, E1, E3, E4 and E6 formed one mega-environment for head diameter, while E2 and E5 each constituted separate mega-environments. In turn, E1, E3, E4, E5 and E6 are grouped into a single mega-environment for oil content, with E2 forming a separate one. Next, E4, E5 and E6 formed one mega-environment for seed yield per plant, whereas E1, E2 and E3 each emerged as distinct mega-environments in the study. Grouping of the E3, E4, E5, and E6 environments suggests similar agro-ecological conditions and genotype responses, while the distinct separation of E2 indicates its unique environmental influence and differential selective pressure on trait expression. Overall, environments such as E3 and E5 were relatively discriminating conditions for identifying stable and highly adaptable CMS lines across the majority of quantitative traits evaluated in the study (Singh et al. 2025).
The ranking of the CMS lines based on the ideal view point of GGE biplot was in the order of: NDLA 14 > NDLA 9 > NDLA 15 > NDLA 17 and others for days to 50% flowering; NDLA 9 > NDLA 16 > NDLA 12 > NDLA 14 and others for days to maturity; NDLA 21 > NDLA 20 > NDLA 7 and others for plant height; NDLA 17 > NDLA 5 > NDLA 4 > NDLA 18 and others for head diameter; NDLA 10 > NDLA 22 > NDLA 5 > NDLA 17 and others for 100 seed weight; NDLA 21 > NDLA 13 > NDLA 12 > NDLA 6 and others for oil content; and NDLA 9 > NDLA 20 > NDLA 22 > NDLA 21 and others for seed yield per plant.
The selection of CMS lines exhibiting high seed yield per plant is fundamental for developing stable and high-yielding sunflower hybrids (Aboye and Edo 2024). The strong positive association of seed yield with 100-seed weight and head diameter suggests that these traits can serve as reliable indirect selection criteria in breeding programs. Conversely, the weak or negative association between oil content and seed yield suggests a potential trade-off, underscoring the need for balanced selection strategies to achieve both yield and quality improvements. The consistency of these trait relationships across environments further underlines their significance in guiding effective selection decisions. Moreover, although the CMS lines demonstrated stable per se performance, their utility in hybrid development depends on a comprehensive evaluation of combining ability and fertility restoration behaviour to ensure the successful exploitation of heterosis (Das et al. 2021). However, the study is limited to locations and seasons, and so further validation across diverse agro-climatic zones may be needed.
CONCLUSION
The present study examined the G × E interaction, the stability of CMS lines, as well as the discriminating power and representativeness of the testing environments. The GGE biplot model proved effective for graphically visualizing the G × E interaction and for identifying stable, high-performing CMS lines. Among the evaluated CMS lines, NDLA 9, NDLA 20, NDLA 22 and NDLA 21 showed greater stability for seed yield per plant, while NDLA 21, NDLA 13, NDLA 12 and NDLA 6 were more stable for oil content across the tested environments and can be utilized in breeding programs aimed at improving specific phenotypes. The E3 and E5 environments were relatively discriminating and representative and can therefore be used to identify promising CMS lines with high yield and adaptability. Furthermore, the study highlights that CMS lines exhibit stable per se performance. However, it is essential to further evaluate their combining ability and fertility restoration behaviour to effectively develop heterotic hybrids in sunflower.
ACKNOWLEDGEMENTS
We acknowledge Acharya N G Ranga Agricultural University, Andhra Pradesh, India and All India Coordinated Research Project on Sunflower, Hyderabad, India for supporting this study.
Data Availability Statement
The supplementary file and datasets used and analyzed during the current study are available from the corresponding author upon reasonable request.
REFERENCES
- Aboye BM, Edo MA2024 Exploring genotype by environment interaction in sunflower using genotype plus genotype by environment interaction (GGE) and best linear unbiased prediction (BLUP) approachesDiscover Applied Sciences 6:431-447
- Das AK, Choudhary M, Kumar P, Karjagi Chikkappa GK, Yathish KR, Kumar Kumar, Rakshit S2021 Heterosis in genomic era: advances in the molecular understanding and techniques for rapid exploitationCritical Reviews in Plant Sciences 40:218-242
- Gauch HJ1992 Statistical analysis of regional yield data: AMMI analysis of factorial designs. Elsevier, Amesterdam, 278p.
- Giang T, Ha CD, Giang D, Khanh TD, Van Loc N, Tuan NT2024 Genotype by environment (G × E) interaction and stability for seed yield of newly developed mung bean genotypesAustralian Journal of Crop Science 18:226-231
- Guedes LDS, Sousa MB, Oliveira EJD2025 Genotype× Environment interaction and correlations between agronomic traits, flowering, and fruit set in cassavaHorticulturae 11:648
- John BA, Ramaswamy S, Swaminathan M, Dharmalingam K, Mahalingam G, Raman P, Jegadeesan R2025 Comparative analysis of stability models for identifying rice inter-subspecific breeding lines adapted to different temperature regimes for exploitation in hybrid breedingBMC Plant Biology 25:563-584
- Kumar R, Kumar S, Das AK, Dhonde S, Kaur Y, Kumar S, Shukla S, Rakshit S2024 Unveiling genotype × environment dynamics for grain yield in QPM hybrids through AMMI, GGE Biplot, and MTSI approachIndian Journal of Genetics and Plant Breeding 84:449-460
- Kurt D2023 Adaptability and stability models in promising genotype selection for hybrid breeding of sun cured tobaccoSouth African Journal of Botany 154:190-202
- Moura R, Miranda RN, Casagrande CR, Muniz FRS, Nalin RS, Conde BT2026 Comparison of methodologies (REML/BLUP vs. GGE Biplot) for soybean selection in the Brazilian CerradoCrop Breeding and Applied Biotechnology 26:e538426111
- Mukri G, Gowtham KV, Gadag RN, Sen R, Kumar S, Swain D, Singh KK, Shilpa K, Prabha C, Bhat JS2024 A combination of analytical methods dissects genotype × environment interaction precisely and facilitates the selection of potential new field corn (Zea mays L.) hybridsIndian Journal of Genetics and Plant Breeding 84:336-345
- Reddy BVRP, Amarnath K, Reddy BC, Reddy YPK, Ramanamma KV, Niharika P, Johnson M2025 Stability and performance analysis of seed yield and component traits in sunflower using AMMI and GGE biplotsElectronic Journal of Plant Breeding 16:344-352
- Reddy BVRP, Amarnath K, Reddy BC, Venkataramanamma K, Prabhakar K, Venkateswarlu NC2024 Discerning genetic diversity among sunflower germplasm accessions through multivariate analysisElectronic Journal of Plant Breeding 15:194-200
- Reis AAR, Botelho CE, Nadaleti DHS, Figueiredo OJD, Botelho TT, Gonçalves FMA, Carvalho AM, Andrade VT, Figueiredo VC, Abrahão JCDR2025 GGE Biplot for integrating agronomic and sensory attributes in coffee cultivar selectionCrop Breeding and Applied Biotechnology 25:e532525314
- Sagar, Dilbagh, Jangid K, Sanadya SK, Chaurasia H and Shivran A2024 Stability analysis of male sterile-derived pearl millet (Pennisetum glaucum) hybrids under variable growing conditionIndian Journal of Agricultural Sciences 94:719-725
- Shitta NS, Unachukwu N, Edemodu AC, Abebe AT, Oselebe HO, Abtew WG2022 Genetic diversity and population structure of an African yam bean (Sphenostylis stenocarpa) collection from IITA GenBankScientific Reports 12:4437
- Singh SB, Kumar S, Kumar R, Kumar P, Yathish KR, Jat BS, Chikkappa GK, Kumar B, Jat SL, Dagla MC, Kumar B, Kumar A, Kasana RK, Kumar S2024 Stability analysis of promising winter maize (Zea mays L.) hybrids tested across Bihar using GGE biplot and AMMI model approachIndian Journal of Genetics and Plant Breeding 84:73-80
- Singh V, Rana A, Kapoor S, Sood R, Kumari S, Sharma S, Kumar N, Singh IP, Katna G2025 Multi-environment evaluation and identification of Tartary buckwheat (Fagopyrum tataricum Gaertn.) genotypes for superior agronomic and nutritional potential in the North-Western HimalayasScientific Reports 15:30900
- Yan W, Cornelius PL, Crossa J, Hunt LA2001 Two types of GGE biplots for analyzing multi‐environment trial dataCrop Science 41:656-663
- Yan W, Nilsen KT, Beattie A2023 Mega‐environment analysis and breeding for specific adaptationCrop Science 63:480-494
- Yathish KR, Kumar S, Rao TV, Kumar P, Karthik M, Das AK, Chickkappa GK, Singh P, Mahantha SK, Sekhar JC, Bhushan B, Jat BS, Rakshit S2024 GGE biplot and AMMI analysis for stability and adaptability of dual-purpose maize hybrids tested across multi-environments for baby corn and fodder yieldRange Management and Agroforestry 45:49-56
Edited by
-
SCIENTIFIC EDITOR:
Luiz Antônio dos Santos Dias