 Selection of pecan (Carya illinoinensis) genotypes using GMDA: Software for genetic and morphometric data analyses
Abstract
In Brazil, pecan orchards are dominated by a few cultivars, highlighting the need to develop genotypes better adapted to the country's specific conditions. Old, seed-derived pecan genotypes harbor significant genetic variability and may represent an important source of desirable traits for breeding. The selection of promising genotypes should be based on a combination of genetic and morphometric data. This study reports the evaluation of pecan genotypes using data from SSR markers and nut morphometric traits. It also introduces GMDA, software designed to support germplasm characterization and selection. Results revealed high allelic diversity (A = 12.3) but low genetic diversity (Ho = 0.29) among genotypes. Fruit size and shell proportion were the main traits differentiating the genotypes. Nine genotypes were identified as having potential for registration as new cultivars. By integrating and correlating genetic and morphometric analyses within a single platform, GMDA arises as an effective tool supporting breeding and conservation.
Keywords:
Data analysis; genetic breeding; germplasm conservation; Carya illinoinensis
INTRODUCTION
Plant breeding and conservation efforts rely on the genetic variation found in germplasm collections worldwide (Egan et al. 2022), and the efficient use of accessions from germplasm banks depends on accurate genetic and morphological information. Besides stable traits, high genetic diversity is essential for these collections to support plant breeding and conservation (Swarup et al. 2021, Salgotra and Chauhan 2023). Consequently, assessing morphological and genetic variability among genotypes intended for use in these initiatives is a fundamental step (Oliveira et al. 2023). While morphological traits are traditionally used for selecting commercially important genotypes, molecular genetic markers have significantly boosted the ability to assess both neutral evolutionary processes and gene-associated characteristics. The integration of such genetic information with morphometric measurements improves progress in the selection and development of new cultivars within agronomic species, as well as in the conservation of plant germplasm.
Pecan [Carya illinoinensis(Wangenh.) K. Koch] is a fruit crop species native to the United States of America and Mexico and is cultivated in several countries worldwide. This species was introduced to Brazil in the 1870s, with commercial cultivation increasing in the South region from the 1950s onwards (Oliveira et al. 2023). In agricultural practice, the dominance of a few selected cultivars planted in each country is common. In Brazil, 'Barton' is the predominantly planted cultivar, present in nearly 97% of pecan orchards (Martins et al. 2023). Such reduced germplasm diversity leads to a genetic bottleneck, limiting breeding progress and increasing susceptibility to pests, diseases, and environmental stressors. Currently, several old seed-derived pecan genotypes are maintained without commercial purposes on some Brazilian farms and in gardens around farmers' houses (Poletto et al. 2020). These genotypes lack information about the paternal (pollen donor) and maternal (seed parent) cultivars from which they originated. However, they carry important genetic variability (Oliveira et al. 2023) and may serve as a crucial source of genetic traits for breeding this species. Indeed, morphometric and chemical evaluations of these old genotypes indicate that the observed variation among samples has a primarily genetic origin, suggesting high potential for breeding (Poletto et al. 2020).
Pecan genetic improvement has been undertaken in several countries where this fruit species is cultivated outside its natural occurrence area. Such initiatives aim to develop cultivars adapted to local edaphoclimatic conditions and address the needs of the productive chains (Oliveira et al. 2023). In Brazil, several advances in the cultivation and management of pecan orchards have been reported (Poletto et al. 2014, Oliveira et al. 2023). However, initiatives for the development of new cultivars remain in their early stages, although the need for such efforts is a matter of consensus. Germplasm banks intended for pecan breeding are rare in Brazil; consequently, plant material is typically selected from variants randomly identified within commercial orchards. Furthermore, the analyses of genetic and morphometric data require the use of different software, which often lacks data integration. In this study, we evaluated a dataset of selected pecan genotypes based on neutral molecular genetic variability and morphological traits of nuts using GMDA, a novel software for Genetic and Morphometric Data Analysis, intended for characterizing germplasm collections for plant breeding and conservation. With this approach, we aimed to assess the applicability of the GMDA software for characterizing germplasm collections and to evaluate the potential of these pecan genotypes to serve as a core collection for the species' breeding.
MATERIAL AND METHODS
Genetic and morphometric analyses of the query genotypes
Eighteen pecan genotypes maintained on farms and in home gardens in the state of Rio Grande do Sul, southern Brazil, were selected from a group of 60 old seed-derived genotypes previously characterized for morphological traits, chemical properties, and AFLP genetic relationships (Poletto et al. 2020). The sampling area encompasses two mesoclimatic regions: the humid subtropical and the oceanic temperate climates (Kuinchtner and Buriol 2001), with a predominance of Argisols, Chernozems, and Neosols (EMBRAPA 2018).
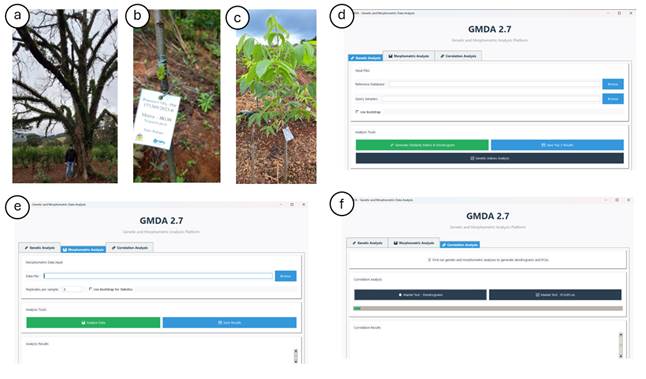
These 18 genotypes were selected based on field observation (Figure 1a) of traits with potential for genetic breeding. Genotypes exhibiting desirable nut shape, size, and quality, as well as potential resistance to pecan diseases (e.g., anthracnose and scab), were chosen to establish a core collection for the genetic improvement of the species. These selected genotypes were sampled and propagated by grafting (Figures 1b and 1c) to establish a germplasm bank for pecan breeding studies in Brazil. The germplasm bank was established in the municipality of São Gabriel, Rio Grande do Sul, an area characterized by a humid subtropical climate and Argisol soil.
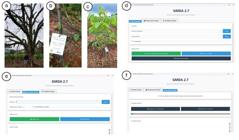
Overview of the evaluated genotypes and GMDA software. (a) Evaluation and selection of pecan genotypes for the germplasm bank establishment. (b) Grafting of the pecan’s query genotype BG30, selected based on morpho-physiological traits. (c) Pecan’s query genotype BG30, 60 days after grafting. (d) GUI interface of the Genetic Analysis module within GMDA 2.7. (e) GUI interface of the Morphometric Analysis module within GMDA 2.7. (f) GUI interface of the Correlation Analysis module within GMDA 2.7.
GMDA was used to evaluate the genetic similarity of the 18 query genotypes to 71 reference cultivars based on genotype patterns from nuclear SSR markers. The reference database includes 70 certified pecan cultivars obtained from the USDA-ARS National Collection of Genetic Resources for Pecans and Hickories (College Station and Brownwood, Texas) and one Brazilian cultivar, which was obtained through selection among uncharacterized pecan genotypes introduced to Brazil during the 1970s.
Genetic patterns of reference and query genotypes were obtained through PCR amplification of 10 nuclear SSR markers (pm-cin4, pm-ca10, pm-cin13, pm-cin20, pm-cin22, pm-ga23, pm-cin27, pm-ga38, pm-ga39, and pm-ga41; Grauke et al. 2003). These 10 SSR markers were selected based on the polymorphism reported in previous studies (Grauke et al. 2011, Zhang et al. 2020) and our prior screening of markers for cultivar certification of pecan in Brazil (Poletto et al. 2024).
Leaf samples collected from the germplasm bank were placed in individual flasks containing a 1% polyvinylpyrrolidone (PVP) solution and stored at 4 °C for up to 60 minutes until DNA isolation. Total DNA was isolated from leaf tissues using the CTAB method (Doyle and Doyle 1987). SSR markers were amplified using the fluorescently labeled M13 tail method (Schuelke 2000), as described by Nagel et al. (2023). Amplified alleles were resolved through capillary electrophoresis on an ABI 3500xL Genetic Analyzer (ThermoFisher Scientific, Waltham, USA). The alleles were scored using GeneMapper software (ThermoFisher Scientific, Waltham, USA) and manually verified to identify and correct potentially mismarked peaks.
Morphometric analysis was performed by measuring 11 traits of the nuts from the query genotypes (Table 1). Details of the trait measurements are described elsewhere (Poletto et al. 2020). All measurements were performed on 20 nuts of each selected query genotype. Data from all 20 replicates were used as input for GMDA. Length and diameter measurements were performed using a digital caliper with 0.01 mm resolution (Digimess, São Paulo, Brazil), and weight measurements were performed using a digital scale with 0.001 g precision (BEL Engineering, Monza, Italy).
GMDA software features
GMDA is a Python-based software with a graphical user interface (GUI; Figures 1d-f) that facilitates the straightforward execution of graphical and statistical analyses on genetic and morphometric data. For genetic data from codominant nuclear markers (Figure 1d), GMDA employs the principle underlying CertiBase (Poletto et al. 2024), enabling comparisons between reference and query genotypes of any species. If genetic data from both reference and query genotypes are loaded, GMDA estimates the pairwise similarity across all genotypes (i.e., references and queries), generating a UPGMA dendrogram and a list of the Top 3 most similar reference cultivars to each query sample. For the query samples alone, GMDA estimates multilocus basic genetic parameters [total number of alleles (A) and the genetic diversity, measured as the observed heterozygosity (Ho) for each query genotype; and at the population level, it estimates A, Ho, effective number of alleles (Ae), expected heterozygosity (He), and the fixation index (F)]. It also generates a UPGMA dendrogram and a PCoA graphic based on the estimated genetic similarity.
Genetic similarity is determined using an index that accounts for the size of the alleles at each locus. This algorithm, first implemented in the CertiBase platform (Poletto et al. 2024), compares each query genotype to all reference genotypes in the database, estimating the genetic similarity through the mean absolute percentage error of alleles at each locus as
,
where q and r are the allele sizes, in base pairs, of the query genotype and the reference genotype, respectively, and N is the number of loci. The max function constrains S mape estimates to the interval [0.0, 1.0], preventing negative values (Poletto et al. 2024). By using the difference in base pairs as a measure of similarity between genotypes, and without considering the number of repeat motifs of the SSR marker in the comparison, this similarity index aligns with the Stepwise Mutation Model (SMM), the Two-Phased Mutation Model (TPM), and the Infinite Alleles Model (IAM) of evolution. The same similarity index is used to generate the UPGMA dendrograms and the PCoA ordination, performing pairwise comparisons across all samples or among query genotypes alone. Statistical support for the branches of the dendrograms can be estimated through bootstrap analysis.
For morphometric data (Figure 1e), GMDA generates a UPGMA dendrogram and a PCA ordination based on Euclidean distance among query genotypes. Bootstrap analysis is also available to assess branch support for the dendrogram. Morphometric data are standardized for PCA analysis, allowing the use of different metrics (e.g., mm, cm, counts) without bias. Basic parameters (mean, median, mode, and respective standard deviations) are estimated for each morphometric variable. An analysis of variance (ANOVA) and a Tukey test are performed to evaluate the differentiation of the estimates among query genotypes. Effect sizes and 95% confidence intervals are estimated to support the ANOVA and Tukey analyses.
Finally, a Mantel test with 999 permutations (Figure 1c) is used to determine the correlation between the analyses obtained from genetic and morphometric data. This test defines the correlation between the dendrograms (genetic-based dendrogram vs. morphometric-based dendrogram) and between ordination analyses (genetic-based PCoA vs. morphometric-based PCA). The software is freely available for download at https://github.com/Yugaren/LFDGV/tree/main/GMDA.
RESULTS AND DISCUSSION
Using GMDA and a database of 71 reference pecan cultivars, the estimated genetic similarity between the query and reference genotypes ranged from 98.3% (BG57 and Woodrow_Ref) to 99.8% (BG61 and Importada_Ref; Table 2). For the query genotypes, the mean allelic richness was A = 1.29 alleles per locus (ranging from 1.2 to 1.6), and the mean observed heterozygosity was Ho = 0.29 (ranging from 0.10 to 0.60; Table 2). At the population level, the estimated genetic parameters revealed high allelic diversity and expected heterozygosity (A = 12.94, Ae = 11.79, He = 0.915), contrasting with low observed heterozygosity (Ho = 0.302) and, consequently, a high fixation index (F = 0.671).
Genetic similarity (Top3), total number of alleles (A), and genetic diversity (Ho) estimated for 18 selected genotypes of pecan
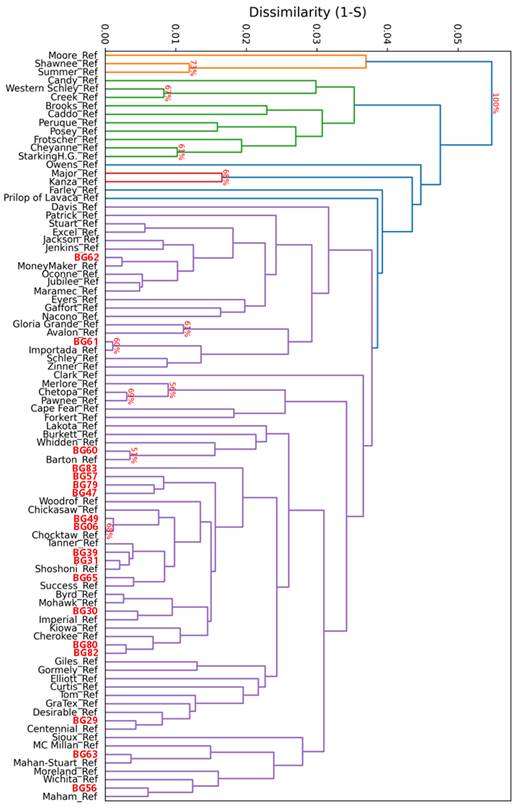
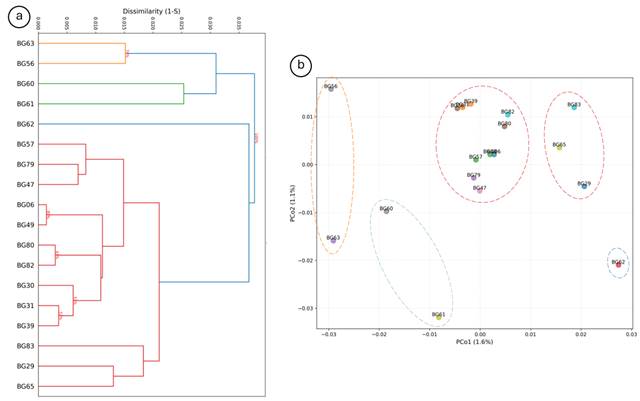
The genetic relationship between reference and query genotypes, depicted by the UPGMA dendrogram, revealed moderate to high bootstrap support for 12 clusters (Figure 2). Notably, query genotypes BG06, BG47, BG49, BG57, BG79, BG80, BG82, and BG83 did not cluster directly with any reference cultivars. When the query genotypes were analyzed independently (Figure 3a), this distinct cluster was maintained, suggesting that they may represent unique genetic lineages with potential for registration as new cultivars. The PCoA ordination revealed a similar pattern to the UPGMA dendrogram, although the first two coordinates explained a relatively low fraction of the total genetic variation (Figure 3b).

UPGMA dendrogram based on genetic data from 10 nuclear SSR markers. The genetic dissimilarity (d) was obtained from the pairwise similarity matrix generated for all samples (query and reference genotypes), as the complement of the similarity: d = 1 - S mape . Numbers at the nodes are bootstrap support.
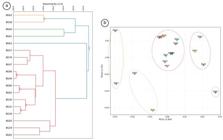
Clustering and ordination analyses of the query genotypes based on the genetic dissimilarity (d = 1 - S mape ). (a) UPGMA dendrogram of the query genotypes. Numbers at the nodes are bootstrap support. (b) PCoA analysis of the query genotypes based on SSR data. The color of the lines circling the genotypes matches the color of the corresponding UPGMA branches.
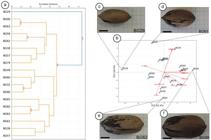
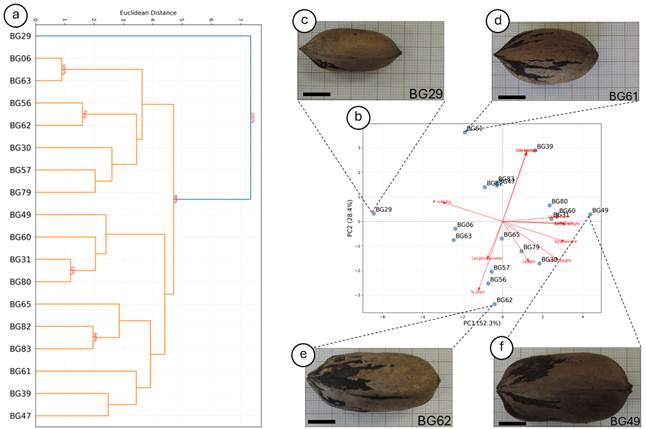
Clustering and ordination analyses of morphometric traits of pecan nuts based on Euclidean distance. (a) UPGMA dendrogram of the query genotypes. Numbers at the nodes are bootstrap support. (b) PCA analysis of the query genotypes based on 11 morphometric data. (c-f) Nuts of genotypes BG29, BG61, BG62, and BG49, respectively. Bar = 1 cm.
Analysis of the morphometric data for the query genotypes revealed very similar mean and median values for all traits, except for the number of nuts per kilogram. Because each trait was measured across 20 replicates per genotype, nine traits exhibited multiple modes (Table 3). The morphometric-based dendrogram (Figure 3a) identified genotype BG29 as the most divergent among the samples, with high bootstrap support. Beyond the distinctiveness of BG29, the dendrogram revealed two main clusters that were further subdivided (Figure 3a).
Mean values of the morphometric variables (n = 20 replicates), ANOVA p-value, and the Tukey grouping test. Values followed by the same letter in the column do not differ at α = 5%. Overall estimates of the mean, median, and mode, along with the respective standard errors, are also reported
In the PCA, the first two principal components (PC1 and PC2) accounted for 80.7% of the total morphological variance. Genotypes BG29 and BG61 were the most differentiated. The remaining query genotypes could be divided into three main groups, explained by specific nut traits: the kernel-to-shell ratio and shell percentage contributed most to PC1 (52.3% of the variance), while longitudinal diameter and kernel weight contributed most to PC2 (28.4% of the variance; Figure 3b). Along the PC1 axis, genotypes BG29 (Figure 3c) and BG49 (Figure 3f) were the most extreme, whereas BG61 (Figure 3d) and BG62 (Figure 3e) were the extremes along PC2. The size and shape of the nuts from these four genotypes (Figures 3c-f) clearly illustrate the morphological variability present within the selected plant material.
While ANOVA indicated significant differences for all traits (Table 3), Tukey's test did not detect significant differences in the pairwise comparisons for kernel percentage and shell percentage (Table 3). However, for these two complementary traits, 62 out of 152 pairwise comparisons of query genotypes exhibited effect sizes (Cohen's d) greater than 0.5, ranging from d = 0.69 (BG30-BG82 and BG63-BG82) to d = 5.18 (BG62-BG80). All these pairs presented 95% confidence intervals for the difference between means with widths ranging from 1.28 to 2.59 (Supplementary File 1), suggesting biologically meaningful differences despite the statistically non-significant p-values.
The Mantel test revealed a positive and significant correlation between the genetic and morphometric datasets, with r = 0.31 (p < 0.01) for the dendrograms and r = 0.29 (p < 0.01) for the ordination analyses.
The development of new cultivars by plant breeders relies on exploring genetic diversity-the range of genetic features within a crop or species-and genetic variation, which refers to the genetic differences among individuals for specific traits. Genetic variation, in turn, promotes phenotypic variation within populations (Swarup et al. 2021). Thus, the analysis and interpretation of genetic and phenotypic patterns are key factors in the establishment and management of germplasm banks and breeding programs, a principle that underpins the evaluation of the pecan genotypes in this study.
The genetic diversity parameters estimated for the evaluated pecan genotypes can be considered high compared to previous studies on pecan using nuclear SSR markers. Grauke et al. (2011) reported a mean genetic diversity of He = 0.43 ± 0.05 and a mean number of alleles of A = 6.40 ± 0.84 for 80 native pecan accessions from the USA. Jia et al. (2011) reported He = 0.26 ± 0.16 and A = 2.0 for 77 accessions from two Chinese germplasm banks. More recently, Zhang et al. (2020), genotyping 60 pecan accessions and 20 genotypes of other Carya species with EST-SSR and neutral SSR markers, reported He = 0.55 ± 0.27 and A = 7.36 ± 4.75. In contrast, our population-level estimates (He = 0.915, A = 12.94) reveal a substantially higher level of genetic diversity, underscoring the exceptional value of these old seed-derived genotypes as a reservoir of allelic variation for genetic breeding.
Based on molecular genetic similarity, nine of the pecan genotypes evaluated in this study have the potential to be registered as new cultivars (Table 2). While no consensus threshold exists to determine the genetic dissimilarity required to classify genotypes as distinct cultivars, some divergence at neutral SSR markers is expected even among plants of the same cultivar due to natural random mutations. These mutations may occur in just one or a few markers within a set of SSRs, resulting in small genetic differentiation. Considering the genetic similarity among registered reference cultivars (adopting S mape < 99.0% as our threshold for distinctness) and the clustering pattern in the dendrogram (Figure 2), these nine genotypes exhibit similarity estimates to reference genotypes that are equivalent to those observed among different registered cultivars. Conversely, the remaining nine query genotypes can be classified as known cultivars based on their high genetic similarity and clustering with reference genotypes (Figure 2).
Among the 18 query genotypes, BG29, BG63, and BG56 have also shown substantial resistance to three Colletotrichum species (C. gloeosporioides, C. nymphaeae, and C. karstii), causing pecan anthracnose (unpublished data from inoculation tests on fruits and leaflets with 10 replicates each). Although there is no evidence that the nuclear SSR markers used are linked to genes of interest (Grauke et al. 2003), it is noteworthy that BG63 and BG56, both with high potential as new cultivars, clustered together in the SSR-based dendrogram and occupy a similar region along the first axis of the PCoA (Figure 3). This genetic similarity, coupled with their shared anthracnose resistance, makes these genotypes particularly promising sources of resistance to be exploited in pecan breeding programs.
Concerning morphometric data, both UPGMA and PCA indicate genotype BG29 as the most divergent among all samples, a distinction largely driven by its small nut size. The remaining genotypes formed two main clusters in the UPGMA dendrogram, a partition supported by 80% bootstrap support. One cluster contains genotypes with a higher proportion of shell and a larger length-to-diameter ratio (BG57, BG62, BG65). Genotypes in the second cluster are defined by a combination of morphometric traits rather than any single distinguishing feature. Consistent with the genetic dendrogram (Figure 3a), the anthracnose-resistant genotypes BG63 and BG56 both fall within this second cluster, even though disease resistance was not a variable in the morphometric analysis. Except for BG65, the PCA recovered a similar partitioning pattern of genotypes along PC2.
While the UPGMA dendrogram represents the grouping of query genotypes based on overall similarity, the PCA enables the evaluation of which variables drive the observed groups. The vectors and loadings in the PCA biplot represent the real contribution of traits to the variance in two dimensions. Although the significant correlation (p < 0.05) between genetic and morphometric data was weak (r = 0.31 for dendrograms; r = 0.29 for ordination analyses), there is clear convergence in key results concerning the grouping and isolation of specific genotypes. Thus, evaluating this integrated information aids in selecting superior genotypes for targeted traits, such as a rounded nut shape (BG39), larger nut size (BG49), or a high kernel percentage (BG39).
Regarding kernel and shell percentages, although Tukey's test did not reveal significant pairwise differences among all genotypes, the estimated effect sizes and confidence intervals (Supplementary File 1) provide critical insight for interpreting these results. Effect sizes with d < 0.5 are often considered small and may suggest limited biological relevance, and confidence intervals that are wide or include zero are typically interpreted as indicating a lack of statistical significance. Conversely, for the 62 pairs of query genotypes that exhibited effect sizes d > 0.5 coupled with narrow 95% confidence intervals, it is reasonable to consider these pairwise differences as biologically meaningful. This is further supported by the fact that the kernel-to-shell ratio-a complementary trait-did show statistically significant differences for some genotypes (Table 3).
The success of crop breeding depends on identifying and incorporating genetic diversity from multiple sources, including commercial cultivars, landraces, wild genotypes, and germplasm collections (Swarup et al. 2021, Chikh-Rouhou et al. 2023). However, the primary targets of genetic breeding are often morphometric characteristics, which result from the interaction between genetics and environment. Therefore, characterizing both genetic and morphometric patterns of genotypes is essential for planning the improvement and conservation of crop species. The selection of plants based on such characterization can guide planned crosses by identifying diverse, trait-specific genotypes, thereby accelerating the development of new, improved pecan cultivars adapted to Brazilian conditions and meeting the demands of the production chain. Prioritizing crosses between genetically distant genotypes (e.g., those assigned to different clusters) may maximize genetic gain by exploiting heterosis. Moreover, selecting unique outlier genotypes in PCA or distinct branches of a dendrogram will support the maintenance of genetic variability for future breeding efforts.
In this study, the old seed-derived pecan genotypes from Southern Brazil were characterized using GMDA, a novel software proposed to assist breeders and conservationists. By generating comprehensive outputs for genetic and morphometric analyses, GMDA can help researchers identify uncharacterized genotypes as a particular cultivar, a hybrid between known cultivars, or a potential new cultivar (Poletto et al. 2024). In addition, this software may assist in characterizing the level of genetic and morphometric diversity within germplasm collections and in identifying morphological traits that segregate genotypes. Finally, the Mantel test reports the correlation between genetic and morphometric grouping analyses by comparing, independently, the dendrograms and the PCA/PCoA ordinations. Despite the ease of using simple Excel files as input for GMDA, the reliability and reproducibility of the underlying genetic and morphometric data remain crucial. The use of capillary electrophoresis with automated allele calling and standardization is recommended for genetic data generation, while truthful morphometric measurement requires appropriate instrumentation and a sufficient number of experimental replicates.
Altogether, the results suggest that the old seed-derived pecan genotypes evaluated in this study conserve important levels of genetic diversity, which should be actively exploited in genetic breeding programs. The correlation between genetic and morphometric grouping analyses suggests a genetic basis for some morphometric traits, indicating a high potential for achieving successful results in breeding. Based on their morphological characteristics, these genotypes can play a key role in developing new cultivars that meet the specific needs of the production chain. For instance, the resistance to anthracnose observed in BG29, BG63, and BG56 is an important feature to be further investigated and explored in pecan breeding programs. Moreover, query genotypes BG62, BG57, BG79, BG47, BG49, BG06, BG80, and BG82 show high potential for registration as new pecan cultivars. As these genotypes are now genetically and morphometrically characterized, further studies should focus on evaluating the stability and heritability of their agronomic traits of interest across different environments and generations.
ACKNOWLEDMENTS
The authors thank the farmers who permitted the collection of pecan samples in their farms and CNPq for affording PDJ and PQ grants (Processes 171360/2023-0 and 303673/2021-4, respectively).
Data Availability Statement
The datasets generated and/or analyzed in this study, as well as the supplementary tables and figures, are available from the corresponding author upon reasonable request.
REFERENCES
- Chikh-Rouhou H, Abdedayem W, Solmaz I, Sari N, Garcés-Claver A2023 Melon (Cucumis melo L.): Genomics and breeding. In Singh S, Sharma D, Sharma SK and Singh R (eds) Smart plant breeding for vegetable crops in post-genomics era. Springer, Singapore, p. 25-52
- Doyle JJ, Doyle JL1987 A rapid DNA isolation procedure for small quantities of fresh leaf tissuePhytochem Bull 19:11-15
- Egan LM, Conaty WC, Stiller WN2022 Core collections: is there any value for cotton breeding? Frontiers in Plant Science 13:895155
- EMBRAPA - Empresa Brasileira de Pesquisa Agropecuária2018 Sistema brasileiro de classificação de solos. Embrapa, Brasília, 306p.
- Grauke LJ, Iqbal MJ, Reddy AS, Thompson TE2003 Developing microsatellite DNA markers in pecanJournal of the American Society for Horticultural Science 128:374-380
- Grauke LJ, Mendoza-Herrera MA, Miller AJ, Wood BW2011 Geographic patterns of genetic variation in native pecansTree Genetics & Genomes 7:917-932
- Jia XD, Wang T, Zhai M, Li TR, Guo ZR2011 Genetic diversity and identification of Chinese-grown pecan using ISSR and SSR markersMolecules 16:10078-10092
- Kuinchtner A, Buriol GA2001 The climate of Rio Grande do Sul state according to Köppen and Thornthwaite classificationDisciplinarum Scientia 2:171-182
- Martins CR, Hoffmann A, Nachtigal JC, Alba JMF2023 Panorama da produção, processamento e comercialização de noz-pecã no sul do Brasil. Embrapa Clima Temperado, Pelotas, 36p.
- Nagel J, Poleto T, Muniz MFB, Poletto I, Oliveira JNM, Stefenon VM2023 Species-specific plastid SSR markers reveal evidence of cultivar misassignments in Brazilian pecan [Carya illinoinensis (Wangenh.) K. Koch] orchardsGenetic Resources and Crop Evolution 70:971-980
- Oliveira LO, Santos DD, Beise DC, Poletto T, Poletto I, Muniz MFB, Oliveira JNM, Stefenon VM2023 Old but still good: genetic diversity of ancient pecan genotypes from southern BrazilAnais da Academia Brasileira de Ciências 95:e20220885
- Poletto T, Muniz MFB, Baggiotto C, Ceconi DE, Poletto I2014 Fungos associados às flores e frutos da nogueira-pecã (Carya illinoinensis)Revista de Ciências Ambientais 8:5-13
- Poletto T, Poletto I, Marques CEDC, Silva AKDS, Kubenka K, Chatwin W, Gailing O, Stefenon VM2024 CertiBase: a genetic database for cultivar certification and genetic breeding of pecan in BrazilCrop Breeding and Applied Biotechnology 24:e493924310
- Poletto T, Poletto I, Silva LMM, Muniz MFB, Reiniger LRS, Richards N, Stefenon VM2020 Morphological, chemical and genetic analysis of southern Brazilian pecan (Carya illinoinensis) accessionsScientia Horticulturae 262:108863
- Salgotra RK, Chauhan BS2023 Genetic diversity, conservation, and utilization of plant genetic resourcesGenes 14:174
- Schuelke M2000 An economic method for the fluorescent labelling of PCR fragmentsNature Biotechnology 18:233-234
- Swarup S, Cargill EJ, Crosby K, Flagel L, Kniskern J, Glenn KC2021 Genetic diversity is indispensable for plant breeding to improve cropsCrop Science 61:839-852
- Zhang C, Yao X, Ren H, Chang J, Wu J, Shao W, Fang Q2020 Characterization and Development of Genomic SSRs in Pecan (Carya illinoinensis)Forests 11:61
Edited by
-
SCIENTIFIC EDITOR:
Luiz Antônio dos Santos Dias