
 Phenotypic selection of pequi trees (Caryocar brasiliense Cambess.) based on fruit production traits over different harvest seasons
ABSTRACT
The objective of the study was to increase the efficiency of phenotypic selection of promising genotypes for fruit and pyrene production in pequi trees (Caryocar brasiliense Cambess.), considering data from different harvest seasons. The number of fruits, the number of pyrenes, and the number of pyrenes per fruit were evaluated in 56 genotypes over four harvest seasons (2020-2023) in an experimental plantation established in 1999, in the Federal District (Brazil). Annual fruit production in each quadrant of the canopy, total plant height, trunk base diameter, and canopy area were recorded. Analysis of variance (ANOVA) was applied to assess differences in fruit production among years, genotypes, and quadrants (5% significance level). Repeatability coefficients (r) were estimated for the production-related traits, as well as the number of years needed for efficient phenotypic evaluation. There was high variability in fruit production both between genotypes and over years. Four genotypes exhibited notable productive potential. The repeatability analysis suggested that three years would be necessary for initial evaluations with 0.80 of accuracy, while four years would provide greater precision, with 0.85 accuracy. Although total production estimates based solely on fruit counts by quadrant showed low accuracy for individual genotypes, this approach could be utilized for total production estimates when assessing a large stand of plants. Canopy area showed a significant correlation with fruit production.
Keywords:
Non-timber forest product; Repeatability; Brazilian savanna; Phenotypic variability
RESUMO
O objetivo do estudo foi aumentar a eficiência da seleção fenotípica de genótipos promissores para a produção de frutos e pirênios de pequizeiro (Caryocar brasiliense Cambess.), considerando informações em diferentes safras. Foram avaliados o número de frutos, o número de pirênios e o número de pirênios por fruto em 56 genótipos ao longo de quatro safras (2020-2023), em um plantio experimental estabelecido em 1999, no Distrito Federal. Foram registrados: a produção anual de frutos; a altura total da planta, o diâmetro na base do tronco e a área da copa. A análise de variância (ANOVA) foi aplicada para avaliar as diferenças na produção de frutos entre anos, genótipos e quadrantes ao nível de significância de 5%. Estimaram-se os índices de repetibilidade (r) para as características relacionadas à produção, bem como o número de anos necessários para uma avaliação fenotípica eficiente. Houve alta variabilidade na produção de frutos, tanto entre os genótipos quanto entre os anos. Quatro genótipos se destacaram pelo alto potencial produtivo. A estimativa indicou que seriam necessários três anos para alcançar uma acurácia de 0,80 e quatro anos para 0,85. Embora a contagem de frutos por quadrantes tenha apresentado baixa acurácia para genótipos individuais, mostrou-se útil para estimativas de produção total, especialmente ao se avaliar um conjunto de genótipos. A área da copa apresentou correlação significativa com a produção de frutos.
Palavras-chave:
Produto florestal não-madeireiro; Repetibilidade; Bioma Cerrado; Variabilidade fenotípica
1 INTRODUCTION
The pequi (Caryocar brasiliense Cambess., Caryocaraceae), a native tree species widely distributed in the Brazilian savannas (Ratter et al., 2003), is of notable ecological and economic importance. This species ranks among the 25 most common in these environments (Ratter et al., 2003), and its fruit (pequi) is widely used in regional cuisine. The fruit has high nutritional value and is rich in lipids, carotenoids, antioxidants, and bioactive compounds (Almeida et al., 1998). The pequi tree is an arboreal species that can reach approximately 8m in height and 20cm in diameter (Zardo; Henriques, 2011). Flowering occurs between August and October, while fruiting predominantly takes place from November to February, varying according to the edaphoclimatic conditions of the region where the species occurs (Almeida et al., 1998).
Pequi commercialization is primarily supported by extractive exploitation, a practice that can negatively affect population sustainability as a result of the near-total removal of reproductive structures (Leite et al., 2006). In this context, the genetic and phenotypic diversity observed among individuals within populations contributes not only to adaptation across heterogeneous environments but also to the viability of sustainable extractive practice. Phenotypic selection constitutes an important strategy for identifying superior individuals by targeting phenotypic traits of agronomic and economic interest. Information on individual productivity throughout its life cycle is particularly relevant in both, natural populations (Santana; Naves, 2003; Gulias et al., 2008; Zardo; Henriques, 2011; Ferreira et al., 2015; Bruzinga, 2017) and cultivated systems (Pereira et al., 2022; Aquino et al., 2023). In addition, knowledge of individual productivity and of the capacity of plants to consistently express desirable traits over time is fundamental for the identification of superior genetic materials intended for cultivar development. The temporal stability of phenotypic traits can be quantified using the repeatability coefficient.
Repeatability coefficient corresponds to the upper limit of broad-sense heritability that a trait can achieve (Falconer, 1981) and is used in perennial plants to estimate the number of phenotypic observations required per individual to allow more efficient discrimination (Cruz; Regazzi, 1994; Fonseca et al., 2018; Azevedo et al., 2020).
The objective of this study was to characterize the nature of variability in fruit and pyrene production in C. brasiliense in order to improve the efficiency of phenotypic selection using multi-year and multi-genotype data. The results are intended to support plant selection, yield forecasting, market planning, and the development of sustainable management strategies for species conservation.
2 MATERIALS AND METHODS
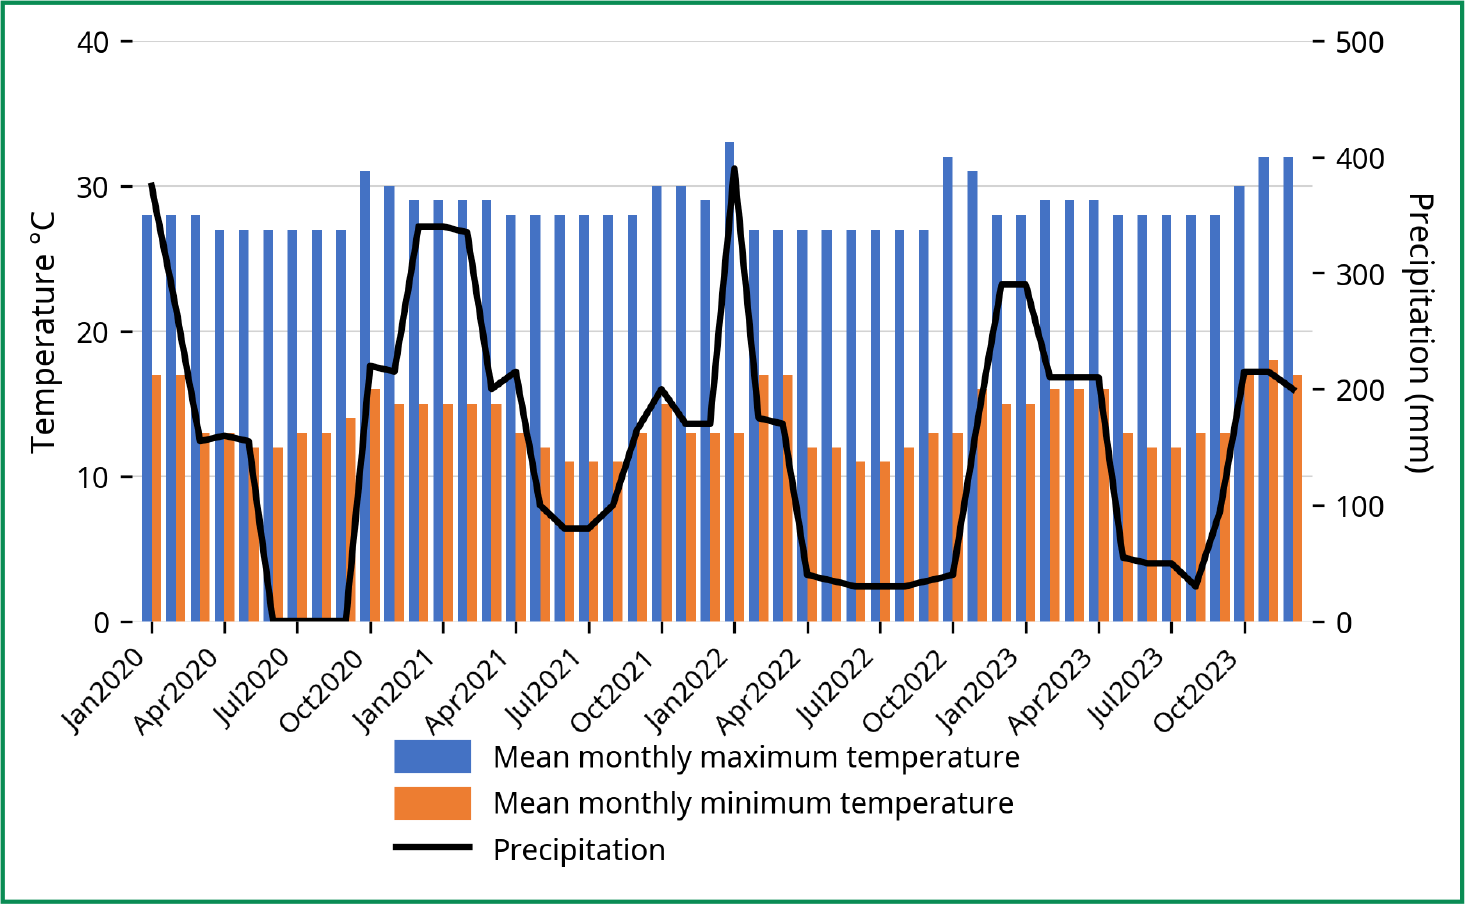
The evaluations were conducted in an experimental plantation of C. brasiliense established in January 1999 at Embrapa Cerrados, Planaltina, DF, Brazil (15º35’33”S, 047º44’00”W; 1,008 m a.s.l.). The soil of the area is classified as Dark Red Latosol, and the climate is Aw (tropical savanna), with two well-defined seasons: (i) a rainy season from October to April and (ii) a dry season from May to September. According to records obtained from the main meteorological station at Embrapa Cerrados (Figure 1), during the evaluated period from 2020 to 2023, the mean monthly maximum temperature ranged from 28.4°C to 29.8°C, while the mean monthly minimum temperature ranged from 15.4°C to 16.2°C. Annual accumulated precipitation ranged from 1,569.7 mm in 2020 to 791.5 mm in 2023.
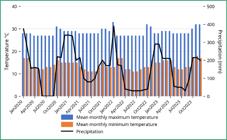
Meteorological data obtained from the main station at Embrapa Cerrados during the study period
A total of 180 plants originating from different areas of the Brazilian savanna were established at a spacing of 7 m between rows and 3 m between plants within rows. All individuals were identified with numbered stakes. The experimental area was maintained by periodic mowing for weed control and by topdressing fertilization. Twenty years after establishment, evaluations were initiated annually to assess traits related to fruit and pyrene production.
A random sample of 56 healthy and vigorous C. brasiliense genotypes was selected for this study. The North-South and East-West axes were established beneath each canopy using a compass, and the diameters of the canopy projection were measured. Each canopy was subsequently divided into four quadrants (Q1: northeast, Q2: southeast, Q3: southwest, and Q4: northwest). Within each quadrant, the number of fruits, number of pyrenes, and number of pyrenes per fruit were recorded for the 2020, 2021, 2022, and 2023 harvest seasons. The division into quadrants aimed to identify: (i) whether production was concentrated in a specific canopy quadrant; and (ii) whether any quadrant showed a more direct relationship with total production, with the objective of facilitating its estimation. From November onward, corresponding to the onset of fruit maturation, the total number of fruits (NF) and pyrenes (NP) were recorded for each selected genotypes. These values were obtained by counting both the fruits retained on the tree and those fallen beneath the respective canopy. In addition, plant height, basal diameter (calculated as the mean of the North-South and East-West axes measurements), and the number of fruits containing one to five pyrenes were recorded. Canopy area was estimated assuming a circular projection, using the area of a circle (Equation 1):
where: CA is the canopy area, and D represents the mean of the two diameters measured in the canopy projection.
The ANOVA for the effects of Year and Genotypes was performed using a linear mixed-effects model fitted by restricted maximum likelihood (REML), due to data imbalance and because the original data distribution did not meet all assumptions of normality. A second ANOVA was conducted to evaluate the fixed effect of Quadrants, using a linear model fitted by REML, in order to assess whether there were differences in fruit production between the four canopy quadrants of the genotypes. Factors that showed significant effects in the ANOVA were subjected to Fisher’s Least Significant Difference (LSD) test at the 5% probability level to determine which means differed significantly.
The models presented in Equations 2 and 3 were used to assess year and genotype effects and for quadrant effects, respectively:
where: ŷij is the dependent variable (NF, NP e NP/F); µ is the unknown mean of the trait under consideration; i = 1,..., 4 years; j = 1, 2, 3,..., 42 producing genotypes; ąi is the random effect of year “i”; ɱj is the fixed effect of genotype “j” plus the effect of the environment in which plant “j” is located; and ɛij is the random error; and,
where: ŷij is the dependent variable (NF, NP e NP/F); µ is the unknown mean of the trait under consideration; i = 1,..., 4 quadrants; j = 1, 2, 3,..., 42 producing genotypes; qi is the fixed effect of quadrant ”i”; and ɛij is the random error.
Following ANOVA, repeatability coefficients (r) of the genotypes were estimated for the three traits over four years, based on the decomposition of the expected mean squares (E[MS]) and their corresponding variance components (Table 1). Because each genotype was not replicated and instead was evaluated over four consecutive years, the estimated parameter corresponded to repeatability rather than heritability, since the genetic effect of the genotype could not be separated from the environmental effect. Equation 4 was applied:
Analysis of variance (ANOVA) for the effects of Year and Genotype, with the corresponding expected mean squares (E[MS]), variance components, and the formula used to estimate repeatability in Caryocar brasiliense (n = 42 genotypes that produced fruits in at least one of the four evaluation years)
where: r is the repeatability coefficient; σɱ2 is the estimated variance among genotypes, which includes both the genetic variance between genotypes and the temporal environmental variance; and σe2 is the residual variance component.
In where: d.f. = degrees of freedom; MS = mean square; r = repeatability of production over the four harvests; σɱ2 = variance component associated with genotypes.
Repeatability was also used to determine the number of years required to evaluate each genotype in order to achieve a more efficient phenotypic selection. The minimum number of years needed to predict the phenotypic value of the genotypes was calculated based on predefined coefficients of determination (R2), representing the desired levels of accuracy, according to Equation 5 (Cruz & Regazzi, 1994).
where: n₀ is the number of years required; R2 is the predefined coefficient of determination; and r is the repeatability coefficient.
To assess whether individual quadrants were directly correlated to total tree production, linear regressions were performed between the number of fruits and pyrenes in each quadrant and the total production of the genotypes, using the following model (Equation 6):
where: ŷij is the observed fruit or pyrene production of genotype i and represents the dependent variable; bo is the constant term or intercept, corresponding to total production when quadrant production (Xij) equals zero; Xij is the single regressor or independent variable in the equation, representing the observed production in each quadrant; and ɛij is the residual error, which accounts for the portion of total variation not explained by the model.
All statistical analyses were performed using RStudio version 2022.07.1+554, with R software version 4.2.1 (R Core Team, 2022). The following packages were used: agricolae version 1.3-7 (Mendiburu, 2023), car version 3.2-1 (Fox & Weisberg, 2019), ggplot2 version 3.4.4 (Wickham, 2016), lme4 version 1.1-35.1 (Bates et al., 2015), ScottKnott version 1.3-2 (Jelihovschi et al., 2023), and the base stats package version 4.2.1 (R Core Team, 2022).
3 RESULTS
Marked variability in fruit production was observed among genotypes and across years. Of the 56 evaluated genotypes, 42 (75%) produced fruits in at least one of the four evaluation years, whereas 14 (25%) did not produce fruits during the study period. Significant differences among genotypes were detected for both the number of fruits and the number of pyrenes, while no significant differences were observed for the pyrene-to-fruit ratio (Table 2). Consequently, Fisher’s Least Significant Difference (LSD) test was applied to the mean values of the first two traits.
Analysis of variance (ANOVA) for the effects of Year and Genotype on fruit production, pyrene production, and the pyrene-to-fruit ratio in Caryocar brasiliense (n = 42 genotypes that produced fruits in at least one of the four evaluation years)
Mean annual production of 42 genotypes of Caryocar brasiliense in number of fruits (NF), number of pyrenes (NP), and pyrenes per fruit ratio (NP/F)
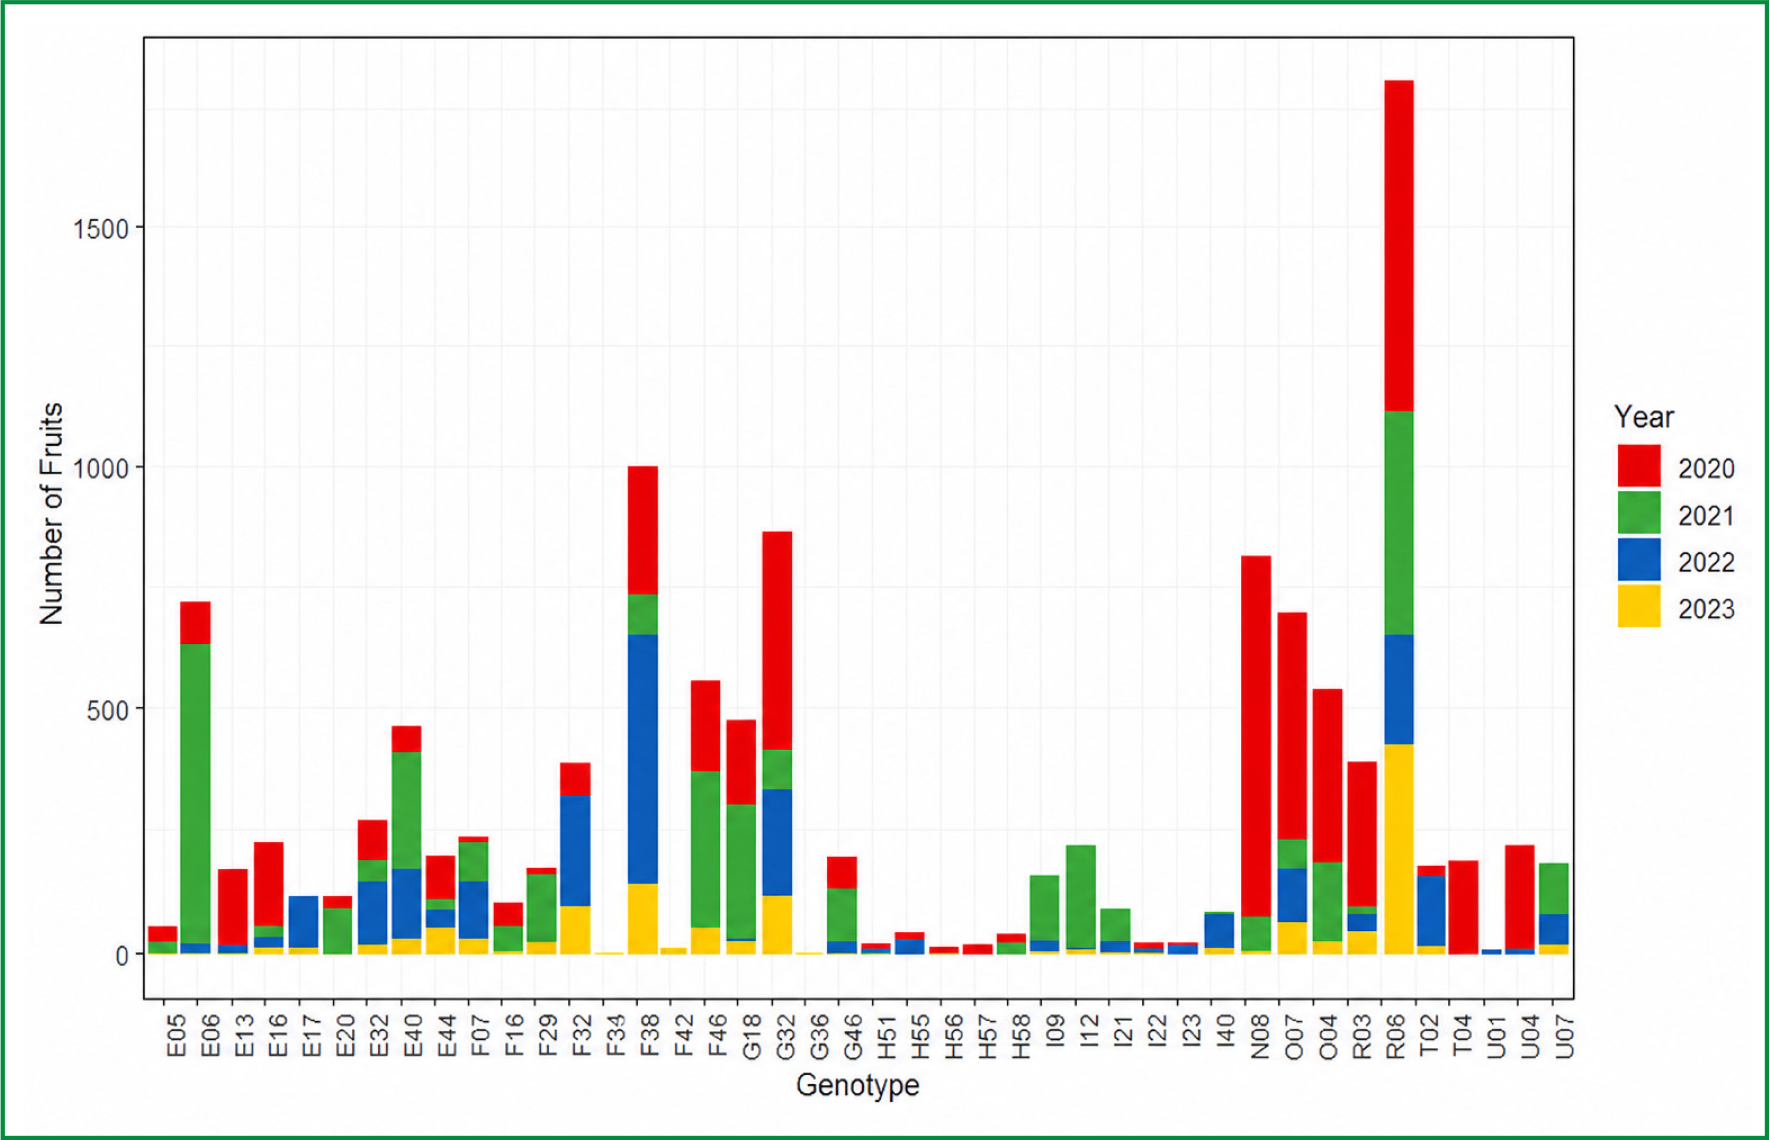
Four genotypes (R06, F38, G32, and N08) showed significantly higher mean numbers of pyrenes.
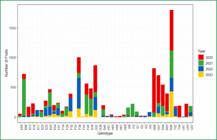
The production of the 42 genotypes varied widely over years and among individuals (Figure 2). Only seven trees (13%) fruited in all four assessment years, whereas the others fruited in three (21%), two (23%), or a single year (18%). The variance among years for the three traits was lower than within year, indicating greater variability among genotypes within years than over years.
Most fruits produced by the 42 evaluated genotypes contained a single pyrene (64.2%), with relatively low variability (CV = 35.08%) (Table 4). As the number of pyrenes per fruit increased, their frequency declined and the coefficient of variation rose sharply, reaching 430.94% for fruits containing five pyrenes. This pattern indicates substantially greater variability among genotypes for fruits with higher pyrene numbers.
Mean, standard deviation, minimum and maximum percentages of fruits with one to five pyrenes, along with their respective coefficients of variation (CV), for the 42 evaluated genotypes of Caryocar brasiliense
Table 5 presents estimates of the number of years required to evaluate the traits number of fruits (NF) and number of pyrenes (NP) under different coefficients of determination (R2), representing the proportion of total variability explained by the evaluated factor, and repeatability values (r) (Table 2). Higher coefficients of determination indicate greater accuracy in predicting the phenotypic performance of the genotypes, whereas higher repeatability values reflect greater consistency in trait expression across years.
Estimated number of years required to evaluate the traits number of fruits (NF) and number of pyrenes (NP) of Caryocar brasiliense for four different coefficients of determination (R2)
Repeatability estimates were 0.58 for NF and 0.45 for NP (Table 2), indicating moderate temporal consistency in the expression of these traits. For NF, with a repeatability of 0.58, the number of years required for reliable evaluation increased with higher target accuracy (R2), ranging from three years at an accuracy of 0.80 to 14 years at an accuracy of 0.95 (Table 5). For NP, with a repeatability of 0.45 and the same accuracy levels, the required number of years ranged from four to 22 years. Consequently, a greater number of years was consistently required to evaluate NP than NF at equivalent accuracy levels (Table 5).
Mean fruit production across canopy quadrants was 104.3 fruits in Q1, 90.1 in Q4, 76.5 in Q3, and 60.6 in Q2, with no significant differences detected at the 5% probability level (Table 6). Similarly, mean pyrene production was 140.6 pyrenes in Q4, 115.9 in Q1, 113.2 in Q3, and 93.3 in Q2, and did not differ significantly among quadrants.
ANOVA of canopy quadrant (Q1, Q2, Q3 e Q4) effects on fruit and pyrene production in Caryocar brasiliense
Within-quadrant (residual) variation was similar to the variation among quadrants. High CV values for both traits indicated substantial dispersion in production among the different genotypes. Canopy quadrants (Q1, Q2, Q3, and Q4) did not have a significant effect on fruit or pyrene production, and substantial residual variability remained unexplained by the model.
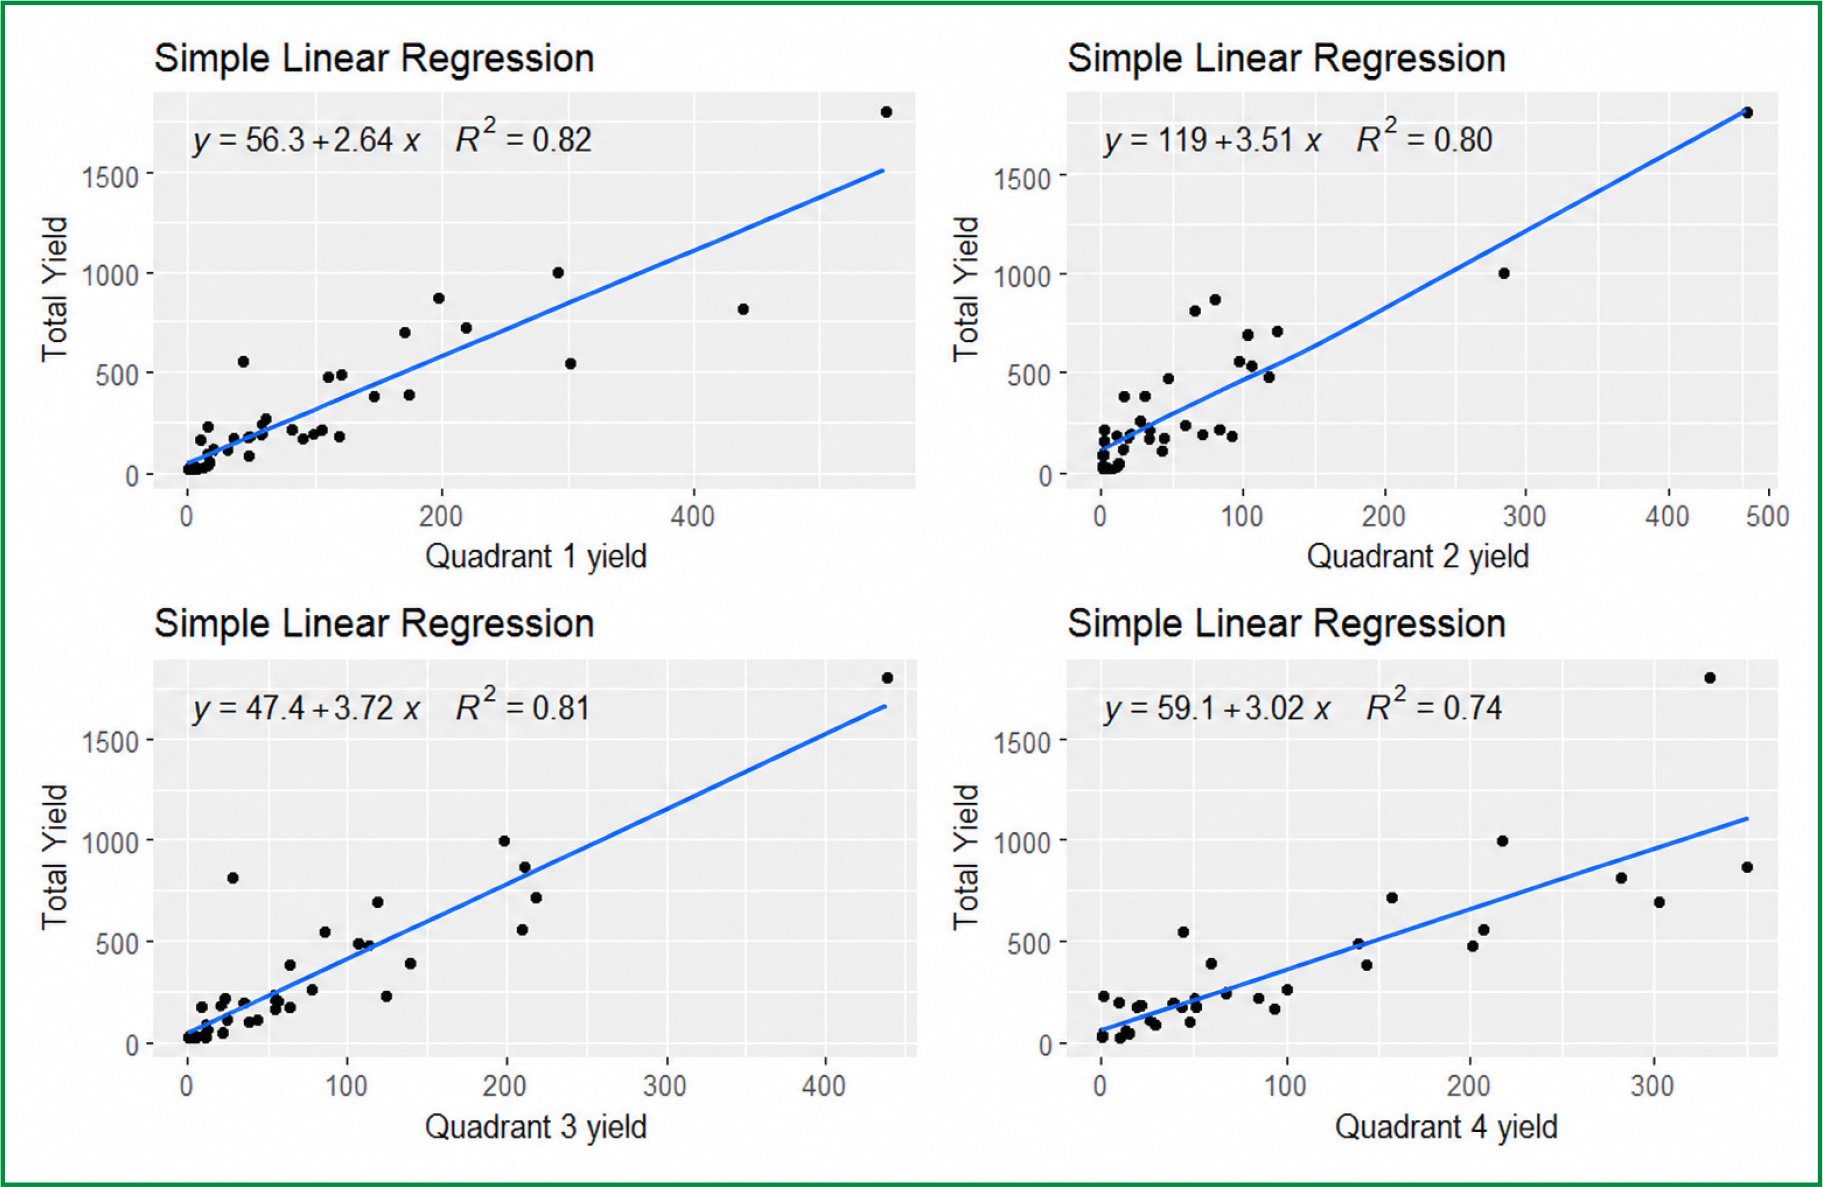
All predictors from the four quadrants were highly significant for total fruit production, with coefficients ranging from 2.63 to 3.72 and very low p-values (p < 0.0001), indicating strong positive relationships between quadrant-level production and total fruit production (Figure 3). The equation generated for Q2 showed a significant intercept for total production (p = 0.00102), suggesting that the regression line did not pass through the origin. In contrast, the equations generated for Q1, Q3, and Q4 did not present significant intercepts for total production, suggesting that the regression line may pass through or near the origin (Figure 3). Models based on fruit number in Q1, Q2, Q3, and Q4 explained approximately 82%, 79%, 80%, and 74% of the total variation in fruit number, respectively. The overall statistics were high for all four models, and their corresponding p-values (< 0.001) reinforced their global significance. Residuals from all four models also showed substantial unexplained variation, as indicated by high standard deviations.
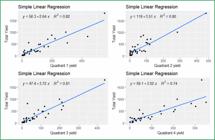
Simple linear regressions relating fruit production in canopy Quadrants 1, 2, 3 and 4 to total fruit production in C. brasiliense genotypes
The residual, calculated as the relative difference between the estimated and observed production for each genotype and for the set of genotypes, indicated the precision of the estimates. Accuracy was considered high when the relative value exceeded 0.90 (90%). Overall, estimation accuracy varied among genotypes and among quadrants. Considering the four models, only 10 to 19% of the genotypes exhibited high accuracy and therefore more precise estimates. The vast majority of genotypes, between 81% and 90%, showed low accuracy, reflecting less precise estimates. Thus, the results indicated that fruit production estimates of C. brasiliense based on counts from any single quadrant should not be used as a basis for classification and/or selection of individual genotypes.
However, the observed total production values, considering the 42 genotypes as a whole, were similar to those estimated from fruit counts in the four quadrants, with much higher precision and low relative residuals, ranging from 0.02 to 0.05 and close to zero. In other words, quadrant-based counts can be used to estimate total production of a group of genotypes within an experimental area, as well as in stands or natural populations.
Plant height showed a moderate positive correlation with diameter (r = 0.41) and weak but significant negative correlations with both the number of fruits (r = -0.31*) and the number of pyrenes (r = -0.30*) (Table 7). Diameter was moderately and positively correlated with canopy area (r = 0.45**) and was not correlated with either the number of fruits (r = -0.01, ns) or the number of pyrenes (r = 0.00, ns). The number of fruits and the number of pyrenes were extremely highly and significantly correlated (r = 0.99**). Canopy area exhibited moderate positive correlations with both the number of fruits (r = 0.56**) and the number of pyrenes (r = 0.56**).
Correlations among morphological traits of Caryocar brasiliense genotypes and their fruit and pyrene production
4 DISCUSSIONS
The moderate temporal consistency observed in fruit and pyrene production in C. brasiliense is likely associated with the high genetic and environmental heterogeneity characteristic of this species, which results in substantial variation in productive capacity (Gulias et al., 2008; Zardo & Henriques, 2011; Ferreira et al., 2015; Bruzinga, 2017; Silva et al., 2019; Pinheiro et al., 2020; Aquino et al., 2023). Previous studies have similarly documented wide interannual and interindividual variation in fruit yield. For example, Ferreira et al. (2015) reported a mean production of 132 fruits per plant among 223 individuals in Goiás, with values ranging from zero to 2,160 fruits, evidencing pronounced variability. Bruzinga (2017) observed fruit production of 2,471 fruits in the first year and 1,656 fruits in the second year in a population of 225 pequi trees in Minas Gerais. Likewise, Pereira et al. (2022) recorded mean yields ranging from 126 to 327 fruits per plant over the first five harvests of cultivated C. brasiliense. These findings corroborate the moderate repeatability detected in the present study and highlight the strong influence of both genetic background and environmental conditions on reproductive output in this species.
Although no well-defined periodic pattern in fruit production was detected, it was possible to identify genotypes with comparatively higher productivity, which is of direct relevance for achieving genetic gains in selection and breeding programs. Despite being restricted to annual fruit yield data, the present study addresses an important knowledge gap, given the limited information available on this trait, which is critical for the commercial exploitation of the species, as well as for in situ and ex situ conservation and the development of sustainable management strategies.
Assessment of pyrene number exhibited greater variability and required a longer evaluation period to achieve the same level of accuracy obtained for fruit number. An accuracy of 0.80 can be attained within three years for the number of fruits, which is adequate for early stages of selection, where high precision is not always required. Increasing the accuracy to 0.85 necessitates approximately four years of observation, a level more appropriate for breeding programs that seek greater reliability without unduly extending the evaluation period. Higher accuracy thresholds demand substantially longer monitoring periods and are therefore more suitable for breeding strategies aimed at highly precise phenotypic estimates. Considering the trade-off between gains in precision and the associated increases in time and cost, an evaluation period of four to five years appears sufficient to ensure consistent phenotypic assessment, with an expected accuracy of approximately 0.85 for both NF and NP.
Because repeatability represents the upper limit of heritability (Falconer, 1981), the intermediate repeatability values obtained in this study suggested a moderate contribution of genetic factors to the expression of the evaluated traits. At the same time, these estimates indicated a substantial influence of environmental variation on phenotypic expression, which contributed both to the increase in the number of years required for reliable trait evaluation and to the observed temporal inconsistency in trait performance.
Environmental conditions are subject to numerous factors that influence fruit production among genotypes and over years. The interaction between plant genotype and the growing environment may affect the expression of genetic traits, resulting in differences in fruit production and repeatability. Genetic variability within C. brasiliense populations tends to be greater than variability among different populations, which can be partially attributed to gene flow facilitated by the species’ chiropterophilous pollination system and zoochorous seed dispersal (Gribel; Hay, 1993).
Given the limited information available on annual fruit production in C. brasiliense, it is relevant to discuss general factors that may affect this trait in order to improve the predictability of fruit production and support future research on species management.
Pollination may influence both fruit quality and quantity, which is essential for understanding fruit production in C. brasiliense. Flowering occurs between July and September, depending on the region, and fruit production relies on cross-pollination by bats (Gribel & Hay, 1993). Failures in the pollination process may result in incomplete fertilization, uneven fruits, and lower repeatability. Fruits with a single pyrene predominated, in agreement with previous studies (Vera et al., 2007; Silva et al., 2012; Moura et al., 2013; Alves et al., 2014; Soares et al., 2017). Fruits with a higher number of pyrenes may enhance economic exploitation, as pyrenes represent the marketed portion of the fruit.
The complex interaction between genetic and environmental factors affecting fruit production has been highlighted in recent studies on the genus Caryocar. Lopes et al. (2020) observed that proximity to native vegetation positively influences fruit size and pulp weight, whereas Gomes et al. (2023) demonstrated that precipitation plays a crucial role in both fruit production and bat pollinator activity. During the flowering period, variation in precipitation and temperature negatively affects production, while relative humidity has a directly proportional effect (Gomes et al., 2023). These findings underscore the intricate relationships among plants, their pollinators, and environmental factors influencing fruit production.
Climatic conditions influence fruit production (Leite et al., 2006), likely through their effects on the activity of C. brasiliense pollinators. The authors observed that higher precipitation during the flowering months might reduce pollinator efficiency, negatively affecting fruit production. Leite et al. (2006) also reported lower fruit production on the eastern and northern sides of C. brasiliense individuals located in pasture areas, possibly related to greater flower drop on those sides due to prevailing northeast-to-east winds. In the present study, no predictable trend was observed when fruit production was evaluated by quadrant, indicating that production was not affected by canopy orientation relative to solar exposure. Bruzinga (2017) reported similar results.
Although no significant differences were detected in the mean number of fruits and pyrenes among canopy quadrants, indicating a relatively homogeneous spatial distribution of fruits within the canopy, the regression models exhibited low precision for individual-level estimates. Thus, while quadrant means adequately represented overall fruit production, substantial variability among genotypes persisted. Consequently, fruit production estimates derived from counts in a single quadrant should not be used as a criterion for classification and/or selection of individual genotype. In contrast, the results demonstrate that quadrant-based fruit counts provide high accuracy when applied to the evaluation of groups of pequi trees in experimental areas, plantations, or natural populations.
Canopy area exhibited moderate positive correlations with both fruit and pyrene numbers, indicating that this trait may serve as a practical proxy for estimating productivity. A similar positive association between canopy size and fruit yield in pequi trees was reported by Bruzinga (2017). Overall, the findings of the present study confirm pronounced variation in fruit production among individuals and across years, highlighting the potential for genetic improvement through selection in C. brasiliense.
4 CONCLUSIONS
There was considerable variability in fruit production among C. brasiliense genotypes, both among years and within each year, with a substantial portion of the variation remaining unexplained, indicating the influence of unmeasured factors. Four genotypes consistently exhibited a higher number of pyrenes per fruit over harvests, standing out as promising candidates for clonal testing in genetic improvement programs. Repeatability estimates for fruit and pyrene number were moderate, indicating intermediate expression of these traits over time. To achieve an accuracy of 0.80, at least three years of evaluation are recommended, while an accuracy of 0.85 can be reached with four years of observation, providing a favorable balance between reliability and evaluation time. Quadrant-based production estimates were not suitable for evaluating individual genotype, although they proved effective for estimating total production at the group level. Canopy area showed stronger correlations with fruit and pyrene production, making it a useful indicator to support phenotypic selection.
-
Evaluators in this article:
Prof. Dr. Ezequiel Gasparin, Section Editor
Data Availability Statement:
Datasets related to this article will be available upon request to the corresponding author.
References
- ALMEIDA, S. P.; PROENÇA, C. E. B.; SANO, S. M.; RIBEIRO, J. F. Cerrado: espécies vegetais úteis Brasília: Embrapa Cerrados, 1998.
-
ALVES, A. M.; FERNANDES, D. C.; SOUSA, A. G. O.; NAVES, R. V.; NAVES, M. M. V. Características físicas e nutricionais de pequis oriundos dos estados de Tocantins, Goiás e Minas Gerais. Brazilian Journal of Food Technology, v. 17, n. 3, p. 198-203, 2014. DOI 10.1590/1981-6723.6013.
» https://doi.org/10.1590/1981-6723.6013. - AQUINO, F. G.; GONÇALVES, H. M.; DURÃES, N.; ROCHA, F. S.; VILELA, M. F.; FONSECA, C. E. L. Caracterização agronômica de Caryocar brasiliense Camb. (Caryocaraceae) em plantio experimental Boletim de Pesquisa e Desenvolvimento, 405. Brasília: Embrapa Cerrados, 2023.
-
AZEVEDO, V. R.; WADT, L. H. O.; PEDROZO, C. A.; FONSECA, F. L.; RESENDE, M. D. V. Coeficiente de repetibilidade para produção de frutos e seleção de genótipos de Bertholletia excelsa (Bonpl.) em castanhais nativos do estado do Acre. Ciência Florestal, v. 30, n. 1, p. 135-144, 2020. DOI 10.5902/1980509834304.
» https://doi.org/10.5902/1980509834304. -
BATES, D.; MACHLER, M.; BOLKER, B.; WALKER, S. Fitting linear mixed-effects models using lme4. Journal of Statistical Software, v. 67, n. 1, p. 1-48, 2015. DOI 10.18637/jss.v067.i01.
» https://doi.org/10.18637/jss.v067.i01. - BRUZINGA, J. S. Amostragem e predição da produção de frutos de pequi (Caryocar brasiliense Camb.) 2017. 163p. Tese (Doutorado em Ciências Florestais) - Universidade de Brasília, Brasília, 2017.
- CRUZ, C. D.; REGAZZI, A. J. Modelos biométricos aplicados ao melhoramento genético Viçosa: Universidade Federal de Viçosa, 1994.
- FALCONER, D. S. Introduction to quantitative genetics New York (USA): Longman Inc., 1981.
-
FERREIRA, G. A.; NAVES, R. V.; CHAVES, L. J.; VELOSO, V. R. S.; SOUZA, E. R. B. Produção de frutos de populações naturais de pequizeiro no estado de Goiás. Revista Brasileira de Fruticultura, v. 37, n. 1, p. 121-129, 2015. DOI 10.1590/0100-2945-404/13.
» https://doi.org/10.1590/0100-2945-404/13. -
FONSECA, C. E. L.; MORAIS, F. M. G.; GONÇALVES, H. M.; AQUINO, F. G.; ROCHA, F. S. Repeatability of fruit traits from two Hancornia speciosa populations from the core region of the Brazilian Cerrado. Pesquisa Agropecuária Brasileira, v. 25, n. 7, p. 710-716, 2018. DOI 10.1590/S0100-204X2018000600007.
» https://doi.org/10.1590/S0100-204X2018000600007. - FOX, J.; WEISBERG, S. An R companion to applied regression 3rd edition, London (UK): Sage Publications, Inc., 2019.
-
GOMES, M. V. F.; MOREIRA, J. A.; ARAUJO, J. F.; COCOZZA, F. M.; PEIXOTO, A. R. A resposta produtiva do pequi às condições climáticas em uma região do Cariri Cearense. Observatório de la Economía Latinoamericana, v. 21, n. 6, p. 4317-4339, 2023. DOI 10.55905/oelv21n6-065.
» https://doi.org/10.55905/oelv21n6-065. -
GRIBEL, R.; HAY, J. D. Pollination ecology of Caryocar brasiliense (Caryocaraceae) in Central Brazil Cerrado vegetation. Journal of Tropical Ecology, v. 9, n. 2, p. 199-211, 1993. DOI 10.1017/S0266467400007173.
» https://doi.org/10.1017/S0266467400007173. - GULIAS, A. P. S. M.; RIBEIRO, J. F.; OLIVEIRA, M. C.; AQUINO, F. G.; SILVA, M. R. Produtividade dos pequizeiros (Caryocar brasiliense Camb.) no município de Damianópolis, Goiás. Brasília, DF. In: SIMPÓSIO NACIONAL DOS CERRADOS E II SIMPÓSIO INTERNACIONAL DE SAVANAS TROPICAIS, 9. Desafios e estratégias para o equilíbrio entre sociedade, agronegócio e recursos naturais, 2008, Brasília. Anais [...] Brasília: EMBRAPA CERRADOS, 2008. p.1-5.
- JELIHOVSCHI, E.; FARIA, J. C.; ALLAMAN, I. B. The ScottKnott Clustering Algorithm Package, [S.l.: s.n.], 2023.
-
LEITE, G. L. D.; VELOSO, R. V. S.; ZANUNCIO, J. C.; FERNANDES, L. A.; ALMEIDA, C. I. M. Phenology of Caryocar brasiliense in the Brazilian Cerrado region. Forest Ecology and Management, v. 236, n. 2-3, p. 286-294, 2006. DOI 10.1016/j.foreco.2006.09.013.
» https://doi.org/10.1016/j.foreco.2006.09.013. -
LOPES, B. M.; PEREIRA, O. R.; BULHÃO, C. F.; SILVA, J. F. Influence of native vegetation on pequiá fruit (Caryocar villosum [Aubl.] Pers) production and traits. Nativa, v. 8, n. 5, p. 603-609, Sept/Oct 2020. DOI 10.31413/nativa.v8i5.10186.
» https://doi.org/10.31413/nativa.v8i5.10186. - MENDIBURU, F. Statistical procedures for agricultural research (Version 1.3-7). [S.l.: s.n.], 2023.
-
MOURA, N. F.; CHAVES, L. J.; NAVES, R. V. Caracterização física de frutos de pequizeiro (Caryocar brasiliense Camb.) do Cerrado. Revista Árvore, v. 37, n. 5, p. 905-912, 2013. DOI 10.1590/S0100-67622013000500013.
» https://doi.org/10.1590/S0100-67622013000500013. - PEREIRA, A. V.; PEREIRA, E. B. C.; GONÇALVES, H. M.; ANDERE, S. C. Cultivares do pequizeiro 1a. edição. Goiânica: Agência Goiana de Assistência Técnica, Extensão Rural e Pesquisa Agropecuária e Embrapa Cerrados, 2022.
-
PINHEIRO, R. T.; MARCELINO, D. G.; MOURA, D. R. Composição e diversidade arbórea nas quadras urbanizadas de Palmas, Tocantins. Ciência Florestal, v. 30, n. 2, p. 565-582, 2020. DOI 10.5902/1980509837601.
» https://doi.org/10.5902/1980509837601. -
R CORE TEAM. R: a language and environment for statistical computing R Foundation for Statistical Computing. [S.l.: s.n.], 2022. https://www.r-project.org/
» https://www.r-project.org/ -
RATTER, J. A.; BRIDGEWATER, S.; RIBEIRO, J. F. Analysis of the floristic composition of the Brazilian Cerrado vegetation III: comparison of the woody vegetation of 376 areas. Edinburgh Journal of Botany, v. 60, p. 57-109, 2003. DOI 10.1017/S0960428603000064.
» https://doi.org/10.1017/S0960428603000064. -
SANTANA, J. G.; NAVES, R. V. Caracterização de ambientes de cerrado com alta densidade de pequizeiros (Caryocar brasiliense Camb.) na região sudeste do Estado de Goiás. Pesquisa Agropecuária Tropical, v. 33, n. 1, p. 1-10, 2003. https://revistas.ufg.br/pat/article/view/2380/2361
» https://revistas.ufg.br/pat/article/view/2380/2361 -
SILVA, F. H. L.; FERNANDES, J. S. C.; ESTEVES, E. A.; TITON, M.; SANTANA, R. C. Populações, genótipos e idade da planta na expressão de variáveis físicas em frutos do pequizeiro. Revista Brasileira de Fruticultura, v. 34, n. 3, p. 806-813, 2012. DOI 10.1590/S0100-29452012000300021.
» https://doi.org/10.1590/S0100-29452012000300021. -
SILVA, G. E.; GUILHERME, F. A. G.; CARNEIRO, S. E. S.; PINHEIRO, M. H. O.; FERREIRA, W. C. Heterogeneidade ambiental e estrutura da vegetação arbustivo-arbórea em três áreas de Cerrado sentido restrito no Sudoeste goiano. Ciência Florestal, v. 29, n. 2, p. 924-940, 2019. DOI 10.5902/1980509823788.
» https://doi.org/10.5902/1980509823788. -
SOARES, B. C.; SANTOS, P. H. R.; SILVA, F. H. L.; ESTEVES, E. A.; TITON, M.; FERNANDES, J. S. C. Repeatability of physical and chemical characteristics in pequi fruit. Revista Brasileira de Fruticultura, v. 39, n. 2, e-181, 2017. DOI 10.1590/0100-29452017181.
» https://doi.org/10.1590/0100-29452017181. -
VERA, R.; SOUZA, E. R. B.; FERNANDES, E. P.; NAVES, R. V.; SOARES-JÚNIOR, M. S.; CALIARI, M.; XIMENES, P. A. Caracterização física e química de frutos do pequizeiro (Caryocar brasiliense Camb.) oriundos de duas regiões no estado de Goiás, Brasil. Pesquisa Agropecuária Tropical, v. 37, n. 2, p. 93-99, 2007. https://revistas.ufg.br/pat/article/view/1833/3097
» https://revistas.ufg.br/pat/article/view/1833/3097 -
ZARDO, R. N.; HENRIQUES, R. P. B. Growth and fruit production of the tree Caryocar brasiliense in the Cerrado of central Brazil. Agroforest Systems, v. 82, p. 15-23, 2011. DOI 10.1007/s10457-011-9380-9.
» https://doi.org/10.1007/s10457-011-9380-9. - WICKHAM, H. ggplot2: Elegant Graphics for Data Analysis New York (USA): Springer-Verlag, 2016.
-
Editorial Board:
Prof. Dr. Cristiane Pedrazzi, Editor-in-ChiefProf. Dr. Dalton Righi, Associate EditorMiguel Favila, Managing Editor

 Source: CPAC Main Station (2025)
 Source: Authors (2025)
 Source: Authors (2025)