 Growth of Pinus taeda L. in the first years after high thinning
ABSTRACT:
Given the importance of managing Pinus taeda to obtain various products, observing growth and response immediately after the first interventions can help identify the ideal thinning time. This study analyzed results in the first years after two interventions in Pinus taeda plantations, considering 7 highly-selective thinning intensities and a thinning-free control treatment. The number of trees, basal area, and dominant diameters were assessed between the ages of 4 and 10 years. The dominant diameter data were statistically compared using the Scott-Knott test at 95% probability. With light thinning in the early stages, the forest reached a basal area of around 50 m²ha-1 and a dominant diameter of 25 cm at 10 years. At the same age, moderate thinning resulted in a basal area of approximately 45 m2ha-1 and up to 30 cm in dominant diameter, with values of around 35 m2ha-1 and up to 35 cm, respectively, under heavy thinning. For light thinning, the basal area that represents the greatest increase in volume is close to 45 m2ha-1 at between 4 and 5 years, while for moderate and heavy treatments, this value was reached between 5 and 6 years, with 41 and 31 m²ha-1, respectively. Moderate management allows the forest to continue developing in larger basal areas, thereby slightly delaying the next intervention without negatively affecting growth rates.
Key words:
increase; basal area; forest management
RESUMO:
Devido a importância do manejo do Pinus taeda para obtenção de diversos produtos, observar o crescimento e resposta logo após as primeiras intervenções pode identificar o momento ideal para o desbaste. Esse trabalho objetiva analisar os resultados dos primeiros anos após duas intervenções em plantios de Pinus taeda, considerando sete intensidades de desbaste seletivo alto, além de um tratamento controle sem desbaste. Foram avaliados o número de árvores, área basal e diâmetros dominantes entre a idade de quatro anos até 10 anos. Os dados de diâmetro dominante foram comparados estatisticamente pelo teste de Scott-Knott a 95% de probabilidade. Com desbastes leves nos primeiros a floresta atingiu área basal próxima de 50 m2ha-1 e 25 cm de diâmetro dominante aos 10 anos. Desbastes com intensidades moderadas, apresentaram valores de área basal com cerca de 45 m2ha-1 e até 30 cm de diâmetro dominante aos 10 anos. Já desbastes pesados atingem valores de área basal próxima de 35 m2ha-1 e até 35 cm de diâmetro dominante na referida idade. Para as intensidades de desbastes leves o valor de área basal que representa o maior incremento em volume é próximo de 45 m2ha-1 na idade entre quatro e cinco anos, para os tratamentos moderados e pesados esse valor foi atingido entre os cinco e seis anos, com 41 m2ha-1 e 31 m2ha-1. O manejo moderado permite que a floresta continue se desenvolvendo em áreas basais mais altas e possibilitando atrasar um pouco a próxima intervenção, sem influenciar na queda do incremento.
Palavras-chave:
incremento; área basal; manejo florestal
INTRODUCTION
Pinus plantations occupy approximately 1.7 million hectares in Brazil, making it an important economic activity in the southern region of the country. The largest areas of Pinus plantations are reported in the states of Santa Catarina (37.3%), Paraná (36.9%), and Rio Grande do Sul (14.9%) (IBÁ, 2024). In Santa Catarina, Pinus accounts for 67% of the state’s planted forests (ACR, 2022).
Due to the timber market’s demand for different-sized logs, these are classified into assortments based on their small-end diameter, which determines their market value (VASQUEZ et al., 2007). Larger and higher-quality logs obtained higher market prices due to more intensive management and longer rotation cycles, and are used for more valuable products, such as laminates (BONAZZA et al., 2022).
Wood production in forest plantations is generally linked to silvicultural treatments, site quality, and primarily forest density. As the number of trees in a forest increases, so does the basal area, leading to intense competition among trees and natural death, which reduces the basal area (ELESBÃO & SCHNEIDER, 2011).
Thinning is an alternative to reduce the number of trees in a forest, that is by removing certain trees, space is created for the remaining trees to grow and develop with greater potential. Thinning is classified as selective, where trees are chosen based on specific traits, or systematic, where rows of trees are removed to facilitate harvesting. Selective thinning can also be classified as either crown or low thinning, according to the quality of the trees to be removed (SMITH et al., 1997).
Crown thinning shows considerable potential since it favors the growth of the remaining trees. This intervention is based on analyzing tree crowns: when two or more dominant trees have touching crowns, indicating mutual competition, one or more must be removed to allow the remaining trees to achieve their full growth potential (DOBNER JÚNIOR et al., 2018).
SCHNEIDER (1993) explained that basal area and tree diameter are variables highly affected by stand density, as demonstrated when trees in the same diameter class quickly move into higher classes immediately after thinning. More intense thinning creates larger spaces within the forest, causing greater diameter growth compared to its lighter counterpart. However, the volume removed is often recovered. Lighter thinning tends to produce higher total forest volumes, while heavier interventions promote greater individual diameter growth (AQUINO et al., 2021; CRUZ et al., 2023).
Assessing a stand immediately after an intervention and over the following years provides greater understanding of the forest’s response over time, depending on the intervention applied, mainly in terms of optimal thinning intensities for maximizing tree volume growth (DOBNER JÚNIOR et al., 2018; NICOLETTI et al., 2022; CRUZ et al., 2023). This study demonstrated the early growth of a Pinus taeda L. plantation immediately after first and second selective thinning at 4 and 7 years old; respectively, with assessments extending to 10 years. It should be noted that this experiment, now 42 years old, has been regularly monitored since its establishment. The primary focus is to evaluate the effects of different thinning intensities in the early years, without considering possible genetic improvements, or environmental and climate changes.
MATERIALS AND METHODS
Study area
The study was conducted in the municipality of Campo Belo do Sul, in the mountainous region of Santa Catarina, within the Lages microregion. The climate is classified as Cfb according to the Köppen classification, characterized by mild summers (ALVARES et al., 2013). The study site is in the southern part of the municipality, at an altitude of 1,017 meters above sea level, near the border with Rio Grande do Sul state (Figure 1).

Location of the municipality of Campo Belo do Sul in the state of Santa Catarina and study site.
Experiment description
The Pinus taeda stand was established in 1982 with an initial density of 2,500 trees per hectare (spacing of 1.6 x 2.4 m). Four years after planting (1986), the experiment was initiated on a 6.81 ha area to assess the species’ response to different thinning intensities and determine the best management strategy. Eight treatments with two replicates were designed, containing 2,000 m² plots with 1,000 m² study areas used for measurements.
The treatments were defined according to thinning intensity at the beginning and midpoint of the production cycle, as follows: “No Thinning”, “Light”, “Light-Light”, “Moderate”, “Moderate-Light”, “Moderate-Moderate”, “Heavy-Moderate”, and “Extreme”. For example, the “Light” treatment received only light thinning at the beginning and no second intervention, whereas the “Light-Light” treatment involved light thinning at both the beginning and midpoint of the cycle. Table 1 shows the age and number of competing trees removed per treatment in the first three thinning’s.
Ages at which thinning’s were carried out and the number of competing trees removed per potential tree in each treatment.
The experiment has continued to the present day (42 years), with three more thinning conducted at 13, 18, and 29 years. Annual forest inventories were taken until age 19, and later at 29, 32, 34, 35, 38, and 40 years. Although the data have been obtained over several years of forest monitoring, this study analyzed the impact of early thinning intensities on tree development at age 10, especially on the basal area and dominant diameter.
Data measurement and analysis
Forest inventories were conducted over the years to collect dendrometric data on tree diameter (d) for all individuals of the plots, and total height (h) for dominant trees and 20% of the total number of trees in each plot.
Statistical analysis was carried out using R software in the R Studio environment. Additionally, data normality was checked and the variables compared between different treatments using the Scott-Knott test at 95% probability. The number of trees in the plots was considered as repetitions for mean comparison; thus, only tests for ungrouped variables were conducted.
Responses to the treatments were compared after the first and second thinning, by determining the number of trees, basal area per hectare, and dominant diameter. To assess the maximum volume increment in relation to basal area, variables were compared considering their values at a specific age, and equations were generated for these variables according to age. Table 2 presents the equations for each variable along with their R² values.
Equation performance was assessed based on R², with values ranging from 0.3695 to 0.9814 for the increase in basal area (G) m²ha-1 ranged, for example, and the worst fit observed for the no thinning treatment. This may be associated with greater heterogeneity in the untreated plots, resulting in lower correlations between variables (CAMPOS & LEITE, 2013), due to variation in trees with different diameters, which may contribute to a poorer fit compared to thinned plots.
RESULTS AND DISCUSSION
The number of trees in the treatments differed according to thinning intensity. The “Light” (T1) and “Light-Light” (T2) treatments removed one competing tree per dominant tree at age 4, resulting in 2,100 trees ha-1. After the first thinning, the “Light-Light” treatment removed another competing tree per dominant tree, leaving 1,717 trees ha-1. The “Moderate” (T3), “Moderate-Light” (T4), and “Moderate-Moderate” (T5) treatments removed two competing trees per dominant tree in the first thinning, maintaining 1,695 trees ha-1. In the second thinning, T4 removed an additional competing tree, reducing the number to 1,320 trees ha-1, while T5 maintained 907 trees ha-1 by removing two more competitors.
In the “Heavy-Moderate” treatment (T6), 800 trees ha-1 were selected to remain, with one competing tree removed for every two dominant trees in the second thinning, leaving 777 trees ha-1. In the “Extreme” treatment (T7), after the dominant trees were selected, all competing trees were removed, resulting in 400 trees ha-1. Figure 2 presents a line graph illustrating the number of trees per treatment over the years.

Number of trees per hectare in the first 10 years, divided into light treatments (left), moderate treatments (center), and heavy treatments (right). Where: T0 = No thinning; T1 = Light; T2 = Light-Light; T3 = Moderate; T4 = Moderate-Light; T5 = Moderate-Moderate; T6 = Heavy-Moderate; T7 = Extreme.
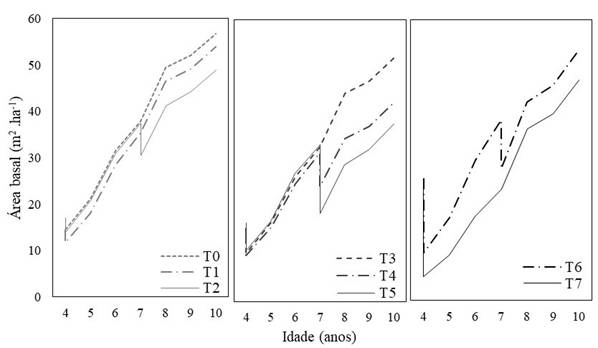
Another variable affected by the number of trees was basal area, as shown in figure 3. In the fourth year of the forest, all treatments started with 17 m² ha-1 of basal area. For the light treatments, the first thinning reduced basal area by 3 m² ha-1 (18%). By the seventh year, all treatments reached approximately 36 m² ha⁻¹, but after the second thinning, “Light-Light” (T2) declined to 30 m² ha-1. At 10 years, the “No Thinning” treatment (T0) reached a basal area of 57 m² ha-1, “Light” (T1) 54 m² ha-1, and T2 49 m² ha-1. In these treatments, one year after the first thinning, the forest had already recovered its initial basal area (17 m² ha-1), which had doubled three years after thinning.

Basal area (m²) per hectare in the first 10 years, divided into light (left), moderate (center), and heavy treatments (right). Where: T0 = No thinning; T1 = Light; T2 = Light-Light; T3 = Moderate; T4 = Moderate-Light; T5 = Moderate-Moderate; T6 = Heavy-Moderate; T7 = Extreme.
Moderate treatments experienced a decline in basal area to 11 m2 ha-1 (36%) after the first thinning. By age 7, basal area reached ~33 m2 ha-1, that is, doubling the initial area. After the second intervention, the “Moderate-Light” treatment (T4) was reduced to 24 m2 ha-1 (28%), while “Moderate-Moderate” (T5) reached 19 m² ha-1 (42%). At age 10, T3 exhibited a basal area of 52 m² ha-1, similar to the light treatments, T4 reached 42 m2 ha-1, and T5 38 m² ha-1. Although, the basal area was about 40% smaller, it recovered again three years after thinning. For the heavy treatments, “Heavy-Moderate” (T6) experienced a 10 m² ha-1 basal area reduction (60%) in the first intervention, reaching 7 m2 ha-1. The “Extreme” treatment (T7) decreased the basal area to 3 m2 ha-1 (82%) after the first thinning and reached 16 m² ha-1 by age 7, thus recovering its initial basal area in three years and reaching 31 m2 ha-1 by age 10, doubling the initial area. At age 7, T6 reached 26 m2 ha-1 and declined again to 19 m² ha-1, reaching 36 m² ha-1 at 10 years.
According to MAINARDI et al. (1996), the ideal basal area for forest intervention in Pinus is around 40 m² ha-1 in order to obtain a competition-free value of 25 m2 ha-1. In the first thinning at age 4, no site achieved a basal area of 40 m² ha-1, demonstrating that the first thinning was performed too early.
Figure 4 allows an analysis of dominant diameter over time. At age 7, three years after the first thinning, the light treatments (T1 and T2) exhibited dominant diameters starting at 12 cm and reaching about 20 cm, while their moderate counterparts (T3, T4, and T5) ranged from approximately 12 to 22 cm, that is, a 10 cm increase over three years.
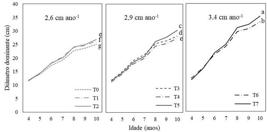
Dominant diameters for each treatment in the initial years after the first and second thinning’s, divided into light (left), moderate (center), and heavy treatments (right), along with the increment of the variable and Scott-Knott test (means followed by the same letter do not differ statistically at 95% probability). Where: T0 = No thinning; T1 = Light; T2 = Light-Light; T3 = Moderate; T4 = Moderate-Light; T5 = Moderate-Moderate; T6 = Heavy-Moderate; T7 = Extreme.
By comparison, more intense thinning (T6 and T7) produced greater variation in early plantation growth, starting from 12 cm and reaching approximately 25 cm, increasing by more than 10 cm in the first few years, growing about 4.3 cm per year until age 7. Like moderate treatments, there was a slight difference between treatments in the first year of analysis, but after the first thinning, an immediate response was observed in T7, which removed all competing trees, as confirmed between the 5th and 6th years, when this treatment exceeded the growth observed in T6.
According to DOBNER JÚNIOR et al. (2018), who also studied a Pinus taeda plantation with different thinning intensities, when thinning is applied to a stand at age 5 and with around 32 m2 ha-1 of basal area, an immediate increase in dominant tree diameter occurs when two or more competitors are removed.
A comparison between the first years after the second thinning, from ages 7 to 10, revealed that dominant diameters grew less compared to the period immediately after the first thinning. The “No Thinning” treatment differed significantly from the others from the second thinning onwards, primarily when compared to treatments with higher intensities. NICOLETTI et al. (2022) observed that the first thinning of four Pinus species in Santa Catarina favored tree growth only from the second year onwards, since no significant growth gains were observed in the first year after thinning.
Figure 4 also shows that after the second thinning at age 7, the light treatments grew about 6 cm until age 10, as did the moderate treatments T3 and T4, reaching a diameter of 27 cm, growing an average of approximately 2.9 cm per year. T5 showed slightly higher growth (approximately 3.4 cm per year), with the removal of two more competitors immediately boosting its growth when compared to the other moderate treatments.
For the more intense treatments, growth reached 3.4 cm per year, with dominant diameters up to 10 and 5 cm larger by age 10 than those of the light and moderate thinning treatments, respectively, while the “Extreme” treatment (T7) reached a dominant diameter of 35 cm. The “Heavy-Moderate” treatment (T6) had a diameter approximately 3 cm smaller than that of T7 at age 10, indicating that the second thinning did not significantly influence the remaining trees. According to DOBNER JÚNIOR et al. (2018), trees submitted to heavy thinning obtain the highest increases for at least 10 years after the first intervention, as observed in the present study. The author also found a 60% increase in diameter growth immediately after heavy thinning, compared to that observed in unthinned stands. NICOLETTI et al. (2022) reported a 30% increase in growth from the second year after the first thinning, while a 40% increase was observed in the present study. This discrepancy may be due to the different ages evaluated, given that late thinning has a direct influence on tree growth.
A comparison between basal area data and dominant diameter reveals that after heavy thinning, forests show significant differences two years later, as observed for T5 at age 9, and T6 and T7 at age 6. Additionally, light or moderate thinning may produce results similar to those in unthinned forests during the first few years. However, when heavy thinning is applied to a young forest, diameter growth increases, as observed in T5.
Another noteworthy aspect is the decline in diameter growth when the basal area in the forest is greater than 30 m² ha-1, indicating the presence of competition, as demonstrated by the behavior of the light treatments T3 and T4, from age 6 onwards. ASSMANN (1970) determined that the ideal basal area for Pinus forests is between 21 and 25 m2 ha-1, with any excess to be removed. ELESBÃO & SCHNEIDER (2011) recommend thinning when the basal area reaches 45 m2ha-1, reducing it 28 m2ha-1.
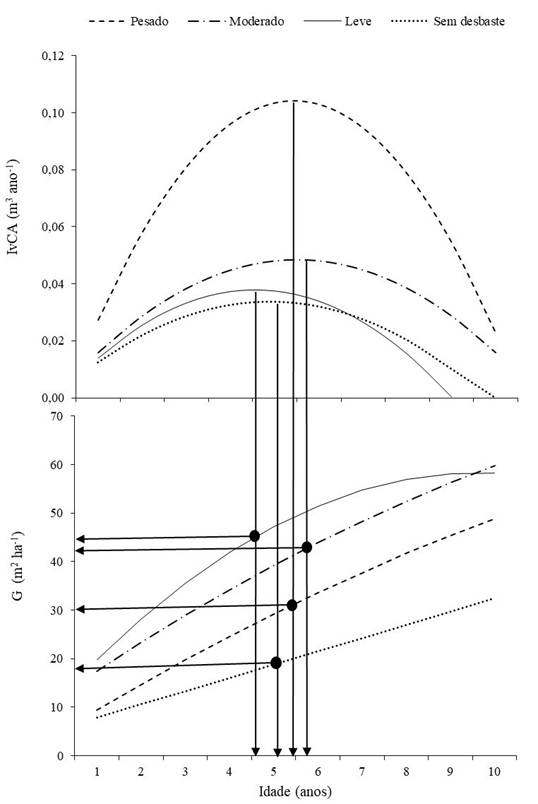
In order to determine the basal areas with the maximum volume increases, both variables were analyzed with their respective ages (Figure 5). Data were grouped into “No Thinning”, “Light”, “Moderate” and “Heavy” treatments using average values for each intensity, considering the first and second thinning. For the light treatments, the maximum increase occurred when the basal area was between 42 and 47 m2ha-1, reaching 0.038 m3 between 4 and 5 years. “No Thinning” showed the highest increase when the basal area reached 18 m2ha-1, with a maximum of 0.034 m3 at 5 years.
Current Annual Increase in individual volume (m3) and basal area (m2ha-1) in relation to age.
The “Moderate” treatments achieved their maximum increase of 0.048 m³ between 5 and 6 years, when the basal area was between 39 and 44 m2ha-1. The “Extreme” treatment reached its maximum (0.103 m3) for basal areas of 29 to 33 m2ha-1, similar to the “Moderate” treatments (between 5 and 6 years).
Thus, different basal area ranges are ideal for volume development in a Pinus plantation, depending on the thinning intensity. Under light thinning, the increase is reached earlier than in other treatments, given that basal area is not significantly affected by thinning, and very large basal areas are reached at the maximum increase in individual volume, similar to the thinning thresholds recommended by ELESBÃO & SCHNEIDER (2011) and MAINARDI et al. (1996). The moderate treatments also exhibited peak growth at high basal areas, but took slightly longer to reach this peak due to the second thinning at 7 years and moderate thinning intensity. As previously mentioned, second moderate thinning’s maintain volume growth, explaining why the lower increase is not abrupt in this case.
In heavy thinning treatments, the greater intensity meant that maximum volume increase was reached at the same time as the moderate treatments. Moreover, volume increased significantly after reaching low basal area values.
According to ASSMANN (1970), young stands respond better to improved forest conditions due to the reduction in competition among trees, which consequently results in increased volume growth. The author referred to this process as the “acceleration of the natural growth process,” which causes the volume increase to culminate earlier (DOBNER JÚNIOR et al., 2018). However, ASSMANN (1970) observed that after this effect, the increase declines, as seen in this study in the ensuing years, even with another thinning at age 7.
CONCLUSION
The “Extreme” thinning treatment, compared to its “No Thinning” counterpart, represents a 40% increase in dominant diameter. Individual volume increase reaches 300%.
For heavy thinning, the maximum volume increase was found with a basal area of 30 m² ha-1. Light and moderate treatments reached their maximum increase with a basal area of around 43 m² ha-1, demonstrating greater tolerance to competition.
ACKNOWLEDGMENTS
We thank the company that owns the study area for providing data for this research, the Programa de Apoio à Pesquisa (PAP), Universidade do Estado de Santa Catarina (UDESC) and Forest Resources Management Research Group, Fundação de Apoio à Pesquisa Científica e Tecnológica do Estado de Santa Catarina (FAPESC) FAPESC Process 829/2023, Grant Award Np.: 2023TR000262.
REFERENCES
-
ALVARES, C. A. et al. Koppen’s climate classification map for Brazil. Meteorologische Zeitschrift, v.22, n.6, p.711-728. 2013. Available from: <Available from: https://doi.org/10.1127/0941-2948/2013/0507 >. Accessed: Apr. 04, 2024. doi: 10.1127/0941-2948/2013/0507.
» https://doi.org/10.1127/0941-2948/2013/0507.» https://doi.org/10.1127/0941-2948/2013/0507 -
AQUINO, P. S. R. et al. Effect of spacing on initial growth and production of Eucalyptus in a systemic “Fan-Shaped” design. Floresta, v.51, n.1, p.099-108, 2021. Available from: <Available from: https://doi.org/10.5380/rf.v51i1.67390 >. Accessed: Sept. 17, 2024. doi: 10.5380/rf.v51i1.67390.
» https://doi.org/10.5380/rf.v51i1.67390.» https://doi.org/10.5380/rf.v51i1.67390 - ASSMANN, E. The Principles of Forest Yield Study. München: BLV, 1970. 490 p.
-
ACR. Anuário estatístico de base florestal para o estado de Santa Catarina 2022 (ano base 2021). Lages, 2022. Available from: <Available from: https://acr.org.br/portfolio/titulo-anuario-estatistico-de-base-florestal-para-o-estado-de-santa-catarina-autor-associacao-catarinense-de-empresas-florestais-acr/ >. Accessed: Apr. 04, 2024.
» https://acr.org.br/portfolio/titulo-anuario-estatistico-de-base-florestal-para-o-estado-de-santa-catarina-autor-associacao-catarinense-de-empresas-florestais-acr/ -
BONAZZA, M. et al. Efeito da idade, sortimento e tempo de estocagem na densidade verde da madeira de Pinus taeda L. Ciência Florestal, v.32, p.735-756, 2022. Available from: <Available from: https://doi.org/10.5902/1980509848083 >. Accessed: Apr. 04, 2024.doi: 10.5902/1980509848083.
» https://doi.org/10.5902/1980509848083.» https://doi.org/10.5902/1980509848083 - CAMPOS, J. C. C.; LEITE, H. G. Mensuração florestal: perguntas e respostas. 4.ed. Viçosa, MG: Universidade Federal de Viçosa, 2013. 605p.
-
CRUZ, G. S. et al. Características dendrométricas de um povoamento de Pinus taeda L. submetidos a diferentes regimes de manejos. Revista em Agronegócio e Meio Ambiente - RAMA, v.16, n.4, p.e11305, 2023. Available from: <Available from: https://doi.org/10.17765/2176-9168.2023v16n4e11305 >. Accessed: Sept. 17, 2024. doi: 10.17765/2176-9168.2023v16n4e11305.
» https://doi.org/10.17765/2176-9168.2023v16n4e11305.» https://doi.org/10.17765/2176-9168.2023v16n4e11305 -
DOBNER JÚNIOR, M. et al. Influence of crown thinning on radial growth pattern of Pinus taeda in southern Brazil. New Forests, v.50, p.437-454, 2018. Available from: <Available from: https://link.springer.com/article/10.1007/s11056-018-9669-x >. Accessed: Sept. 17, 2024. doi: 10.1007/s11056-018-9669-x.
» https://doi.org/10.1007/s11056-018-9669-x.» https://link.springer.com/article/10.1007/s11056-018-9669-x -
ELESBÃO, L. E. G; SCHNEIDER, P. R. Produção de Pinus taeda L. em povoamento desbastado na região dos Campos de Cima da Serra, Rio Grande do Sul. Ciência Florestal, Santa Maria, v.21, n.1, p.119-124, 2011. Available from: <Available from: https://doi.org/10.5902/198050982754 >. Accessed: Apr. 04, 2024. doi: 10.5902/198050982754.
» https://doi.org/10.5902/198050982754.» https://doi.org/10.5902/198050982754 -
IBÁ. Relatório Anual 2024 (Ano base 2023). Brasília, 2024. Available from: <Available from: https://iba.org/relatorio2024.pdf >. Accessed: Oct. 07, 2024.
» https://iba.org/relatorio2024.pdf -
MAINARDI, G. L. et al. Produção de Pinus taeda L. na região de Cambará do Sul, RS. Ciência Florestal, v.6, n.1, p.39-52. 1996. Available from: <Available from: https://doi.org/10.5902/19805098324 >. Accessed: Apr. 04, 2024. doi: 10.5902/19805098324.
» https://doi.org/10.5902/19805098324.» https://doi.org/10.5902/19805098324 -
NICOLETTI, M. F. et al. Influência do primeiro desbaste no crescimento de quatro espécies do gênero Pinus. Revista em Agronegócio e Meio Ambiente - RAMA, v.15, n.1, p.e8883, 2022. Available from: <Available from: https://doi.org/10.17765/2176-9168.2022v15n1e9527 >. Accessed: Sept. 17, 2024. doi: 10.17765/2176-9168.2022v15n1e9527.
» https://doi.org/10.17765/2176-9168.2022v15n1e9527.» https://doi.org/10.17765/2176-9168.2022v15n1e9527 - SCHNEIDER, P. R. Introdução ao manejo florestal. 1. ed. Santa Maria: UFSM, 1993. v.1. 435p.
- SMITH, D. M. et al. The practice of silviculture: applied forest ecology. New York: J. Wiley, 1997. 537 p.
-
VASQUEZ, A. G. et al. Uma síntese da contribuição do gênero Pinus para o desenvolvimento sustentável no Sul do Brasil. Floresta, v.37, n.3, p.445-450, 2007. Available from: <Available from: http://dx.doi.org/10.5380/rf.v37i3.9941 >. Accessed: Apr. 04, 2024. doi: 10.5380/rf.v37i3.9941.
» https://doi.org/10.5380/rf.v37i3.9941.» http://dx.doi.org/10.5380/rf.v37i3.9941
Edited by
-
Editors
Alessandro Dal’Col Lúcio (0000-0003-0761-4200) João Azevedo (0000-0002-3061-8261)