
 Primary Health Care teams and facilities map: a tool for planning and management
Abstract
Primary Health Care (PHC) is responsible for organizing the care networks of the Unified Health System (SUS), and with advances in digital health and investments from the Ministry of Health, tools have been developed to support PHC management. This article presents the “PHC Teams and Facilities Map” a publicly accessible tool developed by the Monitoring and Evaluations Coordination of the Secretariat of Primary Health Care of the Ministry of Health. The platform allows visualization of the territorial distribution of Basic Health Units and teams through five thematic maps: demography, teams, coverage, rurality, and dengue. Public data from the Health Information System for Primary Care; the National Registry of Health Establishments; the Brazilian Institute of Geography and Statistics; as well as geological risk information from the Geological Survey of Brazil, and information on areas from the National Foundation for Indigenous Peoples and the National Institute for Colonization and Agrarian Reform were used. The initiative seeks to promote greater transparency and support in decision-making, and could become a valuable strategy in the primary health care planning process.
Key words:
Primary Health Care; Basic Health Unit; Digital Health; Geographic Mapping
Resumo
A Atenção Primária à Saúde (APS) é responsável pela organização das redes de atenção do Sistema Único de Saúde, e com os avanços da saúde digital e investimentos do Ministério da Saúde, ferramentas vêm sendo desenvolvidas para apoiar a gestão da APS. Este artigo apresenta o “Mapa das Unidades Básicas de Saúde da APS”, ferramenta de acesso público, elaborada por uma Coordenação Geral da Secretaria de Atenção Primária à Saúde do Ministério da Saúde. A plataforma permite a visualização da distribuição territorial das Unidades Básicas de Saúde e das equipes por meio de cinco mapas temáticos: demografia, equipes, cobertura, ruralidade e dengue. Foram utilizados dados públicos do Sistema de Informação em Saúde para Atenção Básica; do Cadastro Nacional de Estabelecimentos de Saúde; do Instituto Brasileiro de Geografia e Estatística; além de informações de riscos geológicos do Serviço Geológico do Brasil, e sobre áreas da Fundação Nacional dos Povos Indígenas e do Instituto Nacional de Colonização e Reforma Agrária. A iniciativa busca promover maior transparência e apoio na tomada de decisões, e pode se tornar uma estratégia valiosa no processo de planejamento em saúde da APS.
Palavras-chave:
Atenção Primária à Saúde; Unidade Básica de Saúde; Saúde Digital; Mapeamento Geográfico
Resumen
La Atención Primaria de Salud (APS) es responsable de organizar las redes de atención del Sistema Único de Salud (SUS). Gracias a los avances en salud digital y a las inversiones del Ministerio de Salud, se han desarrollado herramientas para apoyar su gestión. Este artículo presenta el “Mapa de Unidades Básicas de Salud de la APS”, una herramienta de acceso público desarrollada por la Coordinación General de la Secretaría de Atención Primaria de Salud del Ministerio de Salud. La plataforma permite visualizar la distribución territorial de las Unidades Básicas de Salud y los equipos mediante cinco mapas temáticos: demografía, equipos, cobertura, ruralidad y dengue. Se utilizaron datos públicos del Sistema de Información en Salud para la Atención Primaria; el Registro Nacional de Establecimientos de Salud; el Instituto Brasileño de Geografía y Estadística; así como información sobre riesgos geológicos del Servicio Geológico de Brasil e información sobre áreas de la Fundación Nacional para los Pueblos Indígenas y el Instituto Nacional de Colonización y Reforma Agraria. La iniciativa busca promover una mayor transparencia y apoyo en la toma de decisiones, y podría convertirse en una estrategia valiosa en el proceso de planificación de la atención primaria de salud. Palabras clave: Atención Primaria de Salud, Unidad Básica de Salud, Salud Digital, Cartografía Geográfica.
Palabras clave:
Atención Primaria de Salud; Unidad Básica de Salud; Salud Digital; Cartografía Geográfica
Introduction
Primary Health Care (PHC) is the main gateway to the Brazilian Unified Health System (SUS) and is responsible for coordinating care and organizing health care networks1. Essential attributes must be considered for effective PHC functioning, namely: preferred first contact, continuous responsibility for the user, comprehensive care, and coordinated actions and services. Likewise, it is essential to consider the derivative attributes, such as family orientation, community orientation, and cultural competence, which are especially relevant in the Brazilian context, given the territorial and sociocultural heterogeneity of municipalities2.
Furthermore, the territory where a society lives should not be understood merely as a geographic space but as an expression of the social, environmental, and institutional relationships that shape vulnerabilities, inequalities, and care flows3. Organizing territorial information through tools such as maps and geotechnologies enables the generation of detailed data, revealing patterns that support decision-making and health management4.
For example, in Brazil, Rio de Janeiro shows how digital tools can support PHC’s territorial organization. In 2015, the municipality developed the “Onde Ser Atendido” (“Where to Receive Care”) tool, which territorializes the entire population and automatically informs users of their reference PHC unit, integrating with the National Regulation System to support access, scheduling, and user follow-up. This digital arrangement helps reduce unnecessary travel, improve care flows, and strengthen care coordination based on territory5.
Similarly, at the international level, the United Kingdom’s initiatives stand out, where the strategic plan “Fit for the Future: 10-Year Health Plan for England” establishes digitalization as a central axis for reorganizing PHC by integrating population data, a single health record, artificial intelligence, and the NHS App as the main digital gateway to care, articulated with the territorial model that organizes the health system6.
In light of the above, monitoring actions and services are essential to ensure equity, comprehensiveness, and problem-solving capacity in PHC. To improve management and continued care for the population, investing in strategies that strengthen the integration of PHC information is important. Technological solutions have enhanced the quality of health data records and their use.
Digital health is a strategic tool for strengthening the SUS, promoting greater efficiency, equity, and integration of health services. According to the World Health Organization (WHO), it encompasses using information and communication technologies (ICTs) to improve people’s health and system performance7. In recent years, the Ministry of Health increased investments, with the allocated budget growing by approximately 50% between 2013 and 2023, reaching BRL 1.08 billion in 20238.
One key initiative for integrating health information in Brazil is Meu SUS Digital. This strategy promotes continued user care in PHC, transparency, and information security. The platform is supported by the National Health Data Network (RNDS), which is the national interoperability backbone. RNDS makes information access in SUS more agile and integrated9.
Following the Digital Health Strategy for Brazil 2020-2028 and the National Health Information and Informatics Policy, the Ministry of Health launched a new digital tool. This tool shows the georeferenced locations of PHC Units (UBS) and their teams. It also simulates coverage by census tract. This study aims to present this tool, developed by the General Coordination for Monitoring, Evaluation, and Analytical Intelligence of the Secretariat of Primary Health Care of the Ministry of Health (CGMAIA/SAPS/MS) in 2024.
Methods
This methodological study describes the creation of the “Map of PHC Units”. It is an interactive geolocation tool for PHC management within SUS, developed by CGMAIA/SAPS/MS. The tool was presented to the Tripartite Working Group on Health Information and Informatics. This group considered it a relevant strategy for sharing information within SUS.
Thematic maps combined demographic, registry, and territorial information. Five types of interactive maps were created: three are published (demographic, teams, and coverage) and two are in beta testing (rurality and dengue). All maps were built using open data from the Federal Government.
The tool is open source, and its code is available in a public GitHub repository (https://github.com/ms-cgmaia/mapas). Anyone can access, modify, and reuse the maps in HTML format. This format allows local adaptation and does not require server setup. The online version is hosted by the Center for Scientific Computing and Free Software at the Federal University of Paraná (C3SL/UFPR) and is publicly accessible at https://mapas.sus.c3sl.ufpr.br. The published maps include demographics, teams, and coverage. The rurality and dengue maps are on GitHub and awaiting approval for publication at the same site.
Python v3 was used for data processing and creating the maps. Because the maps are preprocessed, users do not need Python knowledge or setup. The maps can run in any Internet browser, on a local network, or from a USB flash drive.
To set each unit’s coordinates, several geospatial data were loaded. These included municipal polygons, urban center reference points, and the coordinates of health facilities from the National Register of Health Establishments (CNES)10. A second database with corrected coordinates was also used. These corrected coordinates were obtained by geocoding CNES addresses and analyzing satellite images.
To mitigate the problem of low-accuracy CNES coordinate records that do not correspond to the actual location of UBS, the coordinates were replaced with manually validated values. UBS, whose location lies outside the territorial limits of the municipality in which they are registered, is relocated to the municipality’s central reference point. These units receive the marker “Original coordinate outside the municipality,” in order to facilitate subsequent correction by local management.
Demographic Map
The Demographic Map uses 2022 Demographic Census tracts from the Brazilian Institute of Geography and Statistics (IBGE) as territorial units11. Various population density transformations were tested. A square-root transformation was chosen for better visualization due to large differences in census tract values across Brazil. The transformed values are grouped and shown with a color scale from yellow to red.
Territorial classifications followed IBGE’s typology. “Detailed situation” has two main categories: urban areas and rural agglomerations. The urban group includes areas with high and low building density in cities or towns, and urban nuclei. The rural group comprises rural clusters like settlements, rural nuclei and hamlets, water bodies, and rural areas.
“Tract type” was defined as follows: non-special tracts; favelas and urban communities; barracks and military bases; lodgings or camps; tracts with few households; Indigenous groupings; prison units; convents, hospitals, long-term care institutions for older adults (LTCI), or institutions providing shelter for children and adolescents; agrovillages from settlement projects; and quilombola groupings. Demographic density on the map is labeled as “Resident population”. This is calculated from Census results, adding up the total people by tract for all of Brazil.
The Geological Risk Area Cartography is also part of the Demographic Map. This study by the Geological Survey of Brazil identifies and describes municipalities at risk of loss or damage from adverse geological events. The study follows the National Policy for Protection and Civil Defense (Law No. 12,608/2012). Its main goal is to support better decisions in territorial planning and disaster prevention12.
Teams Map
The Teams Map shows the composition, output, and territorial distribution of PHC health teams throughout Brazil. The data are georeferenced by UBS. Team output and registries derive from SISAB. Team type and staff links originate from CNES.
Teams were classified by functional type, represented by a specific icon. The categories are: Family Health team (eSF); Riverside Family Health team (eSFR); Oral Health team (eSB); Multiprofessional team (eMulti); Prison Primary Care team (eAPP); traditional Primary Care team (eAP); and Street Clinic team (eCR).
To identify reference UBS, the following types were considered according to the classification of health establishments in CNES: health post; health center/PHC unit; mixed unit; fluvial mobile unit; land mobile unit; and Family Health support center.
Coverage Map
The Coverage Map presents a simulation of potential PHC coverage based on the registry parameter of health teams linked to UBS, as defined by Ordinance No. 3,493 of April 10, 202413. The model was built using population data from the 2022 Demographic Census.
The methodology consists of progressively allocating the population of census tracts to UBS until the estimated service capacity of the linked teams is reached. The coverage simulation adopted the distances between census tract centroids and the UBS location point. For this purpose, a model was adopted that segments tracts into bands of increasing distance, configuring concentric rings of progressive reach. A limitation of the coverage simulation is that the operation of teams or units is restricted to resident population data from the respective municipality.
In municipalities in the Legal Amazon region, given access particularities such as travel via waterways, the use of boats, and available eSFRs, the population catchment limit was expanded to up to 32 km. This extension seeks to represent the reality of the territorial context and the travel times characteristic of the region.
Population allocation considers that residents in areas closer to the UBS, within smaller radii, have greater care coverage. The model uses a simplified approach inspired by the gravitational effect, assuming that the probability of access and coverage decreases with increasing distance, thereby providing a more realistic representation of physical accessibility.
The UBS can capture 100% of the population of the census tracts included in each distance band sequentially until its maximum service capacity is reached. If this limit is reached within a given radius, the remaining population in that band is allocated proportionally and in a weighted manner, respecting the existing excess demand and the population of each census tract reached.
The resulting coverage percentage is obtained from the proportion of the resident population allocated to a UBS against the total number of inhabitants in the census tract. Thus, tracts with unallocated population because the registry parameter has been exhausted are deemed uncovered in the simulation.
Importantly, allocation was carried out by grouping data by municipality; that is, each census tract can be covered only by a UBS located within the same municipality. This limitation reflects formal administrative boundaries, but it may underestimate actual coverage as perceived by the population in areas along municipal borders.
For each UBS, data from all teams associated with it were aggregated in order to compose the analytical parameters used on the platform. The following parameters were considered:
-
1) Registry parameter defined in GM/MS Ordinance No. 3,493/202413;
-
2) Previous links, according to Ordinance No. 2,979/201914;
-
3) Linked registrations with registration updated in the last 24 months, according to SAPS Ordinance No. 161/202415;
-
4) Persons followed: corresponding to the total number of registered persons who were effectively followed and had more than one contact with a health professional over 12 months, one of which was an individual, collective, or home-based encounter.
Additional maps under development
Additional maps are under development and are already available in the project repository on GitHub and undergoing internal approval within SAPS/MS before official publication. There are two such maps: the rurality map and the dengue map. The rurality map consists of an overview of land use and land cover by census tract, identifying areas classified as urban, rural, or natural and their distribution, including the delimitation of Indigenous lands, quilombola, traditional communities, and rural settlements. The second map, of acute dengue cases, is delivered as a dynamic heat map (animated heatmap), allowing monitoring of the increase in incidence in specific localities and of the spatial spread of the disease over time, favoring the identification of transmission patterns and critical areas that require prioritization of surveillance and control actions, and serving as a prototype for the monitoring of acute infectious diseases and disasters. The technical documentation for these maps can be consulted in the project repository.
Results
Regarding the results, the tool’s interactive visualizations and functionalities are shown below, organized by topic according to the maps already published: demographics, teams, and coverage.
Tool visualization
Upon accessing the website, users can view a central menu with the three types of maps available for selection. Each type of map presents specific information, detailed in a brief description in the lower right corner, marked by a blue-and-white (i) icon. Among the tool’s functionalities, the state and health macro-region filters, zoom control, and management of visualization layers stand out.
When a federative unit (state) is selected from the drop-down menu, the system automatically filters the corresponding health macro-regions and presents data aggregated by municipality. When a health macro-region is selected, the visualization is refined, and the data are displayed at the census tract scale, according to the official IBGE division.
Demographic Map visualization
In the Demographic Map, when a state is selected, the information presented refers specifically to the municipalities of that federative unit. When a health macro-region is selected, the data are detailed by census tract, which is the territorial reference unit used for Census data collection.
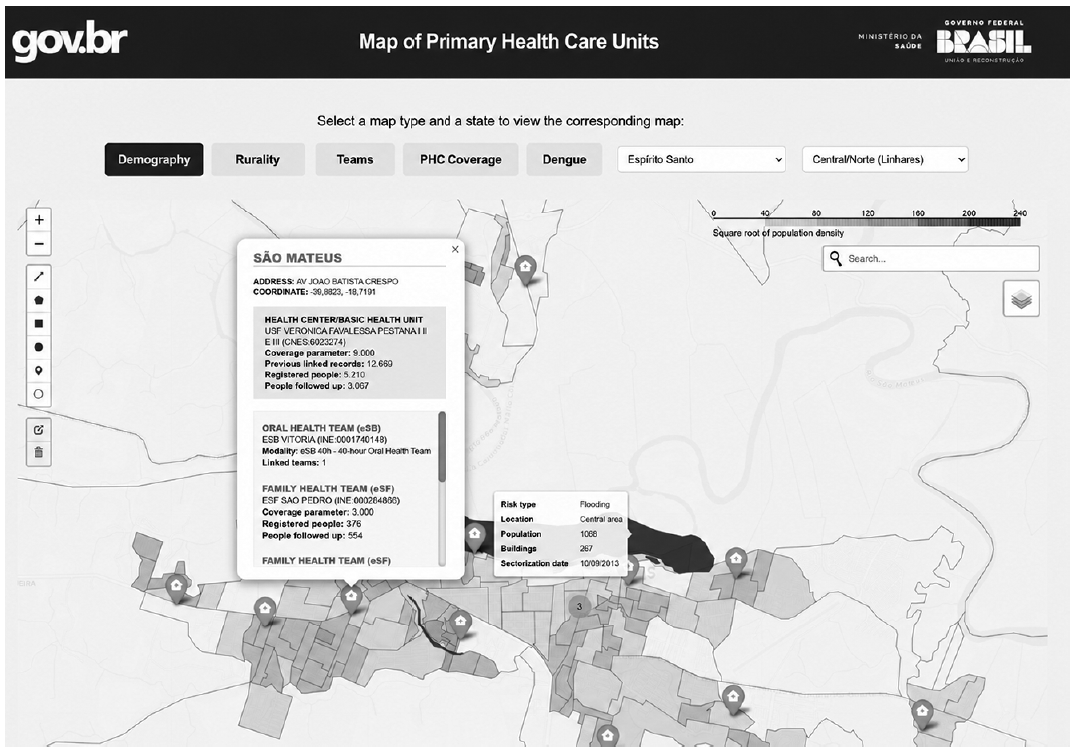
When zooming out to view an entire state, it is possible to identify the UBS. When isolated, the unit icon appears individually. When there are multiple UBS located close to one another in the same region, they are represented as clusters in circles containing the number of units in that geographic space. When clicking on a UBS, details such as address, total number of registered persons, linked persons, and the registry parameter by establishment and by team are displayed (Figure 1).
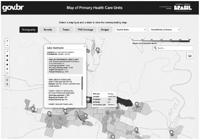
The demographic map also contains details on geological risks, reporting the risk types, the number of buildings, the population at risk, and the date of sectorization by the Brazilian Geological Society (SBG).
Teams Map visualization
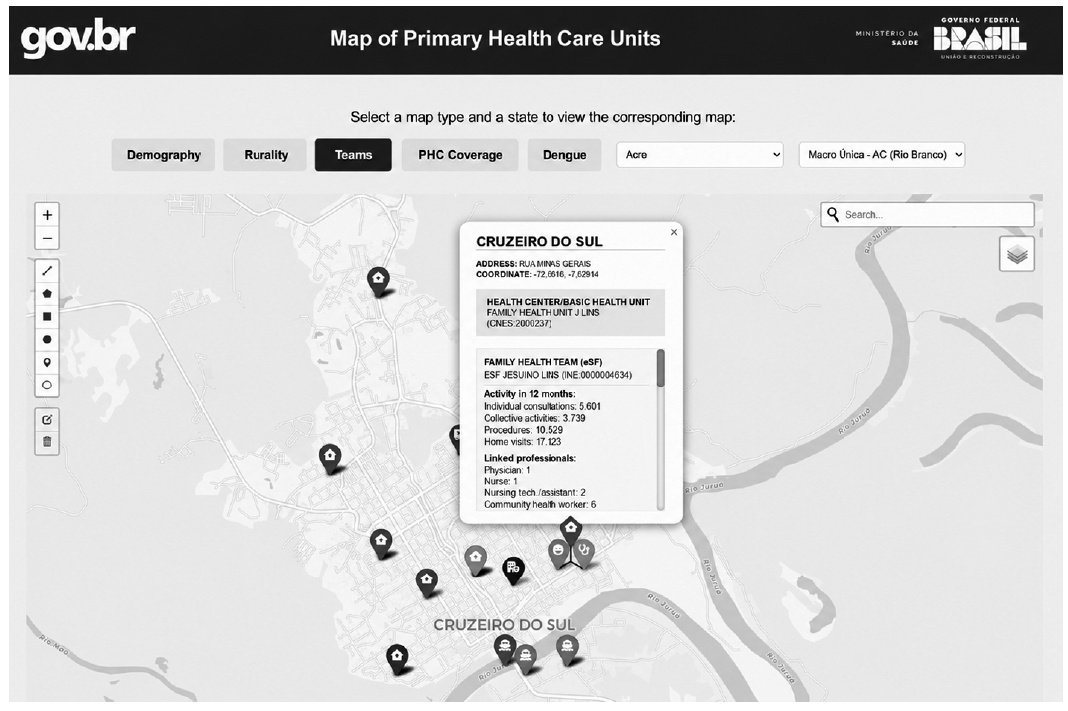
The Teams Map visualization presents the spatial distribution of health units in the region, with data grouped by team type and professionals unlinked to teams. When a marker on the map is selected, details of annual output are also displayed, including individual care sessions, group care sessions, home visits, and the number of linked professionals, according to CNES records.
The colors and icons used on the map differentiate team types and facilitate visual identification. Specific icons represent modalities with distinct operational characteristics, such as the boat symbol used to represent riverside teams or fluvial mobile units and the vehicle symbol used for Street Clinic teams (eCR) (Figure 2).
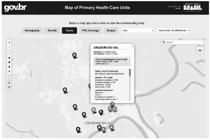
This visual differentiation allows faster interpretation of team distribution and facilitates communication with local managers, especially in contexts where care logistics and access to the population require differentiated strategies.
Coverage Map visualization
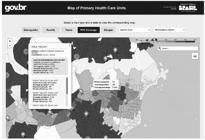
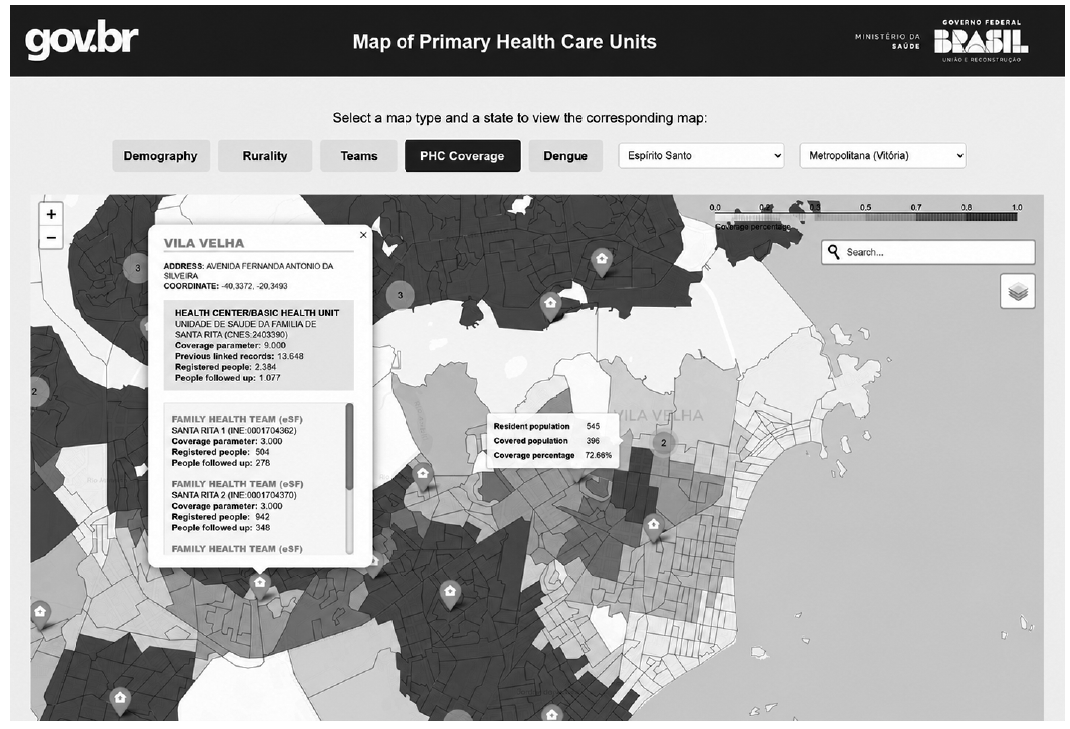
The Coverage Map visualization identifies areas with potential overload of health teams, whether due to high population density or low team supply in the region. The representation expresses a coverage simulation rather than the actual territorial assignment of units, estimating the capacity to absorb demand in different contexts.
When interacting with census tracts on the map, information is displayed on the resident population, according to Demographic Census data, as well as on the estimated potential coverage calculated based on distance to health units and the number of adjacent teams. This estimate reflects the spatial distribution of demand and primary care supply in each tract, considering criteria of proximity and installed capacity (Figure 3).
Discussion
The use of visual communication tools in public health has grown significantly, with particular prominence during the COVID-19 pandemic, facilitating an accessible and intuitive understanding of complex information. These tools contribute to clearer data dissemination and assist policymakers in developing evidence-based strategies, promoting more informed and effective decisions16. A systematic review also identified that data visualizations can increase the amount of information provided and reduce the cognitive and intellectual burden required to interpret it17.
This article presented a new tool that enables the visualization of interactive maps, aggregating population and territorial information, team types, and PHC coverage estimates. This innovation is yet another significant advance for SUS management by enabling, through data visualizations, greater transparency, more precise territorial planning, and support for evidence-based decision-making. Moreover, it expands Digital Health in public health management and aligns with previous initiatives within the SUS.
The SUS is recognized as the largest universal public health system in the world, offering universal coverage to a population marked by regional, social, territorial, and health inequalities. In this context, the size of the country and its diversity represent ongoing challenges for health planning and management. The innovation of using the census grid as the basis for georeferenced visualization tools, as in the tool presented here, represents a fundamental strategy for constructing more detailed and accurate representations of territory. In addition, local managers who identify units georeferenced in locations that differ from their actual address can correct the information in CNES, thereby contributing to improved data quality.
The concept of territory has changed over the years and may be characterized according to its natural elements and human constructions within a geographic boundary. In the health field, the complexities and singularities of territories, such as demographic, epidemiological, economic, social, cultural, and political profiles, are considered to guide planning and actions in health18. The use of Geographic Information Systems (GIS) in the health context has generated significant impacts by allowing the integration of data from different sources, which contributes to improving the visualization, management, and analysis of health information19.
The organization of PHC into regions, networks, and health territories streamlines resource management, integrates services, and ensures health responses contextualized to the needs of the assigned population20. The public availability of the Map of UBS, as a territorial intelligence tool, gives concrete expression to the principles of active transparency and social participation established in the 1988 Federal Constitution and the Access to Information Law.
By expanding access to georeferenced information for PHC professionals, managers, and users, the tool operates in three complementary dimensions: empowerment of health workers, who can contextualize their practices based on accurate data on coverage and territorial vulnerabilities; qualification of local management by offering support for microterritorial planning; and strengthening of social oversight by allowing the population to track service distribution and claim their health rights.
The provision of health services in rural areas faces unique challenges, ranging from geographic accessibility to the cultural adequacy of services to population needs21,22. Studies to incorporate dimensions specific to the reality of rural populations, focusing on quilombola groupings, Indigenous peoples, and agrovillages from settlement projects, are under development in the rurality map.
The integration of information on the geolocation of UBS and the detailing of care metrics, such as coverage parameters and the number of persons registered and followed, may become valuable tools for more assertive territorial planning.
International experiences also reinforce the centrality of territory as a structuring axis of Primary Care. In the United Kingdom, the National Health Service (NHS) has been consolidating Neighbourhood Health Services, which organize care into defined territorial units by integrating population data, local vulnerabilities, and service supply to strengthen community care. This approach combines territorial planning, risk stratification, and service integration, bringing professionals and users closer together in community networks23. Similarly, Estonia has consolidated one of the most advanced digital health ecosystems in the world, using full interoperability, a single health record, 100% digital prescribing, and geolocation systems to organize PHC based on territory, making it possible to identify population needs and continuously monitor health conditions24.
In Brazil, the recent initiative to integrate the National Health Card with the Individual Taxpayer Registry (CPF) and the strengthening of the RNDS move in the same direction observed in other countries by reducing registry inconsistencies, improving user identification, and expanding interoperability among systems. These efforts strengthen analytical capacity and improve the use of territorial information in SUS management. In this way, the tool presented in this study aligns with international trends that combine territorial intelligence, data integration, and digitalization to improve PHC and support timelier, evidence-based decisions.
In addition, the use of an interactive map with PHC data enhances the health planning and management process by favoring the identification of needs, inequalities, and vulnerabilities specific to territories and promotes comprehensive and equitable care.
Despite its visual robustness and the integration of multiple informational layers, we should highlight that the maps are support tools and do not replace detailed territorial analyses. Integrated interpretation alongside epidemiological surveillance, specific social and territorial characteristics, and actual care flows is therefore indispensable to avoid linearized interpretations of complex territories.
Study limitations
The tool has some limitations that should be considered when interpreting and using the maps for health planning. First, the data sources used are national databases, which may present time lags when compared with data produced locally, which in many contexts are more detailed and up to date. Thus, the maps presented constitute a reference for municipal planning, but do not replace analyses and reports based on information produced directly by health teams.
In addition, although the tool is made available in an open and replicable format, its adaptation and customization at the local level may require basic knowledge of software development and programming, which may represent a barrier for some municipalities. This limitation is partially mitigated by licensing the solution as free software and by the use of open data, which reduces barriers to adoption, adaptation, and customization according to local needs.
Regarding territorial representation, the methodological choice to use census tracts from the Brazilian Institute of Geography and Statistics (IBGE) stems from their nationwide coverage, standardization, and comparability across municipalities, enabling integrated analyses on a national scale. Even so, a limitation is recognized in the absence of maps aggregated by officially established neighborhoods, as defined by municipal governments through the grouping of census tracts, which may restrict appropriation of the tool in contexts where this administrative unit is central to local planning.
Likewise, the tool does not include visualizations by micro-area, a fundamental unit in the PHC work process, especially for Family Health teams and Community Health Workers. Micro-area boundaries may not coincide with census tracts and are subject to frequent redefinition at the municipal level, which constitutes a limitation inherent to the use of standardized territorial databases on a national scale. However, because this is a solution based on free software and open methods, interested municipalities may adjust territorial layers and incorporate their own boundaries, such as micro-areas and other local administrative units, according to their specific planning and management needs.
Final considerations
The interactive Map of PHC Basic Health Units makes it possible to visualize, through a dynamic dashboard, the territorial distribution of primary care services, considering demographic data, team-based coverage, and detailed information by health macro-region and state. In addition, it may help expand the engagement of users, health professionals, researchers, and managers in exploring data on health services and territorial coverage, thereby promoting greater transparency and democratization of access to information.
It is essential to improve information throughout data collection, processing, and dissemination at all government levels in order to obtain a reliable and accurate picture representing the entire Brazilian territory. The interactive tool is a dynamic instrument that may undergo continuous updates and the addition of new functionalities by the Ministry of Health. It should be emphasized that the platform itself provides space for any interested person to submit proposals and contributions for improving the tool.
Incorporating the tool into the routine work process at all health management levels may become a valuable strategy in the coming years. As a powerful instrument for visualizing territories and the services offered, it improves territorial analysis and the organization of PHC teams, as well as supports decision-making and health planning in public management, grounded in the universal, comprehensive, and equitable context that guides the SUS. It also corroborates the importance of data interoperability and the power of the SUS digital transformation with the expanded RNDS.
The consolidation of a free-access tool developed entirely within the public sector, such as the Map of PHC Units, reveals the Brazilian State’s capacity to conceive innovative, accessible technological solutions committed to the collective interest. This initiative values the strategic use of public data, reaffirms the role of the SUS as a driver of equity and transparency, and strengthens the Ministry of Health’s commitment to a Digital Health agenda guided by open, public technologies aimed at promoting social well-being.
References
- 1 Starfield B. Atenção Primária: Equilíbrio entre necessidades de saúde, serviços e tecnologia. Brasília: UNESCO Brasil, Ministério da Saúde; 2004.
- 2 Giovanella L, Escorel S, Lobato LVC, Noronha JC, Carvalho AI. Políticas e sistema de saúde no Brasil. Rio de Janeiro: Editora FIOCRUZ; 2012.
- 3 Monken M, Barcellos C. Vigilância em saúde e território utilizado: possibilidades teóricas e metodológicas. Cad Saude Publica 2005; 21:898-906.
-
4 Brasil. Ministério da Saúde (MS). Secretaria de Vigilância em Saúde. Fundação Oswaldo Cruz. Abordagens espaciais na saúde pública [Internet]. 2006 [acessado 2024 jun 13]. Disponível em: https://bvsms.saude.gov.br/bvs/publicacoes/serie_geoproc_vol_1.pdf
» https://bvsms.saude.gov.br/bvs/publicacoes/serie_geoproc_vol_1.pdf - 5 Pinto LF, Soranz D, Scardua MT, Silva IM. A regulação municipal ambulatorial de serviços do Sistema Único de Saúde no Rio de Janeiro: avanços, limites e desafios. Cien Saude Colet 2017; 22(4):1257-1267.
-
6 Department of Health and Social Care. Fit for the future: the 10 year health plan for England [Internet]. 2025 [cited 2025 dez 10]. Available from: https://www.gov.uk/government/publications/10-year-health-plan-for-england-fit-for-the-future
» https://www.gov.uk/government/publications/10-year-health-plan-for-england-fit-for-the-future -
7 World Health Organization (WHO). Global strategy on digital health 2020-2025 [Internet]. 2021 [cited 2025 dez 10]. Available from: https://www.who.int/publications/i/item/9789240020924
» https://www.who.int/publications/i/item/9789240020924 -
8 Instituto de Estudos para Políticas de Saúde. Boletim n. 4. Monitoramento do orçamento da saúde digital [Internet]. 2023 [acessado 2025 dez 10]. Disponível em: https://ieps.org.br/wp-content/uploads/2023/07/Boletim_Monitoramento_4_2023__Saude_Digital-1.pdf
» https://ieps.org.br/wp-content/uploads/2023/07/Boletim_Monitoramento_4_2023__Saude_Digital-1.pdf - 9 Costa MVS, Camargos MCS, Viana SMN, Mendes UVS. Avanços e desafios da interoperabilidade no Sistema Único de Saúde. J Health Inform 2025; 17:1112.
-
10 Brasil. Ministério da Saúde (MS). Cadastro Nacional de Estabelecimentos de Saúde (CNES) [Internet]. 2025 [acessado 2025 dez 10]. Disponível em: http://cnes.datasus.gov.br/.
» http://cnes.datasus.gov.br -
11 Instituto Brasileiro de Geografia e Estatística (IBGE). Censo demográfico de 2022 [Internet]. 2023 [acessado 2025 dez 10]. Disponível em: https://www.ibge.gov.br/estatisticas/sociais/saude/22827-censo-demografico-2022.html
» https://www.ibge.gov.br/estatisticas/sociais/saude/22827-censo-demografico-2022.html -
12 Serviço Geológico do Brasil (CPRM). Cartografia de risco geológico [Internet]. 2025 [acessado 2025 dez 10]. Disponível em: https://www.sgb.gov.br/pt/web/guest/saiba-mais-cartografia-de-riscos-geologicos
» https://www.sgb.gov.br/pt/web/guest/saiba-mais-cartografia-de-riscos-geologicos - 13 Brasil. Ministério da Saúde (MS). Portaria GM/MS no 3.493, de 10 de abril de 2024. Altera a Portaria de Consolidação GM/MS no 6, de 28 de setembro de 2017, para instituir nova metodologia de cofinanciamento federal do Piso de Atenção Primária à Saúde no âmbito do Sistema Único de Saúde. Diário Oficial da União; 2024.
- 14 Brasil. Ministério da Saúde (MS). Portaria no 2.979, de 12 de novembro de 2019. Institui o Programa Previne Brasil, que estabelece novo modelo de financiamento de custeio da Atenção Primária à Saúde no âmbito do Sistema Único de Saúde, por meio da alteração da Portaria de Consolidação no 6/GM/MS, de 28 de setembro de 2017. Diário Oficial da União; 2019.
- 15 Brasil. Ministério da Saúde (MS). Secretaria de Atenção Primária à Saúde. Portaria SAPS/MS no 161, de 10 de dezembro de 2024. Estabelece a metodologia de cálculo do Componente Vínculo e Acompanhamento Territorial para as equipes de Saúde da Família - eSF, equipes de Atenção Primária - eAP, e as equipes vinculadas em conformidade. Diário Oficial da União; 2024.
- 16 Ofori MA, Lartey S, Durneva P, Jha N, Mittal N, Roy S, Zeba Z, Chirwa S, Saulsberry-Scarboro N, Taylor M, Joshi A. Visual communication of public health data: a scoping review. Front Digit Health 2025; 7:1555231.
- 17 Park S, Bekemeier B, Flaxman A, Schultz M. Impact of data visualization on decision-making and its implications for public health practice: a systematic literature review. Inform Health Soc Care 2022; 47(2):175-193.
-
18 Colussi CF, Pereira KG. Territorialização como instrumento do planejamento [Internet]. 2016 [acessado 2025 dez 10]. Disponível em: https://ares.unasus.gov.br/acervo/html/ARES/13957/1/TERRITORIALIZACAO_LIVRO.pdf
» https://ares.unasus.gov.br/acervo/html/ARES/13957/1/TERRITORIALIZACAO_LIVRO.pdf -
19 Becerra J, Rocha MAB. Applications of geotechnologies in the field of public health. In: Geographic information systems - data science approach [Internet]. 2024 [cited 2025 dez 10]. Available from: https://www.intechopen.com/chapters/1148536
» https://www.intechopen.com/chapters/1148536 - 20 Souza M, Meneses MN, Weber DL, Rocha CMF, Darsie C. A centralidade das territorialidades para as ações de Educação em Saúde na Atenção Básica. Res Soc Dev 2022; 11(10):e213111032813.
- 21 Cirilo M, Dimenstein M. Desafios para o cuidado em saúde mental em contextos rurais. Gerais Rev Interinstitucional Psicol 2021; 14(1):1-26.
- 22 Savassi LCM, Almeida MM, Floss M, Lima MC. Saúde no caminho da roça. Rio de Janeiro: Editora FIOCRUZ; 2018.
-
23 Fuller C. Next steps for integrating primary care: Fuller stocktake report [Internet]. 2022 [cited 2025 dez 10]. Available from: https://www.england.nhs.uk/publication/next-steps-for-integrating-primary-care-fuller-stocktake-report/.
» https://www.england.nhs.uk/publication/next-steps-for-integrating-primary-care-fuller-stocktake-report -
24 Republic of Estonia. e-Estonia guide: Digital society [Internet]. 2025 [cited 2025 dez 10]. Available from: https://e-estonia.com/wp-content/uploads/eestonia_guide_08-04-2025.pdf
» https://e-estonia.com/wp-content/uploads/eestonia_guide_08-04-2025.pdf
The data sources adopted in the research are indicated in the article’s body.

 Source: Map of PHC Units - https://mapas.sus.c3sl.ufpr.br/.
 Source: Map of PHC Units - https://mapas.sus.c3sl.ufpr.br/.
 Source: Map of PHC Units - https://mapas.sus.c3sl.ufpr.br/.