
 Beyond the metropolises: the decentralization of chikungunya to non-metropolitan areas across Brazil
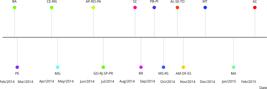
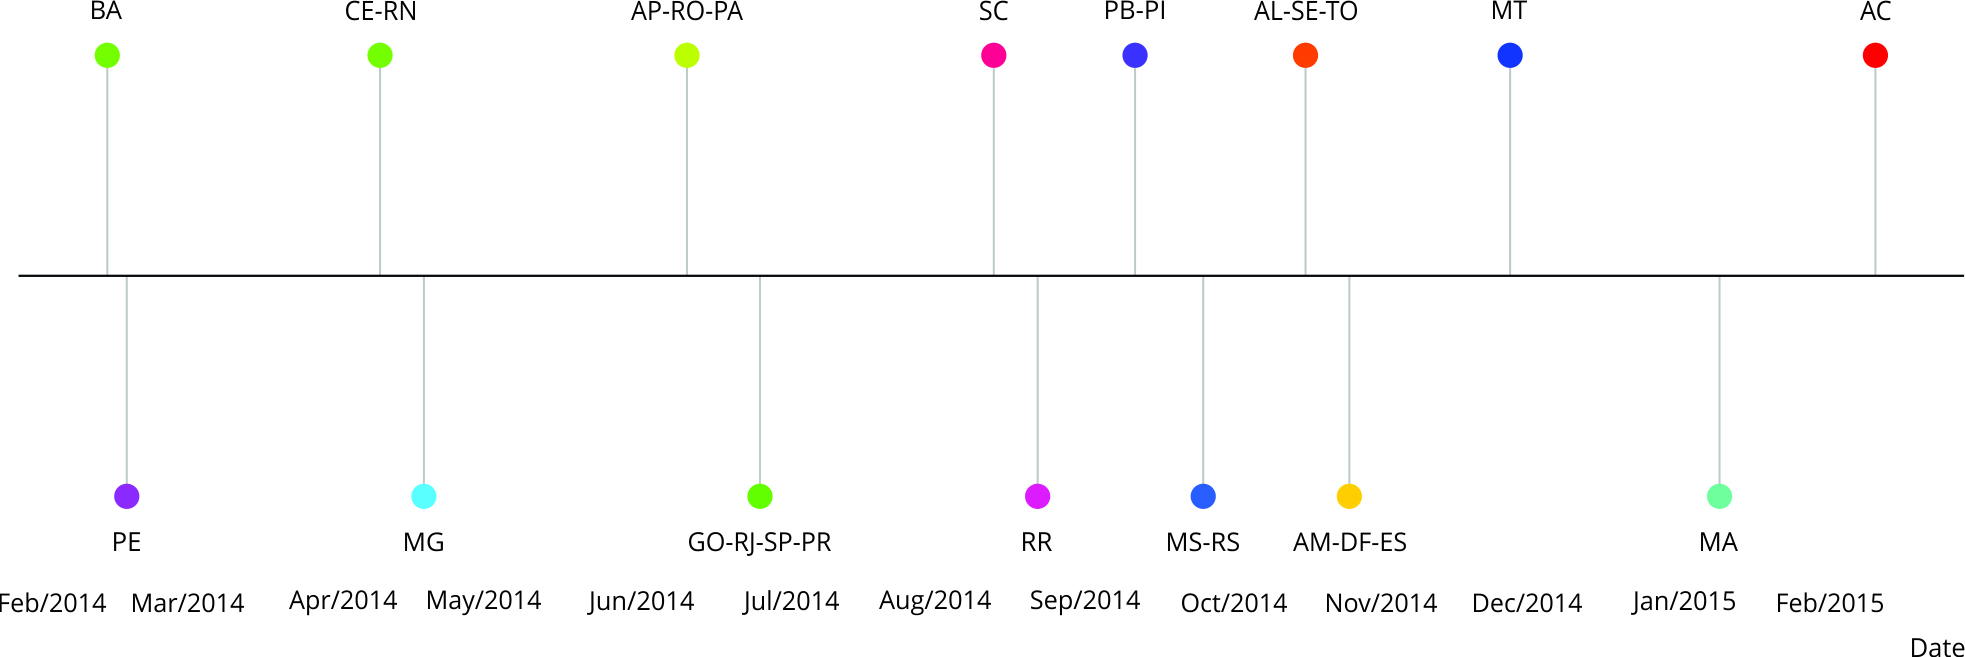
Chikungunya virus (CHIKV) was first detected in Brazil in 2014, becoming a significant public health concern. Metropolitan areas were initially the port of entry, but the disease spread to less populated municipalities, challenging the focus of monitoring and control in large cities. This study presents a descriptive analysis of the spread of CHIKV in Brazil up to 2022, examining regional differences. Data on chikungunya cases in municipalities were obtained from the Brazilian Information System for Notifiable Diseases (SINAN) from 2014-2022. Population size data were obtained from the Brazilian Institute of Geography and Statistics (IBGE). The chikungunya introduction dates in the states were organized into timelines and maps. A decentralization index was proposed to estimate the ratio between the incidence in non-metropolitan and metropolitan municipalities. Our analysis revealed that the spread of chikungunya from metropolitan to non-metropolitan areas varied among states. As expected, most states initially showed higher metropolitan incidence rates, with a few exceptions, such as Amapá, located at the national border with French Guiana. The Northeast remained the epicenter during the study period, but significant regional differences in disease patterns were observed across Brazil. Several factors, including environmental suitability and demographic changes such as internal migration, may have facilitated the differential spread of chikungunya to less densely populated regions. In conclusion, the index proved useful for monitoring the dynamics of disease spread, highlighting areas that require specific surveillance and control measures extending beyond large urban centers.
Keywords:
Chikungunya Virus; Arbovirus Infections; Incidence
 Thumbnail
 Thumbnail
 Thumbnail
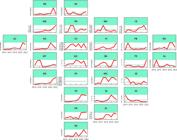
 Note: regions and their respective states: North − AC: Acre, AM: Amazonas, AP: Amapá, PA: Pará, RO: Rondônia, RR: Roraima, and TO: Tocantins; Northeast − AL: Alagoas, BA: Bahia, CE: Ceará, MA: Maranhão, PE: Pernambuco, PB: Paraíba, PI: Piauí, RN: Rio Grande do Norte, and SE: Sergipe; Central-West − DF: Federal District, GO: Goiás, MS: Mato Grosso do Sul, and MT: Mato Grosso; Southeast − ES: Espírito Santo, MG: Minas Gerais, RJ: Rio de Janeiro, and SP: São Paulo; South − PR: Paraná, RS: Rio Grande do Sul, and SC: Santa Catarina. Y-axis scales vary across panels to enhance visualization of state-specific patterns.
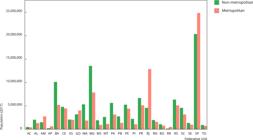
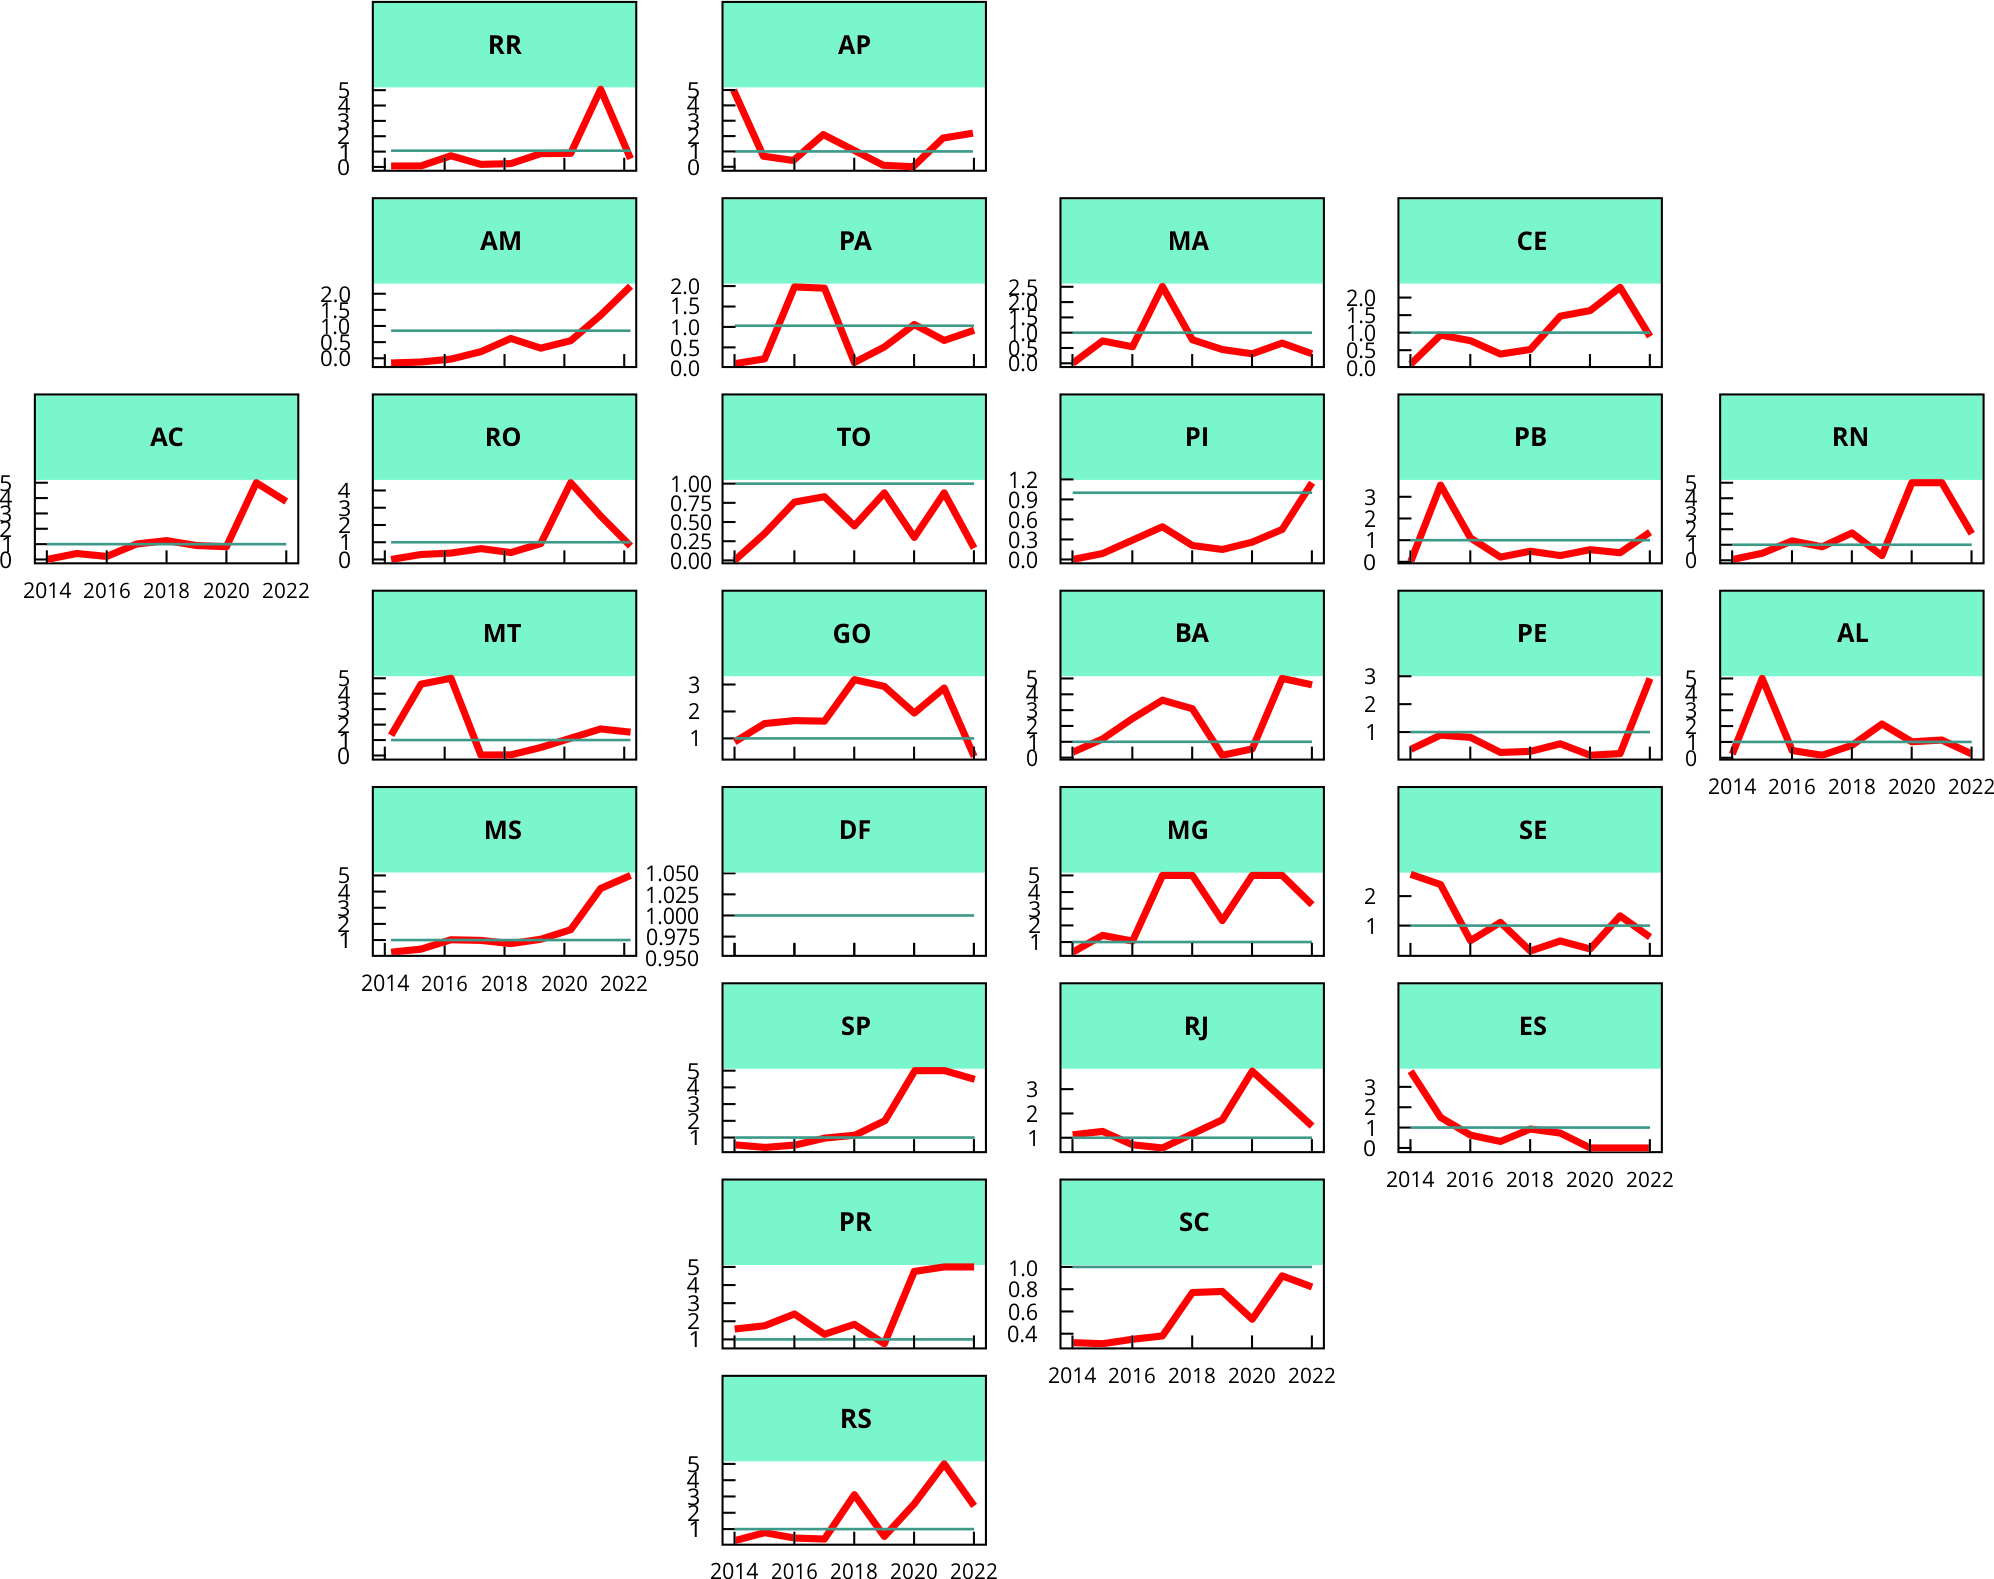 Note: regions and their respective states: North − AC: Acre, AM: Amazonas, AP: Amapá, PA: Pará, RO: Rondônia, RR: Roraima, and TO: Tocantins; Northeast − AL: Alagoas, BA: Bahia, CE: Ceará, MA: Maranhão, PE: Pernambuco, PB: Paraíba, PI: Piauí, RN: Rio Grande do Norte, and SE: Sergipe; Central-West − DF: Federal District, GO: Goiás, MS: Mato Grosso do Sul, and MT: Mato Grosso; Southeast − ES: Espírito Santo, MG: Minas Gerais, RJ: Rio de Janeiro, and SP: São Paulo; South − PR: Paraná, RS: Rio Grande do Sul, and SC: Santa Catarina.
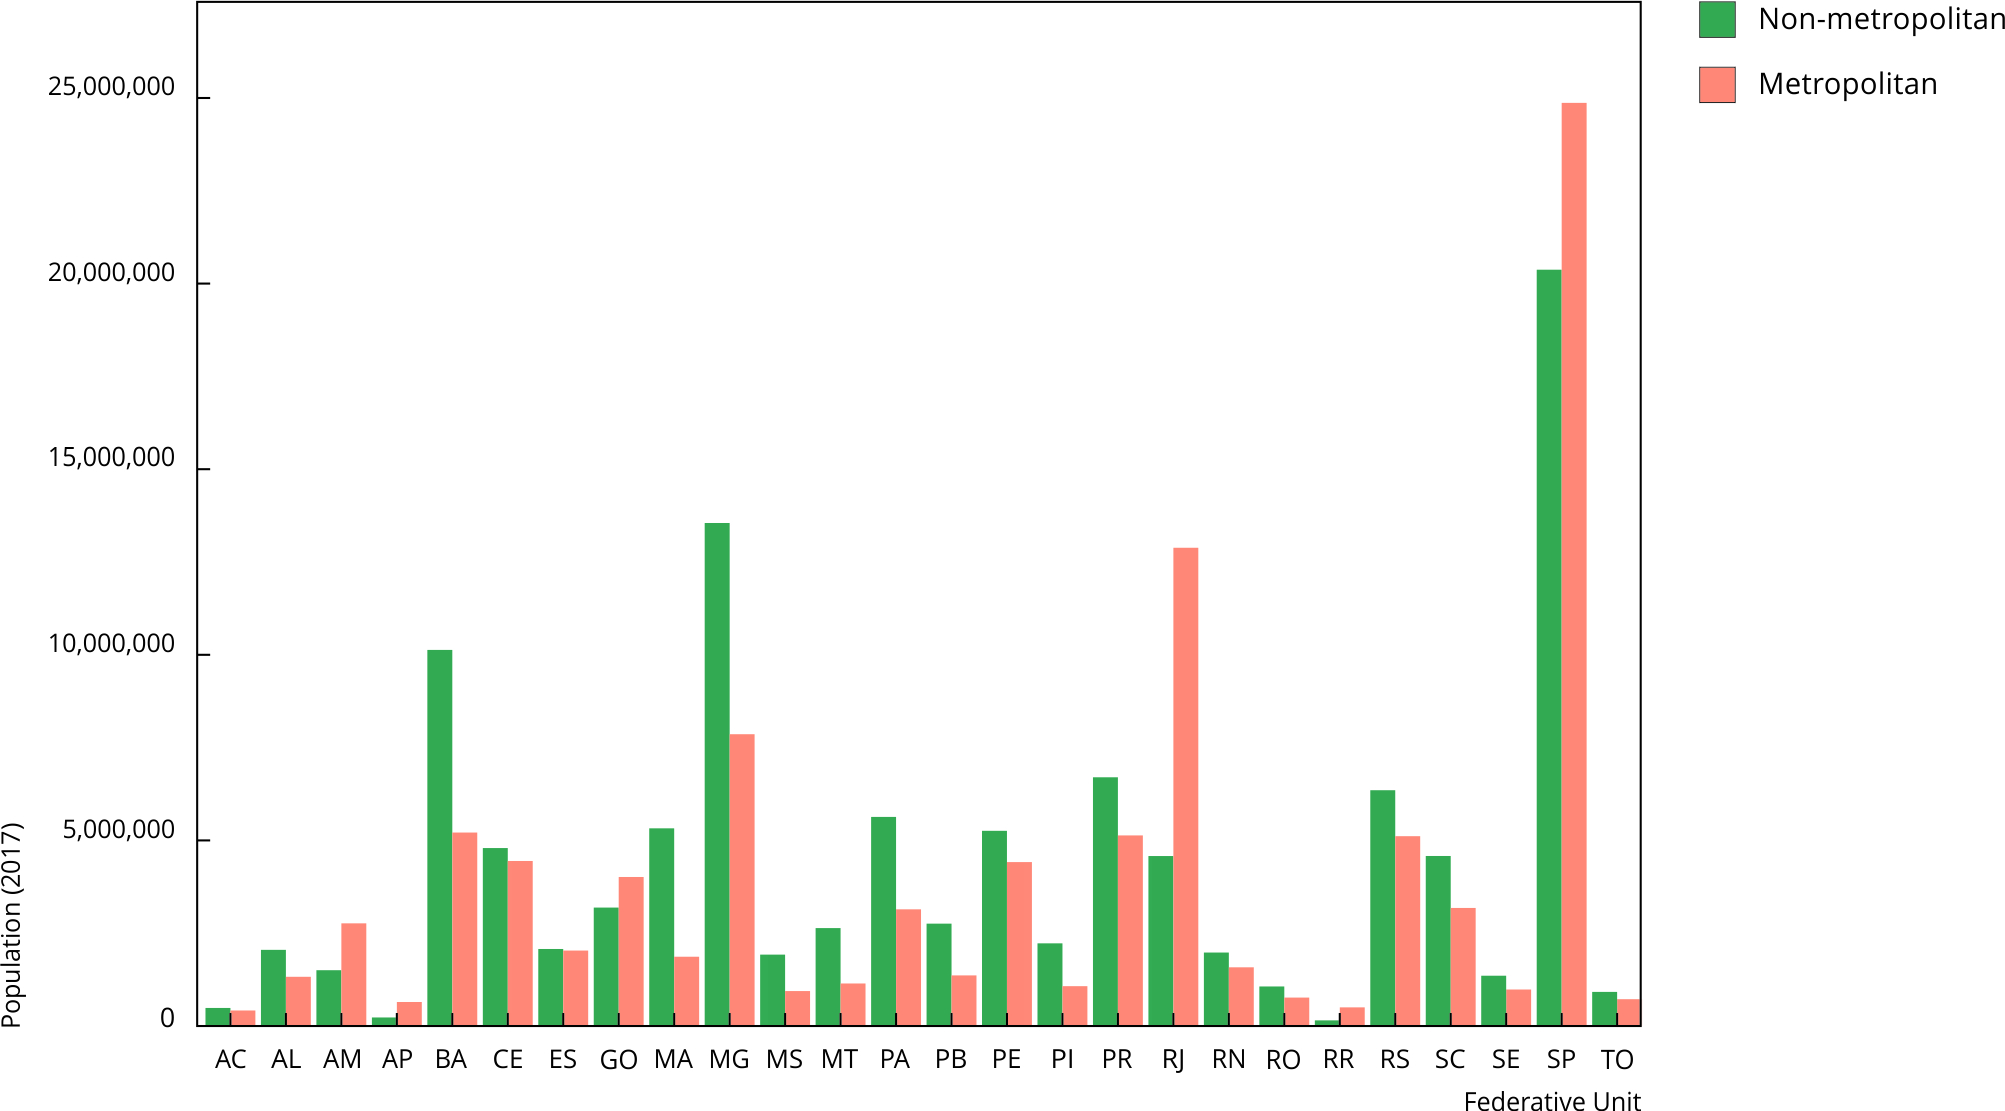 Note: regions and their respective states: North − AC: Acre, AM: Amazonas, AP: Amapá, PA: Pará, RO: Rondônia, RR: Roraima, and TO: Tocantins; Northeast − AL: Alagoas, BA: Bahia, CE: Ceará, MA: Maranhão, PE: Pernambuco, PB: Paraíba, PI: Piauí, RN: Rio Grande do Norte, and SE: Sergipe; Central-West − DF: Federal District, GO: Goiás, MS: Mato Grosso do Sul, and MT: Mato Grosso; Southeast − ES: Espírito Santo, MG: Minas Gerais, RJ: Rio de Janeiro, and SP: São Paulo; South − PR: Paraná, RS: Rio Grande do Sul, and SC: Santa Catarina.