Estimation of Rapeseed Maturity via Fusion of Spectral and Texture Information from a UAV
Abstract
Accurate monitoring of crop growth at the field scale is essential for the development of farm management measures for plant protection, machine harvesting, and other agricultural processes. In this study, 17 vegetation indices and four texture features were gathered from canopy spectral data collected by a UAV. Using the recursive feature elimination method, redundant variables were removed. Four regression algorithms, namely SVR, RF, GBDT, and XGBoost, were used to build inverse models of the silique dehiscence force, seed compression force, and seed moisture content of rapeseed based on vegetation indices, texture features, and their fusion, and the differences between them were compared. The results showed that the seed moisture content had a higher sensitivity and was superior when used to estimate inversion compared to the silique dehiscence force and seed compression force. The seed moisture content estimation model developed with XGBoost achieved the highest accuracy (R2=0.847, RMSE=0.025). Of the 12 inversion models, the XGBoost/seed moisture content model based on the fusion of vegetation indices and texture features yielded increases in accuracy of 26% and 10% compared to the vegetation indices and texture features models, respectively. In summary, a seed moisture content inversion model based on the fusion of UAV spectral and texture information offers a feasible and accurate solution for timely machine harvesting of rapeseed.
Keywords:
rapeseed; UAV multispectral remote sensing; maturity; texture feature; machine learning
Introduction
Rapeseed (Brassica napus) is the most important of the oilseed crops, and is the fourth largest crop in China in terms of planting area, after rice, maize, and wheat. With the increasing demand for food and edible oil in China, maintaining and increasing rapeseed production is essential to ensure the food supply (Hu et al., 2017). Rapeseed has a short harvesting window of just five days during its reproductive phase, meaning that the maturity of a rapeseed crop has a direct impact on the machine harvesting efficiency and yield loss, with early or late harvesting negatively influencing both yield and quality. The timely machine harvesting of rapeseed is crucial in order to guarantee a consistent high yield. The silique dehiscence force (SDF), seed compression force (SCF), and seed moisture content (SMC) are important measures of growth during the development of rapeseed, and have been showed to be strongly correlated with maturity (Gulden et al., 2017; Menendez et al., 2019). Rapid, real-time, and accurate monitoring of rapeseed maturity is therefore important in order to optimise field management and develop reasonable machine harvesting plans (Noureldin et al., 2013; Zhou et al., 2017).
Traditional methods of monitoring crop maturity typically rely on ground surveys or destructive sampling, which are known for being time-consuming and expensive; they also involve a high level of data uncertainty, and fall short of the requirements for monitoring crop growth over large areas (Ilniyaz et al., 2023). In recent years, remote sensing technology has been widely used in agriculture (Kganyago et al., 2024), with UAV remote sensing playing a vital role in advancing precision agriculture through the acquisition of high-resolution images. Unlike satellite remote sensing (which is restricted by satellite repeat cycles) and aerial remote sensing (which is costly to implement), UAVs can quickly obtain extensive phenotypic data with a high temporal and spatial resolution, and can capture accurate, detailed information on crop growth. They are widely used in remote sensing for estimating vegetation biomass. Several studies have reported remarkable success when using UAV-collected spectral and textural data in conjunction with machine learning algorithms for estimating and modelling crop traits (Herrero-Huerta et al., 2020) and for predicting a wide range of crop traits such as moisture content, leaf area index, and above-ground biomass. In these methods, advanced statistical techniques are used to model the complex nonlinear relationships between spectral information and biophysical traits. For example, Wan et al. (2020) extracted rice vegetation indices (VIs) and canopy spectral information from UAV remote sensing images and established a random forest (RF) prediction model for grain yield, in order to optimise the prediction accuracy. Liang et al. (2022) obtained VIs and texture features (TFs) based on UAV RGB images, and compared four machine-learning methods to identify the best prediction model for above-ground biomass. Wang et al. (2024) obtained the VI characteristics of the canopy of cotton plants using UAV multispectral imagery, developed a rapid monitoring model for the opening rate of cotton bolls, and achieved an optimal monitoring accuracy of 0.929, which guided decisions on when to harvest cotton and apply treatments. Oliveira et al. (2024) applied RF and k-nearest neighbour methods to satellite remote sensing images to establish a predictive model for peanut maturity by studying its functional relationship over time, and found that the subjectivity of this approach was effectively reduced compared to manual methods.
Most published studies on UAV remote sensing have focused on cereal crops, such as winter wheat and rice, and limited attention has been paid to rapeseed. The monitoring of rapeseed maturity using UAV remote sensing data would be of great value in terms of guiding machine harvesting operations. Furthermore, many scholars have conducted correlation analysis and modelling using subjectively selected remote sensing variables such as VIs and TFs. Differences in the growth environments, fertility periods, and other factors among crops of different varieties and in various geographic spaces can lead to variations in their spectral features. This means that employing the same remote sensing variables in the inversion model could result in duplication and spectral information loss, which could ultimately affect the accuracy of the model (Liu et al., 2021). In this study, canopy spectral information collected by a UAV was used to acquire spectral and texture information on rapeseed, with the aim of addressing the problems described above. The recursive feature elimination method was employed to identify the feature variables with the greatest importance with respect to the measured values of SMC, SDF, and SCF for rapeseed. Four regression methods, based on support vector machine regression (SVR), RF, gradient boosting decision tree (GBDT) and extreme gradient boosting (XGBoost), were used to build monitoring models for rapeseed maturity, and the optimal monitoring model was then identified. This approach provides a reliable method for fast, non-destructive, and quantitative monitoring of rapeseed growth, and can provide technical support and a basis for decision-making on variable-rate fertilisation, precise irrigation, and timely machine harvesting of farmland.
Material and Methods
Experimental design
A field experiment involving rapeseed was conducted in Taiping Village, Longtan Street, Nanjing, Jiangsu Province (E119°16′18″, N32°20′47″). The experimental area was located in the middle and lower reaches of the Yangtze River; this region is characterised by a typical northern subtropical temperate climate, and features four distinct seasons, with ample rainfall and abundant sunshine. The average annual temperature, precipitation, and frost-free period are 15.3°C, 1,100 mm, and 237 days, respectively. The soil type was yellow-brown loam, which is suitable for growing rapeseed, and the rapeseed varieties considered for this trial were FengYu 737, HuaiYou 18, and Ning R 101. The test plot covered a total area of 300 m2 and received strict irrigation and field management according to agronomic requirements. Figure 1 shows the location of the test area, with a photograph of the test field.

The UAV observation experiment was conducted from 2nd to 16th May 2023, and covered the maturation period of the rapeseed plants; throughout this period, multispectral remote sensing data on the rapeseed canopy in the experimental area were continuously collected, with simultaneous collection of ground-based physiological data for the rapeseed. Data collection was stopped during rainy weather, and data were collected for a total of 10 days.
Collection of physiological data on rapeseed
Three experiments were conducted to collect physiological data on the rapeseed, including the SDF, SCF, and SMC. The meaning of each physiological index (PI) of rapeseed and the instruments used for collecting experimental data are shown in Table 1.
Experiment 1: Three plants of each rapeseed variety were randomly selected from the experimental area, and five siliques at the canopy position were selected from each rapeseed plant for destructive testing. The silique pods were secured to the fixture of a tensile tester, and pressure was gradually applied until they split open from both sides. The maximum value of the force was recorded as the SDF.
Experiment 2: The seeds were stripped from the siliques in Experiment 1 in order to measure the SCF. Seed samples were dried on the surface and placed on a fruit hardness tester, and pressure was then applied. When the seeds reached the critical state of fracture, the reading on the fruit hardness tester was recorded as the SCF.
Experiment 3: Three plants of each rapeseed variety were randomly selected from the experimental area, and five siliques at the canopy position were selected from each plant. The seeds were stripped from the selected siliques and used as samples; these were weighed on a balance, and the value was recorded as the fresh weight of seeds (mf).
The samples were dried in an oven at a specified temperature (110°C) and then weighed on a balance to determine the dry weight of the seeds (md). The SMC (wf) was calculated using the following formula:
Acquisition and preprocessing of UAV aerial images
Acquisition of UAV aerial survey imagery
The UAV used in this experiment was a DJI Phantom 4 Multispectral (P4M), equipped with a fully integrated narrowband multispectral camera designed for agricultural use, covering 450, 560, 650, 730, and 840 nm for multispectral imaging. Multispectral images of rapeseed were collected between 11:00 and 12:00 on each day, under clear, cloudless weather conditions and low wind speeds. The flight trajectory of the UAV was designed and executed on an iPad using DJI GS Pro V2.0.17. It was flown at an altitude of 7 m, with a ground sampling distance of 0.37 cm/pixel, a fixed airspeed of 5 m/s, a heading overlap of 80%, and a side overlap of 70%. The camera was oriented vertically downwards, to ensure coverage of the full test area, and images were captured automatically every 1 s and saved in TIFF format with a resolution of 1600 × 1300 pixels on an SD card. At the same time, a handheld differential measuring instrument (Real-time Kinematic, RTK) was used to pinpoint the coordinates of 10 precise ground control points in the test area.
To facilitate the subsequent radiometric correction of the acquired images for sunlight discrepancies, a standard greyscale gradient plate with 100% reflectance was placed at the edge of the test area.
Preprocessing of multispectral images
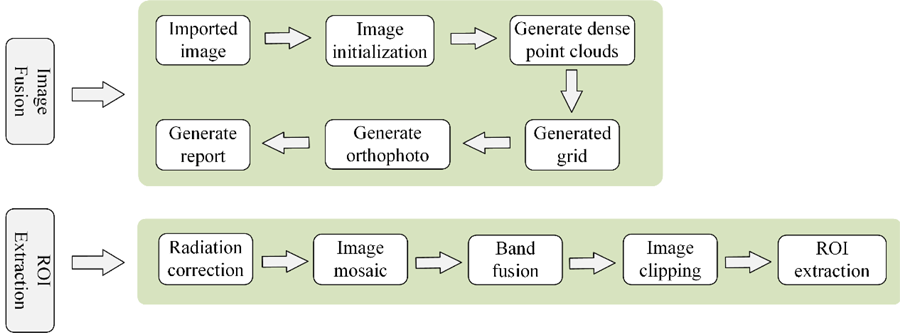
The workflow for the preprocessing of the multispectral images is illustrated in Figure 2. Acquired aerial images were imported into Pix4D mapper software for initial processing, which involved feature point matching, generation of dense point clouds, and production of digital orthophoto maps. The spectral reflectance and radiation characteristics of the oilseed rape canopies were represented through the use of digital number (DN) values (Hong et al., 2000). The original images underwent preprocessing that included mosaic correction and radiometric correction. Sample images of approximately 300 × 300 pixels were cropped and defined as regions of interest (ROIs), and the average value of each ROI served as the DN value for that image, yielding a total of 150 DN values. These values represented the original quantised data recorded by the sensor, and indicated only the relative response intensity of the detector to the incident radiation energy, without inherent physical dimensions.
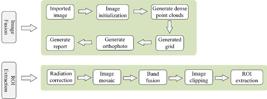
To convert these DN values into physically meaningful surface reflectance (Ri), radiometric calibration was required. The empirical line method was employed in this study for radiometric calibration, in order to eliminate the radiation distortion caused by varying illumination conditions in contemporaneous images. The core principle of this model is that it establishes a linear relationship between the image DN values and ground-synchronised measured reflectance of targets. The specific procedure was as follows. On the day of the flight, a standard white reference panel with stable spectral characteristics was selected within the study area. Its average DN value (DNtarget) was calculated, and its reflectance ρ was measured. Through linear regression analysis, calibration equations were established for each spectral band, as follows:
where Gain and Offset are calibration coefficients obtained through regression. Using this reflectance correction algorithm, the pixel DN values of the original images were converted to reflectance values (Ri) using the following calculation formula:
where Ri and DNi are the reflection and pixel values of the image, respectively; Gain and Offset are the slope and intercept, respectively; and i is the band in the image.
Selection of VIs
Values for the visible and multispectral VIs were obtained by combining the reflectance of various bands. These indices enable both qualitative and quantitative analyses of the surface vegetation canopy, which in turn reflects crop growth. Based on previous research results, 17 VIs were initially selected for estimation and modelling, and the corresponding VIs were extracted using the ENVI 5.3 Image Vegetation Index Extraction Tool. The formula for each VI is shown in Table 2.
Selection of TFs
TFs represent the spatial arrangement of image colours or intensities. Common methods for extracting TFs include the grey level co-occurrence matrix (GLCM), local binary patterns (LBPs), and Markov random fields (MRFs). GLCM is a spatial covariance matrix that extracts TFs by calculating the relationships between pixel values; this is a highly adaptive and robust method that has been shown to be effective for extracting crop information in many studies, and is a powerful complement to canopy spectral information (Alabi et al., 2022; Sagan et al., 2021). To minimise data redundancy, improve the data processing speed, and maximise the retention of texture information, we employed the co-occurrence measure tool in ENVI 5.3 to extract TFs from each band (R, G, and B) of visible light imagery using the GLCM method. Following a study by Haralick et al. (1973), we considered the mean (MEA), variance (VAR), entropy (ENT), and contrast (CON), four TF parameters with extensive applications to quantitative vegetation inversion and low computational load, for subsequent research. A 3 × 3 window was selected when extracting TFs, with an angle of 0°. The calculation formula for each TF parameter and its meaning are provided in Table 3.
Research methods
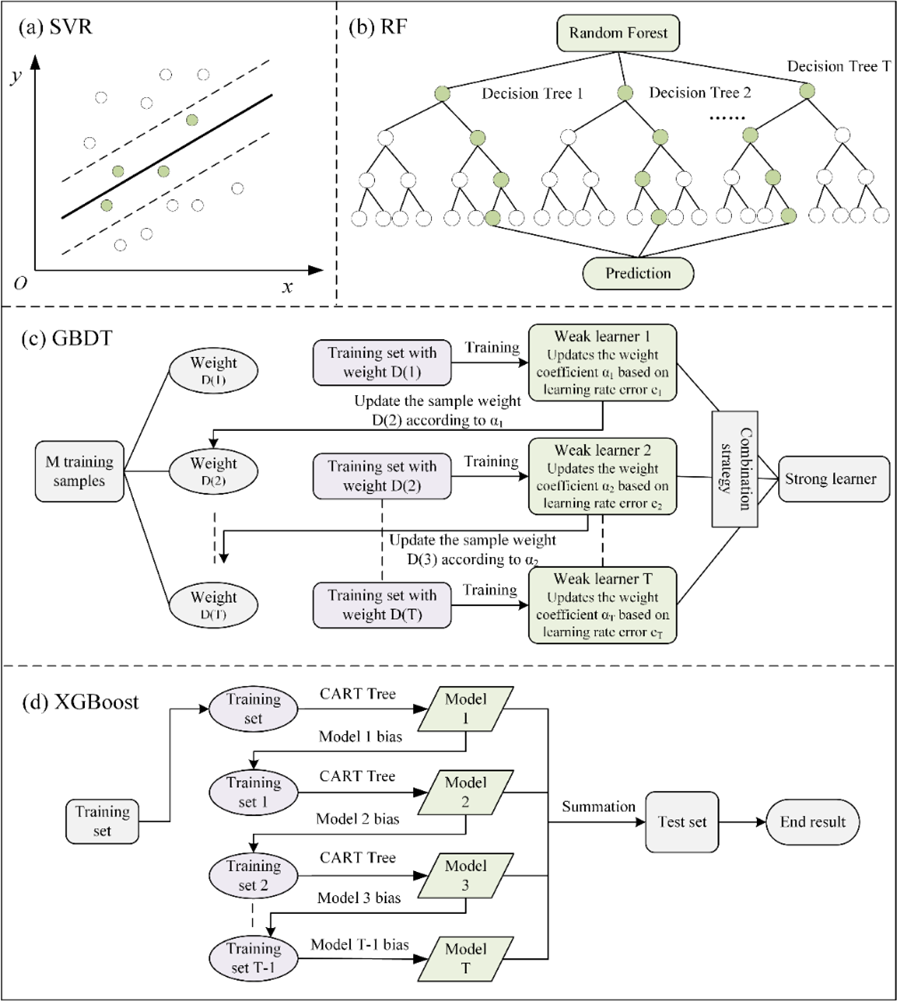
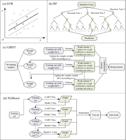
According to the requirements of the selected platform and sensor, features were extracted from the pre-processed multispectral data. Different regression methods were used for modelling and analysis based on the spectral information and TFs, and the accuracy was assessed using evaluation indices. The principles of the four selected regression methods are illustrated in Figures 3(a)–(d).
SVR
SVR is a method that was proposed by Cortes & Vapnik (1995) to deal with nonlinear relationships. This algorithm maps low-dimensional data to a high-dimensional space using a kernel function, and then seeks the optimal hyperplane in that space that minimises the overall deviation of all sample points from the hyperplane, thus enhancing the generalisation ability of the model and reducing the risk of overfitting. SVR has been widely used in studies of forest monitoring and crop yield prediction, among others (Corte et al., 2020; Maimaitijiang et al., 2020).
RF
This is an ensemble learning method based on decision trees in which regression is predicted by constructing multiple decision trees. When building each decision tree, the algorithm performs bootstrap sampling on the raw data; in other words, the training data for each decision tree are randomly selected with replacements from the raw data, leading to variability among the trees. When partitioning each node, RF selects a subset of features from all available features, thereby reducing feature correlation, enhancing model diversity, and boosting the generalisation capacity. Recent studies (Liu et al., 2023; Shao et al., 2022) have shown that RF regression offers great advantages in regard to handling multicollinearity among variables, and is also robust against interference and overfitting.
GBDT
GBDT, proposed by Chen & Guestrin (2016), has been used for a wide range of classification and regression problems. The core principle of GBDT is the building of a new decision tree through continuous iteration to fit the residuals from the previous model predictions, and to minimise the gap between the predicted and actual values. The robustness of GBDT to outliers during training reduces interference in the model, thereby improving prediction stability and reliability (Wang et al., 2019).
XGBoost
This is an integrated learning algorithm based on gradient boosting in which the objective function is improved by optimising the loss function and introducing complexity penalties. Through these strategies, the predictive accuracy of XGBoost is enhanced with each iteration, while also a controlled level of regularisation is incorporated to enhance the stability and generalisability of the model. The high level of interpretability of tree models is also retained in XGBoost. Several recent studies have found that in comparisons of regression models, XGBoost generally outperforms RF, SVR, and other methods in terms of predictive power (Liang et al., 2022; Zhang et al., 2021).
Data processing strategy and accuracy assessment
To train and verify the regression model, we randomly divided the experimentally collected samples (n=150) into a training set and a test set in a ratio of 7:3, using the train_test_split algorithm of the Sklearn machine learning library in Python 3.7. In this allocation, 70% of the data were allocated to the training set and the remaining 30% were reserved for the test set, establishing the foundation for subsequent model development. The performance of four regression methods, SVR, RF, GBDT, and XGBoost, was compared in terms of monitoring rapeseed maturity with VIs, TFs, and a fusion of both features. The coefficient of determination (R2 and root mean squared error (RMSE) were used for a comprehensive assessment of the performance of the model (Ilniyaz et al., 2023). R2 measures the degree of fit between the predicted and actual values, while RMSE measures the extent of deviation between the predicted and actual values; these quantities are calculated according to the following formulae:
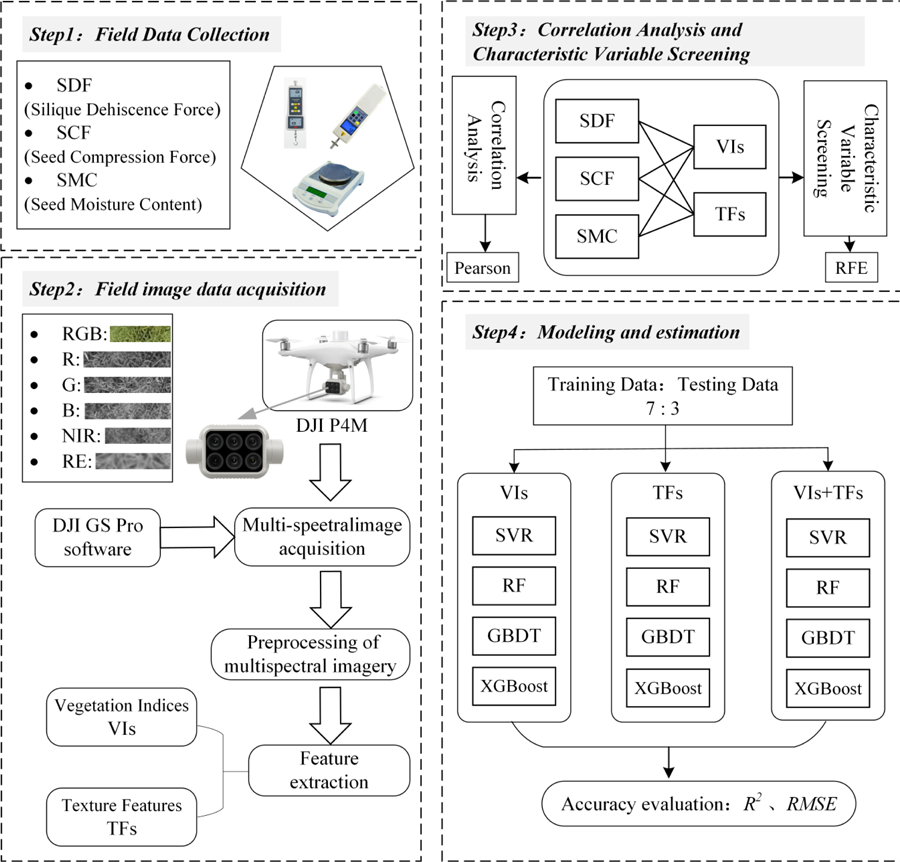
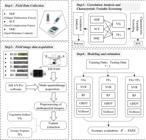
where yi is the measured value, y^i is the predicted value, y¯ is the sample mean, and n is the number of samples. As the value of R2 approaches one, RMSE decreases, indicating that a smaller difference between the predicted and measured values leads to an improved inverse estimation capability. The correlation between SDF, SCF, and SMC was assessed using the Pearson correlation coefficient before the machine learning model was trained. The recursive feature elimination method was then employed to rank the importance of the feature variables and to select the optimal ones. Figure 4 summarises the process of statistical analysis after data collection.
Results and Discussion
Correlation analysis of rapeseed PIs with VIs and TFs
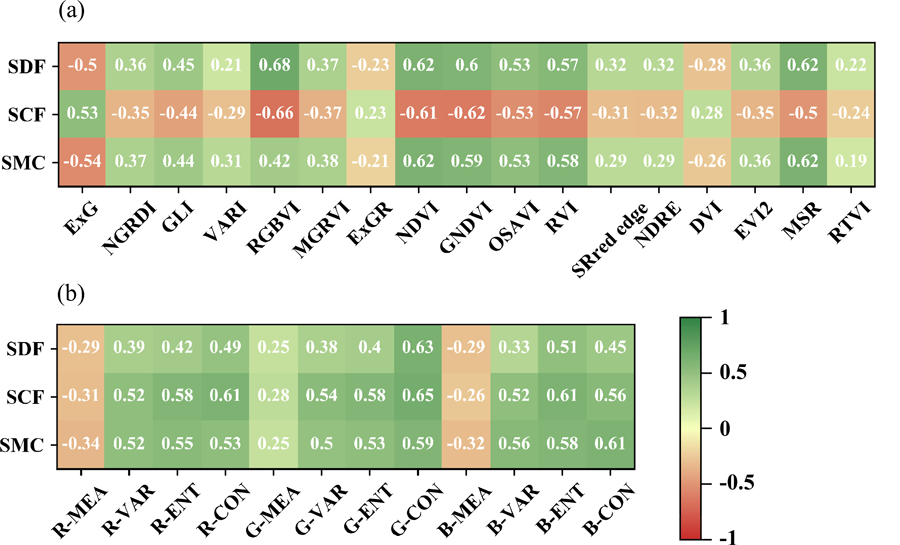
In this study, the Pearson correlation coefficients between the measured PIs for rapeseed and the VIs and TFs were calculated using Python 3.7 and analysed using the Numpy and Pandas libraries, as shown in Figure 5. The results showed that the correlations with VIs for SDF, SCF, and SMC were similar. VIs such as VARI, ExGR, RTVI, and DVI showed low correlations with SDF, SCF, and SMC, whereas NDVI, GNDVI, RVI, RGBVI, and MSR had high levels of correlation. The latter VIs were obtained by combining the pixel differences between the NIR, red, and green channels, and the highest correlation of 0.68 was found for RGBVI and SDF. Of the TFs, the VAR of the R, G, and B bands exhibited a high correlation with the SDF, SCF, and SMC for rapeseed, with the absolute values of correlations mostly hovering around 0.5, whereas the MEA showed the lowest correlation.
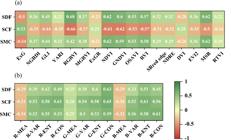
In the following, a positive correlation indicates that two variables vary in the same direction, while a negative correlation denotes variation in opposite directions. The value of the Pearson correlation coefficient is in the range [−1, 1], where absolute values between 0.6 and 1 indicate strong correlation, those between 0.4 and 0.6 represent moderate correlation, and values between 0.2 and 0.4 signify weak correlation.
Optimal remote sensing variable screening
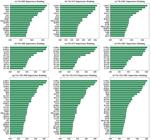
To simplify the model and enhance the regression prediction performance, the remote sensing variables of each PI of rapeseed were ranked based on their feature importance using the cross-validated recursive feature elimination algorithm, in order to provide a reference basis for feature screening before construction of the model. The importance attributes of the VIs, TFs, and combined features were calculated and ranked, using an importance threshold set at 0.05. Figures 6(a)–(c) show the importance rankings for the VIs with respect to SDF, SCF, and SMC, while Figures 6(d)-(f) show the importance rankings for the TFs, and Figures 6(g)–(i) show the values for all combined features. For the spectral features, the optimal feature numbers for SDF, SCF, and SMC are 6, 5, and 4 respectively, whereas for the textural features, the optimal values are 5, 5, and 4 respectively, and for the fused features, the optimal values are 11, 10, and 9 respectively. Of the three rapeseed physiological indicators, GNDVI and G-MEA are the most significant features, thus demonstrating the diagnostic capability of combinations of the green and near-infrared bands for rapeseed biomass and water status, and validating the efficacy of multispectral UAV-based monitoring platforms for assessing the growth performance of rapeseed.
Comparative analysis of models
Estimation of PIs based on VIs
The screened VIs were modelled using four machine learning algorithms (SVR, RF, GBDT, and XGBoost), followed by verification of the model performance on a test set. When only the VIs were used, SDF, SCF and SMC were estimated based on four inversion methods with model input feature numbers of 6, 5, and 4, respectively. The inversion results are shown in Table 4. The accuracy of the inversion models (R2) for each PI ranged from 0.486 to 0.670. Of the four models, the best inversion effect was observed for SMC, suggesting that the use of VIs for estimating SDF, SCF, and SMC was somewhat feasible, with the inversion of SMC showing predicted values that closely matched the measured values. The inverse model for SDF was found to have low accuracy, with the value of R2 hovering around one; this indicates a consistent but low level of force exerted on the rapeseed siliques during harvesting, posing a challenge for the model in terms of accurately predicting SDF using VIs. The growth characteristics of rapeseed siliques may explain why VIs do not respond effectively to changes in SDF during harvesting. Further analysis revealed that the accuracy of the inversion model for SCF was also relatively low, possibly due to variations in the morphological traits of rapeseed siliques, as the complexity of their shapes and structures posed challenges associated with spectral response and accurate prediction.
While VIs can offer insights into the photosynthetic activity of plants, the expression of VIs may show little variation under certain subtle physiological differences, particularly as the vegetation growth approaches maturity during the harvesting period. Hence, a reliance on VIs to invert PIs may not provide a highly accurate representation of the actual distribution of PIs, and certain restrictions may apply.
Estimation of PIs based on TFs
Based on all the TFs screened in the previous section, the SDF, SCF and SMC were estimated using the four inversion methods, where each model had five input features. The results are shown in Table 5, and suggest that the predicted values for each index were generally accurate. The values of the R2 accuracy for the inversion models on the training and validation sets for SDF, SCF, and SMC fell within the ranges 0.539–0.762 and 0.475–0.723, respectively. Furthermore, the errors between the training and test sets were minimal across all models, indicating that they fitted the training data well, the selection of feature variables was reasonable, and the model effectively captured the essential features of the data. Of the PIs, superior performance in terms of the inversion effect was achieved for SMC, and this consistently delivered strong results across all models. The R2 accuracy for the training set exceeded 0.675, while the validation results for the test set also showed correlation coefficients of above 0.659, highlighting the model's strong generalisation capability. SCF achieved the second-best inversion effect, while SDF had the poorest.
XGBoost outperformed all other inversion methods in terms of predicting SDF, SCF, and SMC, with R2 values for the training set of 0.651, 0.719, and 0.762, respectively. When predicting the same PIs, XGBoost also had the smallest RMSE values (2.576, 2.145, and 0.031, respectively), suggesting that this approach was superior to the others in terms of its explanatory power for the actual observed values and its accuracy in predicting results. The fitting accuracy of PIs using TFs was therefore superior, and more aligned with the actual situations, compared to the inversion results based on VIs. This model could precisely predict the SDF, SCF, and SMC during the rapeseed harvesting period, suggesting its practical significance.
Estimation of PIs based on VIs-TFs
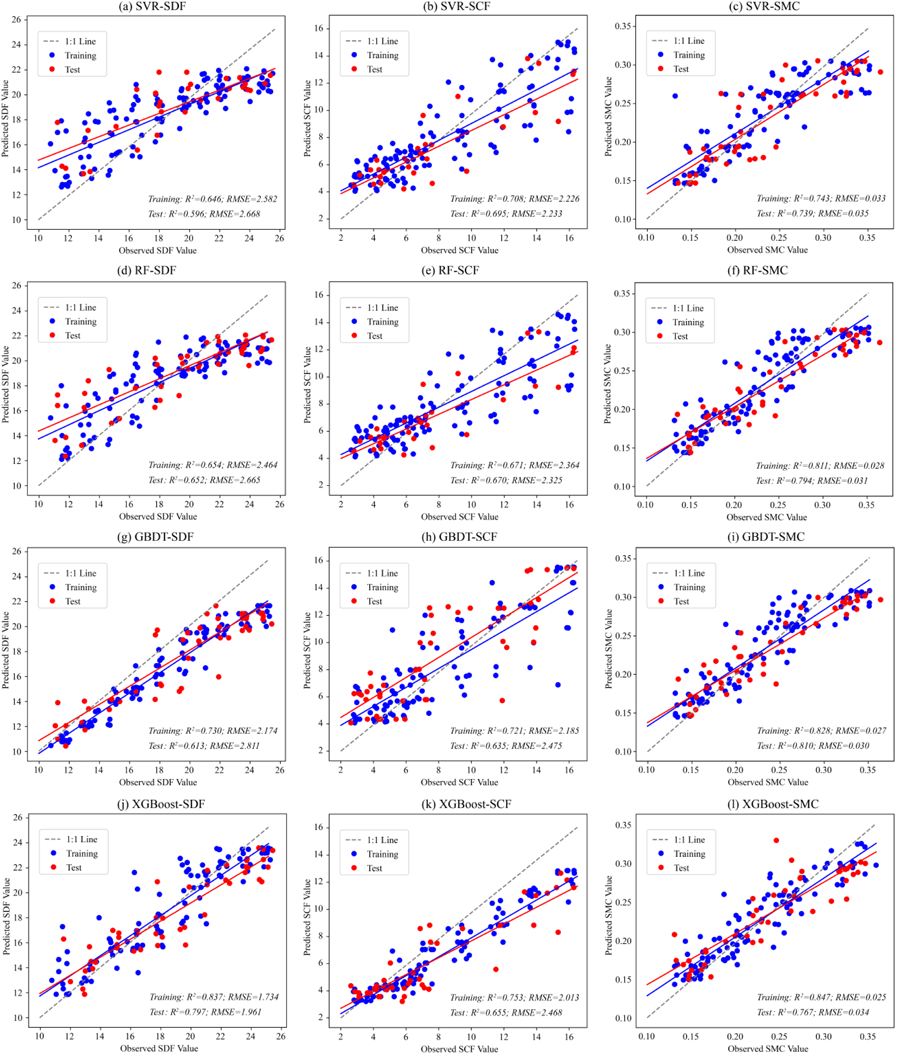
Using the selected VIs, TFs, and fusion features, estimation models were constructed for the PIs. Table 6 displays the inversion results for each model. From the regression models using VIs, TFs, and fusion features, the distributions of rapeseed PIs were obtained as shown in Figures 7(a), (d), (g), (j), Figures 7(b), (e), (h), (k), and Figures 7(c), (f), (i), (l), which present the inversion results for SDF, SCF, and SMC, respectively. The results indicate that the R2 accuracy of the inversion models for SDF, SCF, and SMC was highest, with values of 0.837, 0.753, and 0.847, respectively. Combining VIs with TFs significantly enhanced the accuracy of PI estimation models compared to using VIs or TFs alone, resulting in a smaller RMSE and better fitting effects.
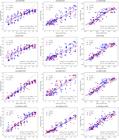
Of the different inversion models, XGBoost yielded the highest accuracy in all cases. This indicates that regression algorithms based on ensemble learning have more flexible regularisation strategies, more efficient handling of large-scale data, enhanced generalisation ability, and a reduced likelihood of overfitting.
The results indicate that the fusion of VIs and TFs enabled the contributions of both VIs and TFs to each PI to be comprehensively considered. The sensitive VIs could accurately describe the spectral features of rapeseed at different physiological stages, while the rich texture information mitigated the saturation problem in spectral features, giving superior anti-saturation performance. The estimation accuracy of the PI regression models was therefore enhanced, with the most effective method being a combination of spectral and TFs for estimating SDF, SCF, and SMC, rather than using VIs or TFs alone. In addition, XGBoost, a regression model based on ensemble learning, was able to accurately capture the nonlinear relationship between the monitoring indices and input features by employing an effective regularisation strategy, which improved the robustness of this model; this approach represents a reliable method for accurately estimating various PIs during the rapeseed harvesting period.
Applicability of UAV methods for monitoring rapeseed during the optimal harvesting period
UAV technology has emerged as a vital tool for monitoring the physiological parameters of crop (e.g. biomass, moisture content, nitrogen status) due to its operational flexibility and efficiency (Bazzo et al., 2023; Ma et al., 2023). This study demonstrates that integrating VIs with TFs for UAV-based monitoring significantly enhances the inversion accuracy and reliability of three key indicators of rapeseed maturity: SCF, SDF, SMC. Precise quantification of SMC serves as the critical determinant for the optimal timing of mechanised harvesting, and our approach provides an effective means of real-time, accurate assessment of maturity. However, the current spatial resolution limitations of UAV-mounted spectral sensors may hinder the extraction of detailed features in areas with high-density silique canopy coverage, thus impeding the fine-scale characterisation of localised variations in maturity. Furthermore, the endurance constraints of UAV monitoring restrict its use in applications involving large-scale, continuous monitoring, where satellite remote sensing remains advantageous. Consequently, future advancements in the capabilities of UAV systems, including higher-resolution sensors and extended flight endurance, will be essential to enable more precise and efficient large-scale maturity monitoring, thereby optimising harvest scheduling decisions.
Advantages of integrating VIs and TFs for the monitoring of rapeseed growth
In this study, two factors are found to contribute to the lower inversion accuracy when VIs are used alone. Firstly, the estimation of biomass using VIs is prone to saturation, especially when rapeseed siliques are densely stacked during the ripening period. Secondly, the direct conversion of spectral images from DNs to vegetation reflectance is affected by variations in light, and is highly challenging due to a lack of comprehensive spectral response functions. It was found that the inversion of the covariates using TFs extracted based on the greyscale covariance matrix gave moderate estimation accuracies, with values for the optimal accuracy of 0.649, 0.663, and 0.670, respectively, surpassing those obtained for the spectral features. This suggests that TFs are more resilient to external environmental influences in comparison to spectral features. The spectral features extracted from the visible light range reflected differences in the biochemical properties of rapeseed canopy siliques, while the TFs derived from the greyscale spatial matrix enabled a greater focus on capturing the spatial structure and morphological traits of the rapeseed canopy. The research presented here indicates that the fusion of both spectral features and TFs from UAV RGB images can greatly enhance the accuracy of rapeseed PI estimation, and the results surpass those obtained from the use of spectral or texture features alone (Table 6). The optimal values of accuracy for SCF, SDF, and SMC were 0.837, 0.753, and 0.847, respectively. This is due to the fact that the fusion of spectral features and TFs enhances the complementary information of rapeseed PIs, and thus reduces the saturation to some extent.
This finding has a certain universality, and can also be applied to the inversion of physiological parameters for other crops, such as wheat, maize, and rice (Wang et al., 2023a; Zhou et al., 2021). To enable decisions on the mechanised harvesting of rapeseed, precise estimates of maturity are needed. The integrated approach described here provides reliable information that can accurately narrow down the critical window during which the seed moisture content declines to the optimal threshold for mechanical harvesting, and can provide direct operational guidance for scheduling harvest operations, thereby effectively preventing yield and quality losses occurring from premature or delayed harvesting.
Performance comparison of machine learning methods
In this study, the performance of four machine-learning methods (SVR, RF, GBDT, and XGBoost) was compared in regard to estimating VIs, TFs, and a fusion of both features. XGBoost yielded the optimal estimation accuracy in the inversion based on the fusion of VIs and TFs, a finding that is consistent with those of Tian et al. (2021). Although RF is a popular ensemble learning method that can eliminate noise or overfitting when modelling a large number of interrelated input variables, it is difficult to train RF models efficiently with small sample sizes. In addition, the construction of SVR models in high-dimensional space requires a substantial sample size to represent the data distribution accurately. In contrast, XGBoost and GBDT have strong learning capabilities even when used with small datasets, and can solve high-dimensional nonlinear problems by converting them to linear ones using nonlinear transformations. In this case, only 150 samples were used to construct the inverse model; this may have hindered the effectiveness of training for the SVR and RF models, potentially resulting in inferior estimation performance compared to XGBoost and GBDT.
Limitations and research prospects
The limitations of this study include a small sample size (150 samples), which affected the performance of the four models used for inversion. In general, a larger sample size leads to more accurate predictions, and the small sample size considered in this research constrains the generalisability and reliability of the models to some extent (Wang et al., 2016). Furthermore, the experiment only involved multispectral images of the rapeseed canopy at a specific spatial resolution, and full assessments of the extracted spectral features and TFs at various resolution levels were not conducted. Previous studies (Liu et al., 2022; Zhang et al., 2020) have demonstrated the existence of a relationship between the spatial resolution of images and the inversion of crop PIs. In future research, the optimal spatial resolution for inverting the physiological parameters of a crop could be explored by examining spectral features and TFs at different resolutions.
Moreover, although this study included control experiments for different PIs of rapeseed, the selected regions had similar environmental variables, such as light intensity, duration of sunshine, and precipitation. During the short-term continuous monitoring period, the spectral features did not exhibit significant variations among different varieties, due to the nearly identical environmental conditions. The models used in this study did not explore the impacts of the environmental variables. There are some existing studies that can provide insights into the interactions between genotype, environment, and breeding and cultivation management for rapeseed (Ahmad et al., 2017; Wang et al., 2023b), and inverse modelling could be conducted in the future. The monitoring strategy for rapeseed proposed in this study can be extended to other crops for the inversion of moisture content or other parameters related to crop growth.
Despite these limitations, the integrated UAV monitoring strategy combining VIs and TFs presented in this study, and its successful application for the high-accuracy inversion of rapeseed maturity parameters (and particularly SMC), provides a practical framework for determining the optimal timing for mechanised harvesting. The core methodological framework could be extended to the monitoring of key harvest-stage parameters for other crops, such as wheat and soybean.
Conclusions
We extracted the VIs and TFs of the vegetation canopy using experimental data on SDF, SCF, and SMC collected during the harvesting period of rapeseed and multispectral imagery captured by UAVs. Through recursive feature elimination, highly significant remote sensing variables were selected. Four models (SVR, RF, GBDT, and XGBoost) were constructed separately to predict the SDF, SCF, and SMC for this growth stage, based on three different scenarios: VIs, TFs, and the fusion of VIs with TFs. The following conclusions can be drawn:
-
The fusion of VIs and TFs provides a more comprehensive picture of the physiological status of rapeseed during the harvesting period, leading to models with better fit and generalisation capability.
-
The performance of the four machine learning algorithms varied across the different scenarios, but the XGBoost model yielded superior accuracy and stability in estimating SDF, SCF, and SMC.
-
There were significant differences in the inversion results for different PIs within the same model, highlighting the model's advantages for specific indices. The estimation results for SMC matched the measured values most closely, offering technical support and data for decision-making in on the monitoring of rapeseed growth during the harvest period.
References
-
Ahmad, S., Abbas, G., Fatima, Z., Khan, R. J., Anjum, M. A., Ahmed, M., Khan, M. A., Porter, C. H., & Hoogenboom, G. (2017). Quantification of the impacts of climate warming and crop management on canola phenology in Punjab, Pakistan. Journal of Agronomy and Crop Science, 203 (5), 442 - 452. https://doi.org/10.1111/jac.12206
» https://doi.org/10.1111/jac.12206 -
Alabi, T. R., Abebe, A. T., Chigeza, G., & Fowobaje, K. R. (2022). Estimation of soybean grain yield from multispectral high-resolution UAV data with machine learning models in West Africa. Remote Sensing Applications Society and Environment, 27, 100782. https://doi.org/10.1016/j.rsase.2022.100782
» https://doi.org/10.1016/j.rsase.2022.100782 -
Barnes, E. M., Clarke, T. R., Richards, S. E., Colaizzi, P. D., Haberland, J., Kostrzewski, M., Waller, P., Choi, C., Riley, E., Thompson, T., Lascano, R. J., Li, H., Moran, M. S., Robert, P. C., Rust, R. H., & Larson, W. E. (2000, July 16-19). Coincident detection of crop water stress, nitrogen status and canopy density using ground-based multispectral data [Conference]. https://www.ars.usda.gov/SP2UserFiles/Place/53442010/RemoteSensing/WCLPUB-2227-Barnes.pdf
» https://www.ars.usda.gov/SP2UserFiles/Place/53442010/RemoteSensing/WCLPUB-2227-Barnes.pdf -
Bazzo, C. O. G., Kamali, B., Hütt, C., Bareth, G., & Gaiser, T. (2023). A review of estimation methods for aboveground biomass in grasslands using UAV. Remote Sensing, 15 (3), 639. https://doi.org/10.3390/rs15030639
» https://doi.org/10.3390/rs15030639 -
Bendig, J., Yu, K., Aasen, H., Bolten, A., Bennertz, S., Broscheit, J., Gnyp, M. L., & Bareth, G. (2015). Combining UAV-based plant height from crop surface models, visible, and near infrared vegetation indices for biomass monitoring in barley. International Journal of Applied Earth Observation and Geoinformation, 39, 79-87. https://doi.org/10.1016/j.jag.2015.02.012
» https://doi.org/10.1016/j.jag.2015.02.012 -
Chen, T., & Guestrin, C. (2016). XGBoost: A scalable tree boosting system [Conference], 785-794. https://doi.org/10.1145/2939672.2939785
» https://doi.org/10.1145/2939672.2939785 -
Corte, A. P. D., Souza, D. V., Rex, F. E., Sanquetta, C. R., Mohan, M., Silva, C. A., Zambrano, A. M. A., Prata, G., De Almeida, D. R. A., Trautenmüller, J. W., Klauberg, C., De Moraes, A., Sanquetta, M. N., Wilkinson, B., & Broadbent, E. N. (2020). Forest inventory with high-density UAV-Lidar: Machine learning approaches for predicting individual tree attributes. Computers and Electronics in Agriculture, 179, 105815. https://doi.org/10.1016/j.compag.2020.105815
» https://doi.org/10.1016/j.compag.2020.105815 -
Cortes, C., & Vapnik, V. (1995). Support-vector networks. Machine Learning, 20 (3), 273-297. https://doi.org/10.1007/bf00994018
» https://doi.org/10.1007/bf00994018 -
Gitelson, A. A., Gritz, Y., & Merzlyak, M. N. (2003). Relationships between leaf chlorophyll content and spectral reflectance and algorithms for non-destructive chlorophyll assessment in higher plant leaves. Journal of Plant Physiology, 160 (3), 271-282. https://doi.org/10.1078/0176-1617-00887
» https://doi.org/10.1078/0176-1617-00887 -
Gulden, R. H., Cavalieri, A., Syrovy, L. D., & Shirtliffe, S. J. (2017). Pod drop in Brassica napus is linked to weight-adjusted pod-retention resistance. Field Crops Research, 205, 34 - 44. https://doi.org/10.1016/j.fcr.2017.02.002
» https://doi.org/10.1016/j.fcr.2017.02.002 -
Haralick, R. M., Shanmugam, K., & Dinstein, I. (1973). Textural features for image classification. IEEE Transactions on Systems Man and Cybernetics, SMC-3 (6), 610 - 621. https://doi.org/10.1109/tsmc.1973.4309314
» https://doi.org/10.1109/tsmc.1973.4309314 -
Herrero-Huerta, M., Rodriguez-Gonzalvez, P., & Rainey, K. M. (2020). Yield prediction by machine learning from UAS-based multi-sensor data fusion in soybean. Plant Methods, 16, 78. https://doi.org/10.1186/s13007-020-00620-6
» https://doi.org/10.1186/s13007-020-00620-6 -
Hong, G., Luo, M. R., Rhodes, P. A. (2000). A study of digital camera colorimetric characterization based on polynomial modeling. Color Research & Application, 26(1), 76-84. https://doi.org/10.1002/1520-6378(200102)26:1<76::AID-COL8>3.0.CO;2-3
» https://doi.org/10.1002/1520-6378(200102)26:1<76::AID-COL8>3.0.CO;2-3 -
Hu, Q., Hua, W., Yin, Y., Zhang, X., Liu, L., Shi, J., Zhao, Y., Qin, L., Chen, C., & Wang, H. (2017). Rapeseed research and production in China. The Crop Journal, 5 (2), 127 - 135. https://doi.org/10.1016/j.cj.2016.06.005
» https://doi.org/10.1016/j.cj.2016.06.005 -
Huete, A., Didan, K., Miura, T., Rodriguez, E., Gao, X., & Ferreira, L. (2002). Overview of the radiometric and biophysical performance of the MODIS vegetation indices. Remote Sensing of Environment, 83 (1-2), 195-213. https://doi.org/10.1016/s0034-4257(02)00096-2
» https://doi.org/10.1016/s0034-4257 -
Ilniyaz, O., Du, Q., Shen, H., He, W., Feng, L., Azadi, H., Kurban, A., & Chen, X. (2023). Leaf area index estimation of pergola-trained vineyards in arid regions using classical and deep learning methods based on UAV-based RGB images. Computers and Electronics in Agriculture, 207, 107723. https://doi.org/10.1016/j.compag.2023.107723
» https://doi.org/10.1016/j.compag.2023.107723 -
Jordan, C. F. (1969). Derivation of leaf-area index from quality of light on the forest floor. Ecology, 50 (4), 663-666. https://doi.org/10.2307/1936256
» https://doi.org/10.2307/1936256 -
Kganyago, M., Adjorlolo, C., Mlangara, P., & Tsoeleng, L. (2024). Optical remote sensing of crop biophysical and biochemical parameters: An overview of advances in sensor technologies and machine learning algorithms for precision agriculture. Computers and Electronics in Agriculture, 218, 108730. https://doi.org/10.1016/j.compag.2024.108730
» https://doi.org/10.1016/j.compag.2024.108730 -
Liang, Y., Kou, W., Lai, H., Wang, J., Wang, Q., Xu, W., Wang, H., & Lu, N. (2022). Improved estimation of aboveground biomass in rubber plantations by fusing spectral and textural information from UAV-based RGB imagery. Ecological Indicators, 142, 109286. https://doi.org/10.1016/j.ecolind.2022.109286
» https://doi.org/10.1016/j.ecolind.2022.109286 -
Liu, S., Jin, X., Bai, Y., Wu, W., Cui, N., Cheng, M., Liu, Y., Meng, L., Jia, X., Nie, C., & Yin, D. (2023). UAV multispectral images for accurate estimation of the maize LAI considering the effect of soil background. International Journal of Applied Earth Observation and Geoinformation, 121, 103383. https://doi.org/10.1016/j.jag.2023.103383
» https://doi.org/10.1016/j.jag.2023.103383 -
Liu, S., Yu, H., Zhang, J., Zhou, H., Kong, L., Zhang, L., Dang, J., & Sui, Y. (2021). Study on inversion model of chlorophyll content in soybean leaf based on optimal spectral indices. Spectroscopy and Spectral Analysis, 41 (6), 1912 - 1919. https://doi.org/10.3964/j.issn.1000-0593 (2021)06-1912-08
» https://doi.org/10.3964/j.issn.1000-0593 (2021)06-1912-08 -
Liu, Y., Feng, H., Yue, J., Jin, X., Li, Z., & Yang, G. (2022). Estimation of potato above-ground biomass based on unmanned aerial vehicle red-green-blue images with different texture features and crop height. Frontiers in Plant Science, 13 https://doi.org/10.3389/fpls.2022.938216
» https://doi.org/10.3389/fpls.2022.938216 -
Louhaichi, M., Borman, M. M., & Johnson, D. E. (2001). Spatially located platform and aerial photography for documentation of grazing impacts on wheat. Geocarto International, 16 (1), 65 - 70. https://doi.org/10.1080/10106040108542184
» https://doi.org/10.1080/10106040108542184 -
Ma, B., Cao, G., Hu, C., & Chen, C. (2023). Monitoring the rice panicle blast control period based on UAV multispectral remote sensing and machine learning. Land, 12 (2), 469. https://doi.org/10.3390/land12020469
» https://doi.org/10.3390/land12020469 -
Maimaitijiang, M., Sagan, V., Sidike, P., Hartling, S., Esposito, F., & Fritschi, F. B. (2020). Soybean yield prediction from UAV using multimodal data fusion and deep learning. Remote Sensing of Environment, 237, 111599. https://doi.org/10.1016/j.rse.2019.111599
» https://doi.org/10.1016/j.rse.2019.111599 -
Menendez, Y. C., Botto, J. F., Gomez, N. V., Miralles, D. J., & Rondanini, D. P. (2019). Physiological maturity as a function of seed and pod water concentration in spring rapeseed ( Brassica napus L.). Field Crops Research, 231, 1-9. https://doi.org/10.1016/j.fcr.2018.11.002
» https://doi.org/10.1016/j.fcr.2018.11.002 -
Meyer, G. E., & Neto, J. C. (2008). Verification of color vegetation indices for automated crop imaging applications. Computers and Electronics in Agriculture, 63 (2), 282 - 293. https://doi.org/10.1016/j.compag.2008.03.009
» https://doi.org/10.1016/j.compag.2008.03.009 -
Nijland, W., Bolton, D., Coops, N., & Stenhouse, G. (2016). Imaging phenology; scaling from camera plots to landscapes. Remote Sensing of Environment, 177, 13-20. https://doi.org/10.1016/j.rse.2016.02.018
» https://doi.org/10.1016/j.rse.2016.02.018 -
Noureldin, N., Aboelghar, M., Saudiy, H., & Ali, A. (2013). Rice yield forecasting models using satellite imagery in Egypt. Egyptian Journal of Remote Sensing and Space Science, 16 (1), 125 - 131. https://doi.org/10.1016/j.ejrs.2013.04.005
» https://doi.org/10.1016/j.ejrs.2013.04.005 -
Oliveira, M. F., Carneiro, F. M., Ortiz, B. V., Thurmond, M., Oliveira, L. P., Bao, Y., Sanz-Saez, A., & Tedesco, D. (2024). Predicting below and above-ground peanut biomass and maturity using multi-target regression. Computers and Electronics in Agriculture, 218, 108647. https://doi.org/10.1016/j.compag.2024.108647
» https://doi.org/10.1016/j.compag.2024.108647 -
Rouse, J. W., Haas, R. H., Schell, J. A., & Deering, D. W. (1974). Monitoring vegetation systems in the great plains with ERTS. NASA Special Publication, 351, 309. http://ui.adsabs.harvard.edu/abs/1974NASSP..351..309R/abstract
» http://ui.adsabs.harvard.edu/abs/1974NASSP..351..309R/abstract -
Sagan, V., Maimaitijiang, M., Bhadra, S., Maimaitiyiming, M., Brown, D. R., Sidike, P., & Fritschi, F. B. (2021). Field-scale crop yield prediction using multi-temporal WorldView-3 and PlanetScope satellite data and deep learning. ISPRS Journal of Photogrammetry and Remote Sensing, 174, 265-281. https://doi.org/10.1016/j.isprsjprs.2021.02.008
» https://doi.org/10.1016/j.isprsjprs.2021.02.008 -
Schneider, P., Roberts, D., & Kyriakidis, P. (2008). A VARI-based relative greenness from MODIS data for computing the Fire Potential Index. Remote Sensing of Environment, 112 (3), 1151 - 1167. https://doi.org/10.1016/j.rse.2007.07.010
» https://doi.org/10.1016/j.rse.2007.07.010 -
Shao, G., Han, W., Zhang, H., Wang, Y., Zhang, L., Niu, Y., Zhang, Y., & Cao, P. (2022). Estimation of transpiration coefficient and aboveground biomass in maize using time-series UAV multispectral imagery. Crop Journal, 10 (5), 1376-1385. https://doi.org/10.1016/j.cj.2022.08.001
» https://doi.org/10.1016/j.cj.2022.08.001 -
Slater, P. N., & Jackson, R. D. (1982). Atmospheric effects on radiation reflected from soil and vegetation as measured by orbital sensors using various scanning directions. Applied Optics, 21 (21), 3923. https://doi.org/10.1364/ao.21.003923
» https://doi.org/10.1364/ao.21.003923 -
Tian, Y., Huang, H., Zhou, G., Zhang, Q., Tao, J., Zhang, Y., & Lin, J. (2021). Aboveground mangrove biomass estimation in Beibu Gulf using machine learning and UAV remote sensing. Science of the Total Environment, 781, 146816. https://doi.org/10.1016/j.scitotenv.2021.146816
» https://doi.org/10.1016/j.scitotenv.2021.146816 -
Tucker, C. J. (1979). Red and photographic infrared linear combinations for monitoring vegetation. Remote Sensing of Environment, 8 (2), 127-150. https://doi.org/10.1016/0034-4257(79)90013-0
» https://doi.org/10.1016/0034-4257(79)90013-0 -
Verrelst, J., Schaepman, M., Koetz, B., & Kneubühler, M. (2008). Angular sensitivity analysis of vegetation indices derived from CHRIS/PROBA data. Remote Sensing of Environment, 112 (5), 2341 - 2353. https://doi.org/10.1016/j.rse.2007.11.001
» https://doi.org/10.1016/j.rse.2007.11.001 -
Wan, L., Cen, H., Zhu, J., Zhang, J., Zhu, Y., Sun, D., Du, X., Zhai, L., Weng, H., Li, Y., Li, X., Bao, Y., Shou, J., & He, Y. (2020). Grain yield prediction of rice using multi-temporal UAV-based RGB and multispectral images and model transfer-A case study of small farmlands in the South of China. Agricultural and Forest Meteorology, 291, 108096. https://doi.org/10.1016/j.agrformet.2020.108096
» https://doi.org/10.1016/j.agrformet.2020.108096 -
Wang, C., Yang, C., Zhang, J., Kuai, J., Xie, J., Wu, W., Zuo, Q., Yan, M., Du, H., Ma, N., Liu, B., & You, L. (2023b). A PROSAIL model with a vegetation index lookup table optimized with in-situ statistics for rapeseed leaf area index estimation using diverse unmanned aerial vehicle sensors in the Yangtze River Basin. Computers and Electronics in Agriculture, 215, 108418. https://doi.org/10.1016/j.compag.2023.108418
» https://doi.org/10.1016/j.compag.2023.108418 -
Wang, D., Li, R., Liu, T., Liu, S., Sun, C., & Guo, W. (2023a). Combining vegetation, color, and texture indices with hyperspectral parameters using machine-learning methods to estimate nitrogen concentration in rice stems and leaves. Field Crops Research, 304, 109175. https://doi.org/10.1016/j.fcr.2023.109175
» https://doi.org/10.1016/j.fcr.2023.109175 -
Wang, L., Zhou, X., Zhu, X., Dong, Z., & Guo, W. (2016). Estimation of biomass in wheat using random forest regression algorithm and remote sensing data. Crop Journal, 4 (3), 212 - 219. https://doi.org/10.1016/j.cj.2016.01.008
» https://doi.org/10.1016/j.cj.2016.01.008 -
Wang, R., Lu, S., & Li, Q. (2019). Multi-criteria comprehensive study on predictive algorithm of hourly heating energy consumption for residential buildings. Sustainable Cities and Society, 49, 101623. https://doi.org/10.1016/j.scs.2019.101623
» https://doi.org/10.1016/j.scs.2019.101623 -
Wang, Y., Xiao, C., Wang, Y., Li, K., Yu, K., Geng, J., Li, Q., Yang, J., Zhang, J., Zhang, M., Lu, H., Du, X., Du, M., Tian, X., & Li, Z. (2024). Monitoring of cotton boll opening rate based on UAV multispectral data. Remote Sensing, 16 (1), 132. https://doi.org/10.3390/rs16010132
» https://doi.org/10.3390/rs16010132 -
Zhang, C., Huang, C., Li, H., Liu, Q., Li, J., Bridhikitti, A., & Liu, G. (2020). Effect of textural features in remote sensed data on rubber plantation extraction at different levels of spatial resolution. Forests, 11 (4), 399. https://doi.org/10.3390/f11040399
» https://doi.org/10.3390/f11040399 -
Zhang, Y., Xia, C., Zhang, X., Cheng, X., Feng, G., Wang, Y., & Gao, Q. (2021). Estimating the maize biomass by crop height and narrowband vegetation indices derived from UAV-based hyperspectral images. Ecological Indicators, 129, 107985. https://doi.org/10.1016/j.ecolind.2021.107985
» https://doi.org/10.1016/j.ecolind.2021.107985 -
Zhou, X., Zheng, H., Xu, X., He, J., Ge, X., Yao, X., Cheng, T., Zhu, Y., Cao, W., & Tian, Y. (2017). Predicting grain yield in rice using multi-temporal vegetation indices from UAV-based multispectral and digital imagery. ISPRS Journal of Photogrammetry and Remote Sensing, 130, 246-255. https://doi.org/10.1016/j.isprsjprs.2017.05.003
» https://doi.org/10.1016/j.isprsjprs.2017.05.003 -
Zhou, Y., Lao, C., Yang, Y., Zhang, Z., Chen, H., Chen, Y., Chen, J., Ning, J., & Yang, N. (2021). Diagnosis of winter-wheat water stress based on UAV-borne multispectral image texture and vegetation indices. Agricultural Water Management, 256, 107076. https://doi.org/10.1016/j.agwat.2021.107076
» https://doi.org/10.1016/j.agwat.2021.107076
-
Data Availability Statement:
The datasets generated during and/or analyzed during the current study are available from the corresponding author on reasonable request.
-
Funding:
This research was funded by the Ministry of Agriculture and Rural Affairs of the People's Republic of China under the agricultural core technology research project (NK202303040106).
Edited by
-
Area Editor:
Tatiana Fernanda Canata
The datasets generated during and/or analyzed during the current study are available from the corresponding author on reasonable request.