Study of the interaction between performance and vibration of a threshing system under variable rotational speed
Abstract
To overcome the limitations of traditional fixed-speed threshing, this study applied a variable-speed pulley transmission to a threshing device, with the aim of systematically investigating the coupling relationships between working performance, vibration characteristics, and the mechanism of speed variation during threshing. Using a cross-flow threshing unit, bench tests were used to compare fixed-speed and three variable-speed modes (T/2, T/3, T/4), in terms of threshing performance (impurity rate, loss rate, broken stems) and axial vibration characteristics across feed rates of 0.0–2.5 kg/s. The results indicate that variable-speed threshing reduces the loss rate by 0.45–1.79%, compared to fixed-speed operations. Among these, T/2 and T/4 modes exhibited better adaptability to varying feed rates; whereas, T/3 was prone to clogging at high feed rates. Vibration analysis revealed that non-circular pulleys introduced significant periodic excitation, whilst feeding significantly increased the vibration acceleration and prolonged its duration; the duration increased, almost linearly, with the feed rate. Notably, variable-speed threshing, especially T/2 and T/4 modes, enabled faster recovery of vibration acceleration to a stable state after threshing, indicating a superior dynamic response. This study clarifies the intrinsic "speed–performance–vibration" relationship in non-circular pulley variable-speed threshing, providing a theoretical and data foundation for developing intelligent threshing equipment that balances high efficiency and low vibration.
Keywords:
variable speed; threshing; vibration characteristics; working performance
Introduction
Agricultural mechanisation and intelligentisation are fundamental to ensuring national food security and advancing agricultural modernisation (Dong et al., 2024). The threshing device is often regarded as the "heart" of a combine harvester and directly determines the machine's operational efficiency, grain quality, and economic return (Dong et al., 2023). Conventional threshing drums typically operate at a fixed speed and are valued for their structural simplicity and ease of control; they remain widely used in production (Gu et al., 2025). However, agricultural conditions are highly variable, with frequent fluctuations in crop feed rate and moisture content exhibiting significant randomness and non-uniformity (Li et al., 2022). Fixed-speed threshers struggle to dynamically adapt to such time-varying workloads, often resulting in incomplete threshing, high breakage rates, and increased grain loss, which limit further improvements in harvest quality (Yang et al., 2025). Furthermore, the intense vibration and noise generated during their operation, not only affect operator comfort but, also, pose long-term risks to transmission-system reliability and structural integrity, potentially shortening the equipment’s service life (Bhandari & Jotautiene, 2022). Consequently, developing new threshing technologies that can adapt to varying conditions, while delivering high performance and low vibration, has become a key research focus in agricultural machinery (Dai et al., 2023).
To address the limitations of fixed-speed threshing, variable-speed threshing technology has emerged and attracted widespread research interest (Ji et al., 2025). Among the proposed solutions, mechanisms based on non-circular gears or pulleys offer a promising approach. These mechanisms convert a constant motor input speed into the periodic non-uniform motion of the threshing drum, introducing dynamic, rhythmic impacts and rubbing actions into the threshing process (Ji et al., 2020; Syuhri et al., 2018). Theoretical and preliminary experimental studies suggest that this periodic speed variation can optimise the threshing and separation process by altering the instantaneous relative speed and force between the grain and threshing elements. This may effectively reduce grain damage, while improving adaptability to uneven feed conditions, and enhance overall threshing performance (Que et al., 2024; Yu et al., 2023).
Nevertheless, this approach presents its own challenges. The inherent mass eccentricity and periodic excitation of non-circular transmission mechanisms inevitably introduce new and complex vibration sources during operations (Tang et al., 2025). This creates a coupled "performance–vibration" system. The performance benefits of speed variation may be counteracted by induced vibrations and the resulting dynamic loads can accelerate bearing wear, cause structural fatigue, and even compromise operational safety (Hao et al., 2022; Wang et al., 2023; Wang et al., 2021). Recent research into non-circular pulley variable-speed threshing devices has primarily focused on performance improvements but largely neglected the evolution of their vibration characteristics (Chai et al., 2020; Wang et al., 2024). A systematic investigation into the intrinsic coupling relationship and mechanism between performance and vibration in such systems is notably lacking. This gap in our understanding significantly hinders the precise design and practical application of this technology in equipment demanding high reliability and operational quality (Liu et al., 2022; Song et al., 2022).
Therefore, this study takes the non-circular pulley variable-speed threshing device as its research object, with the primary aim of systematically revealing the coupling relationship between its operational performance and vibration characteristics, clarifying the underlying mechanisms of speed variation. Through integrated bench testing and signal analysis, our work focuses on the following objectives: (1) analyse the effects of different speed modes (T/2, T/3, and T/4) and feed rates on performance indicators, including impurity content, grain loss rate, and stalk breakage patterns; (2) investigate the time-domain and frequency-domain vibration response characteristics at the device's shaft end under variable-speed conditions and elucidate their fundamental differences from fixed-speed operations; and (3) establish an intrinsic connection between threshing performance and dynamic vibration characteristics, ultimately constructing a correlated "speed–performance–vibration" model. The findings should provide a theoretical foundation (and data support) for optimising the design and control strategies of a new generation of intelligent, high-efficiency, low-loss, and stable-operation threshing equipment.
Material and Methods
Threshing separation performance test method
In order to evaluate the threshing separation performance of the threshing device in a rice harvester, five different quality samples of 0.5, 1.0, 1.5, 2.0 and 2.5 kg of rice were used in this study. Rice varieties cultivated in different regions vary, leading to differences in the physical and mechanical properties of rice plants. To facilitate the acquisition of experimental materials, the rice variety "Hui Liang You Si Miao”, which is readily available in Zhenjiang City (Jiangsu Province), was selected as the experimental material for subsequent studies on the variation in plant traits during threshing and for performance tests on threshing and separation. The basic characteristics of the rice plants are shown in Table 1.
In the threshing performance test, five groups of rice samples of the same quality were successively put into the threshing device by means of artificial continuous feeding.
During the period from the head of the first group of samples entering the threshing chamber to the root of the last group of samples entering the threshing chamber, the feeding amount of the threshing drum was approximately 0.5, 1.0, 1.5, 2.0 and 2.5 kg/s. After the threshing was complete, the ejected material under the screen of the concave sieve of the threshing device, and at the straw outlet, were collected for subsequent analysis. The impurities and grain quality after manual cleaning were accurately weighed by electronic scales and recorded. In addition, the culm in the mixture under the concave sieve was manually selected for subsequent testing and analysis.
Three indexes were set to evaluate threshing performance: impurity content, loss rate, and stem damage degree. Among these, the impurity content is defined as the impurities dropped from the lower concave screen of the threshing device as a percentage of the total mass of the removed mixture. The impurities mainly include non-grain materials such as straw, glume husk and stone. In this experiment, only short straw was included in the impurity content calculation and the influence of other impurities, such as glume husk and stone, was not considered.
Where:
ZZ is the impurity content;
m2 is the quality of impurities dropped by the threshing device from the lower concave sieve screen, and
M2 is the total mass of the mixture dropped by the threshing device from the lower concave screen.
The loss rate of the thresher is the percentage of the lost kernel mass as a percentage of the receivable kernel mass. The loss rate includes the entrainment loss rate and the unstripped loss rate.
Where:
S is the loss rate;
m3 is the mass of entrained and unpurified grains in the threshing device, and
M3 is the quality of the grain received by the threshing device.
The broken rice stems were divided into long, medium and short stems, according to the length of rice stalks in the mixture extracted under the gravure screen. Stem lengths longer than 200 mm are considered to be ‘long’, stem lengths between 70 and 200 mm are ‘medium’, and stem lengths shorter than 70 mm are ‘short’. The proportion of each stem length in the mixture extruded under the gravure screen was calculated.
In the threshing tests, the incomplete collection of discharged materials and potential errors during manual grain sorting inevitably introduce certain deviations into the experimental data. To address this issue, when analysing the performance results of the threshing cylinder, the total mass of the mixture collected below the concave sieve and the weight of cleaned seeds are used as reference benchmarks for calculating other relevant parameters. The specific calculations are:
Mass of the mixture discharged from the straw outlet = Total feed mass − Mass of mixture below the concave sieve; and Mass of impurities below the concave sieve = Mass of mixture below the concave sieve − Mass of grains below the concave sieve.
Test method of vibration characteristics of threshing device with variable speed
During the process of testing the threshing device, it was observed that the vibration of the threshing device is more significant under the drive of the variable speed transmission mechanism. Compared with a round pulley, a non-round pulley may cause more intense vibration due to its irregular shape. This vibration may adversely affect the working reliability of the variable speed transmission mechanism, as well as the transmission efficiency. In addition, due to the phenomenon of drum imbalance, when the threshing device is fed into the rice under the circular belt wheel drive mode, the threshing time of the constant speed threshing drum can be approximately determined by comparing the difference in vibration characteristics of the threshing device under a no-load threshing state.
In the vibration characteristics test of the cross-axial flow threshing device, the vibration of the threshing device was tested by installing an acceleration sensor and setting the feeding amount to 0.0, 0.5, 1.0, 1.5, 2.0 and 2.5 kg/s, respectively. The test method for the vibration characteristics of the threshing device after installing the variable speed transmission mechanism was the same as that of the constant speed threshing cylinder. The vibration testing equipment used was the vibration test software produced by China Donghua Vibration Test Co., Ltd. and the accompanying DH5902 vibration test acquisition analyser.
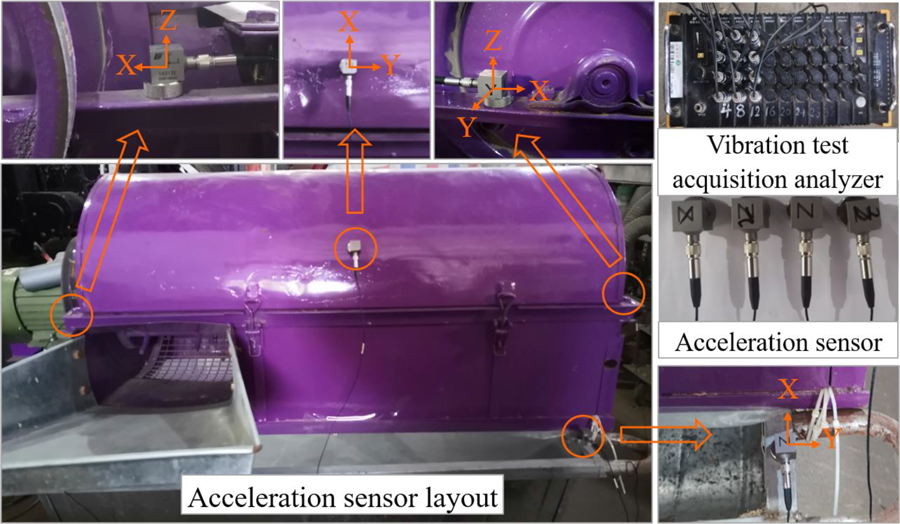
The vibration test acquisition and analysis system is shown in Figure 1. The acquisition instrument has 38 terminals, 36 of which are used for vibration test channels. The instrument is equipped with a wireless module, which can realise the real-time transmission of short and medium distance data during the test, convert the collected analogue signal into a digital signal in real time, and transmit it to the software for real-time analysis, storage and follow-up processing. Three axis acceleration sensors were used in the test and the measurement direction of each sensor was consistent with the relative coordinate direction. The arrangement of the sensors is shown in Figure 1: the radial direction of the grain roller coincides with the X direction of the sensor and the axial direction coincides with the Y direction of the sensor. Sensor 1 and Sensor 4 were mounted on the bearing housings at both ends of the threshing drum, Sensor 2 was mounted on the threshing drum top cover, and Sensor 3 was mounted on the rack.
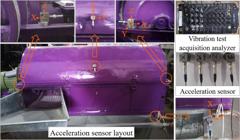
In the test, the motor speed was set to 2800 r/min. The vibration signal acquisition system was started and then the power supply was switched on. When the rotating speed of the threshing drum reached a relatively stable state, the rice plants began to be fed in. When all the rice had been completely threshed, and there was no residue in the threshing room, the power supply was cut off and the vibration signal stopped, after the threshing drum had completely stopped. The whole signal acquisition time varied slightly, depending on the quality of the rice. To reduce errors, the experiment was repeated three times for each feeding quantity. After completing a set of vibration characteristic tests with different ‘feedings’, the pulley was replaced and the central distance of the pulley was adjusted, to re-tighten it. These steps were repeated and the next set of tests were successively carried out until the vibration characteristic testing of four kinds of belt wheels were completed for different feeding amounts. Finally, DHDAS dynamic signal acquisition and analysis system software was used to conduct follow-up processing and analysis of the test results.
Results and Discussion
Analysis of impurity content of the extracted mixture and stalk length
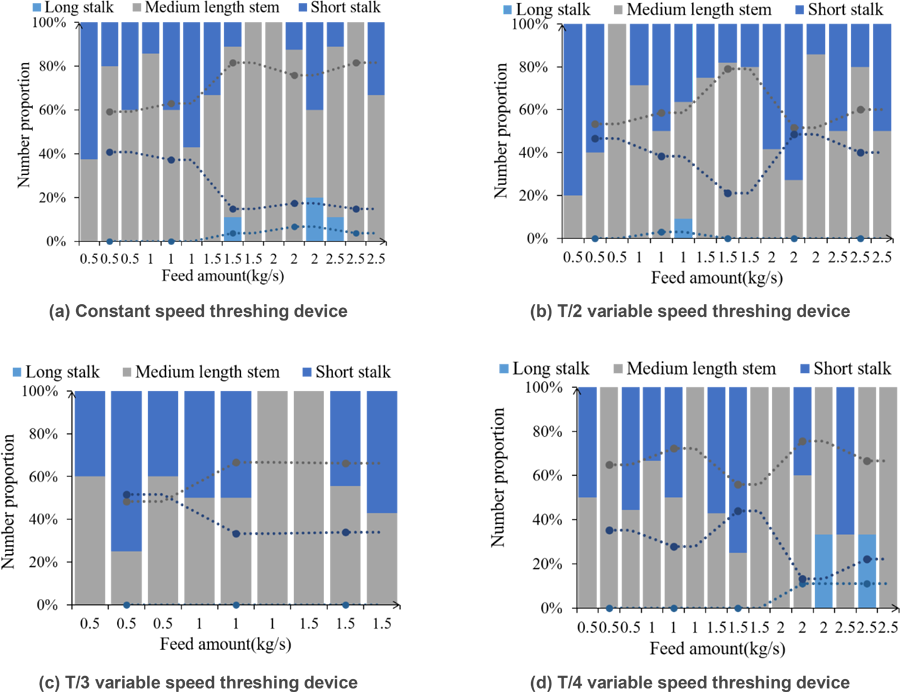
In order to analyse stalk fracture characteristics under different working conditions, the lengths of stalk segments in the mixture discharged from the threshing zone were examined and classified. Under each test condition, the discharged mixture was manually cleaned and the stalk fragments, of varying lengths and breakage patterns, were selected for assessment. The results are presented in Figure 2.
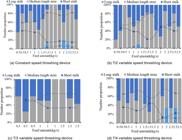
Figure 2(a) shows the threshing test results of a constant speed threshing cylinder. According to the analysis and calculations, under different working conditions, the mixture mass extracted from the concave sieve accounted for 40.63-74.48% of the total mass. The impurity content was 2.09-7.34% and the impurities under the concave sieve included partially broken stalks, rice leaves and stems with a certain integrity. In terms of the number of culms: medium culms > short culms > long culms. When feeding amounts were 0.5 kg/s and 1.0 kg/s, there were no long stalks in the pull-out mixture but long stalks were observed in the 1.5, 2.0 and 2.5 kg/s feeds. In general, with increasing amounts of feed, long stalks appeared in the extracted mixture, with the proportion of medium stalks increasing and the corresponding proportion of short stalks decreasing.
Figure 2(b) shows the threshing test results of the T/2 variable speed threshing cylinder. Under different working conditions, the mixture extracted from the concave sieve accounted for about 36.87-55.61% of the total mass. The impurity content was about 2.73-9.93% and, with respect to stalk content, middle stalks > short stalks > long stalks, which was the same as for the constant speed threshing device. A long stalk only appeared when the feeding amount was 1 kg/s. In general, with increased feeding amounts, there were no long stalks, and the number of medium stalks first increased but then decreased, while the number of short stalks first decreased and then increased. On the whole, the changing trend of each stalk length in the threshing test of the T/2 variable speed threshing device was the same as that of the constant speed threshing device. The only difference was that the proportions of short and medium stalks in the T/2 variable speed threshing device were close, when the feeding amount was 2 kg/s.
Figure 2(c) shows the threshing test results of the T/3 variable speed threshing drum. When the feeding amount reached 2 kg, the threshing drum became blocked and could not continue to operate normally. This indicates that, from the perspective of impurity rate, the designed T/3 speed-changing threshing drum had problems, such as low threshing feeding rates and high impurity rates. Only three conditions, with different feeding amounts, were completed in the test. The results show that the mixture extracted from the concave sieve accounted for 45.30-61.67% of the total mass and the impurity rate was 6.59-12.79%. With respect to the number of stalks, medium stalks > short stalks > long stalks once again. In general, with an increase in feeding amount, there were no long stalks, the number of middle stalks first increased and then stabilised, and the corresponding number of short stalks first decreased but then stabilised. On the whole, the changing trend of each stalk in the threshing test of the T/3 variable speed threshing device was the same as that of the constant speed threshing device but the feeding quantity test of the T/3 variable speed threshing device was less, which may affect the test results, due to insufficient data.
Figure 2(d) shows the threshing test results of the T/4 variable speed threshing cylinder. Under different working conditions, the mixture extracted from the concave sieve accounted for 42.80-60.33% of the total mass. The impurity content was 6.60-16.10% and the number of stalks maintained the same rule as in the threshing test of the constant speed threshing device, i.e. middle stalks > short stalks > long stalks. A long stalk only appeared when the feeding amount was 2.0 and 2.5 kg/s. In general, long stalks may occur with an increase in feeding amount, the number of middle stalks first decreased but then increased, and the number of short stalks first increased but then decreased, when the feeding rate was 1.5 kg/s.
Analysis of the loss rate of extruded mixture
The high water content of rice, the low rotation speed of the threshing drum, the large clearance of the concave screen, and the large feeding amounts may lead to large threshing losses. According to [eq. (2)], the loss rate of the extracted mixture, after threshing under different transmission modes, can be calculated. The loss rate includes entrainment loss and unstripped net loss. The loss rate results for the threshing device, under different transmission modes and different feeding quantities, are shown in Table 2.
Table 1 shows that, regardless of the constant speed or variable speed threshing drum, the loss rate of the extracted mixture after threshing was between 6.13% and 11.11%. With an increase in feeding amount, the loss rate of the removed mixture increased slightly, which may be due to the increase of feeding amount resulting in an increase in the thickness of the material layer entering the threshing drum, thus reducing the probability of the grain penetrating the material layer and resulting in an increase in the entrained loss rate. Under the same feeding amount, the loss rate of the threshing drum with variable speeds was slightly lower than that of the threshing drum with a constant speed. This indicates that the variable speed threshing drum can reduce the loss rate of the stripping mixture by 0.45-1.79%, compared to the constant speed threshing drum. Therefore, the design of the variable speed drive mechanism helps to reduce the threshing loss rate and improve the threshing separation performance.
The coefficient of variation of most of the test groups was less than 15%, indicating that the data from the three repeated tests had good consistency and the results were reliable. When the feeding rate was high (1.5-2.5 kg/s), the majority of variable-speed transmissions (T/2, T/4) had a coefficient of variation lower than 10%, demonstrating more stable threshing performance.
Vibration response analysis of threshing device with variable speed
Time domain characteristic analysis of shaft end vibration of variable speed threshing device
The core components of the cross-axial flow threshing device test bench used in the test included a frame, top cover, shaft, plate, nail tooth rod and nail tooth. Of these, the top tooth rod, nail teeth and plate were symmetrically distributed in the centre of the rotating axis. While the threshing device is running, the drum shaft may produce centrifugal force during the rotation process, due to factors such as uneven material organisation or assembly error. This centrifugal force will lead to bending vibration of the shaft and, if the vibration is intensified, it may cause resonance phenomena and, even, lead to the disintegration of the device. Therefore, the vibration characteristics of the shaft end of the threshing device not only affect the normal realisation of its function but are, also, directly related to whether the resonance phenomena will occur.
Since it is impossible to install the acceleration sensor directly on the rotating shaft, the sensor was installed on the shaft end of the threshing device in this test; the vibration of the shaft was indirectly reflected through the acceleration signal of the shaft end. When the motor speed was 2800 RPM, the acceleration signal of the variable speed transmission mechanism was tested and the response signal of the shaft end of the threshing device was obtained in the time domain. Taking the vibration characteristic test of the constant speed threshing device as an example, the acceleration response signals of the left and right shaft ends in the time domain were analysed. The acceleration response signals of the left and right axis ends of the constant speed threshing device, when the feeding amount was 0.5 kg/s, are shown in Figure 3.
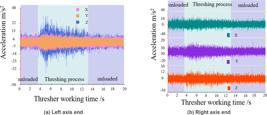
Acceleration signal of shaft end of threshing device at constant speed when feeding amount is 0.5 kg/s.
As shown in Figure 3, under no-load conditions, the acceleration signal of the threshing device presents periodic changes; positive and negative values only indicate the direction of acceleration. When the threshing device began to feed in rice, after idling and stabilising, the acceleration signal at the axial end changed significantly, gradually weakening and becoming stable as the threshing process progressed. When 0.5 kg rice was fed in, the maximum acceleration of the left axis end of the constant speed threshing device at 0.0-3.7 s was, basically, the same as that in no-load conditions. In the stage of rice feeding and threshing from 3.70 to 13.47 s, the Z-axis direction of the acceleration sensor at the left axis end changed most significantly. The maximum acceleration in the Z-axis direction of the left axis reached 37.629 m/s2, which was an increase of 172.79%, compared with 13.794 m/s2 in the no-load condition. The whole threshing process lasted about 9.77 s. During the same threshing process, the maximum acceleration in the Y-axis direction of the right axis end increased by 6.35%, the Z-axis direction increased by 17.04%, and the maximum acceleration in the X-axis direction decreased by 8.31%.
It can be seen that the impact force on the left axis end in the Z axis direction was greater, while the impact force on the right axis end in the X axis direction was greater when there was no load. This indicates that, when rice was fed radially from the left side of the drum, the maximum acceleration in all directions of the left and right axial ends increased, i.e. the two axial ends will suffer greater impact force.
Similarly, the vibration response signals of the left and right axis ends of the constant speed threshing device, with different feeding quantities in the time domain, are summarised in Table 3.
Acceleration response signals of the left and right axis ends of the constant speed threshing device in the time domain.
Table 3 shows that, after feeding rice into the system, the maximum value of the acceleration signal on the left and right axes of the constant speed threshing device increased in all directions, compared to that with no loading. However, at feeding rates of 0.5 and 2.0 kg/s, the maximum value of the acceleration sensor at the right axial end in the X direction decreased slightly, by 8.31% and 3.81%, respectively, compared with that under no loading. The variable range of acceleration of the threshing device was relatively stable under the no-load condition but the variation in the range of acceleration was significantly expanded after rice feeding, indicating that the impact force on the shaft end was increased due to the feeding in of the rice. For different feeding quantities, the acceleration of the left axis end in the Z direction was usually greater, while the acceleration of the right axis end in the X direction was more significant. In addition, the vibration time in the threshing process also increased with the increase of feeding mass and the changing trend was approximately linear.
The acceleration signal of the shaft end of the variable speed threshing device was analysed in a similar way to the analysis method used for the acceleration signal of the shaft end of the constant speed threshing device. The changes of acceleration signals at the left and right axis ends of the T/2 variable speed threshing device, with different feeding amounts, are shown in Figure 4.
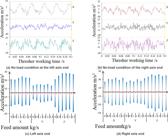
As shown in Figures 4(a) and 4(b), under no-load conditions, the acceleration signals of the left and right axial ends of the T/2 variable speed threshing device showed obvious periodic changes. In the 0.0-0.2 s period, the acceleration signal completed approximately five cycles of change, with the calculations showing that each cycle lasts about 0.04 s. This result is basically consistent with the calculated period of 0.0421 s for the angular speed change of the T/2 transmission mechanism. In this state, the maximum vibration acceleration of the left axis of the threshing device in the X direction was 32.105 m/s2, the maximum value in the Y direction was 17.457 m/s2, and the maximum value in the Z direction was 34.516 m/s2. The maximum vibration acceleration of the right axis was 25.849 m/s2 in the X direction, 25.239 m/s2 in the Y direction, and 38.759 m/s2 in the Z direction. It can be seen that the left and right axial ends of the threshing device suffer the largest impact force in the Z direction when no load is loaded. Compared with the impact of the constant speed threshing device under no-load, this impact is obviously greater, which may be caused by the characteristics of the pulley structure.
As shown in Figures 4(c) and 4(d), when rice is fed in, the maximum values of acceleration signals at the left and right axes of the T/2 variable speed threshing device in all directions were significantly higher than those with no load. This indicates that the feeding in of rice has a significant effect on the impact force at both axial ends of the threshing device. Under different feeding quantities, the acceleration signals of the left and right axial ends of the variable speed threshing device were always at a maximum in the Z direction. On the one hand, the increase of the acceleration signal on both sides of the axial end after rice feeding may be due to the characteristics of the non-circular pulley structure but, on the other hand, the dynamic load of the device was increased by the feeding in of the rice.
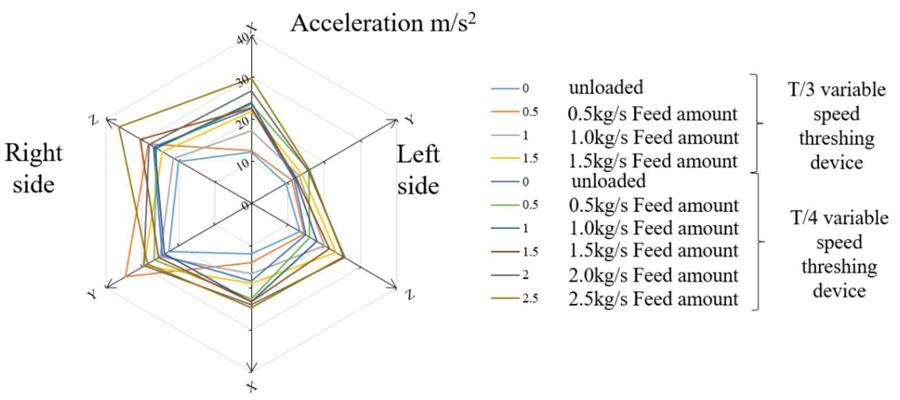
The testing of the T/3 variable speed threshing device caused a blockage phenomenon when the feeding amount reached 2.0 kg/s. Therefore, in the vibration characteristic test, only four feeding conditions (0.0, 0.5, 1.0, and 1.5kg/s) were investigated in the T/3 variable speed threshing device. The acceleration signal data of the T/3 variable speed threshing device, and other T/4 variable speed threshing devices, were summarised and analysed using the same method of vibration characteristic analysis as the constant speed threshing device, see Figure 5.
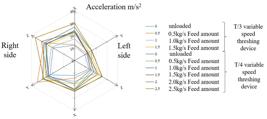
Changes in acceleration signals at the shaft end of T/3 variable speed threshing device and T/4 variable speed threshing device.
As shown in Figure 5, under no-load conditions, the acceleration of the left axis end of the T/3 variable speed threshing device in the Z direction was larger, while the acceleration of the right axis end in the Y direction was larger. When rice was fed in, the maximum values of acceleration signals at the left and right axes of the threshing device were significantly higher than those under no loading, in each direction. Specifically, the acceleration of the left axis end in the Z direction was still the maximum and the acceleration of the right axis end in the Y direction was still the most dominant, which is consistent with the no-load state. However, due to the relatively small amount of rice feeding that the T/3 variable speed threshing device can handle, the maximum vibration acceleration at both axial ends of the T/3 variable speed threshing device was slightly lower than for other variable speed threshing devices.
In the no-load operation of the T/4 variable speed threshing device, the acceleration in the X direction on the left axis was more significant, while the acceleration in the Z direction on the right axis was more prominent. When rice was fed in, the maximum value of the acceleration signals at the left and right axes of the threshing device increased, compared with that under no loading. At this time, the acceleration in the X direction of the left axis end still maintained a large value, while the acceleration in the right axis end may be in the Y direction or the Z direction, depending on the feeding conditions and the running state of the device.
Analysis of vibration frequency domain characteristics of shaft end of variable speed threshing device
Although the time domain characteristics of the shaft end vibration of a variable speed threshing device was analysed in our study, it is difficult to fully reflect the intensity of shaft end vibration merely through the shaft end vibration acceleration signal. Therefore, this section describes the findings of further fast Fourier transform (FFT), which was carried out on the acceleration signal of the variable speed threshing device, to obtain the spectral diagram of its frequency domain characteristics. The spectrum diagram allows the analysis of the main frequency components, which cause the vibration of the shaft end of the threshing device, and the corresponding vibration amplitude to be carried out, so as to understand the nature and source of vibration more deeply.
The speed of the small pulley was 2800r/min, and its base frequency was 46.67 Hz. The speed of pulley 1 was 700 r/min and its base frequency was 11.67 Hz. The base frequency range of the non-circular pulley can be calculated by converting the angular velocity range of each non-circular pulley into the speed range of the non-circular pulley. The angular velocity range of belt wheel 2 was 4199.109-4511.241 °/s and its base frequency was 11.66-12.53 Hz. The angular velocity variation range of pulley 2 was 4192.6211-4497.5724 °/s and its base frequency was 11.65-12.49 Hz. The angular speed variation range of pulley 4 was 4192.3544-4498.7758 °/s and its base frequency was 11.65-12.50 Hz.
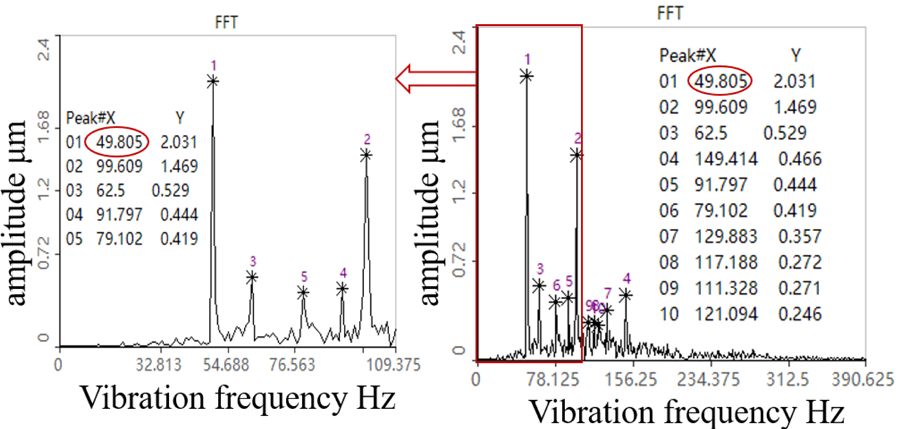
The vibration spectrum diagram of the left and right shaft ends of the constant speed threshing device (with no load) was analysed. By summarising and analysing the spectral graph data, which are close to the base frequencies of the two wheels. Under this condition, the Z direction spectrum diagram of the acceleration sensor on the left axis end of the threshing device is shown in Figure 6.
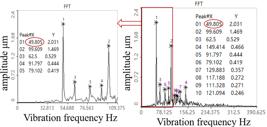
Z direction spectrum diagram of acceleration signal of the left axial end of the threshing device at constant speed under a no-load condition.
Figure 6 shows that the top 20 peak points of excitation frequency of the left axis end of the constant speed threshing device, under no-load, were mainly concentrated at 49.805-149.414 Hz, which belongs to the low frequency range. At this time, the maximum displacement of the end of the left axis in the Z direction was 2.031 microns. From the spectral diagram of the displacement at the axis end, it can be seen that the peak displacement is its largest at a frequency of 49.805 Hz. Because the speed of the motor and the speed of the small belt wheel are the same, there may be superposition of the excitation on the shaft end of the threshing device. Compared with the displacement of 2.031 microns in the X direction and 1.071 microns in the Y direction, at the left axis end at this moment, the displacement in the Z direction is larger. The results show that the amplitude of the Z direction of the left shaft end was at its largest when the constant speed blasting device was unloaded. The main excitation source may be the motor or small belt wheel and the vibration generated by the drive belt or belt wheel 1 has relatively little influence on the actual vibration of the left shaft end.
Analysis of the duration of vibration acceleration of the threshing device at variable speed
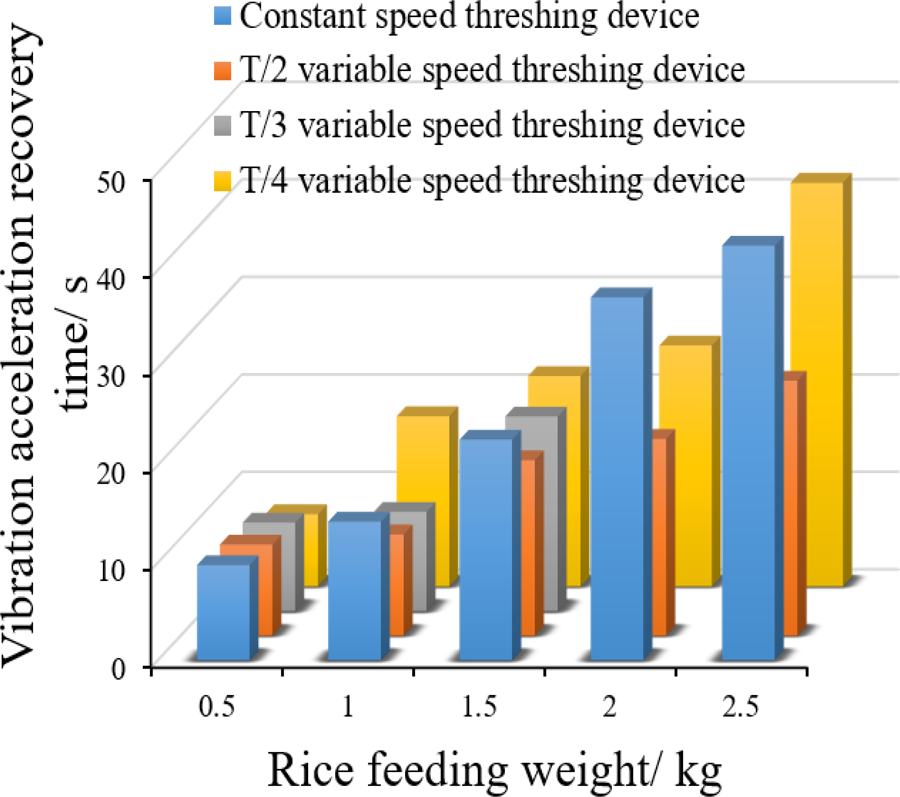
The vibration signal of the constant speed threshing device will change after feeding in the rice, i.e. the vibration characteristics of the no-load state and threshing state are different. The threshing test was carried out by feeding 0.0, 0.5, 1.0, 1.5, 2.0, and 2.5 kg rice into the threshing device at one time. Under different transmission mechanisms, the time of threshing rice of the same quality should be about the same. Taking the feeding of 0.5 kg rice as an example, the vibration acceleration signals in the Z direction of the left axis end of the constant speed threshing device and the T/2 variable speed threshing device change over time, as shown in Figure 7. Similarly, the vibration duration of the acceleration signal of the constant speed and variable speed threshing device under different feeding conditions is shown in Figure 8.
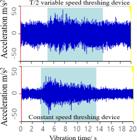
Change of vibration acceleration in the Z direction at the left axis end of the 0.5 kg rice threshing device.
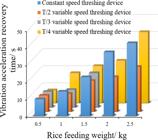
Under different transmission mechanisms, the threshing time required to process the same quantity of rice remained largely consistent. As shown in Figure 7, using the constant-speed threshing device as a reference, the Z-direction vibration acceleration at the left shaft end was compared between the constant-speed and T/2 variable-speed devices. In both cases, a sudden increase in acceleration occurred upon rice feeding, followed by a gradual decline towards the no-load state. However, the T/2 variable-speed device recovered to the baseline more quickly, suggesting that its drive mechanism better compensates for the imbalance induced by stalk entry.
Figure 8 illustrates that threshing time increased approximately linearly with feed mass—from about 9.77 s for 0.5 kg to 42.54 s for 2.5 kg of rice. Across all of the tested feed masses, the variable-speed devices consistently exhibited shorter vibration recovery times than the constant-speed device. Of these, the T/4 configuration performed best at 0.5 kg, while the T/2 device showed a greater advantage within the 1.0–2.5 kg range.
Conclusions
-
In terms of impurity content, the threshing performance of the T/2 variable-speed drum was better at a feeding rate of 0.5 kg/s, while the constant-speed drum performed better under other feeding rates. Regarding adaptability to varying feeding rates, the constant-speed, T/2 variable-speed, and T/4 variable-speed drums all out-performed the T/3 variable-speed drum. The loss rate for both constant-speed and variable-speed drums ranged from 6.13% to 11.11%, showing a slight increase with higher feeding rates. Notably, under the same feeding rate, variable-speed drums reduced the loss rate by 0.45–1.79% compared with the constant-speed drum, indicating that the variable-speed transmission mechanism offers advantages in lowering losses and improving separation performance.
-
The vibration characteristics at the shaft end of the variable-speed threshing device were significantly influenced by multiple factors. Under no-load conditions, the vibration acceleration exhibited clear periodic variations, which differed among the variable-speed configurations. When rice was fed in, acceleration signals increased markedly in all directions, reflecting a substantial rise in dynamic load and impact. Moreover, as feeding rate increased, the vibration duration during threshing became longer, demonstrating that vibration behaviour is closely related to the device’s structure and transmission mode.
-
Overall, the T/2 variable-speed device delivered better performance, in terms of impurity content at 0.5 kg/s; whereas, the constant-speed device was superior at 1.0–2.5 kg/s. With respect to loss rate, the T/4 variable-speed device performed the best. In terms of peak vibration acceleration, the T/3 variable-speed device was preferable. Regarding the recovery time of vibration acceleration, the T/4 device was better at 0.5 kg/s but the T/2 device was better at 1.0–2.5 kg/s.
References
-
Bhandari, S., & Jotautiene, E. (2022). Vibration Analysis of a Roller Bearing Condition Used in a Tangential Threshing Drum of a Combine Harvester for the Smooth and Continuous Performance of Agricultural Crop Harvesting. Agriculture-Basel, 12 (11). https://doi.org/10.3390/agriculture12111969
» https://doi.org/10.3390/agriculture12111969 -
Chai, X. Y., Zhou, Y., Xu, L. Z., Li, Y., Li, Y. M., & Lv, L. Y. (2020). Effect of guide strips on the distribution of threshed outputs and cleaning losses for a tangential-longitudinal flow rice combine harvester. Biosystems Engineering, 198, 223-234. https://doi.org/10.1016/j.biosystemseng.2020.08.009
» https://doi.org/10.1016/j.biosystemseng.2020.08.009 -
Dai, F., Zhao, Y. M., Liu, Y. X., Shi, R. J., Xin, S. L., Fu, Q. F., & Zhao, W. Y. (2023). Analysis and performance test on dynamic seed corn threshing and conveying process with variable diameter and spacing. International Journal of Agricultural and Biological Engineering, 16( 2), 259-266. https://doi.org/10.25165/j.ijabe.20231602.7741
» https://doi.org/10.25165/j.ijabe.20231602.7741 -
Dong, J., Cui, T., Zhang, D., Yang, L., He, X., Jing, M., Li, C., Xing, S., Jiang, Y., Xiao, T., & Wang, H. (2024). Development of a low-damage maize threshing system based on discrete element technology to effectively improve maize harvest quality and yield. Powder Technology, 448. https://doi.org/10.1016/j.powtec.2024.120297
» https://doi.org/10.1016/j.powtec.2024.120297 -
Dong, J., Zhang, D., Yang, L., Cui, T., Zhang, X., He, X., Wang, Z., & Jing, M. (2023). Discrete element method optimisation of threshing components to reduce maize kernel damage at high moisture content. Biosystems Engineering, 233, 221-240. https://doi.org/10.1016/j.biosystemseng.2023.08.005
» https://doi.org/10.1016/j.biosystemseng.2023.08.005 -
Gu, X. Y., Wang, B. Z., Tang, Z., Zhang, H. L., & Zhang, H. (2025). Automatic Vibration Balancing System for Combine Harvester Threshing Drums Using Signal Conditioning and Optimization Algorithms. Agriculture-Basel, 15 (14). https://doi.org/10.3390/agriculture15141564
» https://doi.org/10.3390/agriculture15141564 -
Hao, S. H., Tang, Z., Guo, S. B., Ding, Z., & Su, Z. (2022). Model and Method of Fault Signal Diagnosis for Blockage and Slippage of Rice Threshing Drum. Agriculture-Basel, 12 (11). https://doi.org/10.3390/agriculture12111968
» https://doi.org/10.3390/agriculture12111968 -
Ji, J. T., Hu, J. P., Wang, S. S., Zhang, R. H., & Pang, J. (2020). Vibration and impact detection of axial-flow threshing unit under dynamic threshing conditions. Inmateh-Agricultural Engineering, 60 (1), 183-192. https://doi.org/10.35633/inmateh-60-21
» https://doi.org/10.35633/inmateh-60-21 -
Ji, K. Z., Li, Y. M., Chen, Y. H., Liu, Y. B., Wang, H. H., & Yu, Z. W. (2025). Dynamic Vibration Modelling and Damping Optimisation of a Combine Harvester Cutter System Using Cuckoo Search Algorithm. International Journal of Acoustics and Vibration, 30 (2), 198-210. https://doi.org/10.20855/ijav.2025.30.22131
» https://doi.org/10.20855/ijav.2025.30.22131 -
Li, Y., Xu, L. Z., Lv, L. Y., Shi, Y., & Yu, X. (2022). Study on Modeling Method of a Multi-Parameter Control System for Threshing and Cleaning Devices in the Grain Combine Harvester. Agriculture-Basel, 12 (9). https://doi.org/10.3390/agriculture12091483
» https://doi.org/10.3390/agriculture12091483 -
Liu, Y. B., Li, Y. M., Dong, Y. H., Huang, M. S., Zhang, T., & Cheng, J. H. (2022). Development of a variable-diameter threshing drum for rice combine harvester using MBD - DEM coupling simulation. Computers and Electronics in Agriculture, 196. https://doi.org/10.1016/j.compag.2022.106859
» https://doi.org/10.1016/j.compag.2022.106859 -
Que, K. X., Tang, Z., Wang, T., Su, Z., & Ding, Z. (2024). Effects of Unbalanced Incentives on Threshing Drum Stability during Rice Threshing. Agriculture-Basel, 14 (5). https://doi.org/10.3390/agriculture14050777
» https://doi.org/10.3390/agriculture14050777 -
Song, Z. C., Diao, P. S., Cui, P. D., Wei, M. J., Miao, H. Q., & Yao, W. Y. (2022). Design and experimental study of flexible threshing device for longitudinal axial flow corn. Inmateh-Agricultural Engineering, 67 (2), 155-165. https://doi.org/10.35633/inmateh-67-15
» https://doi.org/10.35633/inmateh-67-15 -
Syuhri, A., Sholahuddin, I., Syuhri, S. N. H., & Qoryah, R. D. H. (2018). Modeling and evaluation of a threshing drum under vertical vibration. Journal of Mechanical Engineering and Sciences, 12 (2), 3750-3758. https://doi.org/10.15282/jmes.12.2.2018.19.0331
» https://doi.org/10.15282/jmes.12.2.2018.19.0331 -
Tang, Q. S., Ma, Z. H., Zheng, W. X., Li, C. F., Jiang, Q., & Xu, L. Y. (2025). Modeling and analysis of coupling vibration of flexible disk-drum structure considering eccentricity effect. Journal of Vibration and Control https://doi.org/10.1177/10775463241310279
» https://doi.org/10.1177/10775463241310279 -
Wang, F. Z., Liu, Y. B., Li, Y. M., & Ji, K. Z. (2023). Research and Experiment on Variable-Diameter Threshing Drum with Movable Radial Plates for Combine Harvester. Agriculture-Basel, 13 (8). https://doi.org/10.3390/agriculture13081487
» https://doi.org/10.3390/agriculture13081487 -
Wang, J. W., Xu, C. S., Xu, Y. A., Qi, X., Liu, Z. M., & Tang, H. (2021). Vibration Analysis and Parameter Optimization of the Longitudinal Axial Flow Threshing Cylinder. Symmetry-Basel, 13 (4). https://doi.org/10.3390/sym13040571
» https://doi.org/10.3390/sym13040571 -
Wang, L. H., Chai, X. Y., Huang, J., Hu, J. P., & Cui, Z. H. (2024). Efficient and Low-Loss Cleaning Method for Non-Uniform Distribution of Threshed Materials Based on Multi-Wing Curved Combination Air Screen in Computational Fluid Dynamics/Discrete Element Method Simulations. Agriculture-Basel, 14 (6). https://doi.org/10.3390/agriculture14060895
» https://doi.org/10.3390/agriculture14060895 -
Yang, R. B., Wang, P. Y., Qing, Y. R., Chen, D. Q., Chen, L., & Sun, W. B. (2025). Discrete element simulation optimization design and testing of low-damage flexible drum threshing elements suitable for high-quality seed harvesting. Scientific Reports, 15 (1). https://doi.org/10.1038/s41598-025-94007-z
» https://doi.org/10.1038/s41598-025-94007-z -
Yu, Z. W., Li, Y. M., Xu, L. Z., Du, X. X., & Ji, K. Z. (2023). Unbalanced variation after assembly and double-speed influence coefficient method in the threshing drum. International Journal of Agricultural and Biological Engineering, 16 (6), 1-10. https://doi.org/10.25165/j.ijabe.20231606.7651
» https://doi.org/10.25165/j.ijabe.20231606.7651
-
Data availability:
The data used to support the findings of this study are available from the corresponding author upon request.
-
Funding:
This research was supported by the Taizhou Science and Technology Support Programme (Agriculture) Project (TN202315) and the Key Laboratory Equipment of Modern Agricultural Equipment and Technology (Jiangsu University), Ministry of Education (MAET202306).
Edited by
-
Area Editor:
Gizele Ingrid Gadotti
The data used to support the findings of this study are available from the corresponding author upon request.