Expanding the mitochondrial genomic toolkit for Polyneoptera: New mitogenomes and evaluation of reduced marker sets for phylogeny and DNA barcoding
Abstract
Polyneoptera comprises hemimetabolous insect orders of significant agricultural, ecological, and medical relevance, motivating phylogenetic and molecular research that has nevertheless focused predominantly on canonical mitochondrial markers. Here, we assembled new mitogenomes for Polyneoptera and evaluated the usefulness of genes located in nucleotide-diversity hotspots as markers for species identification and phylogenetic inference. To expand the available mitogenomic resources, raw sequencing data were retrieved from public databases, resulting in the assembly and annotation of 26 complete mitogenomes, all exhibiting the typical insect mitochondrial architecture. These newly assembled genomes were combined with publicly available mitogenomes from Orthoptera, Blattodea, Plecoptera, Mantodea, and Phasmatodea to reconstruct phylogenetic relationships using both complete and reduced datasets comprising nucleotide-diversity hotspot-associated genes. The performance of these hotspot regions was further assessed through barcoding gap analyses and comparisons with the most comprehensive datasets to identify candidate mitochondrial markers for molecular species identification and phylogenetic inference. Across orders, different mitochondrial regions, including the classical markers 16S and COX1, as well as genes from the NADH dehydrogenase complex, emerged as the most informative, although optimal markers varied among lineages. Overall, our findings highlight the value of publicly accessible sequencing data for generating high-quality genomic resources and improving phylogenetic and taxonomic tools.
Keywords:
Arthropoda; barcode; insecta; mitochondrial genome assembly; molecular marker
Introduction
The superorder Polyneoptera comprises the orders Blattodea, Mantodea, Phasmatodea, Orthoptera, Plecoptera, Mantophasmatodea, Grylloblattodea, Embioptera, and Zoraptera. Species within this group occupy a wide range of ecological niches and exhibit remarkable morphological diversity, as well as diverse dietary habits and ecological behaviors (Wipfler et al., 2019). Moreover, Polyneoptera holds particular relevance for evolutionary and molecular identification studies, given that many of its species serve as indicators of water quality (Morinière et al., 2017), function as invasive urban pests or potential vectors of pathogens (Nasirian, 2017), or act as agricultural pests (Githae and Kuria, 2021).
The evolutionary aspects of Polyneoptera have been extensively investigated, and the monophyly of the group is well established, supported by both morphological and molecular evidence (Yoshizawa, 2011; Song et al., 2016; Wipfler et al., 2019). Among the molecular resources used in phylogenetic studies, the mitochondrial genome stands out as a widely applied and generally reliable marker for resolving intra-ordinal relationships and other evolutionary questions, owing to its conserved gene content and predictable mutation rates (Simon et al., 1994; Cameron, 2014). In Polyneoptera, mitochondrial data have been employed to infer phylogenetic relationships and to perform comparative analyses of genome organization across several orders, including Orthoptera (Zhang et al., 2013), Mantodea (Ma et al., 2023) , Blattodea (Cameron et al., 2012; Gong et al., 2018), Plecoptera (Ding et al., 2019), and Phasmatodea (Yuan et al., 2023).
However, the use of mitochondrial markers frequently relies on conventional gene sets rather than adopting a theory-driven approach to gene selection, such as focusing on the most variable regions to maximize phylogenetic signal (Whitfield and Kjer, 2008), and the usage of these highly variable regions, here referred to as hotspots, offers a promising alternative. Because these regions contain unconstrained sites with elevated variability, they provide critical information for distinguishing closely related taxa while reducing noise from non-informative positions (Simon et al., 1994). Hotspot-based datasets may therefore resolve phylogenetic relationships effectively without requiring complete mitochondrial genome sequencing.
In addition to their use in phylogenetic studies, mitochondrial markers are widely employed for species identification through DNA barcoding, primarily targeting regions of the cytochrome oxidase subunit I (COX1) gene, as well as other mitochondrial loci, in insects and other bilaterian taxa (Simon et al., 1994; Hebert et al., 2003a, b). However, exploring alternative candidate markers may yield both more specific primers (Moulton et al., 2010) and regions that exhibit well-defined patterns of intraspecific variation and interspecific divergence (Meyer and Paulay, 2005; Meier et al., 2008), thereby reducing error rates and minimizing misidentification inherited from co-amplification of NUMTs and intraspecific divergences (Dong et al. 2021).
Taken together, these observations highlight the underexplored potential of Polyneoptera mitogenomic data as a resource for assessing evolutionary patterns among orders and for species-level molecular identification. To address this gap and evaluate the applicability of mitochondrial genome regions for phylogenetic inference, as well as their potential utility as alternative or complementary barcode markers, we first expanded the available mitochondrial dataset by assembling and annotating high-quality, previously unavailable mitogenome sequences, then systematically investigated nucleotide-diverse regions, employing these hotspots to infer phylogenies and assess their suitability for both DNA barcoding and phylogenetic analyses. We hypothesized that a reduced set of carefully selected markers could achieve phylogenetic resolution comparable to that obtained with the most comprehensive datasets. To test this hypothesis, we compared the topologies reconstructed from these targeted mitochondrial regions with those obtained from complete mitogenomes and from datasets comprising all mitochondrial protein-coding genes (PCGs).
Material and Methods
Genome assembly, annotation, and quality assessment
Whole Genome Shotgun (WGS) sequencing data obtained using the Illumina paired-end strategy for Blattodea, Mantodea, Phasmatodea, Plecoptera, and Orthoptera species without publicly available assembled mitogenomes (partial or complete) were retrieved from the NCBI Sequence Read Archive (SRA) database in March 2024. The search was performed using the superorder name as the term, filtering the results to retrieve only Illumina paired-end sequencing and prioritizing the most extensive library for each species according to the number of bases sequenced. The Polyneoptera orders: Mantophasmatodea, Grylloblattodea, Embioptera, and Zoraptera were not selected for inclusion in the present study due to insufficient information for further analysis, as none of these orders yielded more than five records in the RefSeq database. Sequencing reads were retrieved using the SRA Toolkit and then assembled de novo with NOVOPlasty 4.3.1 (Dierckxsens et al., 2016), using the protein-coding sequence of the COX1 gene from a congeneric species as the seed for assembly extension, with k-mer values of 33 (Table S1). This strategy allowed a consistent mitogenome assembly with a high reliability due the seed-extension algorithm, reference guided assembly when available, and a high coverage due the WGS strategy used as filter to retrieve the sequence data. The completeness and integrality of the circularized contigs were inferred using AWA v.20170413, according to the values of the alignment score (Jacob Machado et al., 2018).
The annotation was performed on the circularized mitogenomes using the MITOS2 web server (Bernt et al., 2013), following the Invertebrate Mitochondrial Code (transl_table=5). The protein-coding gene boundaries were manually verified using Ugene (Okonechnikov et al., 2012), in which the annotated genes were compared to those annotated in reference genomes retrieved from the RefSeq database by alignment in MAFFT, allowing the correction of start and stop codon positions (Katoh and Standley, 2013), this procedure allowed the identification of frameshifts, stop codon contamination and potentially NUMts.
To evaluate the quality of the assembled genomes, some metrics were established based on standard assumptions. First, the ratio of nonsynonymous to synonymous substitutions (dN/dS) was estimated for protein-coding genes using the codeML package implemented in the ETE Toolkit (Huerta-Cepas et al., 2016), applying M3 vs. M0 model to test for site-specific variability, with the expectation that ω values would remain low, as typically observed in mitochondrial genes. Second, nucleotide composition was examined by calculating AT content, AT-skew [(A − T) / (A + T)], and GC-skew [(G − C) / (G + C)], expecting the typical patterns for each order. Finally, relative synonymous codon usage (RSCU) was computed with CodonW v.1.4.4 to assess consistency with codon usage and composition patterns commonly reported in insect mitogenomes.
Nucleotide diversity
To assess nucleotide diversity (π) across the 13 PCGs for each order, concatenated codon-sequence alignments were analysed using DnaSP v6.12.03 (Rozas et al., 2017). The analysis was conducted with a window length of 600 bp and a step size of 200 bp. The genes bearing regions of interest were identified through similarity searches using the Basic Local Alignment Search Tool (BLAST) against the NCBI non-redundant nucleotide database. Nucleotide diversity hotspots were defined as regions with π values greater than the median within the dataset.
Barcode evaluation
To identify the optimal mitochondrial regions for species-level identification in Polyneptera, we assessed the presence of a barcoding gap across nucleotide diversity hotspots detected in our dataset, as well as across commonly amplified mitochondrial markers reported in the literature.
Scientific papers applying barcoding strategies for species identification in each Polyneoptera order analysed in this study were retrieved from the Web of Science database. The search used the following keywords: (“[ORDER]” AND (“DNA barcoding” OR “metabarcoding” OR “barcoding”)). Only studies that specified primer sets were included, and the corresponding primer sequences were also collected, along with the amplified gene regions (Table S2).
To calculate and visualize the DNA barcode gap for each order, a dataset comprising intraspecific and interspecific sequences was obtained from the NCBI nucleotide database. This was done using the esearch function from the Entrez package, whereby the species names with more than one record in the GenBank database were searched using the prompt: “SPECIES” AND (“8000”[SLEN] : “100000000000”[SLEN] AND (ddbj_embl_genbank[filter] AND mitochondrion[filter]). The search targeted both commonly amplified regions described in the literature and the hotspot regions identified in this study. To ensure the quality of the datasets, sequences retrieved for each order were aligned and conserved alignment blocks were extracted to remove non-homologous regions and sequences with unusually short or long lengths. To improve taxonomic consistency, only sequences identified at the species level were retained, excluding records with ambiguous annotations (e.g., “sp.”, “cf.”). In addition, an inspection of sequence similarity within each species dataset was performed to detect potential outliers. Pairwise genetic distances were calculated and UPGMA dendrograms were generated using similarity as the metric in the ape package (Paradis and Schliep, 2019). Sequences that did not cluster with other sequences of the same species were considered potential misidentifications or sequencing artifacts and were removed from the dataset. To ensure balanced comparisons between intra- and interspecific variation, only species represented by at least three sequences were included in the analyses, with the subspecies being treated as intraspecific records. The final curated dataset used in all analyses is available in Table S3.
These datasets were used to evaluate the effectiveness of the region for molecular species identification using the function barcoding.gap built in BarcodingR package (Zhang et al., 2017). Intraspecific and interspecific genetic distances were calculated using the Kimura 2-parameter (k2p) distance model. To further validate and substantiate the significance of the divergence between interspecific and intraspecific regions, the Mann-Whitney-Wilcoxon test was applied to the same dataset.
Phylogenetic analysis
Phylogenetic trees for each taxonomic order were inferred using species from closely related orders as outgroups. Outgroups were selected as follows: Plecoptera: Challia fletcheri (Dermaptera: Pygidicranidae - NC_018538.1) and Euborellia arcanum (Dermaptera: Anisolabididae - NC_032075.1); Blattodea: Hierodula membranacea (Mantodea: Mantidae - NC_048984.1) and Hierodula patellifera (Mantodea: Mantidae - NC_034283.1); Orthoptera: Sclerophasma paresisense (Mantophasmatodea: Mantophasmatidae - NC_007701.1) and Tamolanica tamolana (Mantodea: Mantidae - NC_007702.1); Phasmatodea: Epeorus unispinosus (Ephemeroptera: Heptageniidae - NC_065800.1) and Epeorus gibbus (Ephemeroptera: Heptageniidae - NC_065799.1); Mantodea: Sclerophasma paresisense (Mantophasmatodea: Mantophasmatidae - NC_007701.1).
For each analyzed order, at least 11 datasets were constructed to evaluate the consistency of mitochondrial markers as phylogenetic resources. These datasets were defined as follows: 1) PCG: coding DNA sequence (CDS) of all protein-coding genes combined; 2) var: all CDS from protein-coding genes corresponding to the highly variable genes concatenated; 3) COX1_var: the CDS of COX1 gene together with the CDS of identified hotspot genes; 4) PCG_Partition: all CDS of PCGs partitioned by gene; 5) COX1: the CDS of COX1 region singularly; 6) mtDNA: the complete mitochondrial genome; 7) var_3rd: CDS of highly variable genes, excluding the third codon position; 8) COX1_3rd: only CDS of COX1 gene, excluding the third codon position; 9) COX1_var_3rd: COX1 and CDS of genes inside hotspot regions, excluding the third codon position; 10) PCG_3rd: all CDS of PCGs combined, excluding the third codon position; 11) GENE / GENE_3rd: each individual CDS of genes within a highly variable region, analyzed both as complete (GENE) and with the third codon position excluded (GENE_3rd). This design enabled assessment of the influence of gene selection and codon-position exclusion on phylogenetic congruence across the insect orders examined.
For datasets with PCGs, amino acid sequences were aligned using MAFFT v.7 with the L-INS-i strategy (Katoh and Standley, 2013). The amino acid alignments were then used to guide a codon-based sequence alignment using the Pal2Nal v. 14 Perl script (Suyama et al., 2006). The poorly aligned regions were removed from each alignment generated with trimAL v1.4 using the -automated1 option to determine the optimal mode for the dataset (Capella-Gutiérrez et al., 2009). For the multi-gene datasets, the sequence alignments were concatenated in a unique matrix using the catfasta2phyml script. For the complete mtDNA dataset, genomes were first standardized to start at the ND2 gene by shifting the start position using MARS (Ayad and Pissis, 2017), and then aligned as described above. The 16S sequences, in turn, were aligned directly without modification.
The maximum-likelihood phylogenetic tree was inferred using IQ-TREE v3 (Wong et al., 2025). The best-fit nucleotide substitution model was selected via the built-in ModelFinder Plus algorithm (Kalyaanamoorthy et al., 2017). Branch support was assessed with 1,000 bootstrap replicates.
To evaluate the performance of each dataset, the topologies of all inferred trees were compared pairwise using cophenetic distance matrices tested with a Mantel test, using the vegan package (Dixon, 2003), and symmetric Robinson-Foulds (RF) distances.
This study did not involve experiments on live vertebrates or human subjects. All data used were obtained from public databases and analyzed using computational approaches only.
Results
Characterization of the novel mitogenome sequences
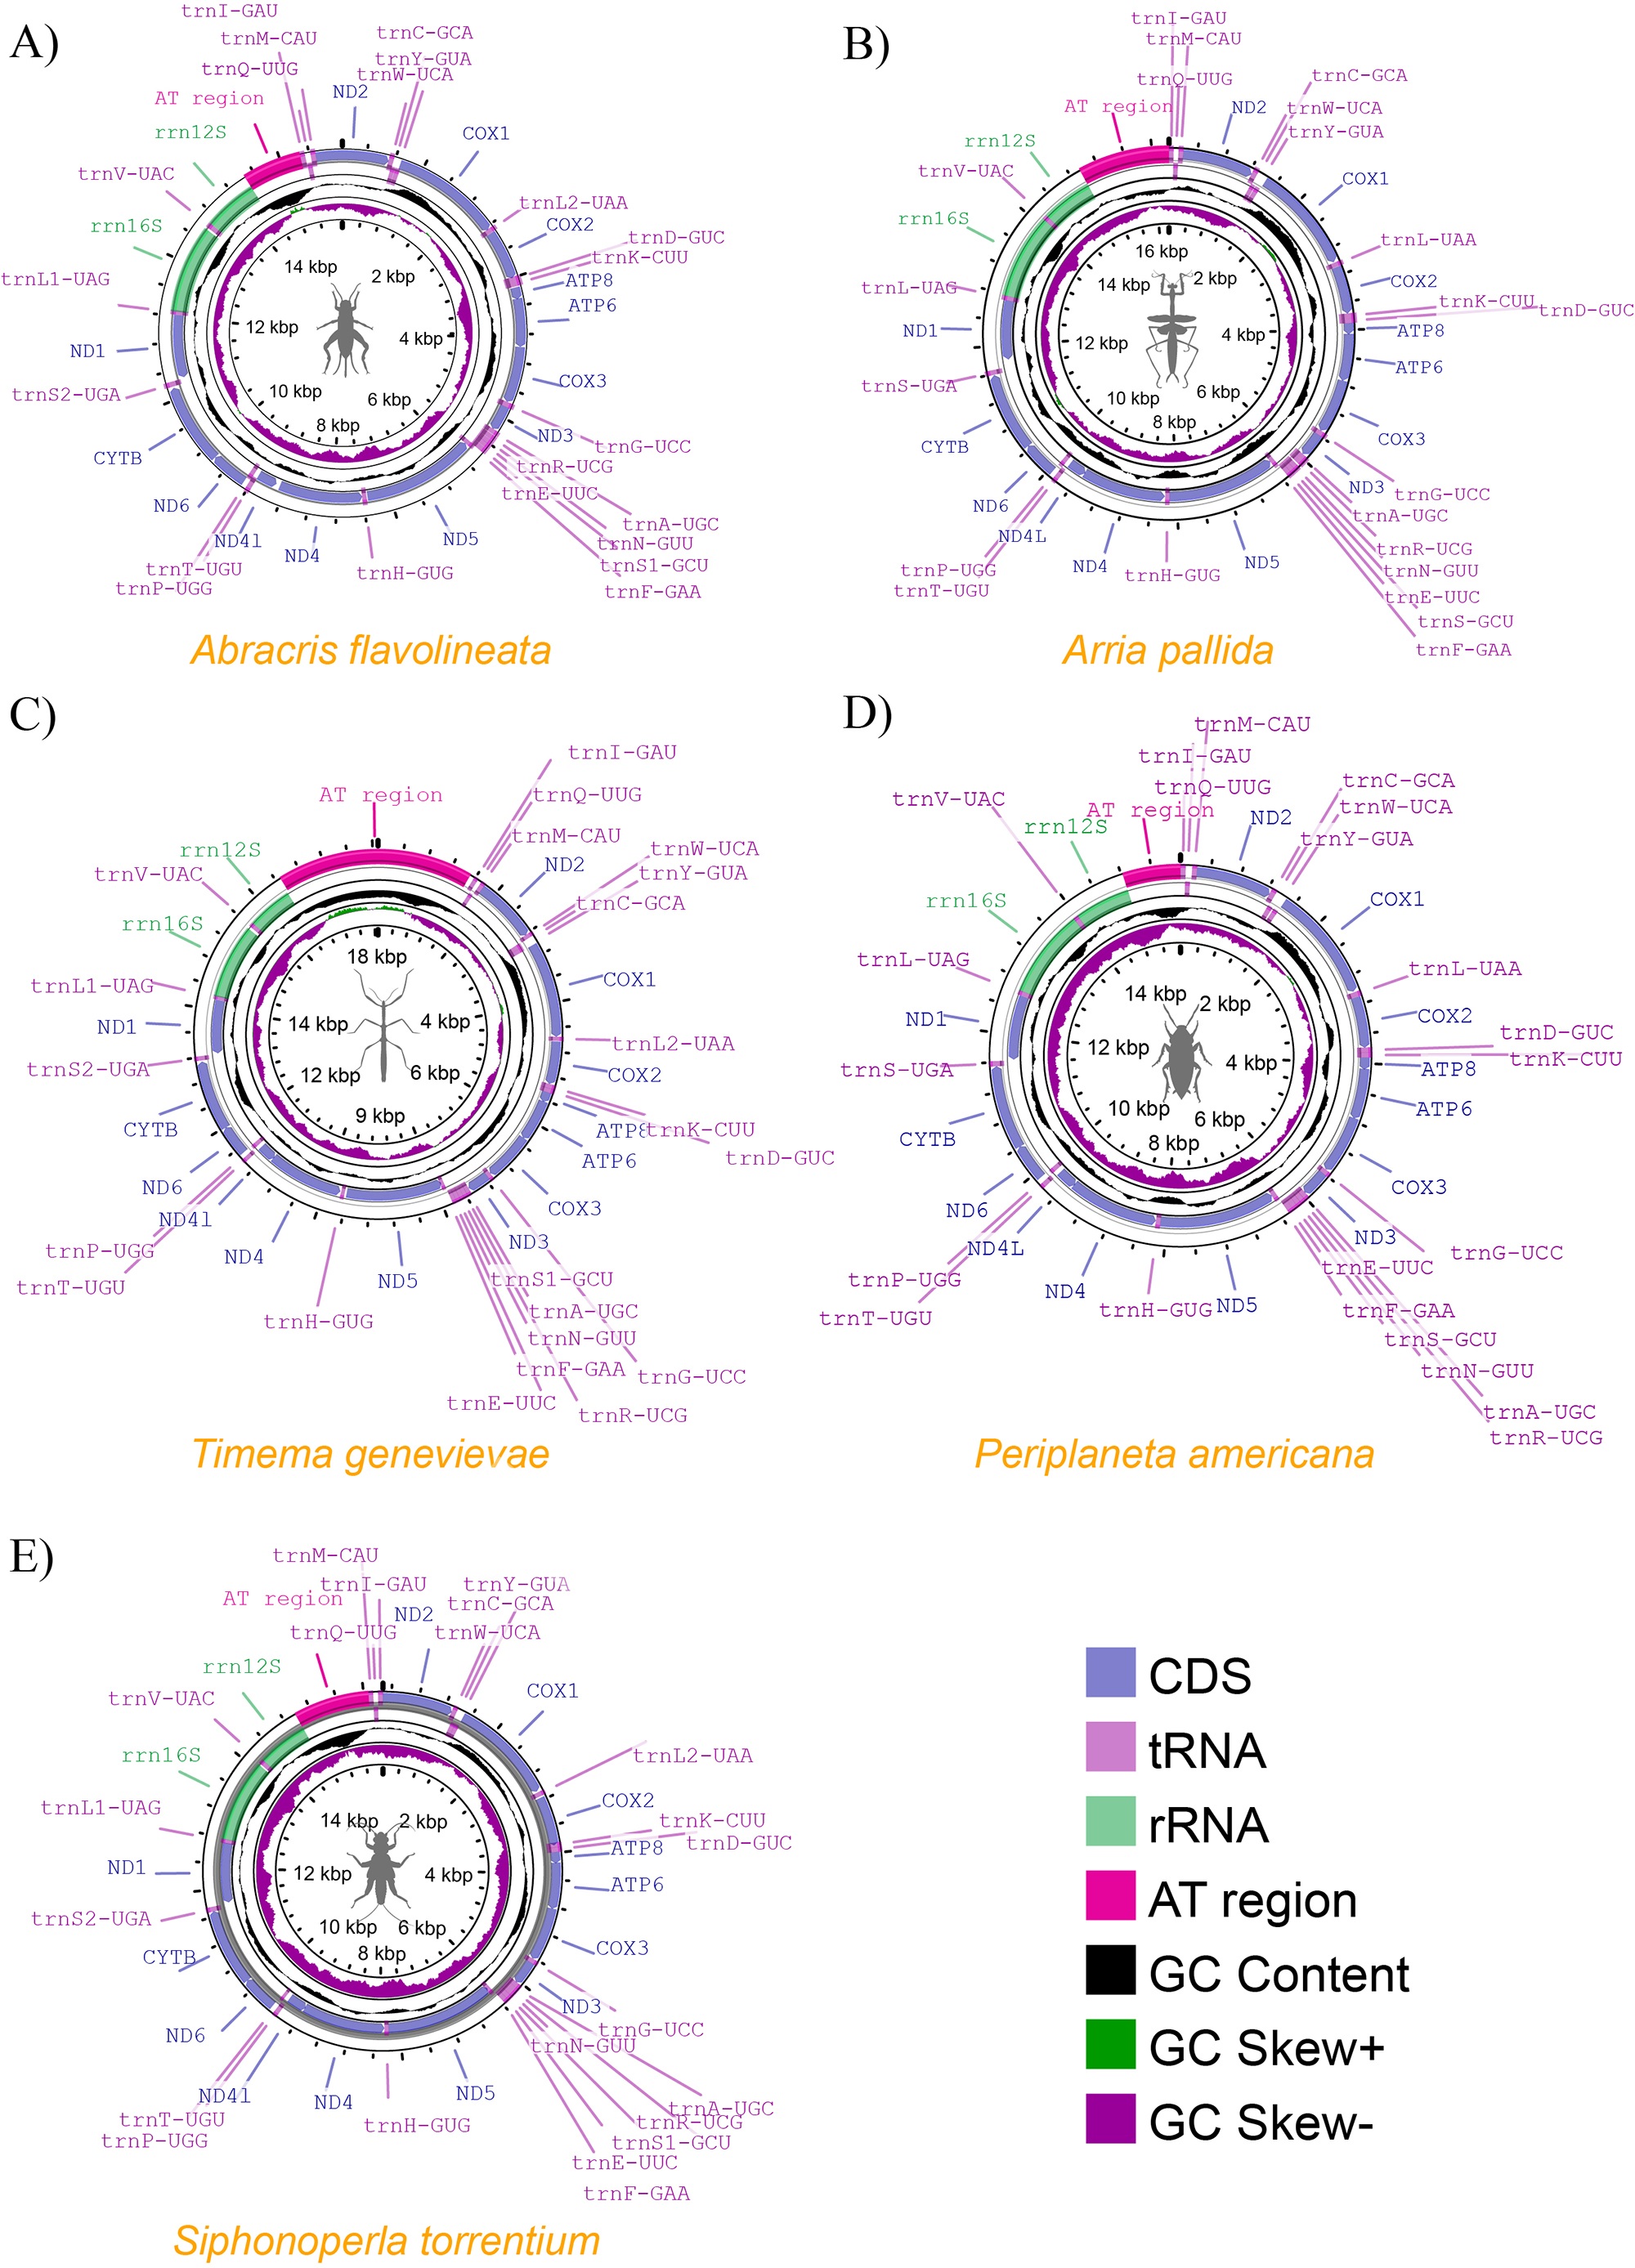
We successfully obtained complete circularized mitogenome sequences for 26 novel representative species of Polyneoptera across 65 assembly attempts, yielding a 40% circularization rate. This includes nine species from Orthoptera, seven from Phasmatodea, and ten from Plecoptera. The assembled mitogenome lengths ranged from 15,532 bp in Brachyptera seticornis (Plecoptera: Taeniopterygidae) to 19,048 bp in Timema bartmani (Phasmatodea: Timematidae). Most mitogenomes followed the typical Metazoan gene composition, consisting of 37 genes (13 protein-coding genes, two rRNA genes, and 22 tRNA genes) and an AT-rich control region (Figure 1). The GC content of the mitogenomes varied from 22.41% in Medauroidea extradentata (Phasmatodea: Phasmatidae) to 37.38% in Brachyptera seticornis (Plecoptera: Taeniopterygidae), with a strong AT bias (Table S4).
Circular maps of mitochondrial genomes from representatives of the Polyneoptera orders: (A) Abracris flavolineata (Orthoptera), (B) Arria pallida (Mantodea), (C) Timema genevievae (Phasmatodea), (D) Periplaneta americana (Blattodea), and (E) Siphonoperla torrentium (Plecoptera). The outer bars represent different types of genes and genomic features: blue for coding sequences (CDS), purple for transfer RNAs (tRNA), light green for ribosomal RNAs (rRNA), and magenta for the AT-rich region. The inner plots display the distribution of GC content (black), GC skew positive (green), and GC skew negative (purple).
The RSCU analysis showed a strong preference for codons with A or T in the third position (Table S5). The most frequently used codons were UUA (Leu), UCU (Ser), UCA (Ser), CGA (Arg), and GUU (Val). Among the least used codons, CGC (Arg) was the most commonly absent in the mitogenomes assembled, missing from the PCGs of Podisma pedestris (Orthoptera: Acrididae), Ronderosia bergii (Orthoptera: Acrididae), Utaperla sopladora (Plecoptera: Chloroperlidae), Vandiemenella viatica (Orthoptera: Morabidae), and Xyleus discoideus angulatus (Orthoptera: Romaleidae). This was followed by AGG (Ser), which was absent in Amphinemura sulcicollis (Plecoptera: Nemouridae), Eyprepocnemis plorans (Orthoptera: Acrididea), Kathroperla siskiyou (Plecoptera: Chloroperlidae), and Utaperla lepnevae (Plecoptera: Chloroperlidae), and GCG (Ala), which was not used in the PCGs of Medauroidea extradentata, Pyrgomorpha conica (Orthoptera: Acrididae), and R. bergii (Table S5). A similar relationship between the prevalence of AT codons and the dynamics of start and stop codons was also observed. The TAA stop codon was more prevalent than TAG, and ATA was more prevalent than ATG as a start codon in all species.
Comparative analysis of mitogenomic characteristics across Polyneoptera orders
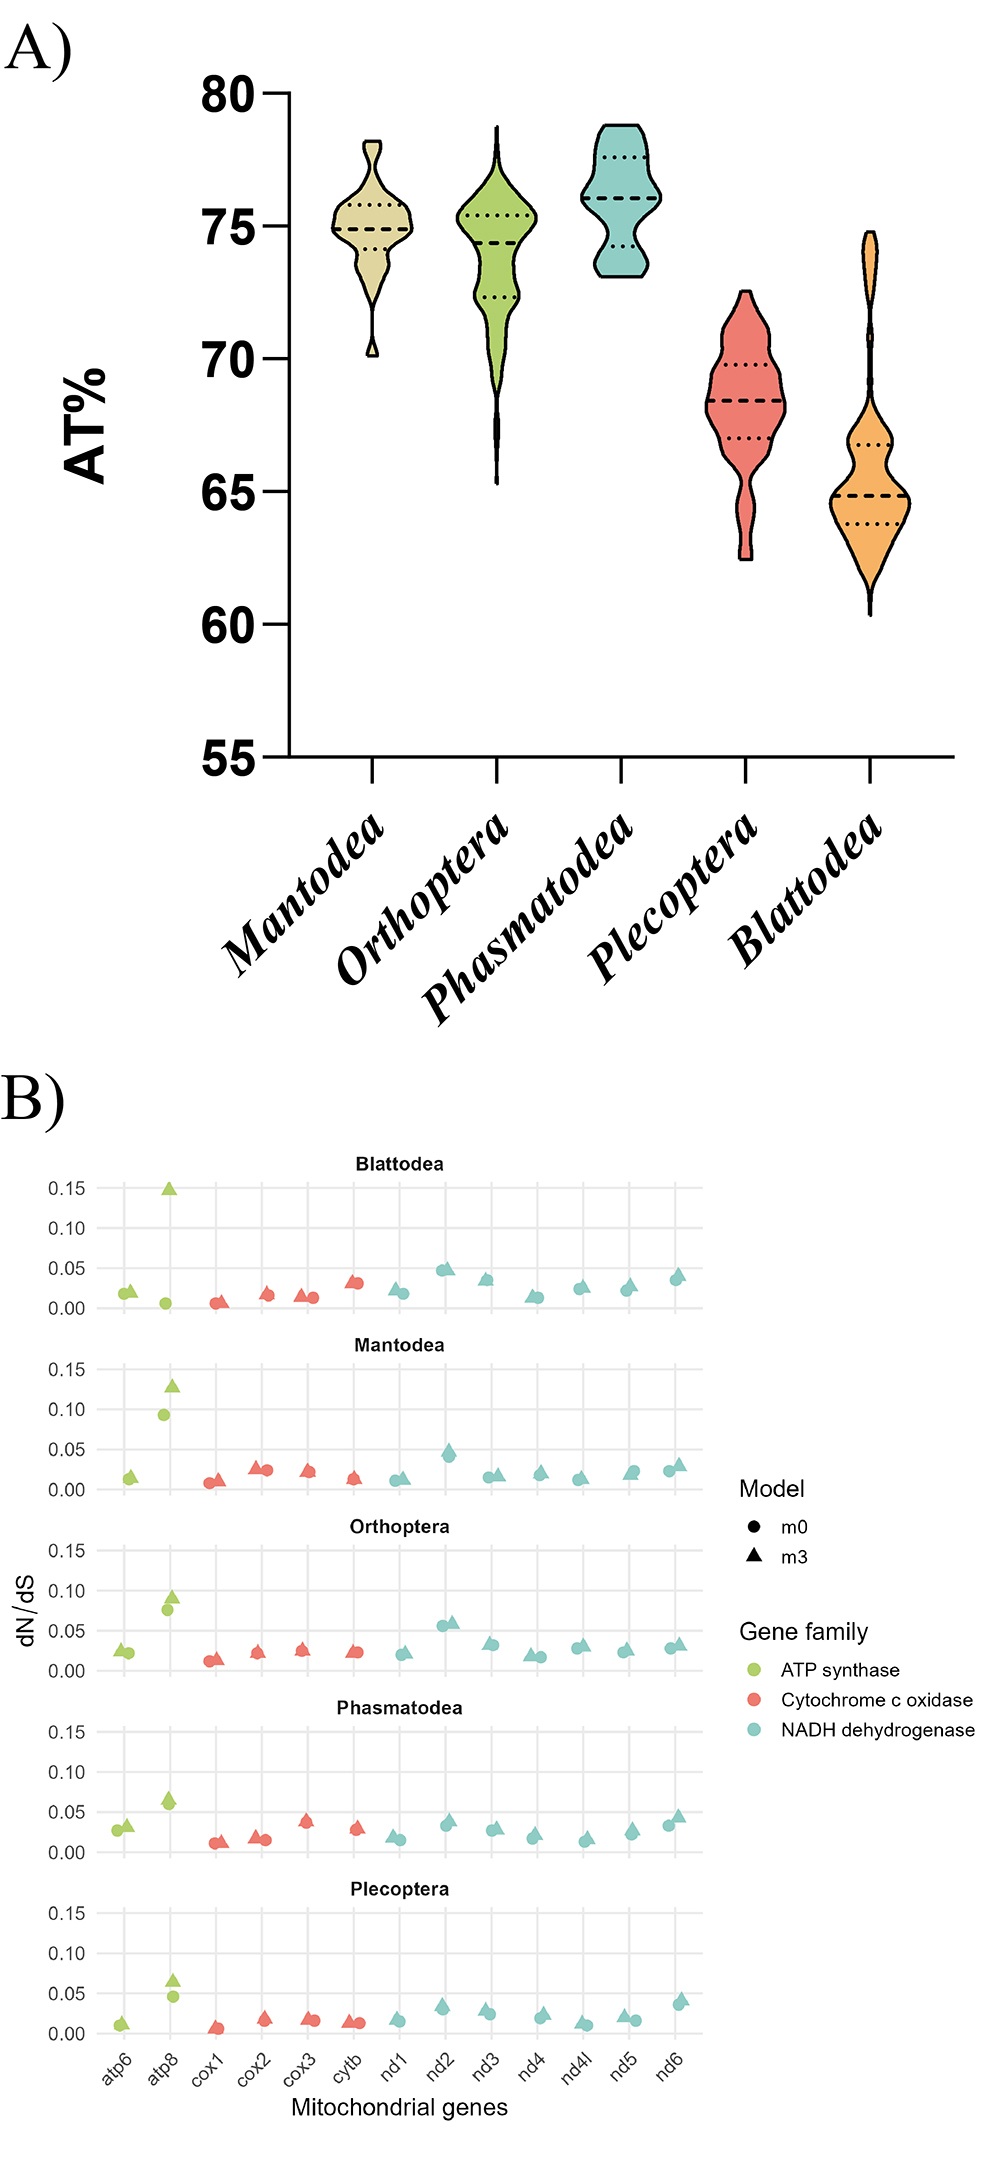
Among the five Polyneoptera orders analysed in this study, Phasmatodea exhibited the largest average mitogenome length at 16,996.94 ± 833.58 bp, while Blattodea had the smallest at 15,237.90 ± 565.24 bp. The variations in overall genome size were primarily due to differences in the non-coding portions, including intergenic and control regions (Table S6). All mitogenomes displayed a high AT content, exceeding 65% (Figure 2A).
The analysis of evolutionary pressure, assessed through the dN/dS ratio, revealed significant results for all genes in the dataset under the M3 vs. M0 model, which accounts for site-specific rate variation. Consistently low ω values were observed across all mitochondrial protein-coding genes, indicating strong purifying selection. The highest ω value was 0.147 for ATP8 in Blattodea, and the lowest, 0.006, was found in COX1 for both Blattodea and Plecoptera (Figure 2B).

Mitochondrial genome characterization across Polyneoptera orders. (A) Distribution of AT content percentages among the mitochondrial genomes from each Polyneoptera order. (B) dN/dS ratios estimated for each mitochondrial protein-coding gene across the five analyzed orders, shown in separate panels. Gene families are indicated by different colors, and the two evolutionary models (m0 and m3) are represented by different symbols.
Nucleotide diversity across genes
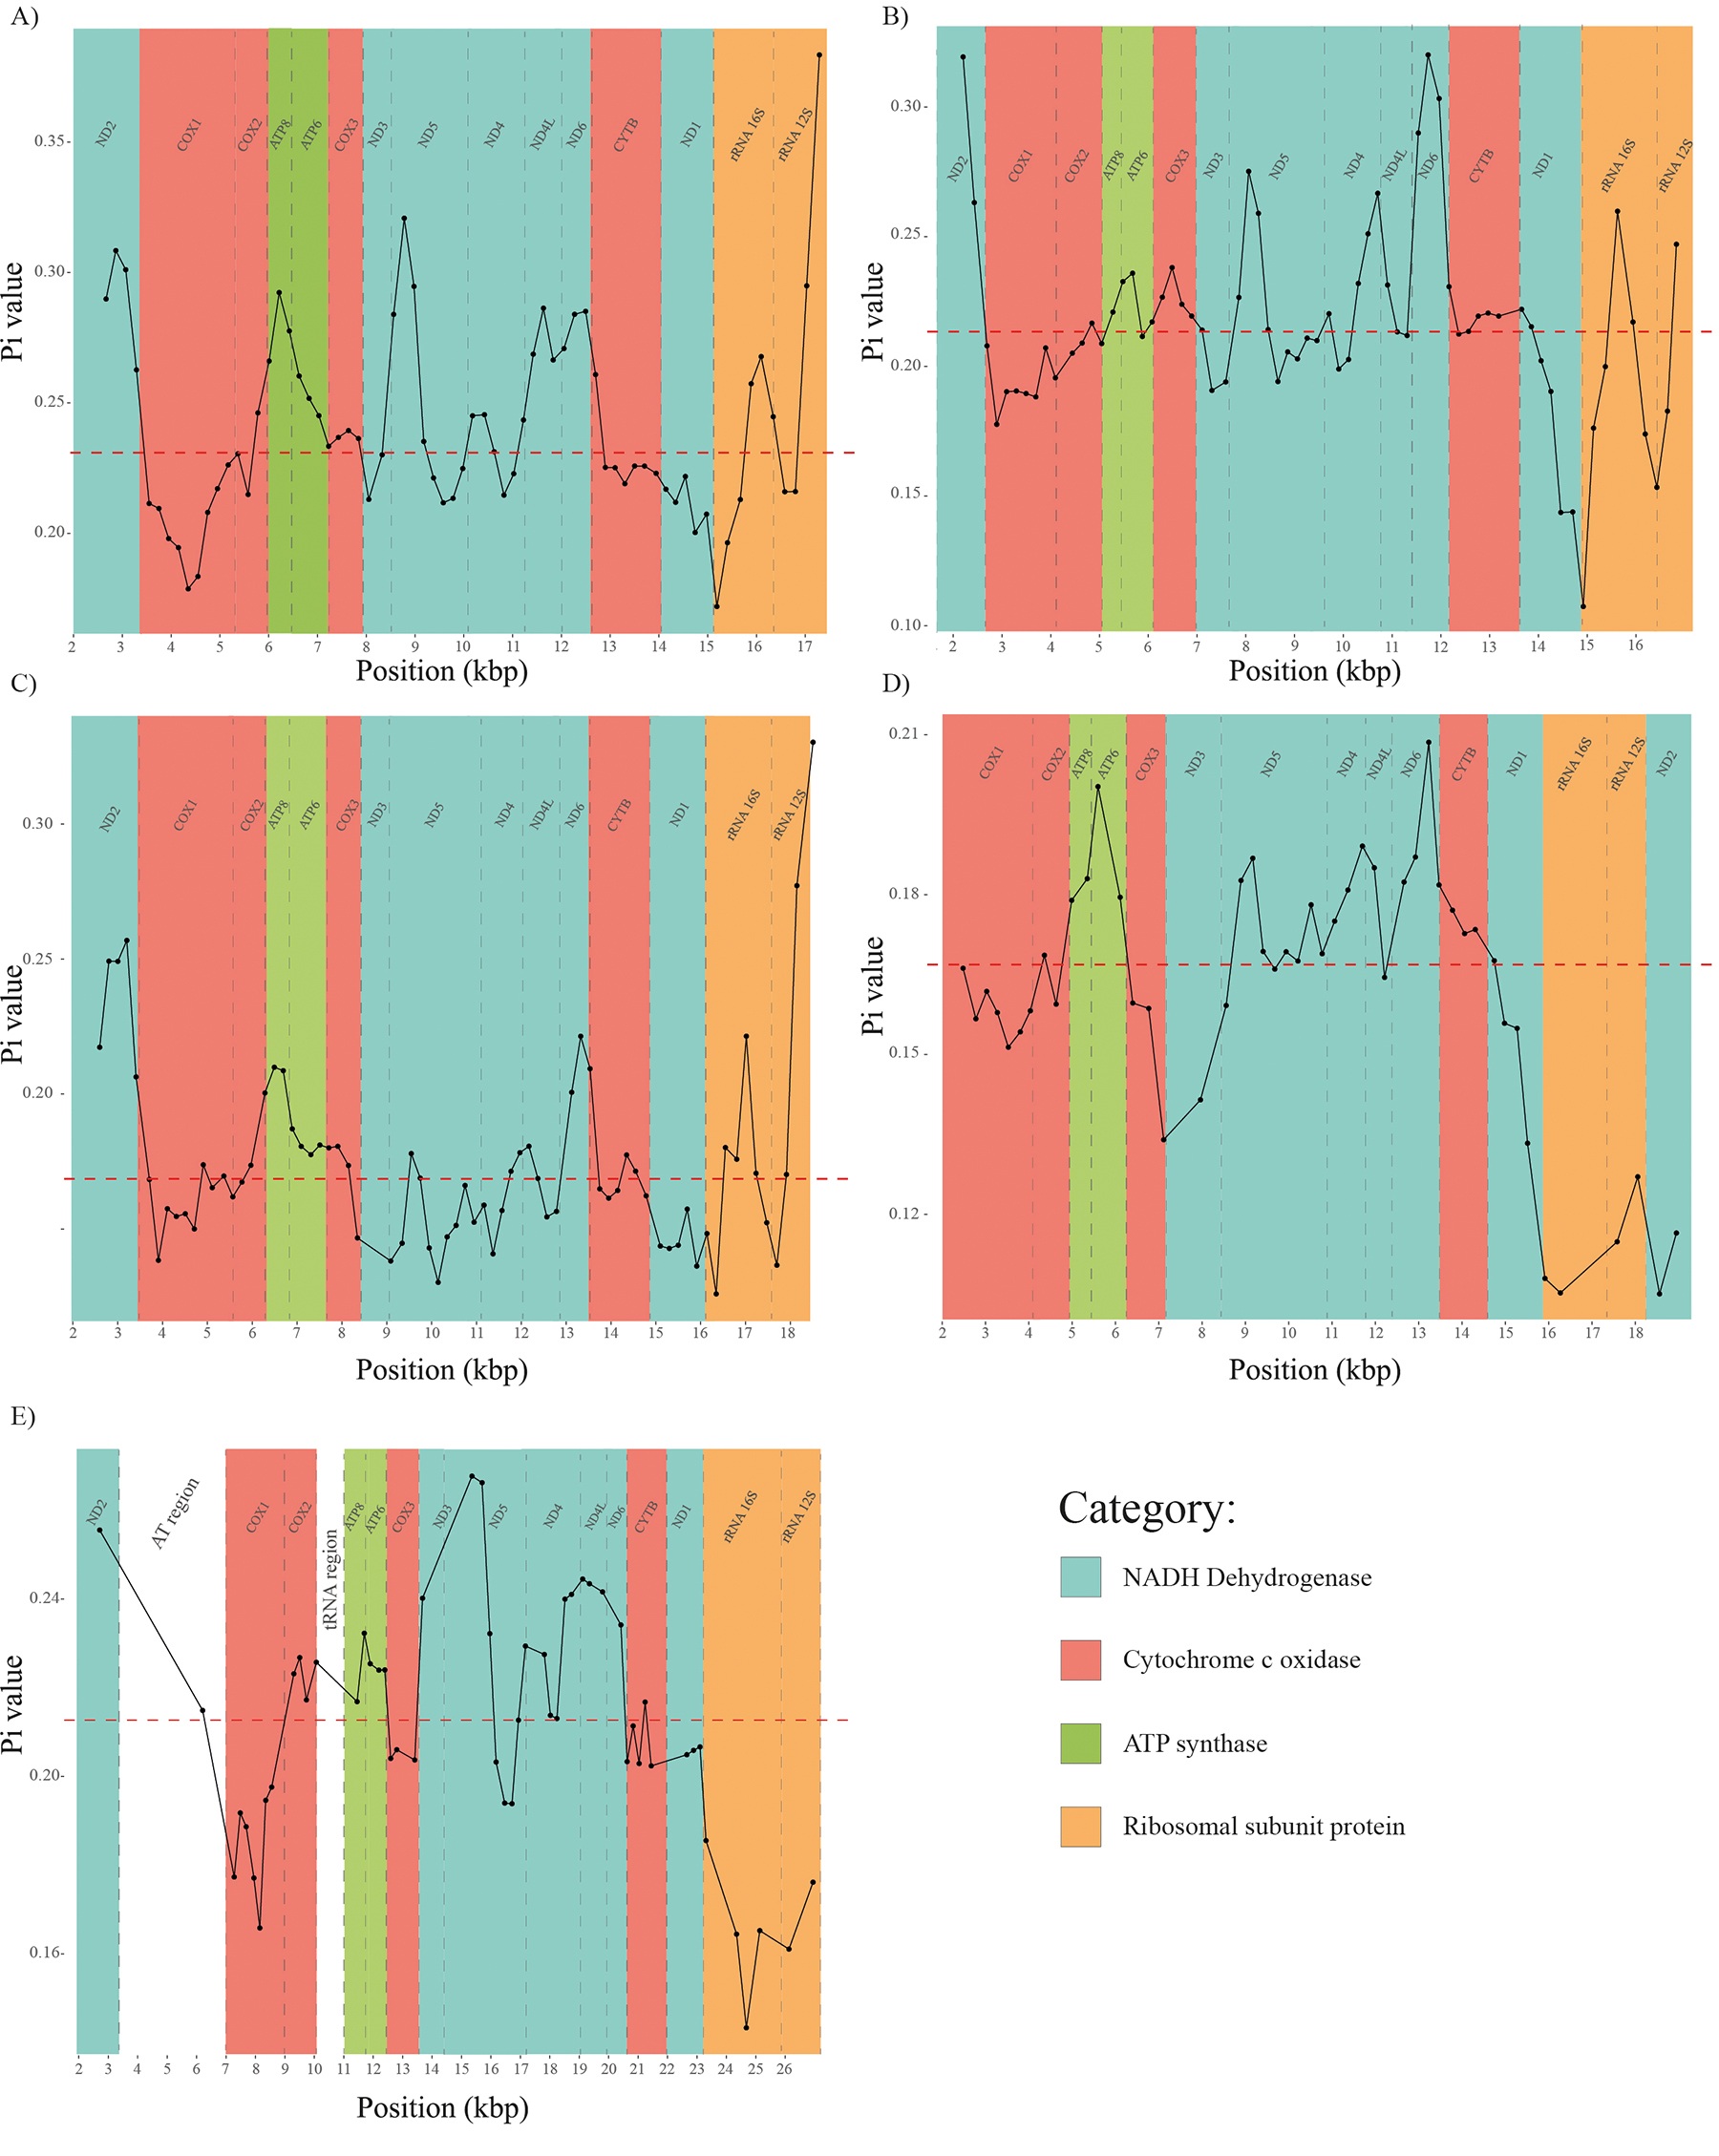
The graphical distribution of nucleotide diversity across the genes of the orders Blattodea (average = 0.16, median = 0.17), Orthoptera (average = 0.21, median = 0.21), Mantodea (average = 0.17, median = 0.17), Phasmatodea (average = 0.24, median = 0.23), and Plecoptera (average = 0.22, median = 0.21) is illustrated in Figure 3. Notably, the nucleotide diversity values for three NADH-ubiquinone oxidoreductase (ND) subunits (ND2, ND5, and ND6) were consistently higher than the median across nearly all analysed orders. Specifically, ND2 was identified as a hotspot in all orders except Blattodea, ND5 in all but Mantodea, and ND6 in all except Orthoptera. Additionally, the ND4L subunit emerged as a diversity hotspot in Orthoptera and Phasmatodea. Other notable hotspot genes included ATP6 in Blattodea; ATP8 in Orthoptera, Mantodea, and Phasmatodea; and 16S in Mantodea and Plecoptera.
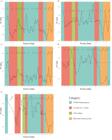
Nucleotide diversity across mitochondrial genomes in the five Polyneoptera orders analysed. (A) Phasmatodea, (B) Plecoptera, (C) Mantodea, (D) Blattodea, and (E) Orthoptera. The black lines represent the nucleotide diversity value across genome positions, and the colored blocks indicate gene categories: NADH dehydrogenase (blue), cytochrome c oxidase (red), ATP synthase (green), and ribosomal subunit proteins (orange).
Optimum primer region research
A total of 134 scientific articles describing barcoding applications in Polyneoptera species were identified through our Web of Science search. These articles encompassed all Polyneoptera orders included in our work, with the following distribution in descending order: Orthoptera (67), Plecoptera (42), Blattodea (15), Mantodea (9), and Phasmatodea (1). (Table S2). The publications included 62 distinct primer sets; the most frequently cited was the set described by Folmer et al. (1994) , referenced in 51 articles and used without modification in 43. The second most cited primer set was that described by Pan et al. (2006) , which was cited by 11 articles, but all from Orthoptera.
The barcode regions amplified in the selected publications were, in descending order of frequency, from the genes: COX1 (114), 16S (8), COX2 (4), CYTB (4), 12S (2), COX3 (1), and ND2 (1). The suitability of these amplified regions, along with the hotspot regions identified through our nucleotide diversity analysis, was evaluated using barcoding gap analysis to assess the efficiency of these primers in distinguishing species from each order.
In the Blattodea dataset, only the hotspot regions of the ND5 and ND6 genes exhibited visible gaps, with genetic distances of 2.68% and 0.41%, respectively (Table S7). In contrast, the COX1 gene, the most commonly used region for amplification showed no visible gaps. It presented a minimum interspecific distance of 0.0039 and a maximum intraspecific distance of 0.1713.
In Orthoptera, the regions displaying visible gaps corresponded to the predicted hotspot areas in the ATP6 and ND4 genes, with distances of 4.68% and 7.87%, respectively. As in Blattodea, the COX1 region analysed in this study showed overlap between intraspecific and interspecific distance curves, with a minimum interspecific distance of 0.000.
In Plecoptera, visible gaps were predicted in all four hotspot regions analysed, located within the ND4 (10.97%), ND4L (11.23%), ND5 (25.55%), and ND6 (12.41%) genes. However, as with the other orders, no visible gaps were observed in the COX1 region tested.
Mantodea was the only order in which all the tested regions, including COX1, exhibited visible gaps. The gaps between interspecific and intraspecific distances for this order were as follows: 16S = 6.51%, ATP8 = 9.53%, COX1 = 7.40%, ND2 = 4.84%, and ND6 = 8.62%.
For Phasmatodea, only the region of COX1 was deemed to contain sufficient information for analysis, although the minimum interspecific variance distance of 0.000 was recorded. The regions of the nucleotide diversity hotspots yielded at most two species per search and were therefore excluded.
Despite the analyses conducted, none of the regions examined showed a high degree of similarity in the distribution of intraspecific and interspecific genetic distances, as assessed by the Mann-Whitney-Wilcoxon test (Table S7).
Phylogenetic analysis
Each phylogenetic tree explored in this study was evaluated for its concordance with both the classical PCG dataset and the more informative complete mitochondrial genome (mtDNA) inferences, using the complementary metrics of Mantel test and Robinson-Foulds (RF) distances.
In Plecoptera, all datasets exhibited strong agreement with the phylogenies inferred from the most complete datasets based on Mantel correlations (values > 0.921) (Table S8). However, the RF test revealed greater variation in topological similarity across datasets, with the highest congruence observed when all hotspot genes were concatenated, either alone or with COX1 (RF ≤ 0.222). However, the individual hotspot genes ND4, 16S, ND5, ND6, and COX3 performed better than COX1 in the RF test.
For Orthoptera, the Mantel test revealed more variable outcomes, with ND2 and ND4L showing the lowest concordance with phylogenies inferred from the most comprehensive datasets (Table S9). However, as in Plecoptera, datasets composed of highly variable genes, used either individually or in combination with COX1, showed the highest agreement with the complete mtDNA datasets. When comparing single-gene datasets, ND5 slightly outperformed COX1 in the RF test.
Across Phasmatodea, all datasets yielded highly similar results according to the Mantel test (Table S10). However, RF values revealed more informative differences: datasets combining the hotspot genes, either alone or together with COX1, and the 16S gene alone, showed the closest agreement with the most comprehensive datasets. Moreover, as observed in Plecoptera, several hotspot genes used individually (16S, ND5, ND4L, and ND2) outperformed COX1 alone in reproducing the phylogeny inferred from the complete datasets according to the RF test.
For Mantodea, all datasets yielded results comparable to the most comprehensive datasets, according to the Mantel test, except for ATP8 when used alone (Table S11). However, the RF results revealed more evident differences: the closest topological agreement was obtained using the concatenated hotspot genes, either alone or combined with COX1, as well as with 16S individually. Aside from 16S, COX1 performed better than the other hotspot genes when used alone.
Across Blattodea, all datasets performed similarly to the most comprehensive datasets, as indicated by the Mantel test (Table S12). However, the RF test revealed that concatenating all hotspot genes, either alone or in combination with COX1, yielded the closest topological agreement with the complete datasets. Additionally, in Blattodea, ND2 and ND5 outperformed COX1 when used individually.
Discussion
Assembly results and quality assessment
The assembly of mitogenomes using publicly available sequence archives successfully retrieved 26 novel polyneopteran mitochondrial genomes, including nine from Orthoptera, seven from Phasmatodea, and ten from Plecoptera. Notably, these genomes represent the first reported mitogenome sequences for 11 genera and two insect families, marking a significant contribution to the genomic resources available for these groups.
All mitogenomes assembled in this study exhibited the typical mitochondrial gene composition, consisting of 13 PCGs, 22 tRNAs, and two rRNAs, along with an AT-rich region (Boore, 1999). The high AT% bias observed in the assembled mitogenomes is consistent with previous findings for Polyneoptera groups, including Phasmatodea (Li et al., 2022), Plecoptera (Cao et al., 2024), Mantodea (Ma et al., 2023) , Blattodea (Cheng et al., 2016), and Orthoptera (Liu et al., 2013). This high AT% is partly explained by the presence of an AT-rich region, which optimizes the energy required for replication (Clary and Wolstenholme, 1987). This compositional bias is further influenced by the preferential use of the synonymous amino acids encoded by NNA and NNU codons, as observed in previous studies on other insect species (Wei et al., 2014; Barbhuiya et al., 2020). This can be attributed to the degeneracy of synonymous codons and the wobble position of the third base in the anticodon, which pairs more effectively with uracil-terminated codons (Sun et al., 2009).
The genome skewness was positively correlated with AT content and negatively correlated with GC skew, as is typical of insect mitochondrial genomes. This pattern results from the strand-displacement model of replication, in which the parent minority strand is more susceptible to deamination, leading to an increase in A and C nucleotides on the lagging (majority) strand (Wei et al., 2010). The dN/dS analyses further support the quality and biological consistency of the assembled datasets, as ω values were uniformly low, indicating strong purifying selection, as typically observed in mitochondrial protein-coding genes. Although expected, this result confirms that both the newly assembled and curated mitogenomes follow canonical mitochondrial evolutionary patterns. Here, the M3 vs. M0 comparison was used as a diagnostic test for site-specific rate heterogeneity rather than to detect positive selection. The absence of anomalous ω values reinforces the reliability of the assemblies and supports their use in downstream hotspot detection, barcoding, and phylogenetic analyses.
Performance of alternative markers to DNA barcoding
The nucleotide diversity hotspots identified in this study were most frequently located in regions of the ND2, ND5, and ND6 genes. Among these, only the ND2 region has previously been described for primer design in Polyneoptera, with a reported case in Orthoptera (Tokuda et al., 2010) and the ND6 region amplification was also used in lepidopterans, yielding similar results to the conventional COX1 marker (Silva-Brandão et al., 2011). It is noteworthy to mention that other regions of such ATP6 and ATP8 were already explored as alternative barcode loci in aphids (Lee and Akimoto, 2015). These nucleotide diversity hotspots serve as valuable markers for species identification, mainly since a lack of resolution in specific taxa is often attributed to factors such as saturation in mitochondrial markers, including COX1, incomplete lineage sorting, hybridization, and the presence of Nuclear-Mitochondrial DNA segments (NUMTs) (Kock et al., 2024).
To evaluate the efficacy of the nucleotide diversity hotspot regions identified in our study compared to the frequently used barcode gene regions for species identification across the Polyneoptera orders analysed, we conducted a barcoding gap analysis. In these analyses, the COX1 region was not deemed optimal for species delimitation due to the absence of a sufficiently large gap between intraspecific and interspecific divergence values, except in Mantodea, for which the region showed a gap of 7.40% between the maximum intraspecific and the minimum interspecific genetic distance, as well for the regions of 16S, ATP8, ND2 and ND6. For the remaining orders, other regions were predicted as optimal: ND5 for Blattodea; ND4 for Orthoptera; and ND4, ND4L, ND5 and ND6 for Plecoptera.
Despite the identification of optimal regions for species identification, the absence of a barcode gap was primarily driven by the smoothing of intraspecific distance distributions, with most frequencies concentrated at low divergence levels. This pattern suggests that all evaluated regions remain promising candidates for species identification, even in the absence of a distinct barcode gap. This may also help explain why COX1, despite lacking a consistent barcode gap, remains the most frequently cited marker in our literature review and continues to be widely used, despite reported limitations for species delimitation in specific orders such as Orthoptera (Kock et al., 2024), Diptera (Whitworth et al., 2007), and Hymenoptera (Gerth et al., 2011). Notably, COX1 remains useful for phylogenetic inference; in Orthoptera, for instance, it has been successfully employed to recover relationships using tree-based methods and distance thresholds (Huang et al., 2013). Nonetheless, the combined use of complementary approaches, such as similarity-based, diagnostic, and tree-based methods, offers a more robust framework for species delimitation (van Velzen et al., 2012).
Finally, it is essential to acknowledge that these results may benefit from re-evaluation as taxon sampling expands. The patterns observed here are likely influenced by the scale and composition of the currently available datasets. Notably, barcode gaps were detected only in datasets with fewer sampled species, which may capture fewer instances where coalescent depth obscures divergence patterns, an effect known to hinder the detection of apparent gaps (Collins and Cruickshank, 2013). As additional mitochondrial genomes become available, broader sampling may refine or modify these conclusions.
Mitochondrial datasets for phylogenetic inferences benchmarking
The use of mitochondrial genomic resources to infer phylogenetic relationships in insects has traditionally focused on protein-coding gene (PCG) sequences, which comprise approximately 75% of the mitochondrial genome and thus provide substantial phylogenetic information (Cameron, 2014). Complete mitogenomes have also been widely employed, as they include non-coding regions that evolve more rapidly and may contribute additional phylogenetic signal (Mandal et al., 2014).
Our assessment of mitochondrial markers identified through nucleotide-diversity analyses and evaluated using the barcoding-gap approach yielded promising results for resolving phylogenetic relationships within Polyneoptera. However, no single marker proved universally informative across the entire superorder. This pattern is consistent with the pronounced mitochondrial divergence observed both within and among polyneopteran orders, particularly in terms of base composition (Cameron, 2014). As a result, analysing each order independently proved to be a more effective strategy for identifying informative markers and recovering robust phylogenetic signal. Moreover, it is important to note that although more variable mitochondrial regions may improve species discrimination, this typically comes at the cost of reduced primer universality. The widespread adoption of COX1 as the standard barcode reflects a compromise between sequence conservation suitable for primer design and sufficient divergence for species-level identification (Folmer et al., 1994; Hebert et al., 2003a).
Among single-gene datasets from nucleotide-diversity hotspots, ND4, 16S, ND5, ND6, and COX3 outperformed the commonly used COX1 in Plecoptera. COX1 was also surpassed by ND5 in Orthoptera; by 16S, ND5, ND4L, and ND2 in Phasmatodea; by 16S in Mantodea; and by ND2 and ND5 in Blattodea. Taken together, these results show that although COX1 remains a valuable resource for phylogenetic inference, single-gene analyses may benefit from selecting markers that are tailored to the target order. For example, the strong performance of several NADH dehydrogenase complex genes is consistent with previous studies demonstrating that NAD genes often provide robust phylogenetic signal across Metazoa. Their effectiveness has been attributed to both the large number of informative sites they contain and their distinct evolutionary rates, which together can yield clearer phylogenetic resolution (Havird and Santos, 2014).
However, despite the valuable insights obtained from single-gene analyses, none of them matched the performance of datasets composed of multiple concatenated genes. This reinforces the importance of assembling complete mitochondrial genomes for as many species as possible to achieve the highest phylogenetic resolution. Nevertheless, mitochondrial genomes have intrinsic limitations for resolving deep phylogenetic relationships, regardless of sampling effort, and are more reliable for shallow to intermediate evolutionary timescales.
In summary, we expanded the mitogenomic resources available for Polyneoptera by assembling 26 new high-quality mitochondrial genomes, including the first representatives for multiple genera and families. The assemblies displayed canonical mitochondrial architecture, consistent base-composition biases, and expected patterns of nucleotide skew, reinforcing their integrity and suitability for downstream analyses. These new genomes provide essential resources for improving molecular identification and evolutionary studies in this diverse and ecologically significant group.
Our evaluation of nucleotide-diversity hotspots and their applicability to species delimitation revealed that several mitochondrial regions hold strong potential as complementary or alternative markers to the widely used COX1 gene. Although distinct optimal markers were identified for each order, no single locus exhibited a clear barcode gap across all datasets. This result reflects both intrinsic evolutionary characteristics of Polyneoptera and the limitations imposed by uneven taxon sampling. As mitogenomic sampling expands, the predictive power of these markers is expected to become more refined.
Benchmarking phylogenetic datasets further demonstrated that mitochondrial markers differ considerably in their informativeness across orders. While several NADH dehydrogenase genes and the ribosomal marker 16S consistently outperformed COX1 in single-gene phylogenetic analyses, the highest topological congruence was always achieved using multi-gene concatenated datasets. This order-specific performance, together with pronounced variation in mitochondrial base composition across Polyneoptera, underscores the importance of tailoring marker selection to the clade of interest rather than relying on a universal mitochondrial gene. Ultimately, our findings reaffirm the superior phylogenetic resolution afforded by complete mitogenome datasets and highlight the continued need to expand taxonomic coverage by assembling additional mitochondrial genomes.
Taken together, this work advances the phylogenetic and taxonomic toolkit available for Polyneoptera by: enriching the genomic repository for the group; identifying multiple informative regions for species identification; and providing a comparative framework that guides the selection of mitochondrial markers for phylogenetic inference. As new data accumulate, these insights will help refine mitochondrial-based approaches and support more robust evolutionary and biodiversity assessments across one of the most diverse insect lineages.
Supplementary Material
The following online material is available for this article:
Table S1 -
Table S2 -
Table S3 -
Table S4 -
Table S5 -
Table S6 -
Table S7 -
Table S8 -
Table S9 -
Table S10 -
Table S11 -
Table S12 -
Acknowledgments
We extend our sincere gratitude to the researchers who contributed to the sequencing and public release of the sequences used in this study. This research was made possible with the support of the Genetic and Molecular Biology Post-Graduation Program at the Federal University of Goiás. This work was supported by the National Institute of Science and Technology (INCT) in Ecology, Evolution, and Biodiversity Conservation, funded by CNPq (grant 465610/2014-5/ 409197/2024-6) and FAPEG (grant 201810267000023), linked to the Laboratory of Genetics & Biodiversity (LGBio) and the Working Group on Evolutionary Genetics and Genomics of the INCT EECBio. HAAR was supported by an M.Sc. fellowship from CNPq (131068/2024-5). This study was financed in part by the Coordenação de Aperfeiçoamento de Pessoal de Nível Superior - Brasil (CAPES) - Finance Code 001. This work is also in the context of Araguaia Vivo 2030, supported by Tropical Water Research Alliance (TWRA - process number 202210267000536). We are grateful for the Programa de Pesquisa em Biodiversidade Araguaia (PPBIO Araguaia; CNPqprocess number 441114/2023-7).
References
- Ayad LAK and Pissis SP (2017) MARS: Improving multiple circular sequence alignment using refined sequences. BMC Genomics 18:86.
- Barbhuiya RI, Uddin A and Chakraborty S (2020) Codon usage pattern and its influencing factors for mitochondrial CO genes among different classes of Arthropoda. Mitochondrial DNA A DNA Mapp Seq Anal 31:313-326.
- Bernt M, Donath A, Jühling F, Externbrink F, Florentz C, Fritzsch G, Pütz J, Middendorf M and Stadler PF (2013) MITOS: Improved de novo metazoan mitochondrial genome annotation. Mol Phylogenet Evol 69:313-319.
- Boore JL (1999) Animal mitochondrial genomes. Nucleic Acids Res 27:1767-1780.
- Cameron SL (2014) Insect Mitochondrial Genomics: Implications for evolution and phylogeny. Annu Rev Entomol 59:95-117.
- Cameron SL, Lo N, Bourguignon T, Svenson GJ and Evans TA (2012) A mitochondrial genome phylogeny of termites (Blattodea: Termitoidae): Robust support for interfamilial relationships and molecular synapomorphies define major clades. Mol Phylogenet Evol 65:163-173.
- Cao J-J, Wang Y, Murányi D, Cui J-X and Li W-H (2024) Mitochondrial genomes provide insights into the Euholognatha (Insecta: Plecoptera). BMC Ecol Evo 24:16.
- Capella-Gutiérrez S, Silla-Martínez JM and Gabaldón T (2009) trimAl: A tool for automated alignment trimming in large-scale phylogenetic analyses. Bioinformatics 25:1972-1973.
- Cheng X-F, Zhang L-P, Yu D-N, Storey KB and Zhang J-Y (2016) The complete mitochondrial genomes of four cockroaches (Insecta: Blattodea) and phylogenetic analyses within cockroaches. Gene 586:115-122.
- Clary DO and Wolstenholme DR (1987) Drosophila mitochondrial DNA: Conserved sequences in the A+T-rich region and supporting evidence for a secondary structure model of the small ribosomal RNA. J Mol Evol 25:116-125.
- Collins RA and Cruickshank RH (2013) The seven deadly sins of DNA barcoding. Mol Ecol Resour 13:969-975.
- Dixon P (2003) VEGAN, a package of R functions for community ecology. J Veg Sci 14:927-930.
- Dierckxsens N, Mardulyn P and Smits G (2016) NOVOPlasty: De novo assembly of organelle genomes from whole genome data. Nucleic Acids Res 45:e18.
- Ding S, Li W, Wang Y, Cameron SL, Murányi D and Yang D (2019) The phylogeny and evolutionary timescale of stoneflies (Insecta: Plecoptera) inferred from mitochondrial genomes. Mol Phylogenet Evol 135:123-135.
- Dong Z, Wang Y, Li C, Li L and Men X (2021) Mitochondrial DNA as a molecular marker in insect ecology: Current status and future prospects. Ann Entomol Soc Am 114:470-476.
- Folmer O, Black M, Hoeh W, Lutz R and Vrijenhoek R (1994) DNA primers for amplification of mitochondrial cytochrome c oxidase subunit I from diverse metazoan invertebrates. Mol Mar Biol Biotechnol 3:294-299.
- Gerth M, Geißler A and Bleidorn C (2011) Wolbachia infections in bees (Anthophila) and possible implications for DNA barcoding. Syst Biodivers 9:319-327.
- Githae EW and Kuria EK (2021) Biological control of desert locust (Schistocerca gregaria Forskål). CABI Rev 16:1-8.
- Gong R, Guo X, Ma J, Song X, Shen Y, Geng F, Price M, Zhang X and Yue B (2018) Complete mitochondrial genome of Periplaneta brunnea (Blattodea: Blattidae) and phylogenetic analyses within Blattodea. J Asia Pac Entomol 21:885-895.
- Havird JC and Santos SR (2014) Performance of single and concatenated sets of mitochondrial genes at inferring metazoan relationships relative to full mitogenome data. PLoS One 9:e84080.
- Hebert PDN, Cywinska A, Ball SL and deWaard JR (2003a) Biological identifications through DNA barcodes. Proc R Soc Lond B 270:313-321.
- Hebert PDN, Ratnasingham S and De Waard JR (2003b) Barcoding animal life: Cytochrome c oxidase subunit 1 divergences among closely related species. Proc R Soc Lond B 270:S96-S99
- Huang J, Zhang A, Mao S and Huang Y (2013) DNA barcoding and species boundary delimitation of selected species of Chinese Acridoidea (Orthoptera: Caelifera). PLoS One 8:e82400.
- Huerta-Cepas J, Serra F and Bork P (2016) ETE 3: Reconstruction, analysis, and visualization of phylogenomic data. Mol Biol Evol 33:1635-1638.
- Jacob Machado D, Janies D, Brouwer C and Grant T (2018) A new strategy to infer circularity applied to four new complete frog mitogenomes. Ecol Evol 8:4011-4018.
- Kalyaanamoorthy S, Minh BQ, Wong TKF, Von Haeseler A and Jermiin LS (2017) ModelFinder: Fast model selection for accurate phylogenetic estimates. Nat Methods 14:587-589.
- Katoh K and Standley DM (2013) MAFFT Multiple sequence alignment software version 7: Improvements in performance and usability. Mol Biol Evol 30:772-780.
- Kock L-S, Körs E, Husemann M, Davaa L and Dey L-S (2024) Barcoding fails to delimit species in Mongolian Oedipodinae (Orthoptera, Acrididae). Insects 15:128.
- Lee W and Akimoto S-I (2015) Development of new barcoding loci in gall-forming aphids (Eriosomatinae: Eriosomatini): Comparing three mitochondrial genes, ATP6, ATP8, and COI. J Asia Pac Entomol 18:267-275.
- Li Y, Wang S, Chen J, Zhou J and Bu W (2022) Two new stick insect species of Sosibia Stål (Phasmatodea: Lonchodidae: Necrosciinae) from China and the first report on mitochondrial genomes of this genus. Arch Insect Biochem Physiol 111:e21901.
- Liu C, Chang J, Ma C, Li L and Zhou S (2013) Mitochondrial genomes of two Sinochlora species (Orthoptera): novel genome rearrangements and recognition sequence of replication origin. BMC Genomics 14:114.
- Ma Y, Zhang L, Lin Y, Yu D, Storey KB and Zhang J (2023) Phylogenetic relationships and divergence dating of Mantodea using mitochondrial phylogenomics. Syst Entomol 48:644-657.
- Mandal SD, Chhakchhuak L, Gurusubramanian G and Kumar NS (2014) Mitochondrial markers for identification and phylogenetic studies in insects - A Review. DNA Barcodes 2:1-9
- Meier R, Zhang G and Ali F (2008) The use of mean instead of smallest interspecific distances exaggerates the size of the “barcoding gap” and leads to misidentification. Syst Biol 57:809-813.
- Meyer CP and Paulay G (2005) DNA barcoding: Error rates based on comprehensive sampling. PLoS Biol 3:e422.
- Morinière J, Hendrich L, Balke M, Beermann AJ, König T, Hess M, Koch S, Müller R, Leese F, Hebert PDN et al (2017) A DNA barcode library for Germany’s mayflies, stoneflies and caddisflies (Ephemeroptera, Plecoptera and Trichoptera). Mol Ecol Resour 17:1293-1307.
- Moulton MJ, Song H and Whiting MF (2010) Assessing the effects of primer specificity on eliminating numt coamplification in DNA barcoding: A case study from Orthoptera (Arthropoda: Insecta). Mol Ecol Resour 10:615-627.
- Nasirian H (2017) Infestation of cockroaches (Insecta: Blattaria) in the human dwelling environments: A systematic review and meta-analysis. Acta Trop 167:86-98.
- Okonechnikov K, Golosova O, Fursov M and UGENE Team (2012) Unipro UGENE: A unified bioinformatics toolkit. Bioinformatics 28:1166-1167.
- Paradis E and Schliep K (2019) ape 5.0: An environment for modern phylogenetics and evolutionary analyses in R. Bioinformatics 35:526-528.
- Pan CY, Hu J, Zhang X and Huang Y (2006) The DNA barcoding application of mtDNA COI gene in seven species of Catantopidae (Orthoptera). Entomotaxonomia 28:103-110.
- Rozas J, Ferrer-Mata A, Sánchez-DelBarrio JC, Guirao-Rico S, Librado P, Ramos-Onsins SE and Sánchez-Gracia A (2017) DnaSP 6: DNA sequence polymorphism analysis of large data sets. Mol Biol Evol 34:3299-3302.
- Silva-Brandão KL, Lyra ML, Santos TV, Seraphim N, Albernaz KC, Pavinato VAC, Martinelli S, Cônsoli FL and Omoto C (2011) Exploitation of mitochondrial nad6 as a complementary marker for studying population variability in Lepidoptera. Genet Mol Biol 34:719-725.
- Simon C, Frati F, Beckenbach A, Crespi B, Liu H and Flook P (1994) Evolution, weighting, and phylogenetic utility of mitochondrial gene sequences and a compilation of conserved polymerase chain reaction primers. Ann Entomol Soc Am 87:651-701.
- Song N, Li H, Song F and Cai W (2016) Molecular phylogeny of Polyneoptera (Insecta) inferred from expanded mitogenomic data. Sci Rep6:36175.
- Sun Z, Wan D-G, Murphy RW, Ma L, Zhang X-S and Huang D-W (2009) Comparison of base composition and codon usage in insect mitochondrial genomes. Genes Genom 31:65-71.
- Suyama M, Torrents D and Bork P (2006) PAL2NAL: Robust conversion of protein sequence alignments into the corresponding codon alignments. Nucleic Acids Res 34:W609-W612.
- Tokuda M, Tanaka S and Zhu D-H (2010) Multiple origins of Locusta migratoria (Orthoptera: Acrididae) in the Japanese Archipelago and the presence of two major clades in the world: Evidence from a molecular approach. Biol J Linn Soc Lond 99:570-581.
- Van Velzen R, Weitschek E, Felici G and Bakker FT (2012) DNA barcoding of recently diverged species: Relative performance of matching methods. PLoS One 7:e30490.
- Wei L, He J, Jia X, Qi Q, Liang Z, Zheng H, Ping Y, Liu S and Sun J (2014) Analysis of codon usage bias of mitochondrial genome in Bombyx mori and its relation to evolution. BMC Evol Biol 14:262.
- Wei S-J, Shi M, Chen X-X, Sharkey MJ, Van Achterberg C, Ye G-Y and He J-H (2010) New views on strand asymmetry in insect mitochondrial genomes. PLoS One 5:e12708.
- Whitfield JB and Kjer KM (2008) Ancient rapid radiations of insects: Challenges for phylogenetic analysis. Annu Rev Entomol 53:449-472.
- Whitworth TL, Dawson RD, Magalon H and Baudry E (2007) DNA barcoding cannot reliably identify species of the blowfly genus Protocalliphora (Diptera: Calliphoridae). Proc R Soc B 274:1731-1739.
- Wipfler B, Letsch H, Frandsen PB, Kapli P, Mayer C, Bartel D, Buckley TR, Donath A, Edgerly-Rooks JS, Fujita M et al (2019) Evolutionary history of Polyneoptera and its implications for our understanding of early winged insects. Proc Natl Acad Sci U S A 116:3024-3029.
- Wong T, Ly-Trong N, Ren H, Baños H, Roger A, Susko E, Bielow C, De Maio N, Goldman N, Hahn M et al (2025) IQ-TREE 3: Phylogenomic inference software using complex evolutionary models. Mol Biol Evol 43:msag117.
- Yoshizawa K (2011) Monophyletic Polyneoptera recovered by wing base structure. Syst Entomol 36:377-394.
- Yuan Y, Zhang L, Li K, Hong Y, Storey KB, Zhang J and Yu D (2023) Nine mitochondrial genomes of phasmatodea with two novel mitochondrial gene rearrangements and phylogeny. Insects 14:485.
- Zhang A, Hao M, Yang C and Shi Z (2017) BarcodingR: An integrated r package for species identification using DNA barcodes. Methods Ecol Evol 8:627-634.
- Zhang H-L, Huang Y, Lin L-L, Wang X-Y and Zheng Z-M (2013) The phylogeny of the Orthoptera (Insecta) as deduced from mitogenomic gene sequences. Zool Stud 52:37.
Internet Resources
-
catfasta2phyml, catfasta2phyml, https://github.com/nylander/catfasta2phyml (accessed 28 September 2025)
» https://github.com/nylander/catfasta2phyml -
codonW, codonW, https://codonw.sourceforge.net (accessed 04 June 2025).
» https://codonw.sourceforge.net
-
Declaration of generative AI and AI-assisted technologies in the writing process
During the preparation of this manuscript, the authors employed ChatGPT exclusively to assist with language refinement and improvements in clarity and readability. All scientific content, interpretations, and conclusions were conceived, verified, and approved by the authors. The authors thoroughly reviewed and edited the text after using this tool and accept full responsibility for the final content of the published work.
-
Data Availability
Nucleotide sequence data reported are available in the Third Party Annotation Section of the DDBJ/ENA/GenBank databases under the accession numbers: BK068635, BK068636, BK068638, BK068639, BK068643-BK068652, BK068655-BK068665.
Nucleotide sequence data reported are available in the Third Party Annotation Section of the DDBJ/ENA/GenBank databases under the accession numbers: BK068635, BK068636, BK068638, BK068639, BK068643-BK068652, BK068655-BK068665.