Unconventional Anthropometric Indicators: Foundations, Applicability, and Validity as Predictors of Health Conditions
Abstract
Several anthropometric parameters have been proposed as indicators of health conditions. Some have achieved wide acceptance and applicability. Others, although grounded in solid theoretical frameworks and demonstrating good diagnostic validity, have not gained the same level of recognition. These are referred to here as "unconventional anthropometric indicators". This article aims to provide a descriptive and conceptual synthesis of these measures, addressing their nuances and applicability. It is a narrative review that discusses the following indicators: Head-to-height index (HHI), Waist-to-Height Ratio (WHtR), Conicity Index (C-Index), Waist-to-Hip Ratio (WHR), A Body Shape Index (ABSI), Neck Circumference (NC), and Adductor Pollicis Muscle Thickness (APMT). WHtR, C-Index, WHR, and ABSI are based on the identification of abdominal fat accumulation and its association with cardiometabolic risks. However, for this purpose, waist circumference stands out due to its methodological simplicity and predictive effectiveness. NC is an indicator of subcutaneous fat, whose excess increases disease risk and is not influenced by factors that alter abdominal volume. APMT identifies muscle depletion and is comparable to other anthropometric predictors of malnutrition risk. HHI was proposed to identify individuals who experienced undernutrition early in life. Grounded in a robust theoretical foundation, it is a promising tool for advancing research on the Developmental Origins of Health and Disease (DOHaD). The indicators analyzed are valuable for monitoring cardiometabolic risk factors, each with its unique characteristics. Understanding these particularities is essential for selecting the most appropriate indicators for different contexts, thus enabling more effective interventions.
Keywords
Public Health Surveillance; Risk Factors; Cardiometabolic Risk Factors; Nutrition Assessment; Anthropometry
Introduction
Chronic noncommunicable diseases (NCDs), such as cardiovascular diseases and diabetes, account for more than 70% of all deaths worldwide. Risk factors such as unhealthy diet and sedentary lifestyle contribute to an increased prevalence of these diseases, generating significant economic impacts. The implementation of public policies focused on reducing these risk factors and promoting healthy lifestyles can reduce the incidence and severity of NCDs.1
Continuous surveillance allows for early identification of trends and vulnerable populations, making effective and targeted interventions possible. Systematic monitoring of these factors supports the formulation of public policies and health programs, contributing to reduced morbidity and mortality due to NCDs and promoting improved quality of life.2
Anthropometry is essential in monitoring risk factors for NCDs. Indicators such as body mass index (BMI) and waist circumference (WC) are simple, non-invasive, and accessible tools that allow for early identification of individuals at risk. BMI identifies elevated body weight, which is associated with a greater risk of NCDs when it results from excess fat. WC, in turn, detects the accumulation of abdominal fat, which is closely linked to cardiometabolic risk.3
Although other measurements or combinations of anthropometric measures have been proposed as risk indicators for NCDs, with solid theoretical foundations and diagnostic validity, they have not achieved the same popularity as BMI and WC in clinical or epidemiological contexts. For the purposes of this study, these measures will be referred to as "unconventional anthropometric indicators." Among these, the following indicators will be addressed: head-to-height index (HHI),4 waist-to-height ratio (WHtR),5 conicity index (C index),6 waist-to-hip ratio (WHR),7 body shape index (ABSI),8 neck circumference (NC),9 and adductor pollicis muscle thickness (APMT).10
In general, anthropometric indicators are important tools for monitoring conditions associated with the development of NCDs. For this reason, they are widely used both in clinical practice and in epidemiological studies. In addition to their diagnostic value, they play a crucial role in the assessment of preventive interventions and public health programs, facilitating the implementation of more effective health promotion strategies. Their use contributes to reducing the burden of NCDs, improves population health outcomes, and optimizes the allocation of resources within health systems.1,3,11
The objective of this article is to present a descriptive and conceptual synthesis regarding unconventional anthropometric indicators, focusing on their nuances and applicability in clinical and epidemiological practice.
Methods
This study consists of a narrative review that explores unconventional (or less established) anthropometric indicators used as predictors of health conditions. The selection of indicators was based on a literature search, considering their citation frequency in scientific studies and their potential for monitoring risk factors for NCDs. The review included original studies that introduced these measurements, as well as more recent articles that discussed their clinical and epidemiological applicability.
Inclusion and exclusion criteria
-
–
Studies were included if they met the following criteria:
-
–
They presented original data about one or more unconventional anthropometric indicators;
-
–
They were published in peer-reviewed journals;
-
–
They used valid methodologies to assess the indicators;
-
–
They investigated the relationship of the indicators with relevant health outcomes, for example, obesity, cardiometabolic risk, and malnutrition.
-
–
The following were excluded:
-
–
Studies that did not present a clear methodology for collecting and analyzing anthropometric indicators;
-
–
Literature reviews without critical assessment of the methods used;
-
–
Articles with very small sample sizes or without population representation.
Data sources and search strategy
The search for articles was conducted in PubMed, Scopus, Web of Science, and SciELO, with no restrictions on language or year of publication. The search terms included combinations of keywords and controlled descriptors (MeSH terms and DeCS) related to the indicators being investigated, for example, WHtR, C index, ABSI, NC, APMT, among others.
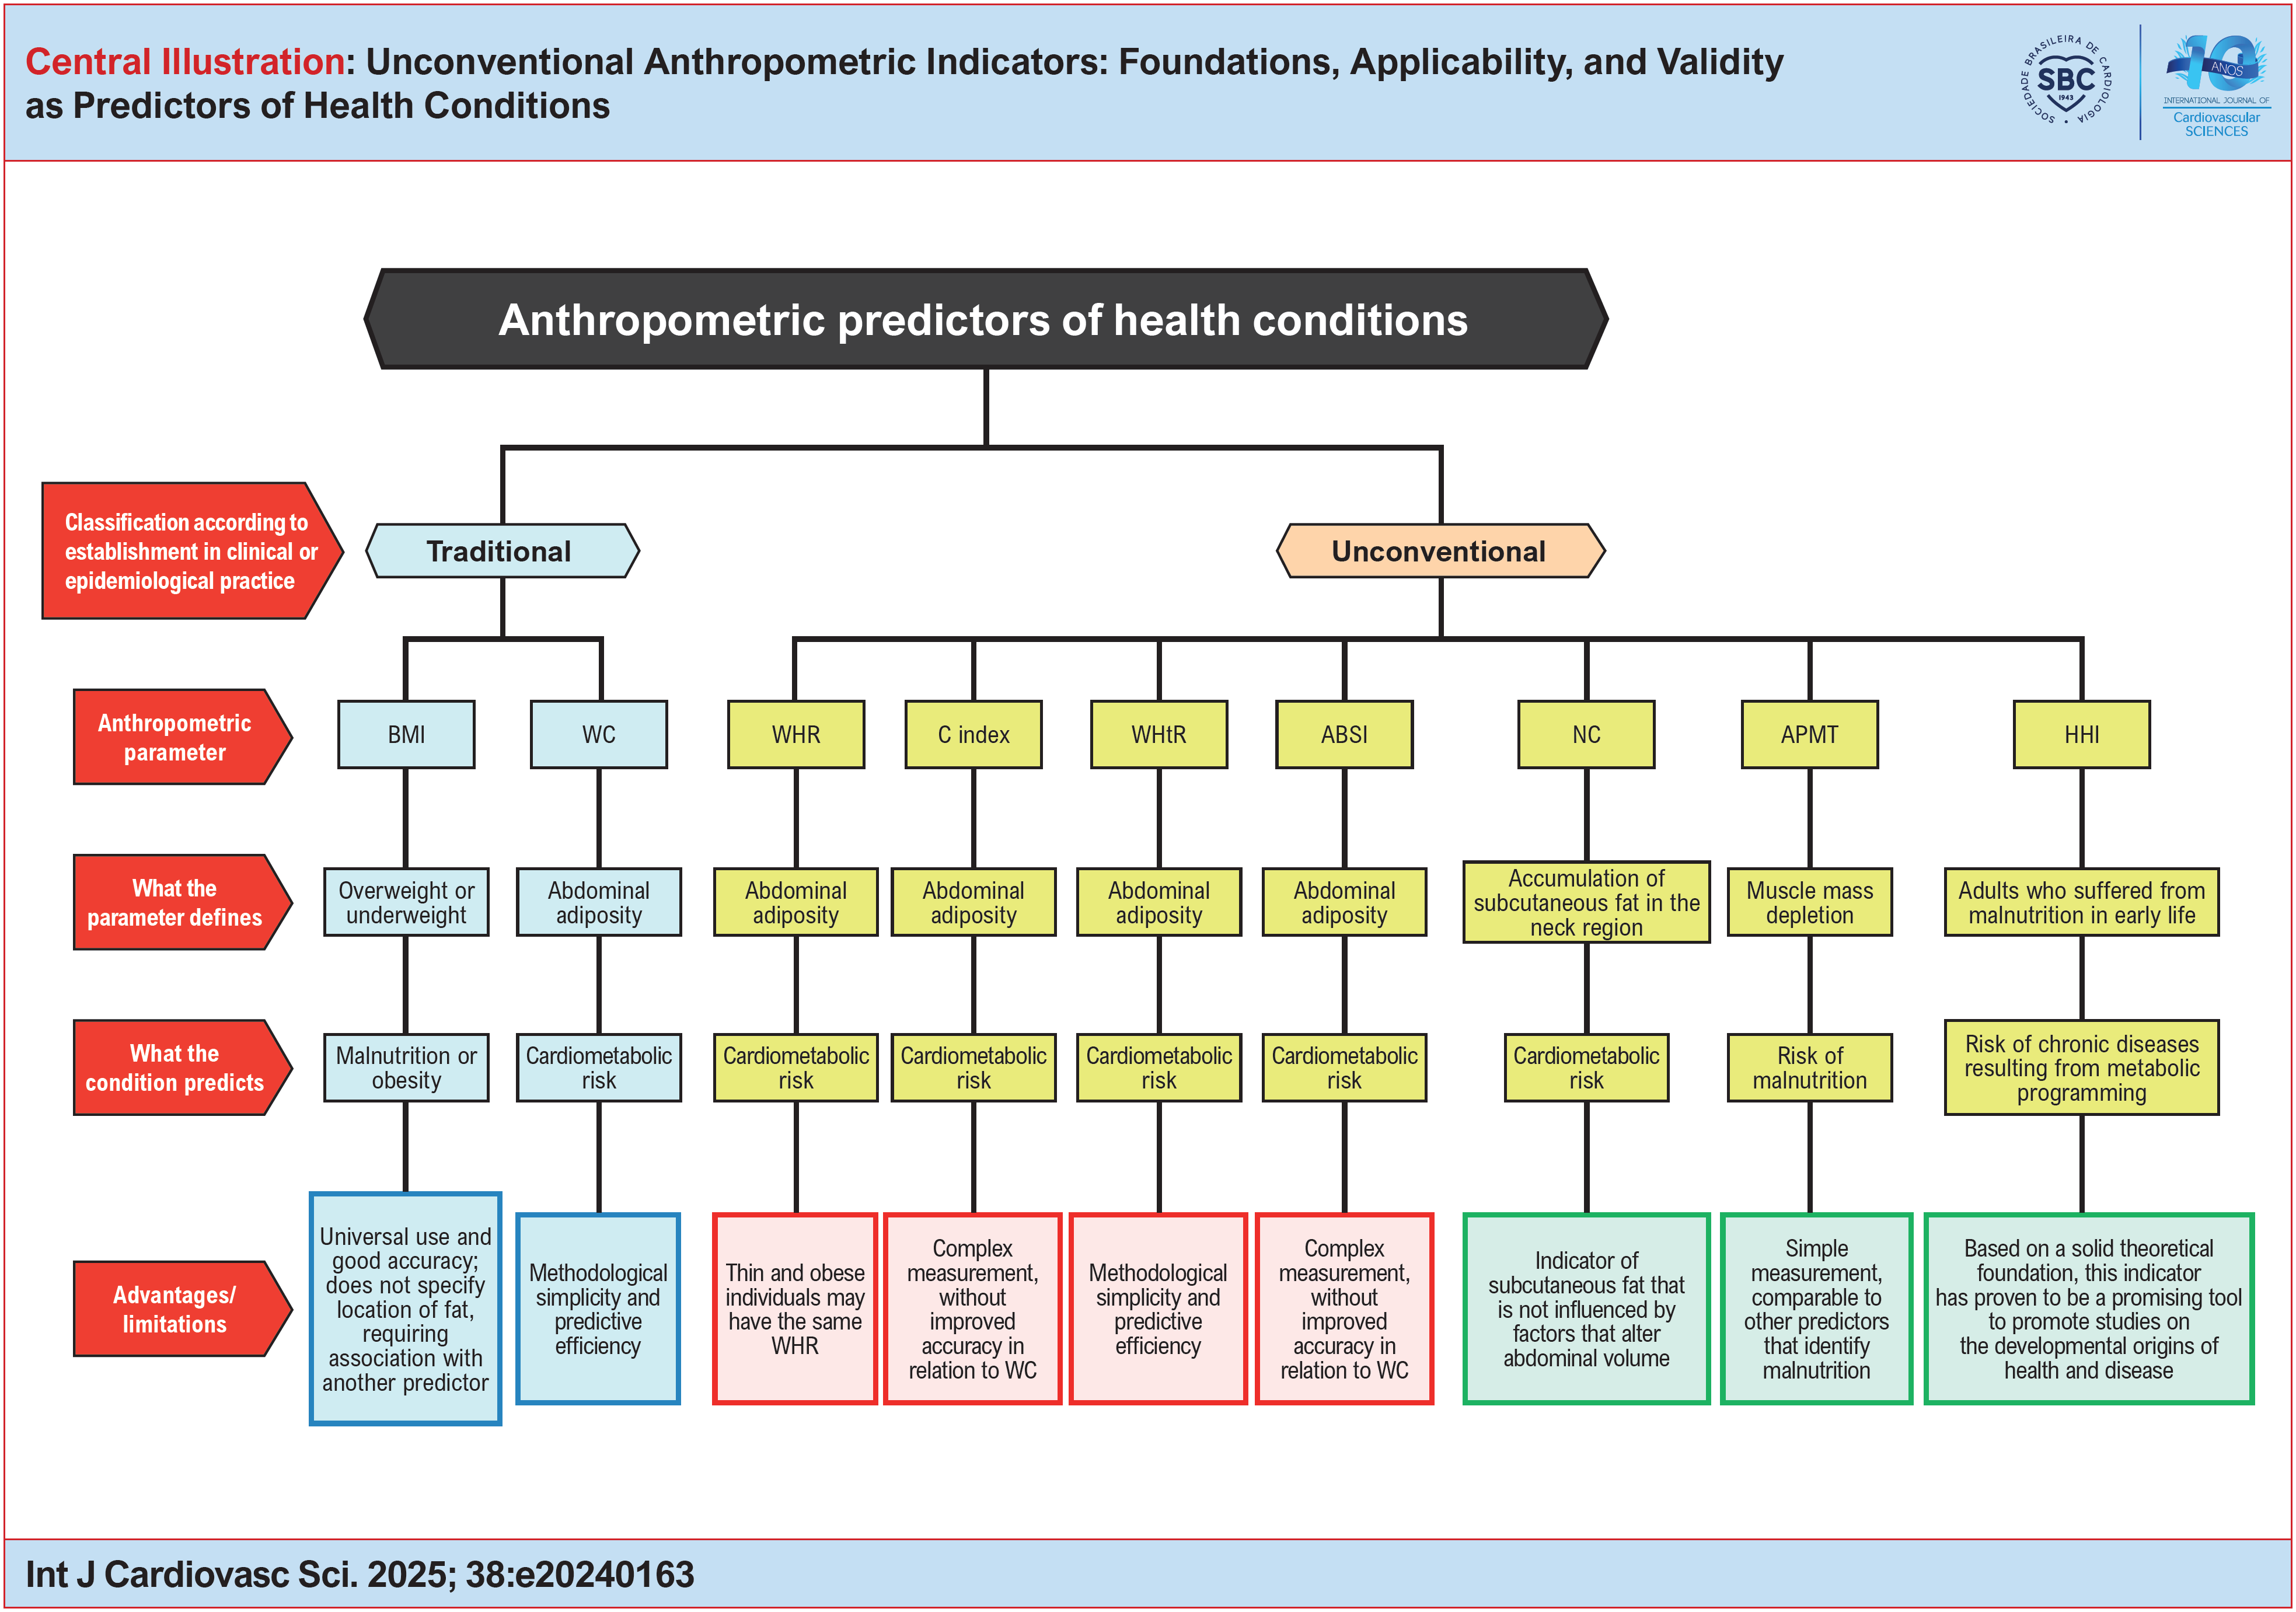
The anthropometric indicators addressed in this review are summarized in Table 1, which displays the designation of parameters, authors responsible for introducing them, year of publication, and main goals. The Central Illustration illustrates the classification of indicators as "traditional" and "unconventional," highlighting their respective purposes in health assessment.
Anthropometric predictors that are unconventional in terms of clinical or epidemiological use and their respective goals
HHI
Short stature in adults, although associated with malnutrition in early life in contexts of social vulnerability,12-16 is not a highly accurate indicator, as not all individuals with short stature experienced chronic nutritional deprivation during growth.17-19
Since the 2000s, there has been an increase in the number of publications involving head circumference20-23 as an indicator of brain development under a wide range of aspects, including drug exposure,23 the impact of nutritional status on brain function and development,24 the effects of growth hormone treatment,25 and the beneficial effects of breastfeeding on normal head growth, even in situations of social vulnerability.26
Malnutrition in early life is a condition associated with higher occurrence of chronic diseases in adulthood.27-30 Some studies on this relationship have used short stature as an indicator of malnutrition in early life. However, other non-nutritional factors can also cause stunting. Depending on the severity of malnutrition in early life, the human body reacts by compromising mainly weight and length gain, but prioritizing, as far as possible, normal brain growth, resulting in individuals with heads that are disproportionate in relation to their respective height. Based on this premise, Ferreira et al.4 created the HHI, a novel anthropometric indicator for malnutrition in early life, mainly in cross-sectional studies involving adults, in which information on birth weight or nutritional status during the perinatal period is unavailable. The HHI is obtained by means of the following equation:
To validate this indicator, the authors used height and head circumference data from 3109 women. HHI > 1.028 (75th percentile) was the best cutoff point to predict obesity, and it was used to define disproportion between head size and respective height. The strength of associations with various outcomes was tested for both disproportionality and short stature. After adjustment for confounding factors, the strongest associations were observed for disproportionality. The prevalence ratios for were as follows, respectively: obesity (2.61 versus 1.09), abdominal obesity (2.11 versus 1.42), hypertension (1.24 versus 0.90), hypercholesterolemia (2.98 versus 1.65), and hypertriglyceridemia (1.47 versus 0.91), all with p < 0.05.
These results led to the conclusion that disproportion between head size and respective height is a more accurate indicator of malnutrition in early life than short stature, given that the latter can be caused by factors other than those of nutritional origin, whereas high HHI is likely due to metabolic adaptations brought about by malnutrition in early life.
WHtR
The WHtR is a parameter that indicates the pattern of body fat distribution. Although the application of WHtR is not as common as other more traditional indexes, it is not a novel concept, having been proposed as a measurement for assessing health risks since the 1990s.31 It is fairly simple to calculate, by means of the following equation:
The WHtR has been consolidated as a method for assessing health risk due to its simplicity, low cost, and accuracy in identifying central adiposity. Unlike other markers, WHtR uses a single cutoff point. WHtR > 0.5 has been the most widely adopted value to indicate high risk of cardiovascular diseases, regardless of sex, age, or ethnicity.32
Based on this cutoff point, the National Institute for Health and Care Excellence in the United Kingdom issued a guideline encouraging individuals to maintain their WC below half their height, as a preventive strategy to avoid severe health complications.33
However, the adoption of a standard cutoff point for anthropometric indicators, such as WHtR, is questionable due to variations in body proportions between different ethnicities, sexes and ages.34 A study including women in the Brazilian state of Alagoas demonstrated that a cutoff point of 0.54 for WHtR was more accurate in identifying hypertension, reinforcing the need to adapt this tool according to the population context.35
The validity of WHtR as a reliable tool for identifying health risks has been widely corroborated. A meta-analysis36 revealed that increased WHtR is associated with a significantly greater risk of mortality due to cardiovascular disease (23%) and cancer (21%). Often considered the most efficient anthropometric indicator, WHtR has demonstrated superiority over BMI in detecting cardiometabolic risks in a meta-analysis including more than 300,000 adults.37 Studies conducted with adults in Sri Lanka also confirmed the greater predictive capacity of WHtR when compared to WHR.38 The better performance of WHtR can be explained by the fact that the formula incorporates height, a relatively constant variable in adults, making it capable of offering a more precise notion of body proportionality.5
Nonetheless, the superiority of WHtR is not an absolute consensus. A meta-analysis39 found no evidence of superiority in the majority of cardiometabolic risk factors in children and adolescents. Moreover, a Brazilian study with women of African descent40 showed that WC had equal or better performance than WHtR in identifying the majority of risk factors.
Although still uncommon in clinical practice, WHtR has been gaining popularity over the years, and it is being consolidated as an additional public health tool for identifying health risks. Due to its simplicity, low cost, and good accuracy, it can be considered a valuable instrument in combination with other measurements to assess individual health conditions.
C index
Obesity is a factor that is considered to be associated with different health problems. However, the topographic distribution of adipose tissue appears to be more relevant than the total amount of body fat. This is due to the fact that central obesity is an important risk factor for the development of various health problems.41
From an anatomical point of view, fat accumulation can occur in the form of subcutaneous fat and visceral fat.42 Fat deposits around vital organs are the most harmful, and they have been associated with the accumulation of abdominal fat and metabolic disorders.43
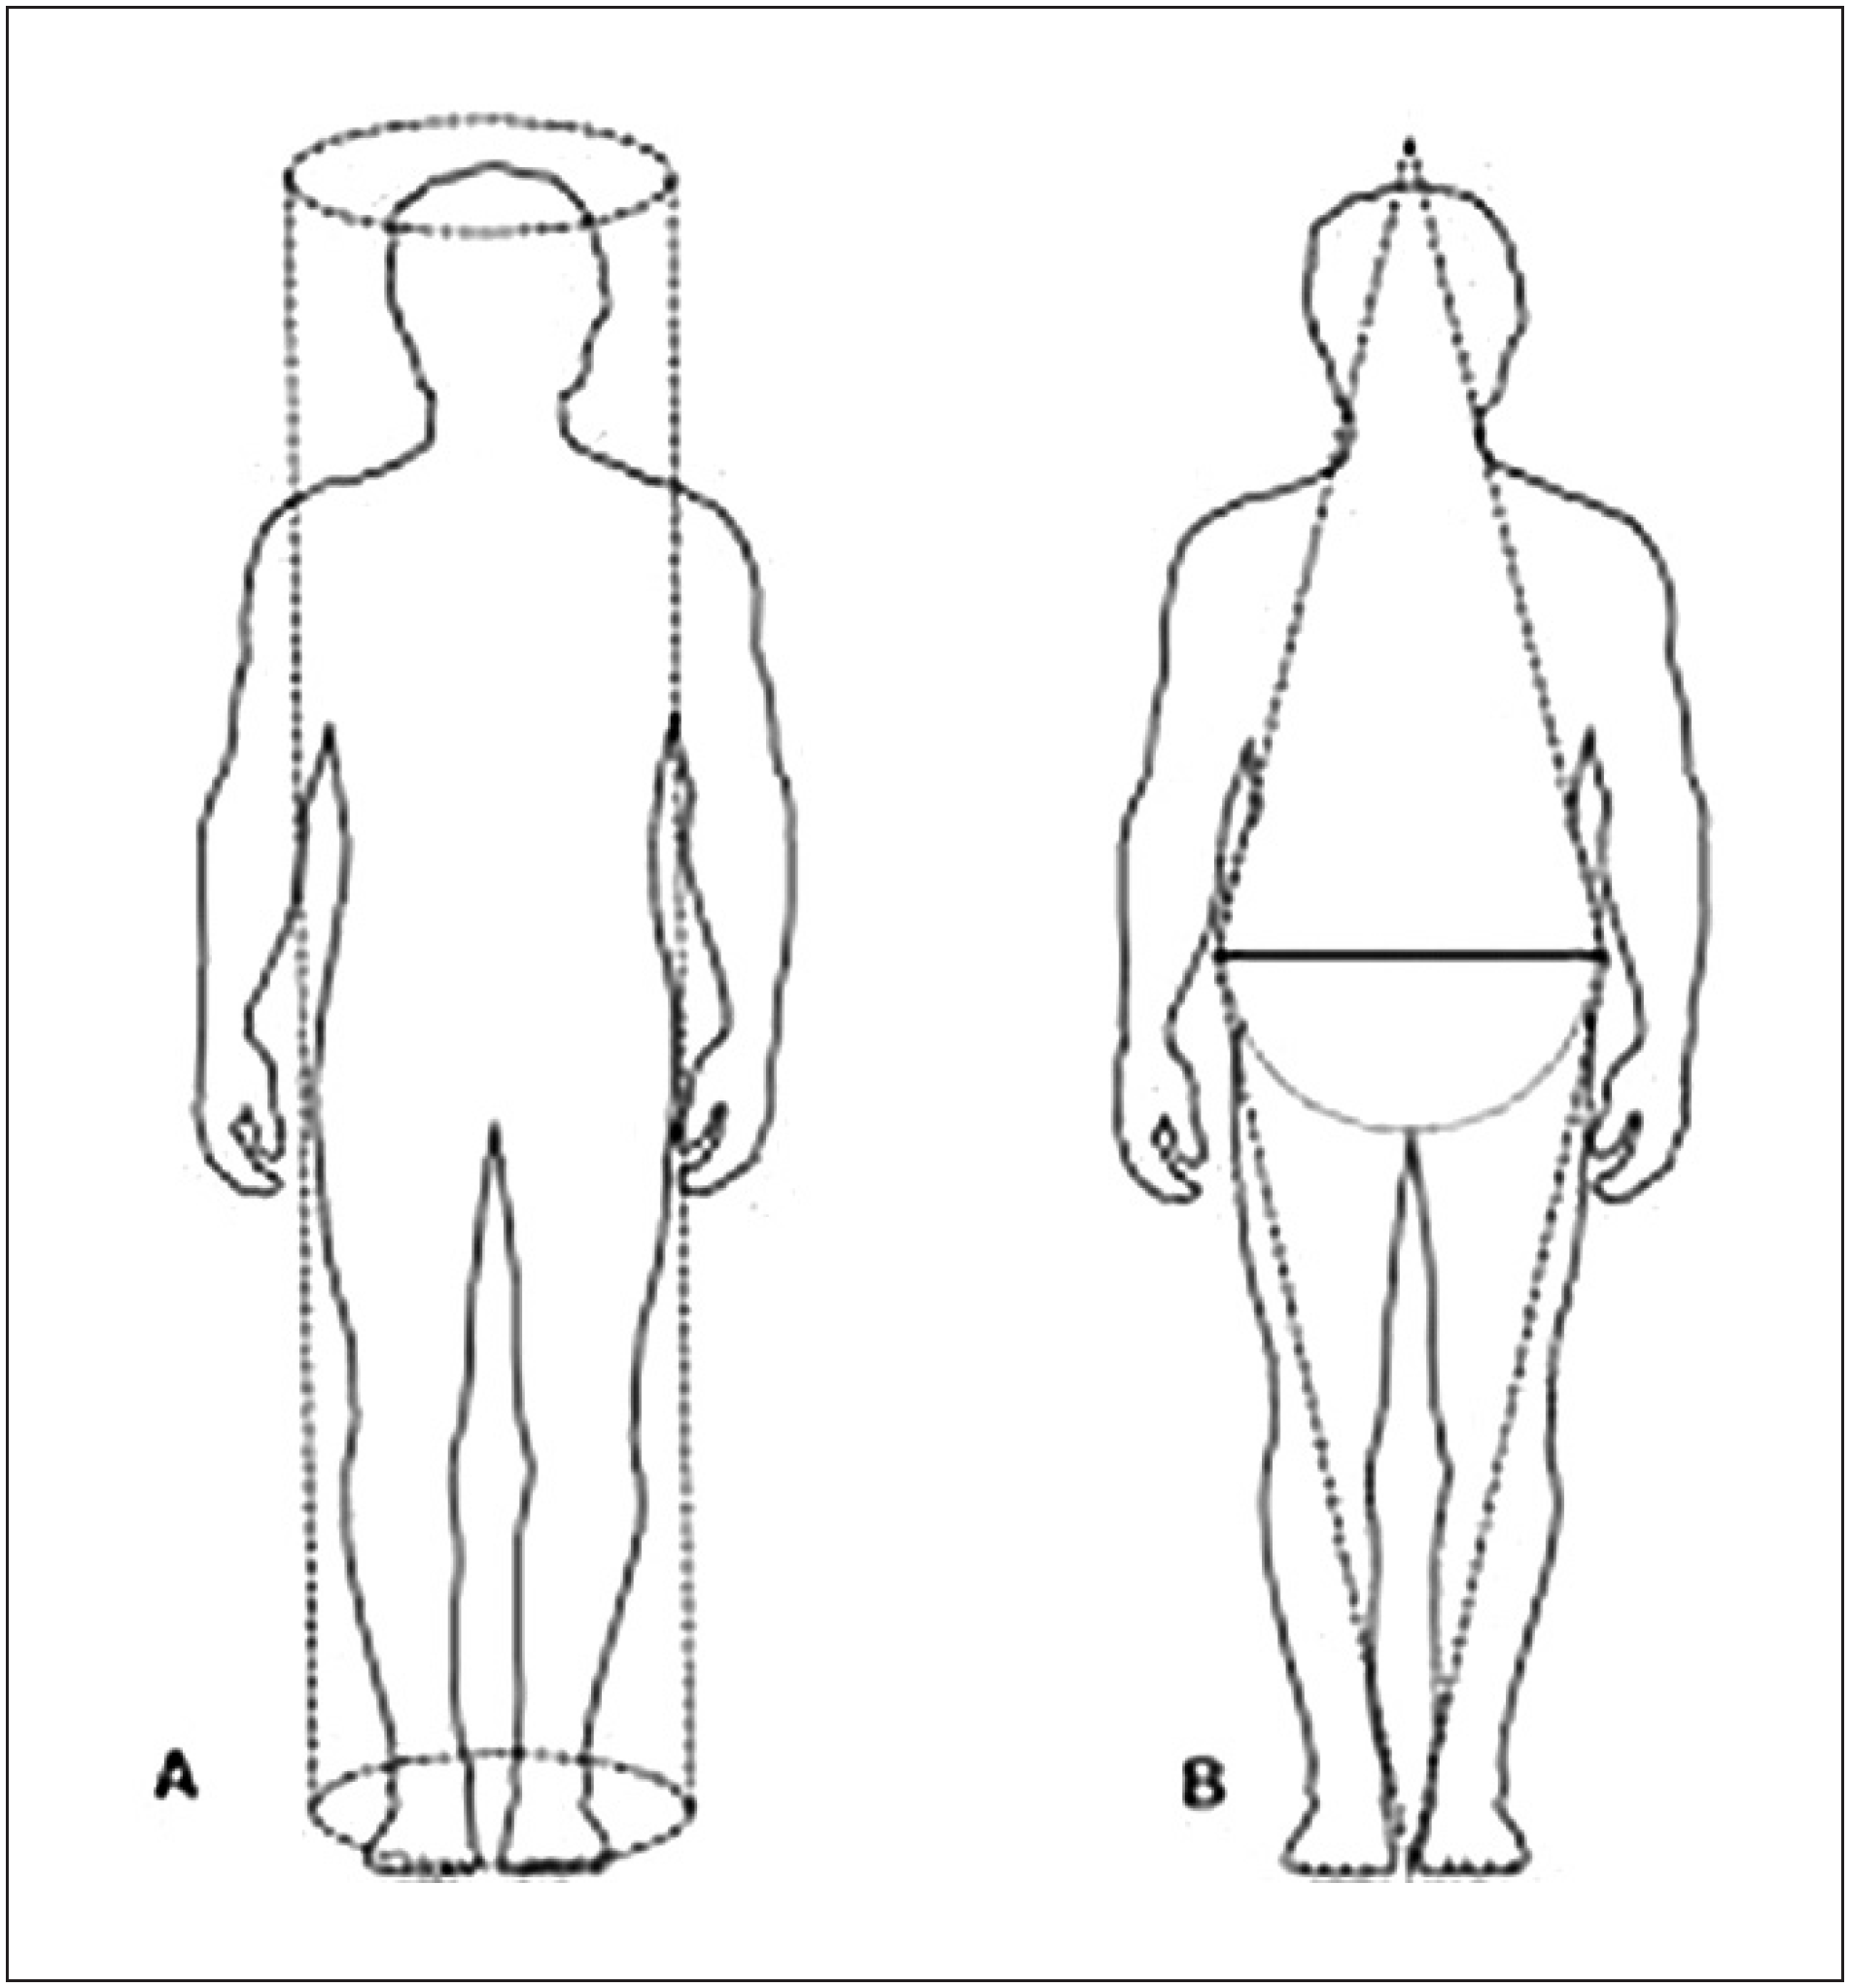
In the 1990s, the epidemiologist Rodolfo Valdez proposed the C index as an indicator of abdominal obesity, arguing that individuals with less fat in the central region have a cylindrical appearance, whereas those with more fat around the waist exhibit a modified profile with a double cone shape,6 as illustrated in Figure 1.
Theoretical representation of the C index. The C index models the accumulation of fat in the abdominal region as the progression of the body from a cylindrical shape (A) to a double cone shape (B). Source: Cordeiro et al.44
The index is obtained by means of the following equation, using waist circumference, body weight, and height measurements:
Since its introduction, some studies have been designed to determine the possible relationship between the C index and health problems.45-47
Motamed et al.48 investigated the capacity of different indicators of central obesity (WC, WHR, WHtR, abdominal volume index, and C index) to predict cardiovascular events. The study included 3199 participants between the ages of 40 and 79 years. The authors concluded that the C index and WHR had greater discriminatory accuracy compared to the other parameters. Other studies, however, have not found similar results.11,35,40,49
In a sample composed of 10,432 individuals of both sexes between 40 and 69 years of age, Feng et al.11 analyzed the following 17 obesity-related indicators regarding their ability to predict cardiovascular diseases and multimorbidity: BMI, body fat percentage, C index, Clínica Universidad de Navarra-Body Adiposity Estimator, ABSI, body adiposity index, WC, WHR, WHtR, body roundness index, abdominal volume index, triglyceride glucose index, lipid accumulation product, visceral adiposity index, Chinese visceral adiposity index, waist triglyceride index, and cardiometabolic index. The best predictors for the analyzed outcomes, considering the differences between sexes, were as follows: body fat percentage to discriminate hypertension among men and Chinese visceral adiposity index to discriminate hypertension among women; for dyslipidemia, the best predictors were BMI among men and Clínica Universidad de Navarra-Body Adiposity Estimator among women. The cardiometabolic index and Chinese visceral adiposity index were the most accurate predictors of diabetes in men and women, respectively. Regarding multimorbidity, the triglyceride glucose index was the best predictor, regardless of sex.
These findings highlight the variability of results according to the indicators and outcomes analyzed, suggesting the need for a personalized approach that considers differences between sexes when choosing the most appropriate anthropometric parameter to assess health risks.
Regarding the C index, studies have reported that, although it showed an association with all outcomes investigated, its predictive capacity was lower than that of all other indicators analyzed, corroborating the findings of studies conducted in our laboratory.35,40 One study was conducted with a probabilistic sample of 3143 women from the Brazilian state of Alagoas (20 to 49 years old). The predictors analyzed were BMI, WC, WHR, WHtR, body fat percentage, and C index. Among all indicators, WHtR stood out as the best predictor of hypertension.35 Another study, conducted with a random sample of 1661 women from Quilombola communities in Alagoas, tested the following indicators: BMI, WC, WHtR, C index, body fat percentage, and ABSI. The outcomes to be identified were arterial hypertension, diabetes, hypertriglyceridemia, hypercholesterolemia, and low High-Density Lipoprotein (HDL) levels. WC was the most accurate predictor for identifying higher risk of cardiovascular disease in women of African descent, demonstrating an area under the receiver operating characteristic curve superior or similar to the other predictors in most of the analyses performed.40
WHR
The WHR is a parameter for predicting cardiovascular disease risk.50 It is obtained by dividing WC by hip circumference. According to the World Health Organization (WHO), the cutoff points for defining risk are 0.85 and 0.90 for women and men, respectively.34 In the late 1940s, research developed by Vague provided a basis for the hypothesis that fat accumulation in the abdominal region is related to clinical outcomes resulting from obesity. The outcomes evaluated were arterial hypertension, diabetes mellitus, and dyslipidemia (hypertriglyceridemia, hypercholesterolemia, and low HDL).51
In the same manner as the C index, elevated WHR values are associated with adverse cardiovascular and metabolic outcomes. However, when compared to other anthropometric measurements, such as WC and WHtR, WHR generally has a lower predictive capacity for these outcomes.
Furthermore, WHR has limitations that make it difficult to interpret, making it disadvantageous in relation to other anthropometric indicators of central obesity.52,53 WC measures visceral and subcutaneous fat, whereas hip circumference considers the amount of bone, muscle, and adipose tissue. Pouliot et al.54 demonstrated that lean individuals can have the same WHR as obese individuals. Therefore, WHR is not recommended for monitoring changes in the amount of abdominal fat over time. The following scenario illustrates this limitation. Patient A has WC of 120 cm and hip circumference of 150 cm (120/150 = 0.80). Patient B has WC of 80 cm and hip circumference of 100 cm (80/100 = 0.80). Therefore, although patient A has much larger WC and hip circumference than patient B, both have the same WHR value.
Therefore, notwithstanding its simplicity and easy application, WHR may not offer significant advantages in relation to other indicators.11,35,40,49
ABSI
Considering the limitations of BMI and its high correlation with WC, the combined use of both measurements would not add much to the conclusions obtained in epidemiological studies, as they would result in similar interpretations. Therefore, Krakauer and Krakauer8 developed the ABSI as an alternative to assess mortality risk. This index uses measurements of weight, height, and WC, and it is calculated by means of allometric analysis, using to following the equation:
The term allometry designates changes in the relative dimensions of parts of an organism that are correlated with changes in its overall size.55
The ABSI, created to assess the impact of central bulge in relation to body size, demonstrated, in a study with adults, that mortality rates increase exponentially with above-average values. Furthermore, 22% of the population mortality hazard was attributed to high ABSI, compared to 15% for BMI and WC, even after adjusting for other risk factors.8
The results showed that ABSI has a low correlation with BMI (r = 0.019), indicating that it can be used in conjunction with BMI for a more complete assessment of health risks. On the other hand, WC showed a high correlation with BMI (r = 0.881), suggesting that its use in combination with BMI would not provide additional benefits.8
An online calculator (https://nirkrakauer.net/sw/aABSI-calculator.html) makes it possible to obtain ABSI value and individual health risk classification by entering data on sex, age, weight, height, and WC. It is worth underscoring that there is no single cutoff point for ABSI, as the risk classification varies according to age and sex.
According to the authors of the ABSI, the online calculator offers the following three clinical benefits: (1) it improves the estimation of disease and mortality risk on the population level, when combined with BMI; (2) it makes possible to track the evolution of risk over time, helping assess the effectiveness of interventions; and (3) it may guide clinical decisions, such as the indication for bariatric surgery.56
However, a study including Brazilian women of African descent40 found unfavorable results for the ABSI. In that study, body fat percentage was the best predictor of arterial hypertension, whereas WHtR, C index, and WC were the best predictors of diabetes mellitus, hypertriglyceridemia, and low HDL, respectively. ABSI and BMI performed worse in predicting hypertension and hypertriglyceridemia. WC was considered the most appropriate predictor due to its good accuracy and methodological simplicity.
NC
Since the he 1950s, neck skinfolds have been associated with a higher risk of obesity and its comorbidities, providing evidence of the extent to which subcutaneous fat in the upper body may interfere with health.9,57
NC, a simple anthropometric measurement, indirectly indicates the accumulation of subcutaneous fat in this region. This is associated with greater cardiovascular risk, insulin resistance, and other health problems, due to its high lipolytic activity.58-60
Measurements should be performed with an inelastic tape (mm), which should be positioned over the cricoid cartilage, perpendicular to the long axis of the neck, considering the midpoint of the cervical spine and anterior neck.61 In men with laryngeal prominence (Adam's apple), the measurement should be performed just below the prominence. The proposed cutoff point for defining risk has been shown to vary depending on population characteristics.
Recent studies have validated NC as an indicator of excess fat in this region and its relationship with health risks in different age groups and nationalities.62-64
NC is correlated with WC and BMI in both sexes.65 As an anthropometric predictor, NC is practical, fast, and effective in identifying obesity in children and adolescents, and it is not affected by physiological factors, such as abdominal distension or respiratory movements.61,66
APMT
Opposable thumbs, a characteristic of human evolution, allow complex and precise movements. APMT was initially studied for purposes of neurological assessment, but it has recently been used as an anthropometric indicator of muscle depletion and functional capacity.67 Only recently has this measurement been used as an anthropometric parameter for assessing nutritional status.68
APMT is correlated with other predictors of malnutrition in hospitalized patients and healthy elderly individuals. Inactivity and muscle catabolism, which are common in diseases and in aging, can lead to atrophy of the adductor pollicis muscle, making it a predictor of nutritional risk. Adductor pollicis muscle mass tends to be maintained until age 65, but may decline after this age, even in healthy individuals.67
Lameu et al.67 identified that APMT was significantly correlated with BMI, NC, arm muscle circumference, arm muscle area, and calf circumference, but there was no correlation with fat-related parameters, such as triceps skinfold thickness and arm fat area.
Bragagnolo et al.69 found that 62.8% of surgical patients in the preoperative period had APMT below 13.4 mm, associated with BMI of 21.5 kg/m2. This characterization indicated the need for clinical observation and periodic assessment of these individuals’ nutritional status. The findings of this study demonstrate that APMT is a reliable method for nutritional assessment in surgical patients. In addition to the correlation with other anthropometric parameters, it has good sensitivity and specificity. In summary, this method, which is easy to perform and low-cost, offers safety in the assessment of nutritional status, and it may be applied in clinical practice in surgical patients.
Bezerra70 assessing the risk of malnutrition in patients with chronic heart failure, correlated APMT with subjective global assessment. They observed that, with increased values of APMT measurement, the risk of malnutrition according to the subjective global assessment fell by 20.3%, and the measurement showed good sensitivity and specificity. However, the study highlights the importance of using this tool in conjunction with other anthropometric parameters to assess the risk of malnutrition.
It is worth underscoring that APMT has a strong correlation with the functional capacity of the person being assessed, especially in elderly individuals. Accordingly, in individuals with professional activities that do not demand much work from the adductor pollicis muscle or even individuals who have been bedridden for long periods, the measurements may be reduced. On the other hand, exercises or repetitive activities of a muscle group during a certain time period preserve muscle size and function.71
These data suggest that APMT assessment is a useful resource in clinical practice. Although the measurement is not yet fully validated, its relationship with other anthropometric predictors and its high sensitivity and specificity mean that its use in association with other indicators may be of great value.
Proposed cutoff points
Bragagnolo et al.69 proposed 13.4 mm as the cutoff point for malnutrition in surgical patients, whereas Aguiar et al.72 suggested 12.8 mm, with divergent results in onco-hematological patients. Gonzalez et al.68 found higher mean APMT in healthy individuals, with a reduction in those over 60 years of age, corroborating Phillips et al.73 Lameu et al.67 found lower values than those identified by Gonzalez et al.68 The lack of a single cutoff point for APMT, due to the influence of the type of target population and study design, highlights the need for further research to establish standards according to sex, age, and ethnicity, in addition to standardized measurement protocols.
The advantages of APMT include the fact that the measurement is simple, non-invasive, fast, easy to perform, and low-cost, in addition to its well-defined anatomical reference. However, it has also shown some limitations. For instance, edema in the hands can overestimate the results. Furthermore, APMT still lacks established and validated cutoff points, and an individual's work activity can influence the measurement.
Limitations
It is necessary to recognize some limitations inherent to this review. First, the heterogeneity among the included studies, in terms of design, population, and analysis methods, may complicate direct comparison of the results and generalization of the conclusions. Moreover, the lack of standardization in the assessment of some anthropometric indicators may introduce variability in the measurements and inconsistencies between different studies.
Another important point to consider is the applicability of the indicators in different populations. The anthropometric characteristics and the prevalence of the outcomes analyzed vary between different ethnic groups and populations. Therefore, the external validity of the indicators may be limited, especially for populations with anthropometric profiles that are different from the Brazilian population, as exemplified in the study by Feng et al.11 with a Chinese population.
It is also essential to highlight the influence of socioeconomic and environmental factors on the prevalence of NCDs and on associations with anthropometric indicators. Social inequality, access to health services, and diet quality are factors that can modulate the relationship between anthropometric indicators and NCD risk.74,75 Therefore, interpretation of the results should take into consideration the socioeconomic and environmental context of the population studied.
Finally, this study focused on unconventional anthropometric indicators, which are less widely used in clinical and epidemiological practice. The scarcity of research on some of these indicators may limit a full understanding of their properties and applicability. Further studies with representative samples and standardized methods are crucial to deepen knowledge about these indicators and determine their true utility in assessing NCD risks, as well as other applications.
In spite of these limitations, this review significantly contributes to discussions on the use of unconventional anthropometric indicators in clinical and epidemiological practice. By highlighting the characteristics, advantages, and disadvantages of each indicator, this study assists health professionals and managers in selecting tools that are appropriate for their objectives.
Final considerations
BMI is the parameter recommended by the WHO to assess appropriate body weight, and it has a positive correlation with increased body adiposity. Nevertheless, because BMI does not distinguish which body compartment explains situations of excess weight (fat mass or lean mass) on an individual level, it needs to be associated with other indicators that provide complementary information in this regard, in addition to the location of the fat. For this definition, the WHO recommends the use of WC. Among the methods for estimating body composition, skinfold measurement (not covered in this article) is widely used in clinical practice to calculate body density and to apply the results in predictive equations for body fat percentage.76
However, at an epidemiological level, BMI can be used alone to define the prevalence of obesity in a population, supporting public policies. Since these policies are directed at the general population, there would be no major problems with respect to "false positives" (individuals who are overweight but not obese due to greater muscle development). This is justified because the proportion of these individuals is small in the population. Regarding individuals who have this profile as a result of practicing physical exercise, it is common for them to adopt a lifestyle that is differentiated from the rest of the population; therefore, they would not be affected by public policies based on actions aimed at reducing body fat percentage.40
Therefore, following the WHO recommendations, it is advisable to use BMI to define obesity at the population level, associating it, whenever possible, with WC to identify the prevalence of abdominal obesity. At the individual level, in addition to these measurements, it is crucial to employ methods to determine body composition, for example, measuring skinfolds, bioimpedance, and others.
With respect to what are here referred to as "unconventional anthropometric indicators," it is worth noting that, although based on different foundations, WHtR, C index, WHR, and ABSI are intended to identify the accumulation of visceral fat and its association with cardiometabolic risks. Even though all of these indicators are significantly associated with adverse outcomes, their use does not add additional advantages to the use of WC when the objective is to define the risks related to excess fat in the abdominal region. Accordingly, WC is more appropriate than all of these parameters due to its methodological simplicity and predictive efficiency, as revealed by Ferreira et al (2022).40
In this context, NC, APMT, and HHI are farther from the scope of this finding, since their objectives do not coincide with those related to WC, WHtR, C index, WHR, and ABSI, which are geared toward identifying fat accumulation in the central region of the body.
NC is an indicator of subcutaneous fat, the excess of which increases the risk of diseases and is not influenced by factors that alter abdominal volume.
APMT is used to identify muscle depletion and is comparable to other anthropometric predictors in identifying the risk of malnutrition in hospitalized patients and healthy elderly individuals. Despite the need for further studies to provide a more solid basis regarding their advantages and limitations, the results available to date suggest that both indicators are promising for their specific purposes.
HHI, in turn, was developed as a resource to identify individuals who suffered from malnutrition during the first years of life. With a robust theoretical foundation, this indicator stands out as a promising tool for further studies related to the developmental origins of health and disease. Although short stature is widely used as a marker of malnutrition in early life, its limitation lies in the fact that not all short stature results from nutritional causes. In this sense, HHI is considered a more accurate indicator for this assessment.4
Conclusions
Anthropometric indicators, whether conventional or not, are valuable tools for monitoring risk factors for NCDs, both at the clinical (individual) level and in epidemiological (population) contexts.3,76 Each indicator has distinct characteristics in terms of basis, purpose, operational complexity, and diagnostic validity, with specific advantages and limitations.77
Therefore, it is essential for professionals and public health policy managers to understand these nuances in order to select the indicators that are most appropriate for their objectives.
-
Sources of Funding
There were no external funding sources for this study.
-
Study Association
This study is not associated with any thesis or dissertation work.
-
Ethics Approval and Consent to Participate
This article does not contain any studies with human participants or animals performed by any of the authors.
-
Use of Artificial Intelligence
The authors did not use any artificial intelligence tools in the development of this work.
Availability of Research Data
The underlying content of the research text is contained within the manuscript.
References
- 1 World Health Organization. Noncommunicable Diseases Progress Monitor 2020. Geneva: World Health Organization; 2020.
-
2 Cavalcante AL, Ferreira HS. Accuracy of the Simplified Version of the Global Risk Score in Detecting Cardiovascular Risk in Women from Quilombola Communities in the State of Alagoas, Brazil. Int J Cardiovasc Sci. 2021;34(4):358-68. doi: 10.36660/ijcs.20210068.
» https://doi.org/10.36660/ijcs.20210068 - 3 World Health Organization. Global Action Plan for the Prevention and Control of Noncommunicable Diseases 2013-2020. Geneva: World Health Organization; 2013.
-
4 Ferreira HDS, Xavier AFS Jr, Assunção ML, Uchôa TCC, Lira-Neto AB, Nakano RP. Developmental Origins of Health and Disease: A New Approach for the Identification of Adults Who Suffered Undernutrition in Early Life. Diabetes Metab Syndr Obes. 2018;11:543-51. doi: 10.2147/DMSO.S177486.
» https://doi.org/10.2147/DMSO.S177486 -
5 Hsieh SD, Yoshinaga H. Waist/Height Ratio as a Simple and Useful Predictor of Coronary Heart Disease Risk Factors in Women. Intern Med. 1995;34(12):1147-52. doi: 10.2169/internalmedicine.34.1147.
» https://doi.org/10.2169/internalmedicine.34.1147 -
6 Valdez R. A Simple Model-Based Index of Abdominal Adiposity. J Clin Epidemiol. 1991;44(9):955-6. doi: 10.1016/0895-4356(91)90059-i.
» https://doi.org/10.1016/0895-4356(91)90059-i - 7 Vague J. Sexual Differentiation; Factor Determining Forms of Obesity. Presse Med. 1947;55(30):339.
-
8 Krakauer NY, Krakauer JC. A New Body Shape Index Predicts Mortality Hazard Independently of Body Mass Index. PLoS One. 2012;7(7):e39504. doi: 10.1371/journal.pone.0039504.
» https://doi.org/10.1371/journal.pone.0039504 -
9 Ben-Noun L, Sohar E, Laor A. Neck Circumference as a Simple Screening Measure for Identifying Overweight and Obese Patients. Obes Res. 2001;9(8):470-7. doi: 10.1038/oby.2001.61.
» https://doi.org/10.1038/oby.2001.61 -
10 Edwards RH, Young A, Hosking GP, Jones DA. Human Skeletal Muscle Function: Description of Tests and Normal Values. Clin Sci Mol Med. 1977;52(3):283-90. doi: 10.1042/cs0520283.
» https://doi.org/10.1042/cs0520283 -
11 Feng X, Zhu J, Hua Z, Yao S, Tong H. Comparison of Obesity Indicators for Predicting Cardiovascular Risk Factors and Multimorbidity Among the Chinese Population Based on ROC Analysis. Sci Rep. 2024;14(1):20942. doi: 10.1038/s41598-024-71914-1.
» https://doi.org/10.1038/s41598-024-71914-1 -
12 Popkin BM, Richards MK, Montiero CA. Stunting is Associated with Overweight in Children of Four Nations that are Undergoing the Nutrition Transition. J Nutr. 1996;126(12):3009-16. doi: 10.1093/jn/126.12.3009.
» https://doi.org/10.1093/jn/126.12.3009 -
13 Florêncio TT, Ferreira HS, Cavalcante JC, Stux GR, Sawaya AL. Short Stature, Abdominal Obesity, Insulin Resistance and Alterations in Lipid Profile in Very Low-Income Women Living in Maceió, North-Eastern Brazil. Eur J Cardiovasc Prev Rehabil. 2007;14(2):346-8. doi: 10.1097/hjr.0b013e328010f24d.
» https://doi.org/10.1097/hjr.0b013e328010f24d -
14 Barker M, Robinson S, Osmond C, Barker DJ. Birth Weight and Body Fat Distribution in Adolescent Girls. Arch Dis Child. 1997;77(5):381-3. doi: 10.1136/adc.77.5.381.
» https://doi.org/10.1136/adc.77.5.381 -
15 Drake AJ, Walker BR. The Intergenerational Effects of Fetal Programming: Non-Genomic Mechanisms for the Inheritance of Low Birth Weight and Cardiovascular Risk. J Endocrinol. 2004;180(1):1-16. doi: 10.1677/joe.0.1800001.
» https://doi.org/10.1677/joe.0.1800001 -
16 Ghajar LD, DeBoer MD. Environmental and Birth Characteristics as Predictors of Short Stature in Early Childhood. Acta Paediatr. 2019;108(5):954-60. doi: 10.1111/apa.14617.
» https://doi.org/10.1111/apa.14617 -
17 Ferreira HS, Florêncio TMTM, Fragoso MAC, Melo FP, Silva TG. Hypertension, Abdominal Obesity and Short Stature: Aspects of Nutritional Transition Within a Shantytown in the City of Maceió (Northeastern Brazil). Revista de Nutrição. 2005;18(2):209-18. doi: 10.1590/S1415-52732005000200005.
» https://doi.org/10.1590/S1415-52732005000200005 -
18 Sichieri R, Barbosa FS, Moura EC. Relationship between Short Stature and Obesity in Brazil: A Multilevel Analysis. Br J Nutr. 2010;103(10):1534-8. doi: 10.1017/S0007114509993448.
» https://doi.org/10.1017/S0007114509993448 -
19 Hermanussen M, Wit JM. How Much Nutrition for How Much Growth? Horm Res Paediatr. 2017;88(1):38-45. doi: 10.1159/000454832.
» https://doi.org/10.1159/000454832 -
20 Gray S, Akol HA, Sundal M. Mixed-Longitudinal Growth of Breastfeeding Children in Moroto District, Uganda (Karamoja Subregion). A Loss of Biological Resiliency? Am J Hum Biol. 2008;20(5):499-509. doi: 10.1002/ajhb.20786.
» https://doi.org/10.1002/ajhb.20786 -
21 Mortimer JA, Snowdon DA, Markesbery WR. Small Head Circumference is Associated with Less Education in Persons at Risk for Alzheimer Disease in Later Life. Alzheimer Dis Assoc Disord. 2008;22(3):249-54. doi: 10.1097/WAD.0b013e318170d455.
» https://doi.org/10.1097/WAD.0b013e318170d455 -
22 Mukherjee N, Kang C, Wolfe HM, Hertzberg BS, Smith JK, Lin W, et al. Discordance of Prenatal and Neonatal Brain Development in Twins. Early Hum Dev. 2009;85(3):171-5. doi: 10.1016/j.earlhumdev.2008.07.008.
» https://doi.org/10.1016/j.earlhumdev.2008.07.008 -
23 Rivkin MJ, Davis PE, Lemaster JL, Cabral HJ, Warfield SK, Mulkern RV, et al. Volumetric MRI Study of Brain in Children with Intrauterine Exposure to Cocaine, Alcohol, Tobacco, and Marijuana. Pediatrics. 2008;121(4):741-50. doi: 10.1542/peds.2007-1399.
» https://doi.org/10.1542/peds.2007-1399 -
24 Hayakawa M, Okumura A, Hayakawa F, Kato Y, Ohshiro M, Tauchi N, et al. Nutritional State and Growth and Functional Maturation of the Brain in Extremely Low Birth Weight Infants. Pediatrics. 2003;111(5 Pt 1):991-5. doi: 10.1542/peds.111.5.991.
» https://doi.org/10.1542/peds.111.5.991 -
25 Arends NJ, Boonstra VH, Hokken-Koelega AC. Head Circumference and Body Proportions Before and during Growth Hormone Treatment in Short Children Who were Born Small for Gestational Age. Pediatrics. 2004;114(3):683-90. doi: 10.1542/peds.2003-0152-L.
» https://doi.org/10.1542/peds.2003-0152-L -
26 Ferreira Hda S, Xavier AF Jr, Assunção ML, Santos EA, Horta BL. Effect of Breastfeeding on Head Circumference of Children from Impoverished Communities. Breastfeed Med. 2013;8(3):294-301. doi: 10.1089/bfm.2012.0105.
» https://doi.org/10.1089/bfm.2012.0105 -
27 Wadhwa PD, Buss C, Entringer S, Swanson JM. Developmental Origins of Health and Disease: Brief History of the Approach and Current Focus on Epigenetic Mechanisms. Semin Reprod Med. 2009;27(5):358-68. doi: 10.1055/s-0029-1237424.
» https://doi.org/10.1055/s-0029-1237424 -
28 Uauy R, Kain J, Corvalan C. How can the Developmental Origins of Health and Disease (DOHaD) Hypothesis Contribute to Improving Health in Developing Countries? Am J Clin Nutr. 2011;94(6 Suppl):1759S-1764S. doi: 10.3945/ajcn.110.000562.
» https://doi.org/10.3945/ajcn.110.000562 -
29 Hoffman DJ. Growth Retardation and Metabolic Programming: Implications and Consequences for Adult Health and Disease Risk. J Pediatr. 2014;90(4):325-8. doi: 10.1016/j.jped.2014.04.005.
» https://doi.org/10.1016/j.jped.2014.04.005 -
30 Suzuki K. The Developing World of DOHaD. J Dev Orig Health Dis. 2018;9(3):266-9. doi: 10.1017/S2040174417000691.
» https://doi.org/10.1017/S2040174417000691 - 31 Hsieh SD, Yoshinaga H. Abdominal Fat Distribution and Coronary Heart Disease Risk Factors in Men-Waist/Height Ratio as a Simple and Useful Predictor. Int J Obes Relat Metab Disord. 1995;19(8):585-9.
-
32 Ashwell M, Hsieh SD. Six Reasons Why the Waist-to-Height Ratio is a Rapid and Effective Global Indicator for Health Risks of Obesity and How its use Could Simplify the International Public Health Message on Obesity. Int J Food Sci Nutr. 2005;56(5):303-7. doi: 10.1080/09637480500195066.
» https://doi.org/10.1080/09637480500195066 - 33 National Institute for Health and Care Excellence. Obesity: Identification, Assessment and Management. London: National Institute for Health and Care Excellence; 2023.
- 34 World Health Organization. Waist Circumference and Waist-Hip Ratio. Report of a WHO Expert Consultation Geneva: World Health Organization; 2008.
-
35 Caminha TC, Ferreira HS, Costa NS, Nakano RP, Carvalho RE, Xavier AF Jr, et al. Waist-to-Height Ratio is the Best Anthropometric Predictor of Hypertension: A Population-Based Study with Women from a State of Northeast of Brazil. Medicine. 2017;96(2):e5874. doi: 10.1097/MD.0000000000005874.
» https://doi.org/10.1097/MD.0000000000005874 -
36 Dezfouli RA, Khonsari NM, Hosseinpour A, Asadi S, Ejtahed HS, Qorbani M. Waist to Height Ratio as a Simple Tool for Predicting Mortality: A Systematic Review and Meta-Analysis. Int J Obes. 2023;47(12):1286-301. doi: 10.1038/s41366-023-01388-0.
» https://doi.org/10.1038/s41366-023-01388-0 -
37 Ashwell M, Gunn P, Gibson S. Waist-to-Height Ratio is a Better Screening Tool than Waist Circumference and BMI for Adult Cardiometabolic Risk Factors: Systematic Review and Meta-Analysis. Obes Rev. 2012;13(3):275-86. doi: 10.1111/j.1467-789X.2011.00952.x.
» https://doi.org/10.1111/j.1467-789X.2011.00952.x -
38 Jayawardana R, Ranasinghe P, Sheriff MH, Matthews DR, Katulanda P. Waist to Height Ratio: A Better Anthropometric Marker of Diabetes and Cardio-Metabolic Risks in South Asian Adults. Diabetes Res Clin Pract. 2013;99(3):292-9. doi: 10.1016/j.diabres.2012.12.013.
» https://doi.org/10.1016/j.diabres.2012.12.013 -
39 Lo K, Wong M, Khalechelvam P, Tam W. Waist-to-Height Ratio, Body Mass Index and Waist Circumference for Screening Paediatric Cardio-Metabolic Risk Factors: A Meta-Analysis. Obes Rev. 2016;17(12):1258-75. doi: 10.1111/obr.12456.
» https://doi.org/10.1111/obr.12456 -
40 Ferreira HS, Soares ML, Krakauer NY, Santos EA, Krakauer JC, Uchôa TC, et al. What is the Best Anthropometric Predictor for Identifying Higher Risk for Cardiovascular Diseases in Afro-Descendant Brazilian Women? A Cross-Sectional Population-Based Study. Am J Hum Biol. 2022;34(3):e23652. doi: 10.1002/ajhb.23652.
» https://doi.org/10.1002/ajhb.23652 -
41 Després JP. Abdominal Obesity and Cardiovascular Disease: Is Inflammation the Missing Link? Can J Cardiol. 2012;28(6):642-52. doi: 10.1016/j.cjca.2012.06.004.
» https://doi.org/10.1016/j.cjca.2012.06.004 -
42 Koenen M, Hill MA, Cohen P, Sowers JR. Obesity, Adipose Tissue and Vascular Dysfunction. Circ Res. 2021;128(7):951-68. doi: 10.1161/CIRCRESAHA.121.318093.
» https://doi.org/10.1161/CIRCRESAHA.121.318093 -
43 Tchernof A, Després JP. Pathophysiology of Human Visceral Obesity: An Update. Physiol Rev. 2013;93(1):359-404. doi: 10.1152/physrev.00033.2011.
» https://doi.org/10.1152/physrev.00033.2011 -
44 Cordeiro AC, Qureshi AR, Stenvinkel P, Heimbürger O, Axelsson J, Bárány P, et al. Abdominal Fat Deposition is Associated with Increased Inflammation, Protein-Energy Wasting and Worse Outcome in Patients Undergoing Haemodialysis. Nephrol Dial Transplant. 2010;25(2):562-8. doi: 10.1093/ndt/gfp492.
» https://doi.org/10.1093/ndt/gfp492 -
45 Prado CB, Martins CA, Cremonini ACP, Ferreira JRS, Cattafesta M, Almeida-de-Souza J, et al. Cut Points of the Conicity Index and Associated Factors in Brazilian Rural Workers. Nutrients. 2022;14(21):4487. doi: 10.3390/nu14214487.
» https://doi.org/10.3390/nu14214487 -
46 Martins CA, Prado CB, Ferreira JRS, Cattafesta M, Santos ET Neto, Haraguchi FK, et al. Conicity Index as an Indicator of Abdominal Obesity in Individuals with Chronic Kidney Disease on Hemodialysis. PLoS One. 2023;18(4):e0284059. doi: 10.1371/journal.pone.0284059.
» https://doi.org/10.1371/journal.pone.0284059 -
47 Nagayama D, Fujishiro K, Watanabe Y, Yamaguchi T, Suzuki K, Saiki A, et al. A Body Shape Index (ABSI) as a Variant of Conicity Index Not Affected by the Obesity Paradox: A Cross-Sectional Study Using Arterial Stiffness Parameter. J Pers Med. 2022;12(12):2014. doi: 10.3390/jpm12122014.
» https://doi.org/10.3390/jpm12122014 -
48 Motamed N, Perumal D, Zamani F, Ashrafi H, Haghjoo M, Saeedian FS, et al. Conicity Index and Waist-to-Hip Ratio are Superior Obesity Indices in Predicting 10-Year Cardiovascular Risk Among Men and Women. Clin Cardiol. 2015;38(9):527-34. doi: 10.1002/clc.22437.
» https://doi.org/10.1002/clc.22437 -
49 Qin X, Chen C, Wang J, Cai A, Feng X, Jiang X, et al. Association of Adiposity Indices with Cardiometabolic Multimorbidity Among 101,973 Chinese Adults: A Cross-Sectional Study. BMC Cardiovasc Disord. 2023;23(1):514. doi: 10.1186/s12872-023-03543-x.
» https://doi.org/10.1186/s12872-023-03543-x -
50 Loureiro NSL, Amaral TLM, Amaral CA, Monteiro GTR, Vasconcellos MTL, Bortolini MJS. Relationship between Anthropometric Indicators and Risk Factors for Cardiovascular Disease in Adults and Older Adults of Rio Branco, Acre. Rev Saude Publica. 2020;54:24. doi: 10.11606/s1518-8787.2020054001088.
» https://doi.org/10.11606/s1518-8787.2020054001088 -
51 Vague J. Sexual Differentiation. A Determinant Factor of the Forms of Obesity. 1947. Obes Res. 1996;4(2):201-3. doi: 10.1002/j.1550-8528.1996.tb00535.x.
» https://doi.org/10.1002/j.1550-8528.1996.tb00535.x -
52 Snijder MB, van Dam RM, Visser M, Seidell JC. What Aspects of Body Fat are Particularly Hazardous and How do we Measure Them? Int J Epidemiol. 2006;35(1):83-92. doi: 10.1093/ije/dyi253.
» https://doi.org/10.1093/ije/dyi253 -
53 Vasques ACJ, Priore SE, Rosado LEFPL, Franceschini SCC. The Use of Anthropometric Measures to Assess Visceral Fat Accumulation. Rev Nutr. 2010;23(1):107-18. doi: 10.1590/S1415-52732010000100012.
» https://doi.org/10.1590/S1415-52732010000100012 -
54 Pouliot MC, Després JP, Lemieux S, Moorjani S, Bouchard C, Tremblay A, et al. Waist Circumference and Abdominal Sagittal Diameter: Best Simple Anthropometric Indexes of Abdominal Visceral Adipose Tissue Accumulation and Related Cardiovascular Risk in Men and Women. Am J Cardiol. 1994;73(7):460-8. doi: 10.1016/0002-9149(94)90676-9.
» https://doi.org/10.1016/0002-9149(94)90676-9 -
55 Gayon J. History of the Concept of Allometry. American Zoologist. 2000;40(5):748-58. doi: 10.1093/icb/40.5.748.
» https://doi.org/10.1093/icb/40.5.748 -
56 Krakauer JC, Krakauer NY. Combining Body Mass and Shape Indices in Clinical Practice. Case Rep Med. 2016;2016:1526175. doi: 10.1155/2016/1526175.
» https://doi.org/10.1155/2016/1526175 -
57 Anand D, Puri S. Anthropometric and Nutritional Profile of People Living with HIV and AIDS in India: An Assessment. Indian J Community Med. 2014;39(3):161-8. doi: 10.4103/0970-0218.137153.
» https://doi.org/10.4103/0970-0218.137153 -
58 Silva AAGO, Araújo LF, Diniz MFHS, Lotufo PA, Bensenor IM, Barreto SM, et al. Neck Circumference and 10-Year Cardiovascular Risk at the Baseline of the ELSA-Brasil Study: Difference by Sex. Arq Bras Cardiol. 2020;115(5):840-8. doi: 10.36660/abc.20190289.
» https://doi.org/10.36660/abc.20190289 -
59 Torriani M, Gill CM, Daley S, Oliveira AL, Azevedo DC, Bredella MA. Compartmental Neck Fat Accumulation and Its Relation to Cardiovascular Risk and Metabolic Syndrome. Am J Clin Nutr. 2014;100(5):1244-51. doi: 10.3945/ajcn.114.088450.
» https://doi.org/10.3945/ajcn.114.088450 -
60 Liang J, Teng F, Liu X, Zou C, Wang Y, Dou L, et al. Synergistic Effects of Neck Circumference and Metabolic Risk Factors on Insulin Resistance: The Cardiometabolic Risk in Chinese (CRC) Study. Diabetol Metab Syndr. 2014;6(1):116. doi: 10.1186/1758-5996-6-116.
» https://doi.org/10.1186/1758-5996-6-116 - 61 Oliveira NA, Figueiredo SM, Guimarães NS. A Medida da Neck Circumference pode ser usada como Indicador de Adiposidade Corporal? Revisão Sistemática. Rev Bras Obes Nutr Emagrec. 2019;13(77):157-65.
-
62 Carvalho WRC, França AKTDC, Santos AMD, Padilha LL, Bogea EG. Appropriate Neck Circumference and Waist-to-Height Ratio Cut-Off Points as Predictors of Obesity and Cardiovascular Risk in Adolescents. Rev Saude Publica. 2023;57:24. doi: 10.11606/s1518-8787.2023057004349.
» https://doi.org/10.11606/s1518-8787.2023057004349 -
63 Perlin CM, Groto AD, Dalposso GH, Dal Canton LE, Salamanca MAB, Lehmann KR. Neck Circumference as a Predictive Marker for MetabolicSyndrome and Cardiovascular Risk. R Saúde Públ Paraná. 2022;5(3):1-16. doi: 10.32811/25954482-2022v5n3.633.
» https://doi.org/10.32811/25954482-2022v5n3.633 -
64 Raimi TH, Dele-Ojo BF, Dada SA, Ajayi DD. Neck Circumference Cut-Off for Obesity and Metabolic Syndrome in Nigeria. Ethn Dis. 2021;31(4):501-8. doi: 10.18865/ed.31.4.501.
» https://doi.org/10.18865/ed.31.4.501 -
65 Lin S, Hu L, Li P, Li X, Lin K, Zhu B, et al. Utility of Neck Circumference for Identifying Metabolic Syndrome by Different Definitions in Chinese Subjects Over 50 Years Old: A Community-Based Study. J Diabetes Res. 2018;2018:3708939. doi: 10.1155/2018/3708939.
» https://doi.org/10.1155/2018/3708939 -
66 Vague J. The Degree of Masculine Differentiation of Obesities: A Factor Determining Predisposition to Diabetes, Atherosclerosis, Gout, and Uric Calculous Disease. Am J Clin Nutr. 1956;4(1):20-34. doi: 10.1093/ajcn/4.1.20.
» https://doi.org/10.1093/ajcn/4.1.20 -
67 Lameu EB, Gerude MF, Campos AC, Luiz RR. The Thickness of the Adductor Pollicis Muscle Reflects the Muscle Compartment and May be Used as a New Anthropometric Parameter for Nutritional Assessment. Curr Opin Clin Nutr Metab Care. 2004;7(3):293-301. doi: 10.1097/00075197-200405000-00009.
» https://doi.org/10.1097/00075197-200405000-00009 -
68 Gonzalez MC, Duarte RR, Budziareck MB. Adductor Pollicis Muscle: Reference Values of Its Thickness in a Healthy Population. Clin Nutr. 2010;29(2):268-71. doi: 10.1016/j.clnu.2009.08.012.
» https://doi.org/10.1016/j.clnu.2009.08.012 -
69 Bragagnolo R, Caporossi FS, Dock-Nascimento DB, Aguilar-Nascimento JE. Adductor Pollicis Muscle Thickness: A Fast and Reliable Method for Nutritional Assessment in Surgical Patients. Rev Col Bras Cir. 2009;36(5):371-6. doi: 10.1590/s0100-69912009000500003.
» https://doi.org/10.1590/s0100-69912009000500003 - 70 Bezerra LTC. Exploração e Comparação de Métodos para Avaliação de Risco Nutricional em Pacientes com Insuficiência Cardíaca Crônica [Dissertation]. São Paulo: Universidade Federal de São Paulo; 2022.
- 71 Souza EAB. Relação entre a Adductor Pollicis Muscle Thickness e a Capacidade Funcional em Idosos [Dissertation]. Recife: Universidade Federal de Pernambuco; 2022.
-
72 Aguiar APN, Araripe TSO, Cordeiro MD, Ricarte JRO, Cabral NSG, Silva LS, et al. Adductor Pollicis Muscle Thickness: A Sensitive Method in the Detection of Nutritional Risk in Onco-Hematological Patients. Nutr Clín Diet Hosp. 2018;38(4):183-8. doi: 10.12873/384nogueira-aguiar.
» https://doi.org/10.12873/384nogueira-aguiar -
73 Phillips SK, Woledge RC, Bruce SA, Young A, Levy D, Yeo A, et al. A Study of Force and Cross-Sectional Area of Adductor Pollicis Muscle in Female Hip Fracture Patients. J Am Geriatr Soc. 1998;46(8):999-1002. doi: 10.1111/j.1532-5415.1998.tb02756.x.
» https://doi.org/10.1111/j.1532-5415.1998.tb02756.x -
74 Marmot M. The Health Gap: The Challenge of an Unequal World: The Argument. Int J Epidemiol. 2017;46(4):1312-1318. doi: 10.1093/ije/dyx163.
» https://doi.org/10.1093/ije/dyx163 - 75 Instituto Brasileiro de Geografia e Estatística. Condições de Saúde e Fatores de Risco e Proteção para Doenças Crônicas Não Transmissíveis em Adultos. Pesquisa Nacional de Saúde (PNS) 2019. Rio de Janeiro: Instituto Brasileiro De Geografia E Estatística; 2020.
- 76 Obesity: Preventing and Managing the Global Epidemic. Report of a WHO Consultation. World Health Organ Tech Rep Ser. 2000;894:i-xii, 1-253.
-
77 Piqueras P, Ballester A, Durá-Gil JV, Martinez-Hervas S, Redón J, Real JT. Anthropometric Indicators as a Tool for Diagnosis of Obesity and Other Health Risk Factors: A Literature Review. Front Psychol. 2021;12:631179. doi: 10.3389/fpsyg.2021.631179.
» https://doi.org/10.3389/fpsyg.2021.631179
Edited by
-
Editor responsible for the review:
Glaucia Maria Moraes de Oliveira