 Hybrid 2D/3D-QSAR Study of Methylamine Derivatives as Dopamine Transporter Inhibitors
Abstract
Compounds that inhibit the dopamine transporter (DAT) protein hold significant therapeutic potential for the treatment of various neurological disorders, including Parkinson’s disease and substance use disorders. In this context, an extensive quantitative structure-activity relationship (QSAR) study was conducted using 36 methylamine derivatives. Three modeling approaches were applied: a 2D-QSAR model based on classical descriptors, a 3D-QSAR model using molecular interaction field (MIF) descriptors, and a hybrid model combining the most relevant 2D and 3D descriptors. All models underwent the same statistical validation procedures. Although each model demonstrated high quality, the hybrid approach proved slightly superior. Furthermore, both the 2D-QSAR and MIF descriptors were found to correlate with the mechanism of DAT inhibition. These findings highlight that integrating complementary molecular information encoded in descriptors of different physicochemical origins can improve the predictive accuracy and robustness of QSAR models. The final model has the potential to serve as a tool to guide the synthesis and virtual screening of novel DAT inhibitors. It shows promising statistical performance and may assist preliminary virtual screening efforts.
Keywords:
DAT; Parkinson disease; 2D-QSAR; 3D-QSAR; mixed QSAR models
Introduction
Dopamine is an essential neurotransmitter of the catecholamine family. The central nervous system (CNS) plays a key role in motor and reward (pleasure and well-being) systems, influencing hormonal, cognitive, and vascular functions through its interaction with dopamine receptors.1 Another key player is the membrane transport protein dopamine transporter (DAT).2 Dopaminergic homeostasis mediated by the DAT occurs through the reuptake of dopamine from the synaptic cleft back into presynaptic neurons.3 Once reabsorbed, dopamine is stored in synaptic vesicles for reuse in subsequent neurotransmission or catabolic processes.4-6
Blocking the DAT has therapeutic potential for the treatment of various neurological disorders, including Parkinson’s disease, schizophrenia, attention-deficit/hyperactivity disorder (ADHD), and substance use disorders. By inhibiting dopamine reuptake, these blockers help increase the concentration of dopamine in the synaptic cleft. In recent years, significant progress has been made in research on CNS diseases, leading to the development of several drugs that act as DAT blockers,7 as benztropine (Parkinson’s disease), bupropion (depression and smoking cessation), and modafinil (narcolepsy).8-12
Nonetheless, there is a need to develop new therapeutic agents to treat dopaminergic disorders. In this context, computer-aided drug design (CADD) approaches have contributed positively to the planning and development of new therapeutic agents.13,14 Previously, our group conducted a quantitative structure-activity relationship (QSAR) study on DAT inhibitors using descriptors derived from the 2D structure of a dataset composed of 36 methylamine derivatives.15 To complement and further explore this dataset, this study presents the results obtained using descriptors derived from three-dimensionally optimized structures (via quantum mechanical methods, specifically density functional theory (DFT)) for the development of a new 2D-QSAR model, as well as molecular interaction field (MIF) descriptors for a 3D-QSAR model. Lastly, the best 2D and 3D models were combined and refined to generate a hybrid QSAR model.16-18
Methodology
Data set preparation
The dataset included 36 methylamine derivatives synthesized and identified as DAT inhibitors by Shao et al.19 (Table 1). Biological activity corresponded to the concentration required to inhibit dopamine reuptake by 50% (IC50). The IC50 values ranged from 1 to 6043 nM and were converted into the negative logarithmic scale (-log IC50, or pIC50), yielding values between 5.219 and 9.000, with a range of 3,781 units.
Three-dimensional structures of the compounds were generated in HyperChem 7.20 Geometry optimization first applied molecular mechanics (MM+), followed by the semi-empirical Austin Model 1 (AM1) method within the same software. Subsequent optimization was carried out in Gaussian 0921 at the HF/6-31G(d) level, followed by refinement at the DFT/6-311G++(d,p) level with the Becke, three-parameter, Lee-Yang-Parr (B3LYP) functional. Gaussian 09 also provided electronic properties for use in the 2D-QSAR study, and the optimized geometries served as the basis for calculating additional descriptors for the 3D-QSAR stage. Charges from electrostatic potentials using a grid-based method (CHELPG)-type electrostatic potential (ESP) charges were calculated, as these are more suitable for generating MIF descriptors.
QSAR-2D molecular descriptors
A total of 4,855 molecular descriptors, encompassing constitutional, topological, geometric, molecular, and mixed categories, were calculated. The optimized 3D structures served as input data in Dragon 6 software.22 Descriptors showing constant or near-constant values, standard deviations below 0.001, or at least one missing value were excluded from the dataset. After this reduction step, electronic descriptors were incorporated into the matrix. An additional variable reduction stage was performed in QSAR modeling software,23 where descriptors with absolute correlation values below 0.2 relative to the biological activity vector were discarded, on the assumption that such descriptors did not provide sufficient information to support the development of reliable QSAR models.
QSAR-3D molecular descriptors
MIF descriptors came from optimized geometries. A version of the LQTA-QSAR program24 placed the probe (NH3+) over a grid (19 × 14 × 12 Å3, with 1 Å spacing) containing the molecular geometry. The program computed electrostatic (Coulomb potential) and steric (Lennard-Jones potential) 3D properties at each grid point. The probe followed the ff43a1 force field to simulate atoms or molecular fragments. As in the 2D-QSAR stage, descriptors with absolute correlation values below 0.2 relative to the biological activity vector were excluded from the analysis.
Variable selection and regression
Descriptor selection applied the ordered predictors selection (OPS) method,24 available in QSAR modeling software,23 which ranks descriptors according to their relevance using an informative vector. The algorithm applies partial least squares (PLS) regression. This efficient linear regression method effectively handles large sets of correlated variables, thereby improving the interpretation of relationships between independent and dependent variables.25 This approach guided the construction of the final models.
During selection, the root mean square error of cross-validation (RMSECV) served as the initial informative vector to identify descriptors that produced models with lower errors. In subsequent cycles, the leave-one-out cross-validation coefficient of determination (Q2LOO) was used to identify subsets of descriptors with better internal validation metrics.26 To construct and evaluate hybrid models, the procedure merged descriptor matrices from the best 2D- and 3D-QSAR models into a single matrix. Autoscaled regression vectors were then used to reduce the number of descriptors, retaining only the most relevant variables for constructing the latent variable. The analysis assessed the importance of the selected descriptors using autoscaled regression vector values from QSAR modeling.23 To enhance the interpretation, variable influence on projection (VIP) scores were calculated in the Chemoface.27 These scores, obtained from regression models based on projection methods, can be used for variable selection or to evaluate the importance of descriptors in the final model.28 When VIP > 1, they are considered highly significant for a model; VIPs between 0.8 and 1 are of moderate importance, and VIP < 0.8 correspond to descriptors of low importance.27
Internal validation
Internal validation used statistical parameters described in the literature.29-32 The coefficient of determination (R2) and its associated error (root mean square error of calibration, RMSEC) quantified the model fit and its ability to explain variability in the observed biological activity values. The analysis accepted models with an R2 value greater than 0.6. The F-ratio (Fp,n-p-1) assessed the statistical significance of the regression, where p represents the number of latent variables (LVs) in the PLS model and n the number of compounds in the model. The test compared the ratio of model-explained variance to residual variance with the tabulated value at the 95% confidence level (α = 0.05).29-32
The internal predictive ability of the models was assessed using Q2LOO and its associated error, RMSECV. The cutoff criterion required Q2LOO > 0.5, ensuring the model predicted at least 50% of the variability in the observed activity values.30 The “RmSquare” cross-validation metrics (Average_rm2(LOO)-scaled > 0.5 and ∆rm2(LOO)-scaled < 0.2) further assessed internal predictive quality.30 The analysis evaluated potential overfitting by examining the difference between R2 and Q2LOO, with an ideal threshold of less than 0.1.29
Two additional tests complemented the internal quality assessment. y-Randomization with 40 random permutations of the response variable was used to evaluate the presence of spurious correlations between molecular descriptors and biological activity. Leave-N-out (LNO) cross-validation31 tested model robustness, using N = 12 (ca. 33% of the training set) with six replicates for each “N” value.
Finally, outlier detection employed plots of studentized residuals (d) versus leverage values (h). The analysis applied thresholds of d = ± 2.5 and leverage calculated as h* = 3 × (p/n).22,30 Except for internal RmSquare metrics, QSAR modeling software23 executed all validation tests.
The equations for the parameters used for internal validation are provided in Table S1 (Supplementary Information (SI) section).
External validation
The external validation parameters were calculated using the Xternal Validation Metric Calculator 1.0.33 The analysis first measured predictive quality using the external validation coefficient of determination (R2pred) and the root mean square error of prediction (RMSEP), setting a cutoff of R2pred > 0.5. Since these parameters alone do not guarantee reliable predictions,34 the analysis applied additional “RmSquare” external validation metrics (Average_rm2(pred)-scaled > 0.5 and ∆rm2(pred) scaled < 0.2). These modified r2 metrics (rm2) quantify the real differences between observed and predicted test set values.30
The analysis also considered Golbraikh-Tropsha statistics as external quality indicators. The model met acceptance criteria when the slopes of linear regressions between predicted vs. observed (k) and observed vs. predicted (k’) values ranged from 0.85 to 1.15, and when the absolute difference between the coefficients of determination of regressions through the origin (|R20 - R’20|) remained below 0.3.34-37
Considering the limitation noted by Roy et al.38 for QSAR validation with small datasets, the analysis performed 100 randomization processes on the set of 36 molecules. These processes generated 100 models and 100 distinct training/test sets (ntraining = 30; ntest = 6). The study calculated external validation parameters for each test set and reported the results as the mean and standard deviation for each statistical metric. The equations for the parameters used for external validation are provided in Table S2 (SI section).
Overfit assessment
Two complementary methods were used to evaluate the risk of overfitting in the best model obtained in this study. The progressive scrambling test (PRST)39 is based on perturbing the y with Gaussian noise of zero mean and variance proportional to the experimental standard deviation. The model is then rebuilt and the predictive concordance correlation coefficient (CCC) is recalculated. If the model is robust, a gradual degradation of predictive performance is observed as the noise level increases; stable models typically tolerate up to 40% noise, whereas overfitted models collapse even under small perturbations. In addition, structural stability was assessed using bootstrap resampling.40 In this approach, the training set is repeatedly resampled with replacement to generate multiple replicates, and the model is recalibrated for each one. Regression coefficients and VIP scores are recorded across replicates. Mean values below 0.30 indicate high model stability, values between 0.30 and 0.60 indicate intermediate stability, and values above 0.60 indicate low stability. The coefficient of variation (VIP_CV) of these distributions quantifies the sensitivity of the model to small sampling fluctuations, enabling the identification of unstable descriptors or excessive dependence on the original training sample.
Results and Discussion
After completing the variable selection step using the OPS method, model 1 (equation 1) and model 2 (equation 2) were obtained. Model 1 consists of 8 molecular descriptors, which generate four LVs that together account for 72.82% of the variance in the dataset (LV1: 27.48%; LV2: 11.23%; LV3: 21.16%; LV4: 12.95%). Model 2 includes 13 MIF descriptors, which also yield four LVs, explaining 61.05% of the variance (LV1: 22.74%; LV2: 18.90%; LV3: 13.76%; LV4: 6.10%). For the hybrid model (equation 3), only 41.54% of the total variance, captured in two LVs (LV1: 23.45%; LV2: 18.09%) derived from the combination of six descriptors from model 1 and nine from model 2, sufficient to improve the internal predictive statistics of the model. Internal validation results are presented first, while external validation metrics are reported separately to avoid conflating them with true predictive performance, as recommended by QSAR best practices.
Internal statistics: R2 = 0.947; RMSEC = 0.276; F = 139.512; Q2LOO = 0.902; RMSECV = 0.350; R2 - Q2LOO = 0.0450; Average_r2m(LOO)-scaled = 0.862; Δr2m(LOO)-scaled = 0.0510
Internal statistics: R2 = 0.955; RMSEC = 0.254; F = 166.264; Q2LOO = 0.919; RMSECV = 0.317; R2 - Q2LOO = 0.0360; Average_r2m(LOO)-scaled = 0.887; Δr2m(LOO)-scaled = 0.0240
Internal statistics: R2 = 0.953; RMSEC = 0.253; F = 334.428; Q2LOO = 0.920; RMSECV = 0.316; R2 - Q2LOO = 0.033; Average_r2m(LOO)-scaled = 0.887; Δr2m(LOO)-scaled = 0.044
It is noteworthy that, although several descriptors contributed to model construction, the regressions themselves used only the LVs generated from these descriptors, one of the main objectives of PLS regression: reducing the dimensionality of the data.23,25 The actual and predicted values from internal validation are available in Table 3S (SI section), and values of the selected descriptors are provided in Tables 4S and 5S (SI section).
Average values and standard deviations (SD) of external validation for models 1, 2 and 3 for 100 randomizations of test sets
The Williams plots used to evaluate the presence of outliers are provided in Figure S1 (SI section). Model 1 shows 88.89% of the samples within the applicability domain defined by the limits of studentized residuals and leverage (h = 0.340), with two molecules exhibiting |σ| ≈ 2.5 and two others presenting h > h*, although very close to the threshold and with low |σ| values. Model 2 shows 94.44% of the samples within the applicability domain (h* = 0.340), containing one predictive outlier (σ ≈ +3) and one structurally influential sample (h ≈ 0.550). Model 3 shows 91.67% of the samples within the applicability domain (h* = 0.170), with one molecule presenting σ ≈ +3 and two with leverage values above h*, one of which is practically at the limit. Considering the overall quality of the models, these points were not regarded as problematic; moreover, their removal would reduce structural representativeness and chemical space, which is why they were retained in the respective models.
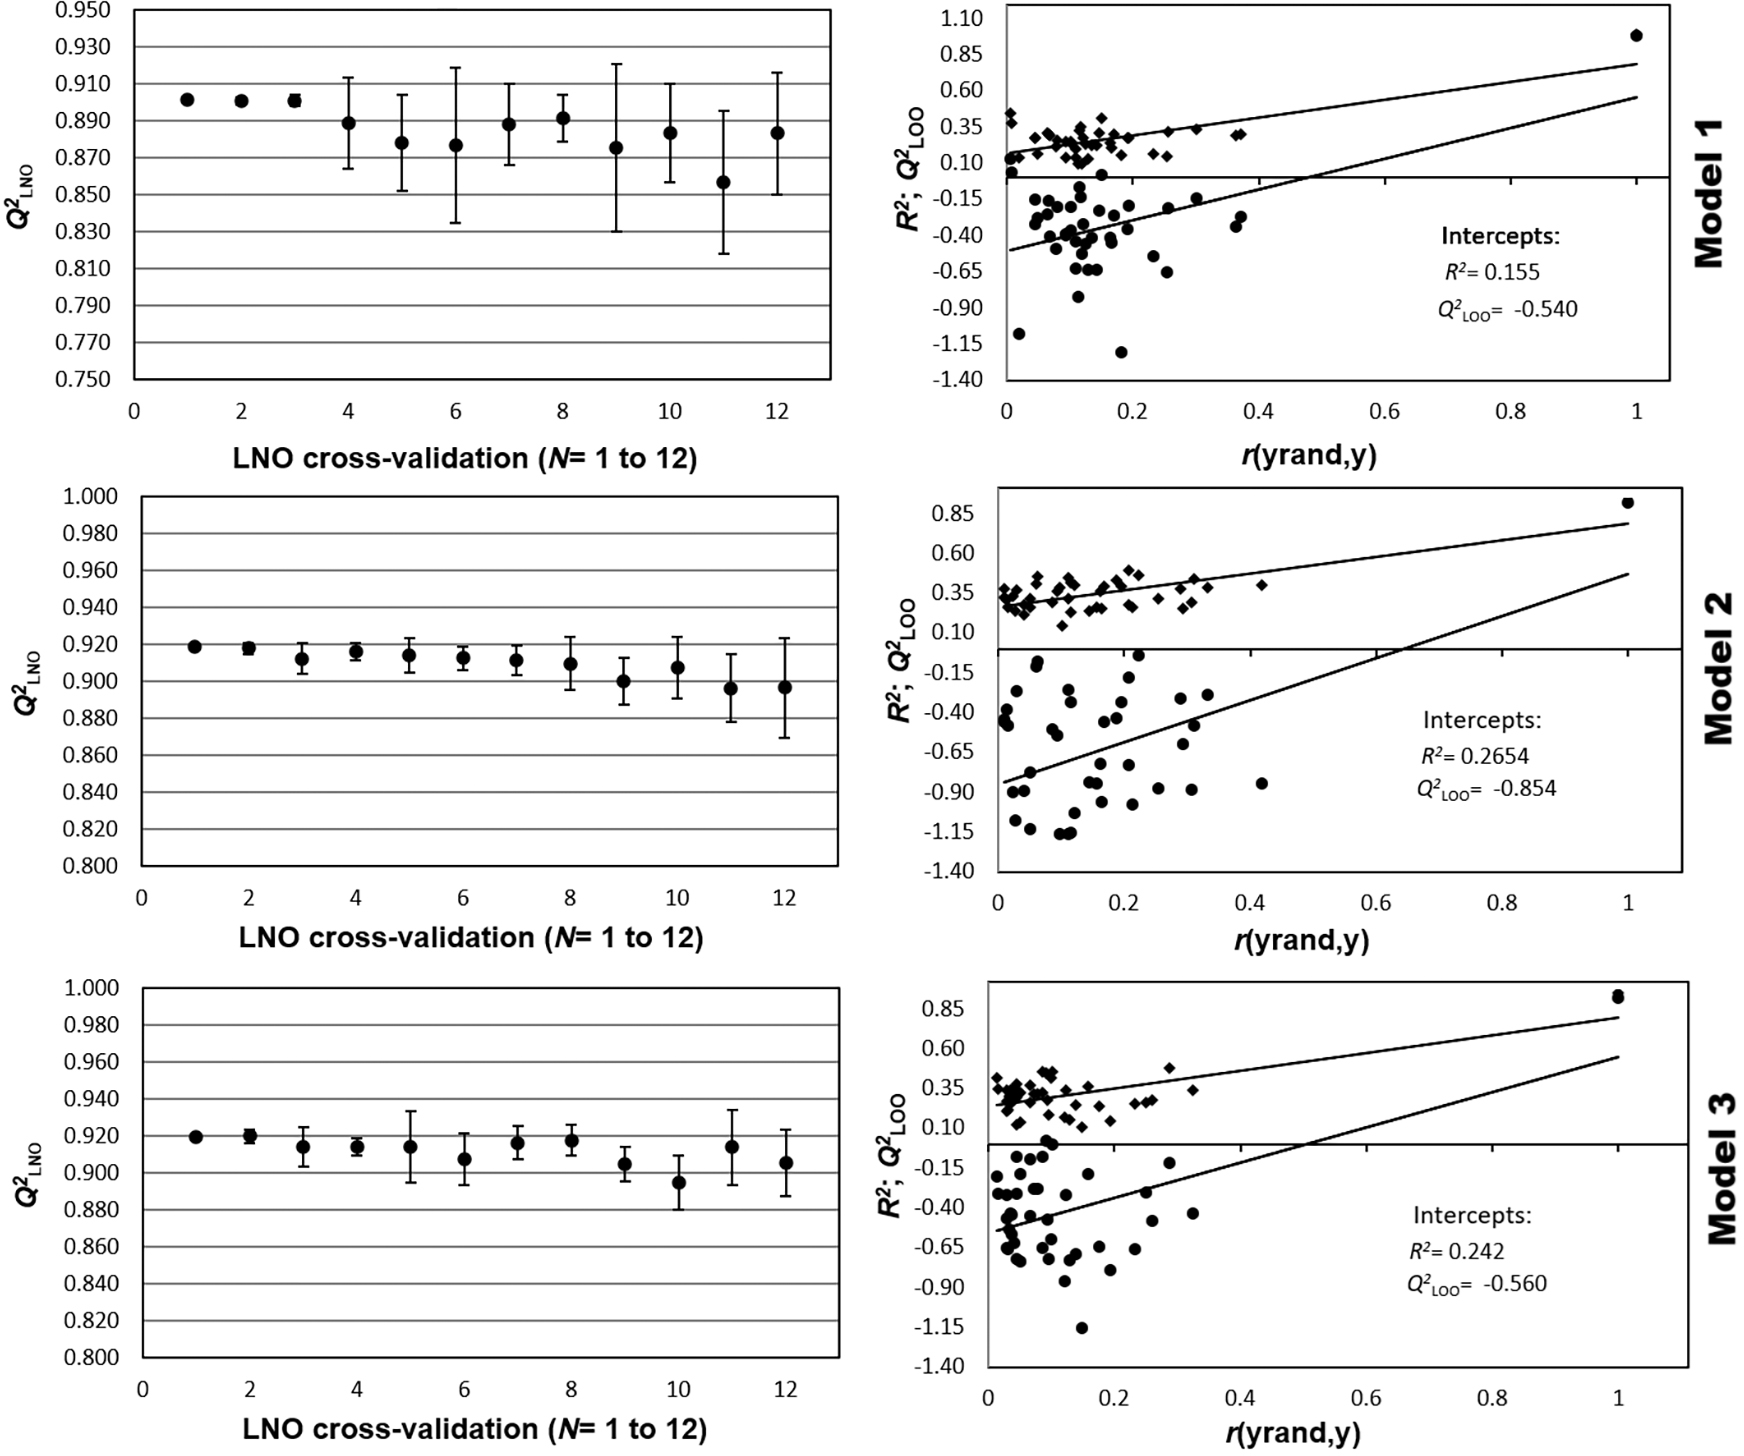
Considering the internal statistical quality of the models, each explained approximately 95% of the variance and predicted around 91% of the biological activity. Data overfitting, measured by the differences between R2 and Q2LOO, remained negligible in all cases (0.0450 for model 1, 0.0370 for model 2, and 0.0330 for model 3). This finding reinforces the rationale for using LVs for regression, as they inherently reduce the risk of overfitting. The F-test results (α = 0.05) substantially exceeded the critical values in all models. Furthermore, leave-N-out cross-validation and y-randomization tests (Figure 1) confirmed the robustness and absence of chance correlations of the models, respectively.
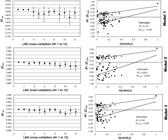
Results of the LNO cross-validation (N = 1 to 12) and y-randomization test (intercept R2 < 0.3; intercept Q2LOO < 0.05) for models 1 to 3.
The results indicate that model 2 is of slightly better quality than model 1. In terms of internal validation, both models perform similarly. However, the F-test results show that model 2 is more statistically significant than model 1, since both share the same critical value (cF = 2.680) because they were built with the same number of LVs, allowing a direct comparison.32
For model 3, the F-value and its critical value (cF = 3.280) are higher than those of the other models because only two LVs were required to achieve the best internal quality. Nevertheless, model 3 achieved internal statistical quality comparable to model 2, explaining only 41.54% of the variance. This finding suggests that less significant descriptors were removed during the combination and refinement of the hybrid model, resulting in a more reliable model.
Given the approval of the models in the selected tests for internal validation, the next step was to conduct external validation tests. Table 2 presents the mean values of R2pred and the corresponding standard deviations of the external validation parameters for each of the 100 test sets generated by the 100 models. These results show that, although the difference with model 2 is slight, model 3 demonstrates superior predictive ability compared to model 1. This difference becomes more apparent when comparing R2pred values (0.910 and 0.863, respectively).
All metrics adopted in this study remained within recommended limits, even considering the number of test sets evaluated, which increased the likelihood of selecting sets that could yield poor results. Standard deviations remained adequate relative to the numerical scale of each parameter. Minimal variation was observed between the internal validation values and the averages of the corresponding parameters, indicating that each of the 100 models (models 1 and 2) closely resembled the original models. Consequently, both models are suitable for prediction.
A comparison highlights the superior quality of models 1-3 relative to a previously published model (R2 = 0.842; RMSEC = 0.443; Q2LOO = 0.761; RMSECV = 0.546; R2pred = 0.997; RMSEP = 0.120)18 that used only molecular descriptors derived from the 2D structures. It is interesting to note that, despite a higher R2pred of 0.086 units, the internal quality of model 3 proved considerably superior. Thus, in terms of overall quality, the hybrid model presented in this study can also be considered superior to the previously published model for the same dataset.18 Despite using descriptors based solely on 2D structures, which simplify the model and avoid structural optimization calculations, the improved performance of models 1-3 suggests that DAT inhibition depends on geometric features not captured by simplified molecular input line entry system (SMILES) derived descriptors.
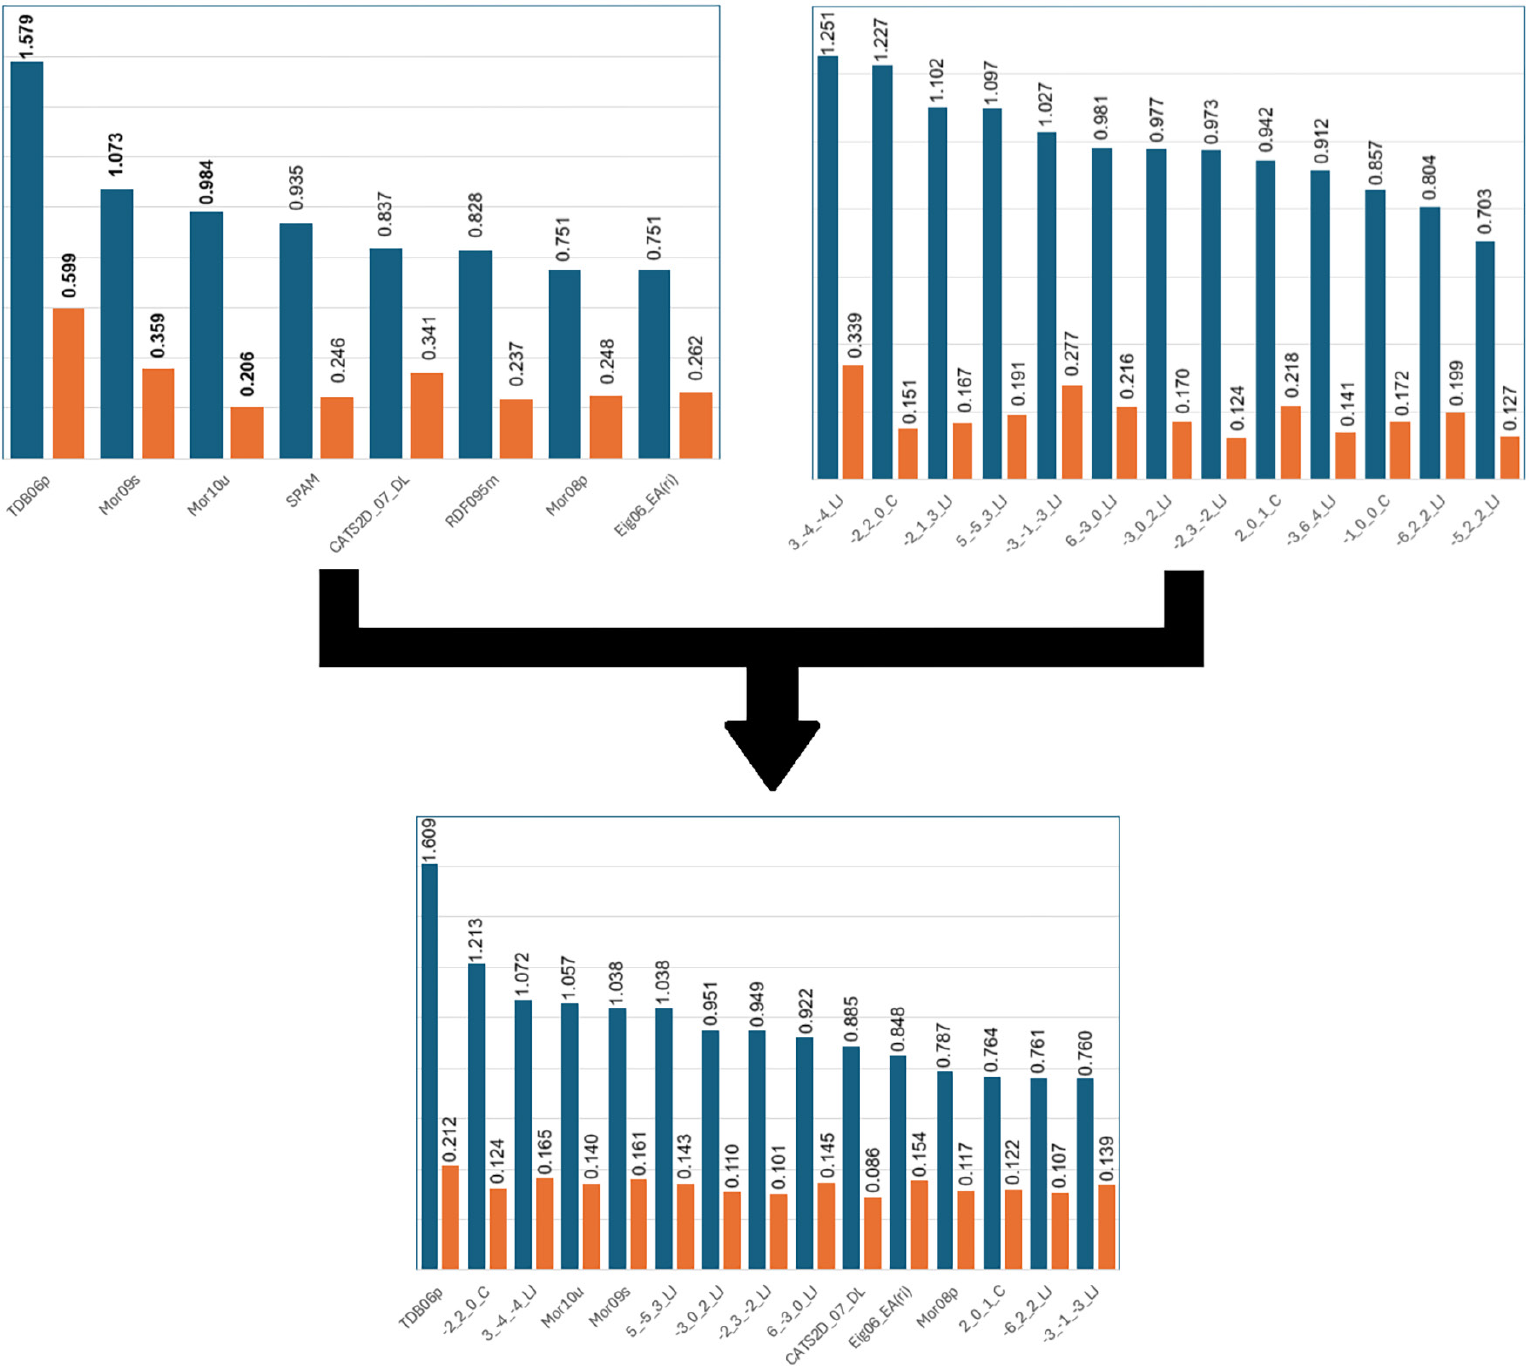
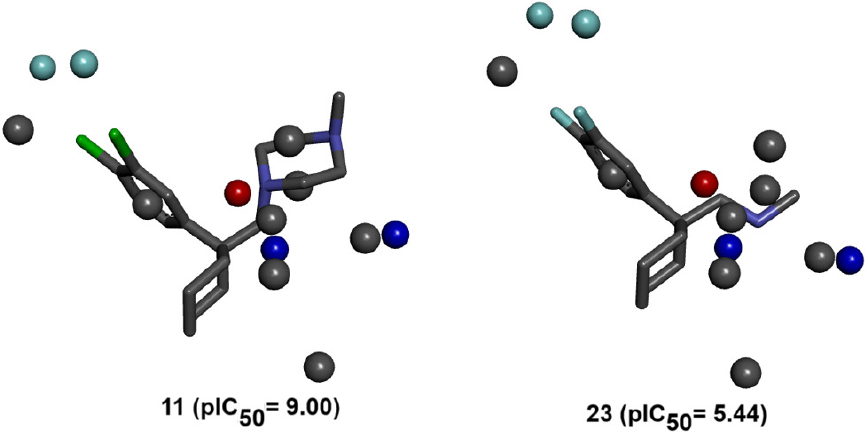
Table 3 lists the descriptors selected for model 1 (2D-QSAR) along with their corresponding autoscaled regression vector values. Figure 2 presents the analysis of VIP scores and the absolute values of the autoscaled regression vectors for all three models. Figure 3 illustrates the MIF descriptors of model 2, corresponding to points in cartesian space (x, y, z) displayed around two dataset compounds: one highly active and the other weakly active.
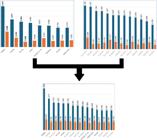
Comparison between the VIP values (blue bars) and the absolute values of the autoscaled coefficients (orange bars) of the selected descriptors for models 1 and 2, and for hybrid model 3.
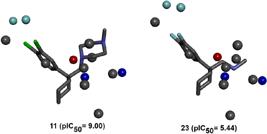
MIF descriptors from model 2, positioned in the Cartesian space of a representative of the most active compounds (11) and one of the least active (23). Gray spheres: Lennard-Jones positive descriptors; light blue spheres: Lennard-Jones negative descriptors; blue spheres: Coulomb positive descriptors; red sphere: Coulomb negative descriptor.
In model 1, six of the eight selected descriptors that generated the four LVs originated from DFT-optimized structures. Only two descriptors (CATS2D_07_AL and Eig06_EA(ri)) were based on atomic composition and molecular connectivity. The most significant descriptors with the highest VIP values were TDB06p, Mor09s, and Mor10u. These geometric descriptors promote activity. Furthermore, the first two exhibited the highest regression vector values.
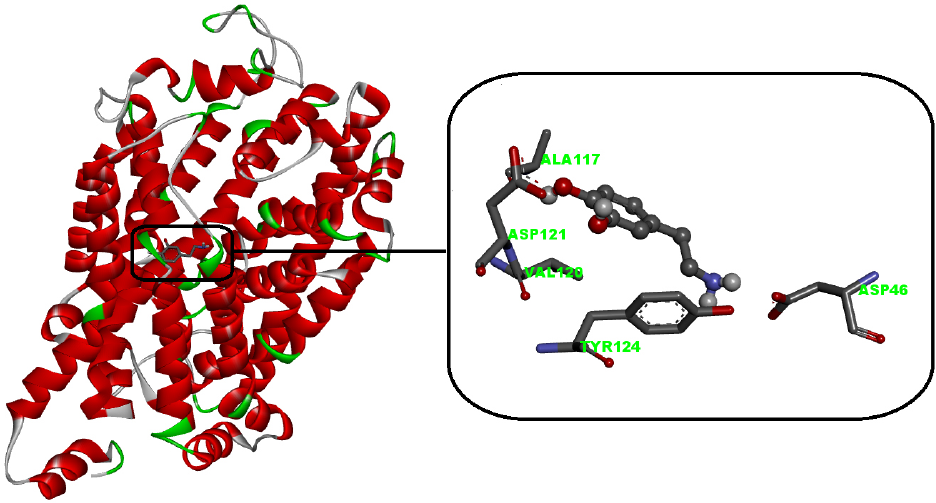
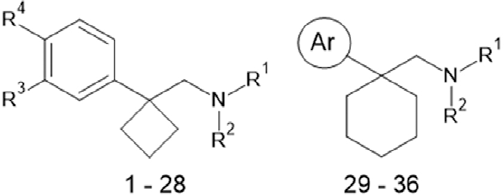
An important observation in model 2 (Figure 3) is that most selected descriptors cluster around the area corresponding to the R1 and R2 substituents, the main site of structural variability within the dataset. Conversely, the opposite end, where all compounds contain substituted aromatic groups (the area with the least structural variability), exhibits fewer nearby descriptors. However, the descriptors 3_-4_-4_LJ and -2_2_0_C, the most important of this model, belong to this low-variability site, indicating that the R3 and R4 substituents are relevant and, based on their properties, influence in the potency. This region corresponds to the phenyl-3,4-diol ring of dopamine, which occupies the bottom of the pocket, an area containing polar residues capable of forming hydrogen bonds (Ala117 and Asp121) and hydrophobic residues that interact with the aromatic ring (Val120 and Tyr124)41 (Figure 4). Thus, there appears to exist some correspondence between this property of dopamine and the corresponding structural region of the derivatives in the dataset.
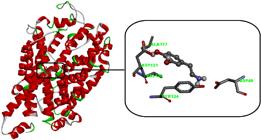
Transmembrane domain of the DAT from Drosophila melanogaster (PDB 4XP1),41 showing the position of the dopamine binding site and the most relevant residues of the cavity. The codes for the most pertinent waste materials for the link are shown in green.
Because both models demonstrated adequate internal and external statistical quality, determining which was more suitable for external prediction proved difficult. Model interpretability offered an additional advantage for model 2, as MIF descriptors generally allow more straightforward interpretation than descriptors commonly used in 2D-QSAR. However, generating MIFs is more complex, as it requires properly optimized string representation, which is an essential aspect according to Organisation for Economic Co-operation and Development (OECD) guidelines for QSA(P)R model validation, lacking this feature does not prevent a model from being used if it demonstrates adequate predictive ability,42 since the main objective of a QSAR model is its predictive performance and applicability to appropriate compounds.
To further explore the chemical space represented by the obtained descriptors, we constructed a hybrid 2D 3D QSAR model. Several authors43-45 recommend this approach on the premise that, when available, different categories of molecular descriptors complement one another. Refinement of the regression vectors of PLS models revealed that only 15 descriptors (six from 2D-QSAR and nine from MIFs) were sufficient to generate two relevant LVs. Using PLS, this approach combined the strengths of models 1 and 2, improving internal validation performance while minimizing noise.
As illustrated in Figure 3, the most significant descriptors in each original model generally maintained their importance in model 3. The descriptor ranking in the hybrid model exhibited minimal variation compared to models 1 and 2. The only descriptor showing a notable shift was -3_-1_-3_LJ, which ranked lowest in model 2 but rose to the fifth most relevant in model 3, displaying the second highest autoscaled regression vector. Among the removed descriptors, SPAM and RDF06u exhibited the smallest regression vectors in model 1, while most removed descriptors in model 2 corresponded to those with the lowest VIP values. However, these trends are not absolute; for example, Mor10u had the lowest regression vector in model 1, and -2_1_3_LJ was removed in model 2 despite ranking third among the most significant descriptors. R2 = 0.953; RMSEC = 0.253; F = 334.428; Q2LOO = 0.920.
Considering the internal statistical quality of the hybrid model (R2 = 0.953 and Q2LOO = 0.920), the hypothesis was raised that, despite the small difference between these parameters (R2-Q2LOO), the model could still be exhibiting data overfitting. This could, among other reasons, be due to the small sample size in the dataset, despite the apparent consistency of the internal and external validations. Therefore, additional mathematical tests reported in the literature were sought to evaluate this risk. The PRST approach showed that the model maintained stable performance even after substantial perturbations in y. The CCC decreased from 0.959 (0% noise) to 0.860 (40% noise), corresponding to a total drop of only 0.0999 and exhibiting a smooth and monotonic trajectory (Figure 5a), which is typical of models that capture real chemical signals rather than sample-specific fluctuations. In parallel, the bootstrap-based stability test evidenced high structural consistency of the model: the VIP_CV values were predominantly below 0.300, with a mean of 0.283 (Figure 5b), indicating that small resamplings do not significantly alter the relative importance of the descriptors or the orientation of the PLS model. Taken together, these two independent tests converge to the same conclusion: the model exhibits excellent robustness to noise and internal stability, with no evidence of relevant statistical overfitting.39,40
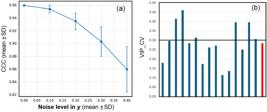
(a) Plot of the results obtained using the PRST approach. The bars represent the standard deviations; (b) bar plot showing the VIP_CV values of the descriptors of model 3 (presented in the same order used in the model). The black line represents the 0.3 threshold, and the red bar corresponds to the mean VIP_CV.
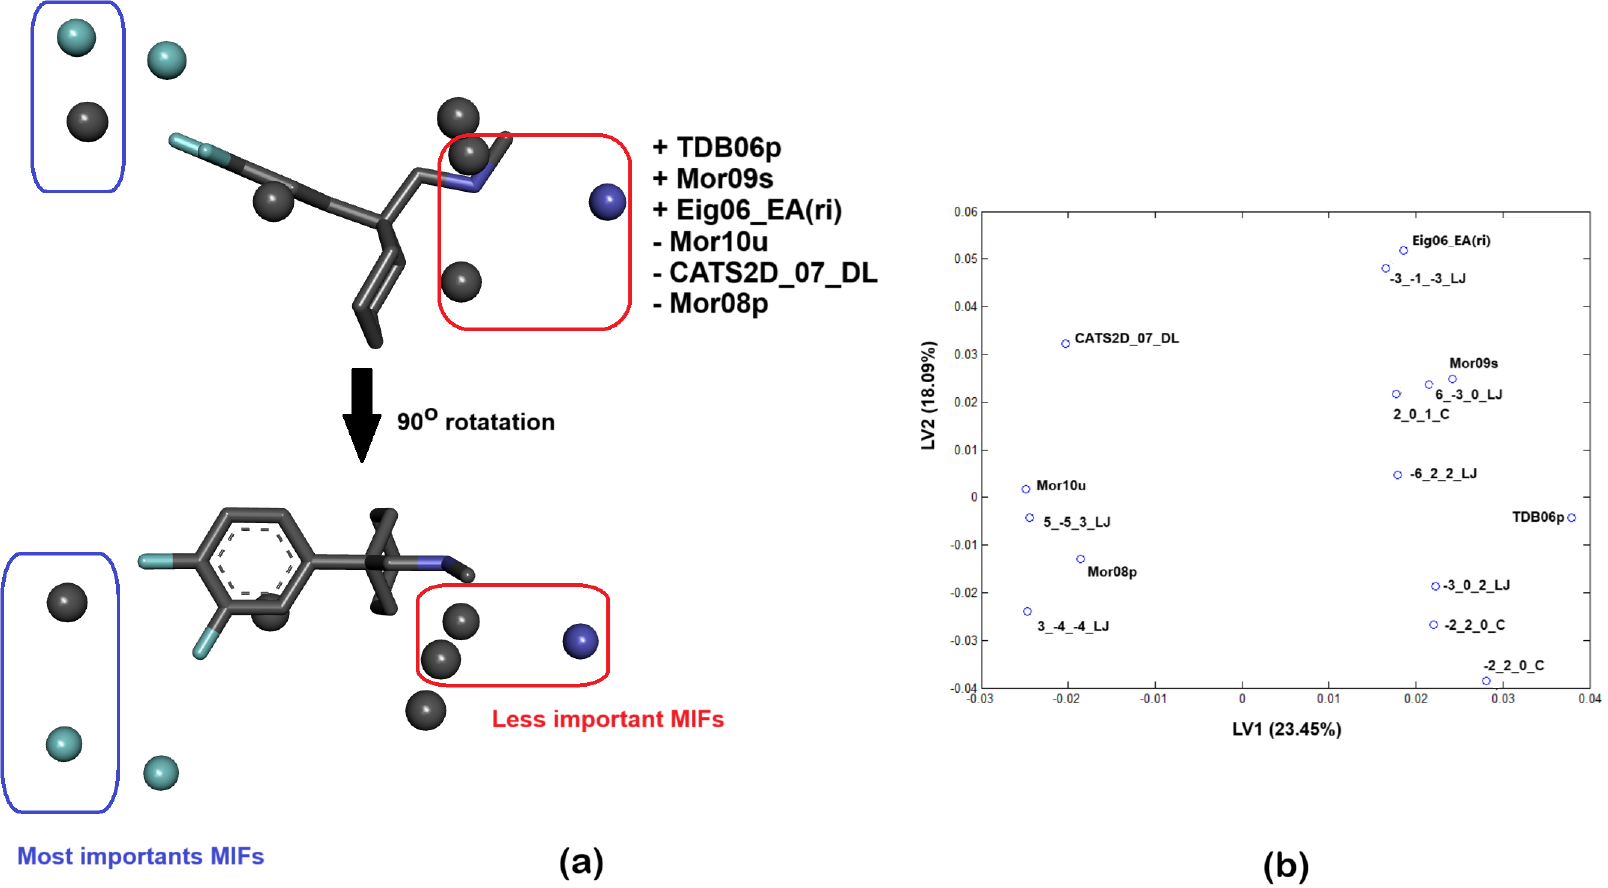
After statistical validation, we focused on providing a mechanistic interpretation of DAT inhibition. Since model 3 demonstrated the best external validation, we concentrated our analysis on this model. Figure 6 presents the MIF descriptors contributing to model 3 around the dataset compounds, alongside the PLS model loadings. The plot of PLS loadings and the contribution of each descriptor to each LV (Table 4) shows that MIF descriptors contributed more to LV1 (average 0.119 vs. -0.0320), while 2D-QSAR descriptors contributed more to LV2 (0.145 vs. 0.0320). Because LV1 captured 23.45% of the information and LV2 captured 18.09%, an important observation emerges: the MIF descriptors represent critical features for the model to describe the structure-activity relationships of the dataset. However, LV2 provides complementary information necessary to explain the inhibition.
Contribution of each descriptor in model 3 to each latent variable, with descriptors divided into two blocks to highlight average contribution values
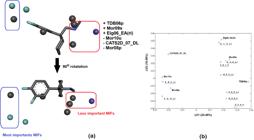
(a) Representation of the MIF and 2D descriptors in model 3, highlighting the most and least important MIF descriptors. Derivative 23 is shown in a side view (top) and a top view after a 90° rotation (bottom); (b) loading plots of the descriptors in model 3 on LV1 and LV2.
It is worth noting that the descriptor contributing most to LV1 also ranked as the most significant in the model and exhibited the highest VIP score: TDB06p, a 2D-QSAR descriptor. This descriptor accounts for polarizability and considers the topological distance (lag) over at least six interatomic bonds. Interestingly, the lags between the nitrogen in the main chain and the R1 and R2 substituents are 6 and 7, respectively, which mirrors the pattern observed in dopamine. Thus, this descriptor suggests that geometric and electronic complementarity may play a role in activity.46 A similar mechanistic interpretation applies to the other two 2D-QSAR descriptors that positively influence activity, Mor09s and Eig06_EA(ri), although the latter represents a topological feature. The negative contributions among 2D-QSAR descriptors arise from Mor10u, Mor08p, and CATS2D_07_DL. Despite other descriptors indicating significant contributions to LV1, these results suggest that molecular electronic features that promote hydrogen bonding and hydrophilicity favor higher potency in the derivatives.
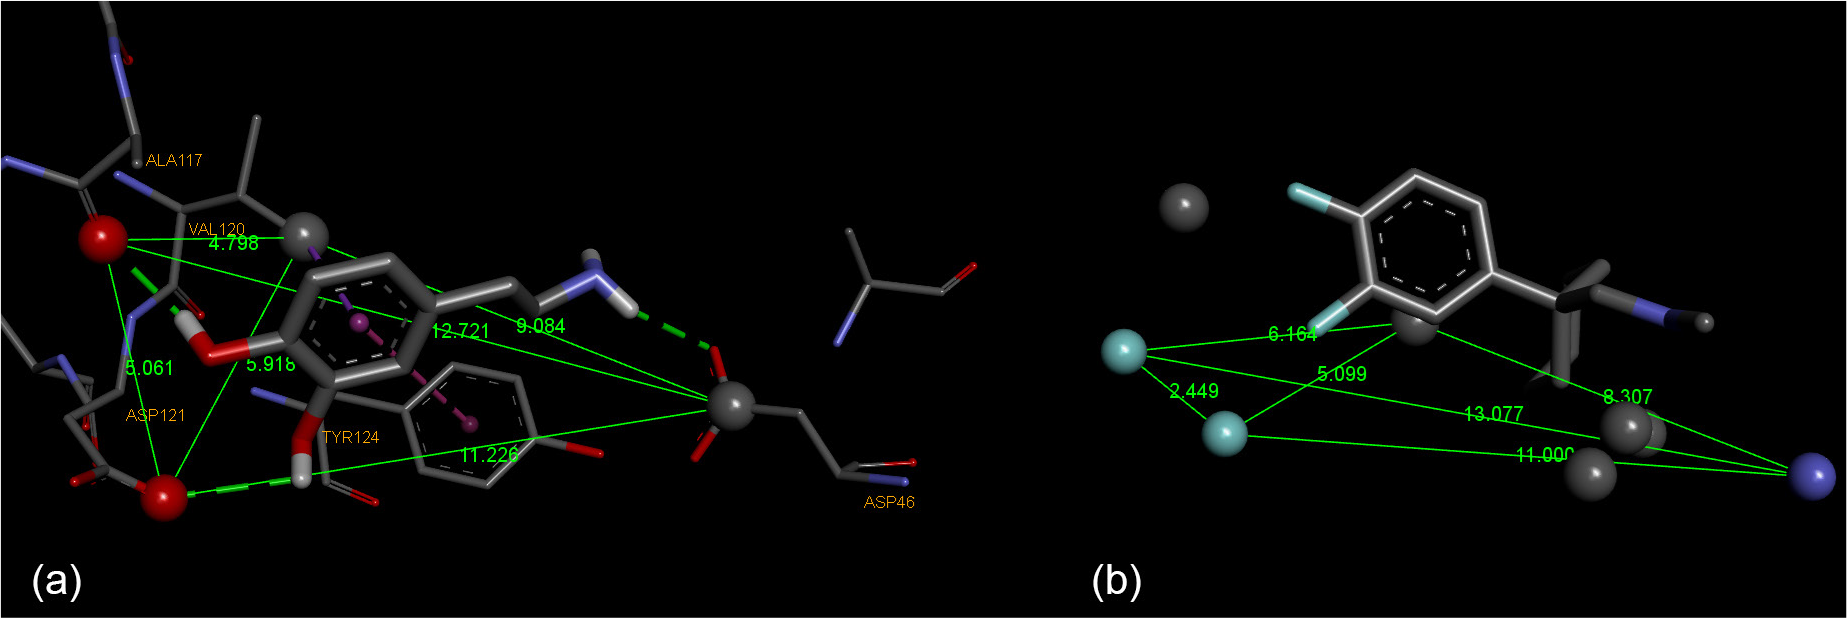
Despite the relevance of the 2D-QSAR descriptors, the highest average contribution in LV1, which captures the most information, comes from the MIF descriptors. Figure 7 compares the DAT binding site with dopamine and the spatial distribution of the MIF descriptors. These descriptors can be interpreted as occupying regions that qualitatively resemble areas associated with key residues (Asp46, Ala117, Val120, Asp121, and Tyr124). The negative Lennard-Jones descriptors, such as 3_-4_-4_LJ and 5_-5_3_LJ, appear to align with the polar regions of the cavity, which, according to structural studies, are associated with residues such as Ala117 and Asp121. The descriptor -6_2_2_C is positioned in a region analogous to the location of the acceptor group of Asp64. The descriptor 2_0_1_LJ, in turn, is located beneath the phenyl moiety, in a zone qualitatively comparable to where the methyl side chain of Val120 is found. Taken together, these descriptors form a spatial arrangement that resembles the distribution of residues in the binding pocket and preserves similar relative distances, providing a reasonable degree of qualitative correspondence. However, some discrepancies exist: for example, descriptors 5_-5_3_LJ and 3_-4_-4_LJ are 2.45 Å apart, whereas the distance. This finding establishes a possible correspondence between the descriptors and the cited residues, with the hydrogen-bond acceptor groups of Ala117 and Asp121, and the difference is approximately twice as large.

(a) DAT binding site complexed with dopamine (PDB 4XP1). A distance map displays residues associated with selected MIF descriptors (Asp64, Ala117, Val120, and Asp121), with distances (in Å) shown in green and residue labels in orange. Key residues are highlighted using CPK atom representations with standard Discovery Studio (version 24.1, Dessault Systèmes Biovia Corp, France) coloring (red: oxygen; grey: carbon). Green dashed lines indicate hydrogen bonds; lilac dashed line indicates a π-π interaction; purple dashed line indicates a π-alkyl interaction; (b) representation of the MIF descriptors from model 3 around compound 23, illustrating the correspondence between the spatial distribution of the hybrid model’s MIF descriptors and the arrangement of amino acid residues involved in dopamine binding.
Considering the results obtained, the hybrid model, the most reliable among those developed, indicates that new derivatives may exhibit increased potency by introducing bulkier, yet compact, substituents at R1 and R2, thereby maximizing the molecular contributions encoded by TDB06p and Mor09s. One possibility is to expand the variety and combinations of alkyl groups that fit these characteristics, which were not included in this dataset (such as propyl or isopropyl). These substitutions can be combined with extended aromatic structures at R3, such as 1- or 2-naphthyl or 4-biphenyl, to explore the regions defined by the Lennard Jones descriptors around the aromatic portion. Another possible set of modifications involves the introduction of polar substituents, such as -OH, at R3 and R4, thereby more closely mimicking the interaction pattern of dopamine’s catechol group and exploiting the structural information encoded in 3_ 4_ 4_LJ, 5_ 5_3_LJ, 6_2_2_LJ, and 2_0_1_LJ. This modification is also consistent with the observations reported by Wang et al.41 In theory, new derivatives incorporating these structural features would combine the favorable polarizability profile encoded at R1 and R2 with an extended π-surface and optimized hydrogen-bonding/π-π complementarity within the DAT binding site, potentially achieving activities comparable to or even higher than those of the most potent molecules in the dataset.
Conclusions
The comparison of the three developed models showed that, although all exhibited adequate internal and external statistical quality, the hybrid model outperformed the others in terms of predictive power and structural interpretability. The results indicate that, for DAT inhibition by methylamine derivatives, combining 2D and MIF descriptors allows the capture of complementary information from different molecular features relevant to activity, maximizing informative content while minimizing noise. Analysis of regression vectors and VIP values confirmed the robustness of the selected descriptors, as the most significant descriptors in the individual models retained their importance in the hybrid model. Analysis of MIF descriptors indicates that more active compounds tend to project substituents into regions where the model identifies favorable steric or electrostatic fields. Conversely, less active compounds often do not occupy these regions or introduce substituents into zones that are unfavorable according to the MIF. This interpretation offers hypotheses and spatial insights for possible synthetic and experimental validation. Although it may be limited by dataset size, the hybrid model is a potential tool for screening and optimizing new DAT inhibitors that warrant evaluation in future studies.
Supplementary Information
Supplementary material 1
Tables S1 to S5 and Figure S1 are provided as Supplementary Information. This material is available free of charge at http://jbcs.sbq.org.br as PDF file.
Acknowledgments
Fundacao Araucaria (FAPPR), PROAP/CAPES, CNPq, Pro Rectory of Research (PRPq) of Federal University of Minas Gerais (UFMG), and Cheminformatics (DTC) Laboratory.
Data Availability Statement
The data and materials supporting this study are available in the manuscript, in the Supplementary Information, or from the corresponding author upon request.
References
-
1 Shumay, E.; Chen, J.; Fowler, J. S.; Volkow, N. D.; PLoS One 2011, 6, e22754. [Crossref]
» Crossref -
2 Herborg, F.; Andreassen, T. F.; Berlin, F.; Loland, C. J.; Gether, U.; J. Biol. Chem. 2018, 293, 7250. [Crossref]
» Crossref -
3 Schmitt, K. C.; Rothman, R. B.; Reith, M. E. A.; J. Pharmacol. Exp. Ther. 2013, 346, 2. [Crossref]
» Crossref -
4 Vaughan, R. A.; Foster, J. D.; Trends Pharmacol. Sci. 2013, 34, 489. [Crossref]
» Crossref -
5 Olguín, H. J.; Guzmán, D. C.; García, E. H.; Mejía, G. B.; Oxid. Med. Cell. Longevity 2016, 2016, 9730467. [Crossref]
» Crossref -
6 Stahl, S. M.; CNS Spectrums 2018, 23, 187. [Crossref]
» Crossref -
7 Armstrong, M. J.; Okun, M. S.; JAMA 2020, 323, 548. [Crossref]
» Crossref -
8 Howes, O. D.; McCutcheon, R.; Owen, M. J.; Murray, R. M.; Biol. Psychiatry 2017, 81, 9. [Crossref]
» Crossref -
9 Franke, B.; Faraone, S. V.; Asherson, P.; Buitelaar, J.; Bau, C. H. D.; Ramos-Quiroga, J. A.; Mick, E.; Grevet, E. H.; Johansson, S.; Haavik, J.; Lesch, K.-P.; Cormand, B.; Reif, A.; Mol. Psychiatry 2012, 17, 960. [Crossref]
» Crossref -
10 Faraone, S. V.; Neurosci. Biobehav. Rev. 2018, 87, 255. [Crossref]
» Crossref -
11 Chen, R.; Ferris, M. J.; Wang, S.; Pharmacol. Ther. 2020, 213, 107583. [Crossref]
» Crossref -
12 Palermo, G.; Giannoni, S.; Bellini, G.; Siciliano, G.; Ceravolo, R.; Int. J. Mol. Sci. 2021, 22, 11234. [Crossref]
» Crossref -
13 Daina, A.; Blatter, M.-C.; Gerritsen, V. B.; Palagi, P. M.; Marek, D.; Xenarios, I.; Schwede, T.; Michielin, O.; Zoete, V.; J. Chem. Educ. 2017, 94, 335. [Crossref]
» Crossref -
14 Sofi, M. Y.; Shafi, A.; Masoodi, K. Z.; Bioinformatics for Everyone, 1st ed.; Academic Press: Cambridge, MA, USA, 2022, p. 215. [Crossref]
» Crossref -
15 de Oliveira, L. H. D.; Cruz, J. N.; dos Santos, C. B. R.; de Melo, E. B.; Mol. Diversity 2024, 28, 2931. [Crossref]
» Crossref -
16 Baig, M. H.; Ahmad, K.; Rabbani, G.; Danishuddin, M.; Choi, I.; Curr. Neuropharmacol. 2018, 16, 740. [Crossref]
» Crossref -
17 Peter, S. C.; Dhanjal, J. K.; Malik, V.; Radhakrishnan, N.; Jayakanthan, M.; Sundar, D. In Encyclopedia of Bioinformatics and Computational Biology, vol. 2; Elsevier: Amsterdam, Netherlands, 2019, p. 661. [Crossref]
» Crossref -
18 Salman, M. M.; Al-Obaidi, Z.; Kitchen, P.; Loreto, A.; Bill, R. M.; Wade-Martins, R.; Int. J. Mol. Sci. 2021, 22, 4688. [Crossref]
» Crossref -
19 Shao, L.; Hewitt, M. C.; Wang, F.; Malcolm, S. C.; Ma, J.; Campbell, J. E.; Campbell, U. C.; Engel, S. R.; Spicer, N. A.; Hardy, L. W.; Schreiber, R.; Spear, K. L.; Varney, M. A.; Bioorg. Med. Chem. Lett. 2011, 21, 1438. [Crossref]
» Crossref - 20 HyperChem, release 7.0; Hypercube, Inc., Gainesville, FL, USA, 2002.
- 21 Frisch, M. J.; Trucks, G. W.; Schlegel, H. B.; Scuseria, G. E.; Robb, M. A.; Cheeseman, J. R.; Scalmani, G.; Barone, V.; Petersson, G. A.; Nakatsuji, H.; Li, X.; Caricato, M.; Marenich, A.; Bloino, J.; Janesko, B. G.; Gomperts, R.; Mennucci, B.; Hratchian, H. P.; Ortiz, J. V.; Izmaylov, A. F.; Sonnenberg, J. L.; Williams-Young, D.; Ding, F.; Lipparini, F.; Egidi, F.; Goings, J.; Peng, B.; Petrone, A.; Henderson, T.; Ranasinghe, D.; Zakrzewski, V. G.; Gao, J.; Rega, N.; Zheng, G.; Liang, W.; Hada, M.; Ehara, M.; Toyota, K.; Fukuda, R.; Hasegawa, J.; Ishida, M.; Nakajima, T.; Honda, Y.; Kitao, O.; Nakai, H.; Vreven, T.; Throssell, K.; Montgomery Jr., J. A.; Peralta, J. E.; Ogliaro, F.; Bearpark, M.; Heyd, J. J.; Brothers, E.; Kudin, K. N.; Staroverov, V. N.; Keith, T.; Kobayashi, R.; Normand, J.; Raghavachari, K.; Rendell, A.; Burant, J. C.; Iyengar, S. S.; Tomasi, J.; Cossi, M.; Millam, J. M.; Klene, M.; Adamo, C.; Cammi, R.; Ochterski, J. W.; Martin, R. L.; Morokuma, K.; Farkas, O.; Foresman, J. B.; Fox, D. J.; Gaussian 09; Gaussian, Inc., Wallingford, CT, USA, 2013.
- 22 Dragon, version 6.0; Talete Srl, Milan, Italy, 2013.
-
23 Martins, J. P. A.; Ferreira, M. M. C.; Quim. Nova 2013, 36, 554. [Crossref]
» Crossref -
24 Martins, J. P. A.; de Oliveira, M. A. R.; de Queiroz, M. S. O.; J. Comput. Chem. 2018, 39, 917. [Crossref]
» Crossref -
25 Teófilo, R. F.; Martins, J. P. A.; Ferreira, M. M. C.; J. Chemom. 2008, 23, 32. [Crossref]
» Crossref -
26 Ferreira, M. M. C.; J. Braz. Chem. Soc. 2002, 13, 742. [Crossref]
» Crossref -
27 Nunes, C. A.; Freitas, M. P.; Pinheiro, A. C. M.; Bastos, S. C.; J. Braz. Chem. Soc. 2012, 23, 2003. [Crossref]
» Crossref -
28 Olah, M.; Bologa, C.; Oprea, T. I.; J. Comput.-Aided Mol. Des. 2004, 18, 437. [Crossref]
» Crossref -
29 Veerasamy, R.; Rajak, H.; Jain, A.; Sivadasan, S.; Varghese, C. P.; Agrawal, R. K.; Int. J. Drug Discovery 2011, 2, 511. [Crossref]
» Crossref - 30 Roy, K.; Kar, S.; Das, R. N.; Understanding the Basics of QSAR for Applications in Pharmaceutical Sciences and Risk Assessment; Elsevier: London, UK, 2015.
-
31 Kiralj, R.; Ferreira, M. M. C.; J. Braz. Chem. Soc. 2009, 20, 770. [Crossref]
» Crossref -
32 Gaudio, A. C.; Zandonade, E.; Quim. Nova 2001, 24, 658. [Crossref]
» Crossref -
33 QSAR Model Development Using DTC Lab. Software Tools. [Link] accessed in February 2026
» Link -
34 Golbraikh, A.; Tropsha, A.; J. Mol. Graphics Modell. 2002, 20, 269. [Crossref]
» Crossref -
35 Tropsha, P.; Gramatica, P.; Gombar, V. K.; QSAR Comb. Sci. 2003, 22, 69. [Crossref]
» Crossref -
36 Golbraikh, M.; Shen, M.; Xiao, Z.; Xiao, Y.-D.; Lee, K.-H.; Tropsha, A.; J. Comput.-Aided Mol. Des. 2003, 17, 241. [Crossref]
» Crossref -
37 Todeschini, R.; Consonni, V.; Handbook of Molecular Descriptors; Wiley-VCH: Weinheim, Germany, 2009. [Crossref]
» Crossref -
38 Roy, K.; Kar, S.; Ambure, P.; Chemom. Intell. Lab. Syst. 2015, 145, 22. [Crossref]
» Crossref -
39 Clark, R. D.; Fox, P. C.; J. Comput.-Aided Mol. Des. 2004, 18, 563. [Crossref]
» Crossref - 40 Davison, A. C.; Hinkley, D. V.; Bootstrap Methods and Their Application, Cambridge University Press: Cambridge, 1997.
-
41 Wang, K. H.; Penmatsa, A.; Gouaux, E.; Nature 2015, 521, 322. [Crossref]
» Crossref -
42 Organisation for Economic Co-operation and Development (OECD); Guidance Document on the Validation of (Quantitative) Structure-Activity Relationship [(Q)SAR] Models; OECD Publishing: Paris, France, 2007. [Link] accessed in February 2026
» Link -
43 Santos, R. A. A.; Braz, C. A.; Ghasemi, J. B.; Safavi-Sohi, R.; Barbosa, E. G.; Med. Chem. Res. 2015, 24, 1098. [Crossref]
» Crossref -
44 Tseng, Y. J.; Hopfinger, A. J.; Esposito, E. X.; J. Comput.-Aided Mol. Des. 2012, 26, 39. [Crossref]
» Crossref -
45 de Oliveira, P. I. C.; Miranda, P. H. S.; Lourenço, E. M. G.; Silverio, P. S. S. N.; Barbosa, E. G.; Mol. Diversity 2021, 25, 2219. [Crossref]
» Crossref -
46 Chebotaev, P. P.; Buglak, A. A.; Sheehan, A.; Filatov, M. A.; Phys. Chem. Chem. Phys. 2024, 26, 25131. [Crossref]
» Crossref
Edited by
-
Editor handled this article:
Paula Homem-de-Mello (Executive)