 Metabolic Profiling of Abscisic Acid, Ascorbate, and Phenolic Compounds across Strawberry Fruit Development
Abstract
Strawberry fruit development is accompanied by pronounced changes in chemical composition, particularly in hormone levels and antioxidant metabolites. This study systematically characterized the temporal dynamics of abscisic acid (ABA), ascorbic acid (AsA), and phenolic compounds across nine developmental stages using chromatographic and mass spectrometric analyses. Early stages were marked by high concentrations of flavan-3-ols, including catechins, and phenolic acids. Intermediate stages exhibited a strong increase in AsA content and the initial accumulation of pigment-related phenolics. During ripening, sharp increases in ABA and its conjugated form, ABA-glucosyl ester, coincided with the accumulation of anthocyanins-predominantly pelargonidin derivatives-and enhanced phenolic glycosylation. Correlation analyses revealed positive associations between ABA and glycosylated phenolics, as well as a negative correlation between ABA and AsA. These results indicate a coordinated metabolic reprogramming during strawberry development, in which ABA accumulation is closely linked to phenolic modification and pigment formation, providing a chemical framework for improving fruit quality and postharvest performance.
Keywords:
metabolic profiling; abscisic acid; phenolic compounds; anthocyanin biosynthesis; Fragaria ×; ananassa
Introduction
The strawberry pseudofruit (Fragaria × ananassa Duch.) is widely consumed due to its appealing appearance, texture, color, and flavor, as well as its nutritional and functional properties.1 During strawberry growth and development, the most readily noticeable changes include increases in size and mass, as well as modifications in color, texture, flavor, and aroma.2 These changes result from a complex interplay of molecular, biochemical, and physiological events, which have been extensively studied.3,4 For instance, genomic resources for strawberry are available, alongside transcriptomic data from the fruit, partial protein characterization, metabolites, hormones, and major changes in nutritional, functional, and sensory quality attributes.2,4,5-15
These advances have contributed to a better understanding of strawberry maturation and ripening and have helped formulate hypotheses regarding the underlying mechanisms. For example, it is widely accepted that strawberry ripening generally follows a non-climacteric metabolism, although minor ethylene production responses similar to those observed in climacteric fruits have been reported.16-24 Likewise, it is well established that decreases in auxin synthesis and accumulation, together with increases in abscisic acid (ABA) synthesis and accumulation, are associated with the typical changes observed during strawberry ripening and maturation.25 These changes coincide with the loss of green coloration, the onset of pink and red pigmentation, tissue softening, reduction of astringency, and increases in sweetness and aroma.26 These traits, which affect consumer acceptance, are accompanied by nutritional and functional changes, such as increased antioxidant capacity and bioactive compounds, including L-ascorbic acid (AsA) and phenylpropanoid compounds.27-29
Overall, strawberries are considered moderately rich in AsA, with levels reaching up to 60 mg 100 g-1.2,30 This organic acid, with high antioxidant potential, is synthesized through four main pathways: (i) the Wheeler-Smirnoff pathway from D-glucose; (ii) via guanosine diphosphate L-gulose (GDP-L-gulose); (iii) from myo-inositol; and (iv) from D-galacturonic acid, the main component of cell wall pectins.31,32 In strawberries, the D-galacturonate pathway appears to be particularly relevant for AsA synthesis in the fruit.33 This pathway is linked to pectin solubilization, providing a substrate for AsA production.32 This hypothesis is supported by studies showing that knockout of pectate lyase reduces pectin solubilization during ripening and decreases AsA content.34
Similarly to AsA, the synthesis, bioconversion, and accumulation of phenolic compounds are important in strawberries due to their sensory and functional properties, as strawberries are relatively rich in phenolic acids.35,36 This metabolism occurs in plastids, starting from aromatic amino acids, especially phenylalanine, via the shikimate pathway.37 Through this metabolic pathway, phenolic acids, chalcones, flavanones (isoflavones), dehydroflavonols (kaempferol, quercetin), leucoanthocyanidins (catechins, epicatechins), and anthocyanins (pelargonidin, cyanidin, delphinidin) are synthesized.38 Several genes and enzymes involved in these metabolic pathways have been partially characterized in strawberries.39
Despite knowledge of antioxidant compound biosynthesis in strawberries, the mechanisms triggering their synthesis are not fully elucidated. Certain biosynthetic genes, such as phenylalanine ammonia-lyase, are known to be induced by ABA.40 Moreover, silencing the ABA biosynthesis pathway prevents characteristic fruit coloration, indicating that this phytohormone plays a crucial role in anthocyanin biosynthesis.41 Overall, ABA, along with phenylpropanoid and AsA metabolism, is strongly affected by biotic and abiotic stressors, suggesting involvement of these compounds in plant adaptation to the environment.35,42,43 Additionally, they are influenced by plant growth and development.44 These plastid-derived compounds can be recycled or transported to vacuoles until cellular demand requires their participation in metabolic pathways associated with stress tolerance.38
ABA biosynthesis originates from the isoprenoid pathway, specifically through β-carotene degradation.45 Hormone synthesis begins with the conversion of zeaxanthin to violaxanthin by zeaxanthin epoxidase; this step can be reversed by violaxanthin de-epoxidase at the expense of AsA.46 After a series of enzymatic reactions, violaxanthin is converted to ABA aldehyde, which is subsequently oxidized to ABA by abscisic aldehyde oxidase.47 ABA bioavailability is further regulated via irreversible degradation to phaseic acid (PA), which is converted to dihydrophaseic acid (DPA), or via reversible conjugation with glucose to form ABA-glucosyl ester (ABA-GE).48 This metabolism occurs in plastids, and the synthesized ABA can be transported to other cellular compartments, tissues, and organs, acting as a regulatory hormone during non-climacteric fruit ripening.49
Despite advances in understanding the synthesis of antioxidant compounds in strawberries, many studies focus on a limited number of maturation stages or on specific metabolic pathways, which still prevents a comprehensive understanding of how these compounds evolve and the triggers that differentiate each stage. For example, a recent study50 have analyzed five maturation stages (green, white, red, dark red, and overripe) in different strawberry cultivars, observing significant changes in phenolic and volatile compound profiles, as well as variations in the activity of peroxidase and polyphenol oxidase. Other studies have focused on AsA metabolism during strawberry ripening, identifying regulatory genes such as FaAKR23 that play crucial roles in the accumulation of AsA and anthocyanins.8,39 However, these studies still do not comprehensively address all maturation stages or the interactions between different metabolic pathways. This knowledge gap is critical, as it limits the development of strategies to enhance the content of antioxidant compounds in fruits (biofortification) or to control postharvest ripening. Considering that strawberries are non-climacteric fruits, harvested at the final stages of maturation when they are highly perishable, a thorough understanding of the maturation process is essential to optimize the nutritional and functional quality of the fruits and to design interventions that prolong their postharvest shelf life.
To address these knowledge gaps, this study systematically tracked the dynamics of ABA, AsA, and phenolic compound accumulation across nine stages of strawberry growth and development, generating essential insights that could inform strategies for biofortification, enhance antioxidant content, and guide postharvest management of non-climacteric fruits to improve both shelf life and consumer appeal.
Experimental
Plant material
Strawberries of the cultivar San Andreas (California, USA) were grown in Capão do Leão (31°46’59.6”S, 52°24’53.0”W) under organic farming principles. For this study, nine distinct stages of growth and maturation were collected, with three biological replicates per stage, each consisting of eight strawberries. Thus, the experiment included a total of 216 fruits (9 stages × 3 replicates × 8 strawberries). The developmental stages were classified according to previous studies.15,51-53
The stages (Figure 1) were categorized as: “early growth stages” (I1, I2, I3), “intermediate growth stages” (G1, G2, G3), and “maturation stages” (M1, M2, M3), based on the visual color and growth characteristics. Early growth stages were distinguished primarily by fruit size and green coloration. Intermediate growth stages were characterized by the loss of green color and increased size. Maturation stages were identified based on red pigmentation, with traces of green in M1, technological ripeness in M2, and full ripeness in M3. After harvesting, fruits were immediately selected, frozen in liquid nitrogen, and stored at -80 °C. For the analyses, the eight fruits per replicate were pooled, collectively homogenized using a ball mill (Marconi MA 350) and liquid nitrogen to ensure low temperature, and subsequently freeze-dried.

Visual representation of the growth and ripening stages of strawberry. From left to right: early growth stages (I), intermediate growth stages (G), and maturation stages (M).
Determination of AsA content
L-Ascorbic acid (AsA) was analyzed according to Vinc e al.54 One gram of sample (homogenized pool of eight fruits per replicate) was used for each of three biological replicates and dissolved in 100 mL of 4.5% (m/v) metaphosphoric acid (Merck), homogenized at room temperature for 1 h in 15 min intervals. Samples were sonicated and centrifuged at 2935 × g for 10 min, and the supernatant was filtered through a 0.4 µm nitrocellulose membrane. Ten microliters of extract were injected into an ultra high-performance liquid chromatography system (UHPLC; Shimadzu, Kyoto, Japan) equipped with an RP C18 CLC ODS column (5 μm; 4.6 mm × 150 mm) and detected at 254 nm. The mobile phase consisted of solution A - 0.1% acetic acid in water, and solution B - methanol. The elution gradient began at 0% B, and increased linearly to 2% B over 5 min; it was then held at 2% B for 2 min, and then returned to the initial conditions after another 3 min. The flow rate was 0.8 mL min-1 and the detector was set at 254 nm. Quantification was carried out using an external calibration curve prepared with an L-(+) ascorbic acid standard (Sigma-Aldrich). The calibration curve showed the following equation: y = 53025x - 3008.6 (coefficient of determination (R2) = 0.9989). The limit of detection (LOD) was 0.05 µg mL 1, and the limit of quantificatio (LOQ) was 0.16 µg mL-1. Results are expressed as mg 100 g-1 fresh weight.
Determination of anthocyanin and phenolic compounds
Anthocyanins and phenolic compounds were quantified according to Antunes et al.55 Lyophilized samples (100 mg) were used with three replicates. Samples were extracted with 1 mL of 75% methanol acidified with 0.1% formic acid, vortexed for 1 min, sonicated for 15 min, and centrifuged at 9900 × g for 10 min (Eppendorf 5430R, Hamburg, Germany). The supernatant was collected, and the residue was re-extracted. Samples were filtered through a 0.22 μm polyvinylidene fluoride (PVDF) membrane (Analítica, São Paulo, Brazil).
Phenolic compounds and anthocyanins were analyzed using UHPLC (Shimadzu, Kyoto, Japan) coupled to a quadrupole time-of-flight mass spectrometer (QTOF MS; Impact HD, Bruker Daltonics, Bremen, Germany). Ten microliters were injected into the system. Separation was performed on a Bidentate C18 column (100 × 2.1 mm; MicroSolv Technology Corporation, Leland, NC), with mobile phases of water acidified with 0.1 % formic acid (eluent A) and acetone acidified with 0.1% formic acid (eluent B) delivered at 0.2 mL min-1 and column temperature maintained at 40 °C. The gradient program was as follows: 10% B at 0 min, 75% B for 5 min, linear increase to 90% B at 18 min, held at 90% B for 3 min, returned to 10% B in 2 min, and re-equilibrated at 10% B for 7 min.
The mass spectrometer operated in negative electrospray ionization mode (ESI-) for phenolics and positive mode for anthocyanins (ESI+), scanning m/z 50-1200. Mass calibration was achieved using sodium formate (10 mmol L-1), according to the recommendations of the manufacturer. Compound identification was performed based on mass spectrometry (MS/MS) fragmentation patterns and accurate mass measurements, with comparison to METLIN, KEGG, PubChem, FooDB, and ReSpect databases, considering a mass error tolerance of ± 5 ppm.
Quantification was carried out using external calibration curves constructed with authentic standards. For phenolic compounds lacking commercially available standards, quantification was estimated using calibration curves of structurally similar compounds. The following calibration equations were used for quantification: catechin and eriodictyol-7-O-glucoside were quantified using (+)-catechin (y = 14972x - 21625; R2 = 0.9929); (-)-epicatechin, (-)-epicatechin-epicatechin-catechin, and (-)-epigallocatechin-catechin were quantified using epicatechin (y = 15982x - 23143; R2 = 0.9937); quercetin-4’-glucuronide was quantified using quercetin (y = 26410x - 41373; R2 = 0.9956); p-coumaric acid was quantified using its own standard curve (y = 23006x - 24917; R2 = 0.9941); ellagic acid 2-rhamnose and ellagic acid 2-rhamnoside were quantified using ellagic acid (y = 20671x - 224.07; R2 = 0.9906); luteolin-3’-glucuronide and kaempferol-3-glucuronide were quantified using luteolin (y = 18253x - 10998; R2 = 0.9947); kaempferol-3-O-acetyl-glucoside and quercetin-3-O-acetyl-rhamnoside were quantified using quercetin (y = 26410x - 41373; R2 = 0.9956); 4-hydroxybenzoic acid was quantified using its own standard curve (y = 5618.2x - 5105.9; R2 = 0.9912); luteolin-3-glucuronide was quantified using luteolin (y = 18253x - 10998; R2 = 0.9947); rutin was quantified using its own standard curve (y = 7925.2x - 13925; R2 = 0.9904); and apigenin and apigenin-4’-glucoside were quantified using naringenin (y = 30768x - 3349.3; R2 = 0.993).
Determination of ABA and derivatives
(S)-(+)-Abscisic acid (ABA) and derivatives were determined according to Perin et al.56 Three biological replicates were used for ABA, ABA-GE, PA, and DPA. For extraction, 100 mg of lyophilized tissue were mixed with 1 mL of 80% methanol, vortexed 1 min, and centrifuged at 18,500 × g for 5 min (Eppendorf 5430R, Hamburg, Germany). The residue was re-extracted, and combined extracts were filtered through a 0.22 μm PVDF membrane. Ten microliters were injected into an UHPLC (Shimadzu®, Japan) coupled to -a Q-TOF (Maxis Impact HD, Bruker Daltonics®, Bremen, Germany). Separation was performed using a Hyperclone ODS C18 column (Phenomenex®, CA, USA). Mobile phases: water with 0.1% formic acid (A) and acetone with 0.1% formic acid (B), flow 0.2 mL min-1 at 40 °C. Gradient: 20% B initial, 30% B at 2 min, linear to 38% B at 6 min, 50% B at 8 min, 70% B at 10 min, return to 20% B in 2 min, hold 3 min. Mass spectrometer operated in negative ionization, m/z 50-1200. Calibration with 10 mM sodium formate; quantification of ABA, ABA-GE, PA, and DPA used ABA calibration curve (Sigma-Aldrich): y = 93.267x + 731.34 (R2 = 0.9997). Data were analyzed using Data Analysis 4.0 (Bruker Daltonics®, Bremen, Germany) and expressed as μg g-1 of lyophilized tissue.
Statistical analysis
Data analysis was performed using GraphPad Prism 9.0 (GraphPad Software, San Diego, CA, USA), with one way analysis of variance (ANOVA) applied to determine significant differences (p ≤ 0.05). When ANOVA indicated significance, means were compared using Tukey’s post-hoc test (p ≤ 0.05). Results are expressed as mean ± standard deviation. Multivariate statistical analyses, including principal component analysis (PCA), hierarchical clustering heatmap analysis using Euclidean distance, and Pearson correlation analysis, were conducted using the MetaboAnalyst web based platform MetaboAnalyst 6.0, (Wishart Research Group, University of Alberta, Edmonton, Canada, 2024). For multivariate analyses, metabolite data were normalized using sum normalization, log10 transformation, and Pareto scaling.
Results
The highest AsA content occurs between stages G2 and M2
The AsA content increased by 162% from stage I1 to stage G2, rising from 2.28 to 5.99 mg 100 g-1, indicating that this period represents the peak induction of AsA accumulation during strawberry growth. No significant changes in AsA content were observed between stages G2, G3, M1, and M2, which corresponded to the peak production of this compound. From stage M2 to M3, AsA content decreased to 4.43 mg 100 g-1 (Figure 2).

L-Ascorbic acid (AsA) content during strawberry fruit growth and development. Early growth stages are represented by the letter “I,” intermediate growth stages by “G,” and maturation stages by “M.” Lowercase letters indicate Tukey’s test comparisons among stages, with p < 0.05.
The highest anthocyanin content occurs at stage M3
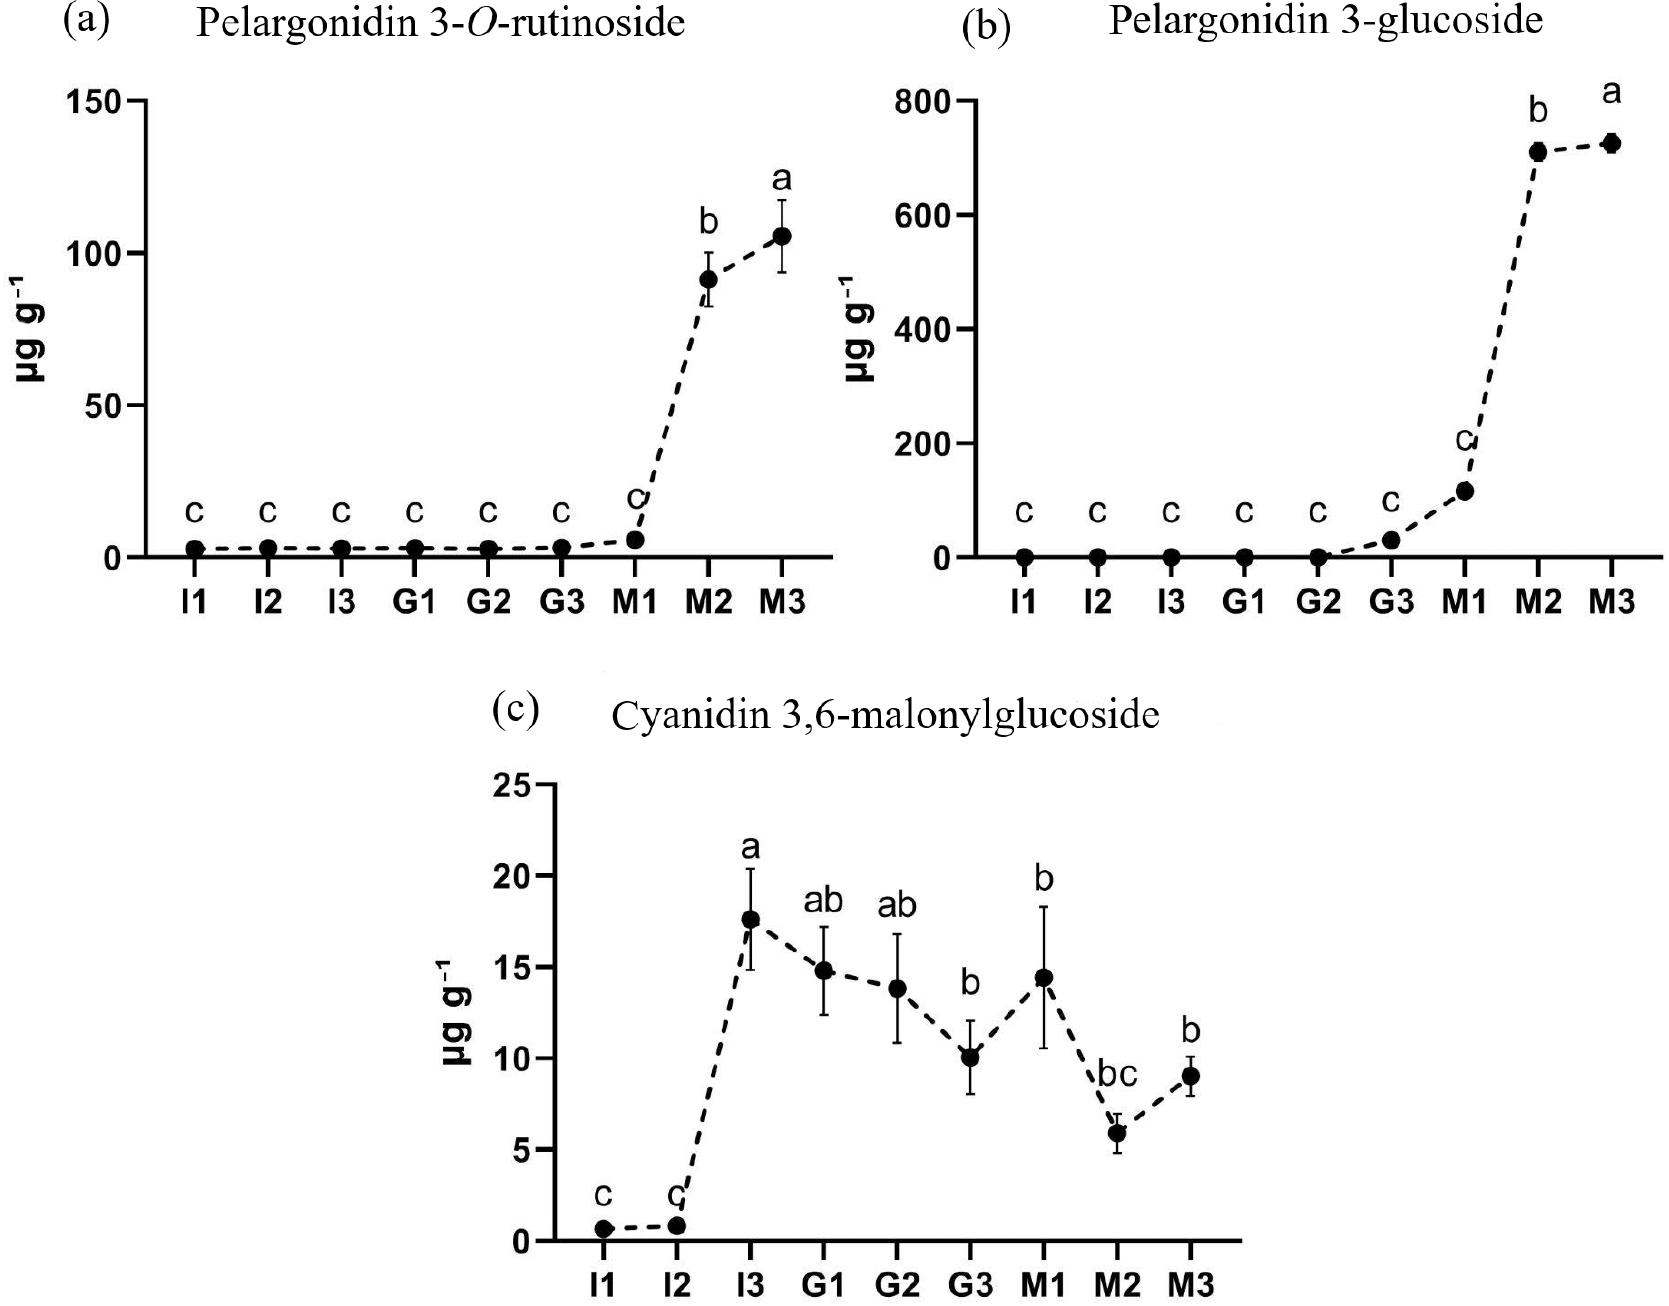
As expected, glycosylated pelargonidins are the predominant anthocyanins in strawberries, present at low levels during the early and growth stages and increasing from stage G3, with a marked rise from stage M1. Levels reached 91.31 and 105.51 µg g-1 at stages M2 and M3 for pelargonidin 3-O-rutinoside, and 702.02 and 725.84 µg g-1 for pelargonidin 3-O-glucoside, respectively (Figures 3a and 3b; Table S3, Supplementary Information (SI) section).

Anthocyanin content: (a) pelargonidin 3-O-rutinoside, (b) pelargonidin 3-O-glucoside, and (c) cyanidin-3-(6’-malonylglucoside). Early growth stages are indicated by “I”, intermediate growth stages by “G”, and maturation stages by “M”. Statistical significance was determined at p < 0.05. Lowercase letters indicate Tukey’s post hoc comparison among stages.
Regarding cyanidin-3-(6’-malonylglucoside), the peak occurred at stage I3 (17.62 µg g-1), followed by a gradual decline, reaching 9.02 µg g-1 at the final stage, M3 (Figure 3c). This anthocyanin represents a minor component in strawberries.
Phenolic compound content varies according to the compound and developmental stage
The quantification of phenolic compounds during the growth and development of strawberry fruits was performed using UHPLC-MS/MS (Tables 1 and S3, SI section). Some compounds showed an increase throughout fruit growth and development: apigenin-4’-glucoside, peaking at stage M3 with 70.8 µg g-1; quercetin-4’-glucuronide, peaking at 74.77 µg g-1 in stage G3; eriodictyol-7-O-glucoside (isomer 1), reaching 95.85 µg g-1 at M3; and luteolin-3’ glucuronide/kaempferol-3-glucuronide, peaking at 33.15 µg g-1 in M3.
Quantification of phenolic compounds identified by UHPLC-MS/MS during growth and development of strawberry fruits
Some compounds exhibited maximum content at intermediate growth stages, such as rutin, with a peak of 5.46 µg g-1 at G3; kaempferol-3-O-acetyl-glucoside/quercetin-3-O-acetyl-rhamnoside (isomer 1), peaking at I3 with 13.16 µg g-1; and ellagic acid-2-rhamnose, peaking at G2 with 18.90 µg g-1. Other compounds were detected only at the final stages, such as kaempferol-3-O-acetyl-glucoside/quercetin-3-O-acetyl-rhamnoside (isomer 2), peaking at M3 with 4.25 µg g-1; methyl syringate, peaking at 16.83 µg g-1 in M3; apigenin, peaking at 2.21 µg g-1 in M2; and eriodictyol-7-O-glucoside (isomer 2), peaking at 35.31 µg g-1 in M3.
Conversely, several compounds showed a decreasing pattern during fruit growth and development, including catechin, epicatechin, epicatechin-epicatechin-catechin, epigallocatechin-catechin, ellagic acid, and 4-hydroxybenzoic acid/salicylic acid.
BA and ABA-GE are induced in the late ripening stages
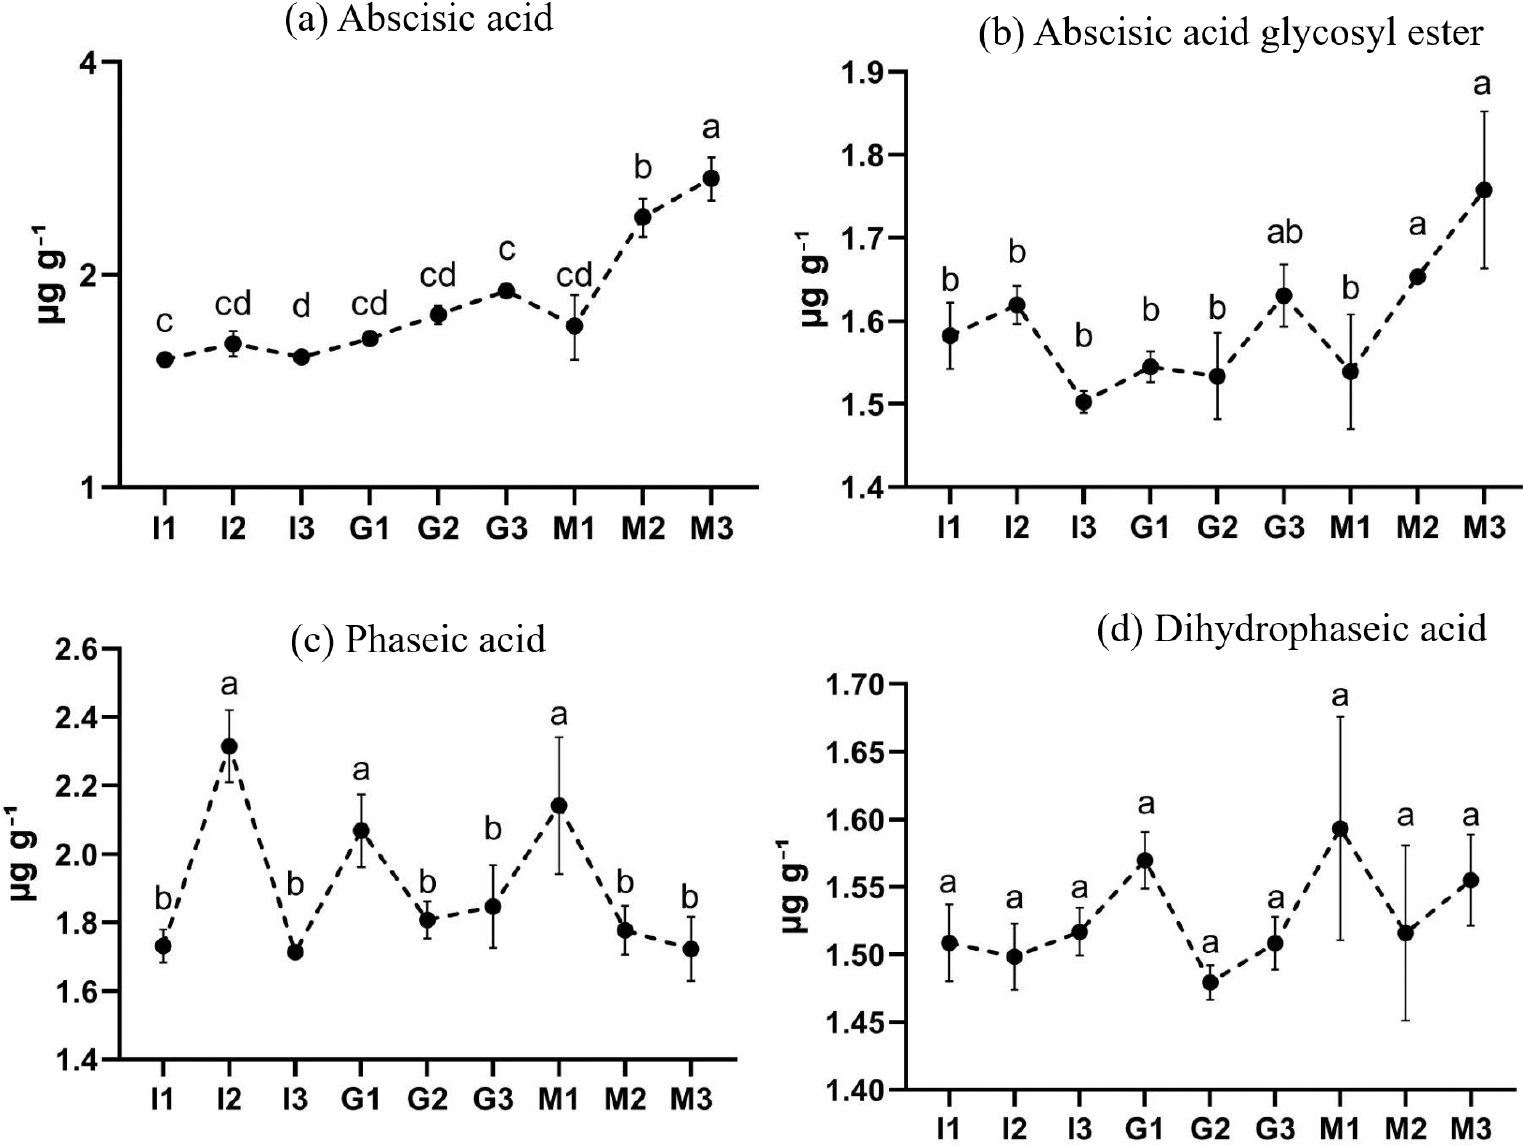
The content of ABA increased throughout the growth and development of strawberry fruits (Figure 4a). At stage I1, fruits contained 1.516 µg g-1 of ABA, which did not differ significantly until stage M1 (1.692 µg g-1). At stage M2, ABA content increased to 2.412 µg g-1, reaching 2.7413 µg g-1 at stage M3, representing an 80% increase from stage I1 to M3 (Figure 4a).

During the growth and development of strawberry fruits: (a) abscisic acid (ABA) content, (b) glycosylated abscisic acid (ABA-GE), (c) phaseic acid (PA), and (d) dihydrophaseic acid (DPA). Early growth stages are indicated by “I”, intermediate growth stages by “G”, and ripening stages by “M”. Test significance at p < 0.05, except for DPA. Lowercase letters indicate Tukey’s multiple comparison test between stages.
The glycosylated form of ABA (ABA-GE) remained stable until stage M1 (1.538 µg g-1) and increased during the final stages, reaching 1.757 µg g-1 at M3, corresponding to a 14 % increase from M1 to M3 (Figure 4b). Regarding the degradation pathway, the content of PA was statistically higher at stages I2, G1, and M1, showing a fluctuating pattern throughout the developmental stages. In contrast, the content of DPA did not show significant differences among the stages (Figures 4c and 4d).
Principal component analysis and hierarchical clustering analysis
To visualize metabolic patterns across developmental stages, principal component analysis (PCA) was performed considering all measured compounds (Figure 5a). The first two principal components explained 86.4% of the variance, with PC1 accounting for 63.3% and PC2 for 23.1%. Strawberries from early stages (I1 and I2) were clearly separated from other stages, while fruits from stages M2 and M3 formed a distinct cluster. The main variables driving this separation were pelargonidin 3-glucoside, pelargonidin 3-O-rutinoside, apigenin-4’-glucoside, and cyanidin-3-(6’-malonylglucoside) (Figure 5b).

(a) Principal component analysis (PCA) of the compounds identified in nine stages of strawberry fruit development, with the Y-axis representing PC2 (23.1%) and the X-axis representing PC1 (63.3%). (b) Key segregating variables for the groups; variables closest to their respective group had the greatest influence on its distinction. Early growth stages are indicated by “I”, intermediate growth stages by “G”, and ripening stages by “M”.
Hierarchical clustering analysis using Euclidean distance revealed a clear separation between early (I, G) and late (M2, M3) developmental stages (Figure 6). The heatmap visualization showed that mature stages exhibited higher accumulation of anthocyanins and flavonoid derivatives, while early stages were characterized by greater abundance of flavan-3-ols and phenolic acids.

Hierarchical clustering heatmap of metabolite accumulation across nine developmental stages of strawberry fruits. The color scale represents normalized metabolite levels, with red indicating higher accumulation and blue indicating lower accumulation. Early developmental stages are denoted by “I”, intermediate growth stages by “G”, and ripening stages by “M”.
Complementary correlation analysis revealed significant relationships between key metabolites (Tables S1 and S2, SI section). ABA showed strong positive correlations with its conjugated form ABA-GE (r = 0.730) and catabolites PA (r = 0.466) and DPA (r = 0.579). Notably, AsA exhibited moderate negative correlation with ABA (r = -0.699) and strong negative correlations with ABA GE (r = -0.833) and DPA (r = -0.752). These multivariate approaches collectively demonstrate coordinated metabolic reprogramming during strawberry fruit development.
Discussion
Understanding the temporal dynamics of bioactive compound accumulation during strawberry growth and development is crucial for devising strategies to control maturation and enhance post-harvest fruit quality. ABA has garnered attention as a key regulator of this process, particularly through the induction of anthocyanins.57 However, gaps remain regarding the causal and temporal relationships between ABA and bioactive compounds associated with strawberry ripening, such as phenolic compounds, anthocyanins, and AsA.
To address these gaps, the present study monitored strawberry fruits across nine developmental stages, organized into three morphophysiological groups: early growth (I1, I2, and I3), intermediate growth (G1, G2, and G3), and maturation (M1, M2, and M3). While most studies focus on 4 to 6 stages, this comprehensive approach was instrumental in providing insights into the timeline of events leading to the accumulation of these compounds.
Early-stage phenolic accumulation and metabolic shifts during strawberry growth
During the early stages of strawberry fruit development (I1 and I2), the accumulation of phenolic compounds from the phenylpropanoid pathway is particularly prominent.58 Both flavonoids and phenolic acids are classified as phenolics, which function as antimicrobial agents in plant defense, protectants against reactive oxygen species (ROS), and feeding deterrents for insects and herbivores.59,60 Moreover, these phenolics contribute to the fruit’s organoleptic and health-promoting properties, making them key indicators of fruit quality.51 In total, 17 phenolic compounds exhibiting significant changes were identified in strawberry fruits. Most phenolic acids, catechins, and epicatechins gradually decreased during ripening and showed strong negative correlations with ABA content. This pattern aligns with observations in other fruits such as plum and apple, where higher phenolic levels at early developmental stages are thought to protect young fruits from herbivory.51
Interestingly, stage I3 displayed a metabolic profile more similar to the intermediate growth group than to the early stages (I1 and I2). This shift appears to be associated with a reduction in catechin, epicatechin, and salicylic acid levels, alongside a sharp increase in cyanidin content. Salicylic acid is a well-known growth regulator involved in plant defense responses.61 Its exogenous application in climacteric fruits such as tomato, banana, peach and kiwi, as well as in non-climacteric fruits like grape and cherry, has been shown to delay ripening.62-67 However, cultivar-specific differences exist in salicylic acid dynamics. For instance, Kim et al.,10 reported a rapid increase in salicylic acid in the late developmental stages of ‘Seolhyang’ strawberries, whereas Lee et al.,68 observed an initial increase followed by a decline in ‘Maehyang’, although levels remained higher than in the early stages. These contrasting patterns suggest that the role of salicylic acid in delaying ripening may be cultivar-dependent.
A similar cultivar-dependent effect was observed for cyanidin content. In the present study, cyanidin levels increased abruptly at stage I3 and decreased during the final ripening stages. Other studies have reported a gradual decrease in cyanidin during strawberry ripening.53,69 Conversely, Aaby et al.,58 and Siebeneichler et al.,57 observed increases in cyanidin until the final developmental stage, with Siebeneichler reporting maximum concentrations of approximately 26.2 µg g-1 DW (dry weight) in ‘Camarosa’. In the current study, the maximum cyanidin content in ‘San Andreas’ reached 17.6 µg g-1 DW. This discrepancy may reflect differences between cultivars, with modern varieties generally exhibiting lower cyanidin levels.70
Overall, the early developmental stages (I1 and I2) are characterized by high phenolic content and low ABA levels, which likely confer protective functions to the developing fruit. Stage I3 marks a transition toward intermediate growth and metabolic reprogramming, with shifts in specific phenolics and cyanidin reflecting the onset of preparatory processes for ripening.
Intermediate growth stages: metabolic transition and ascorbate-hormone interplay
During the intermediate growth stages (G1-G3), strawberry fruits undergo a remarkable visual and biochemical transition, shifting from green to white-reddish coloration (Figure 1). This phase coincides with the accumulation of several key metabolites, including AsA, ellagic acid, quercetin, kaempferol, and rutin (Figure 3), suggesting the activation of metabolic pathways related to antioxidant defense and pigment formation.
AsA plays a pivotal role in both plant physiology and human nutrition. In humans, its antioxidant capacity and health-promoting effects are well established.31,71 In plants, AsA functions as a primary scavenger of ROS, participating in numerous processes such as photosynthesis, growth regulation, and fruit ripening.72 During the transition from chloroplasts to chromoplasts-a defining event in fruit development-AsA contributes to redox homeostasis, protecting cells from oxidative damage while modulating pigment biosynthesis.
At the early growth stages, high AsA concentrations are associated with cell wall biosynthesis, acting as a cofactor for enzymes involved in the assembly of structural polysaccharides. As ripening progresses, oxidative bursts result in the generation of hydroxyl radicals, and AsA plays a dual role by scavenging ROS and promoting pectin solubilization, thereby contributing to fruit softening.31,73 This dual functionality supports the high AsA levels observed in the intermediate stages of development.
Interestingly, AsA accumulation appears to precede the rise in ABA, suggesting a potential regulatory interplay between these molecules. While numerous studies have addressed how phytohormones regulate AsA biosynthesis, fewer have explored the reverse relationship.74,75 Several reports in strawberry indicate that sucrose or ABA treatments, either during ripening or postharvest, do not significantly alter AsA concentrations.35,76,77 However, under abiotic stress conditions such as drought or salinity, coordinated increases in ABA, sucrose, and AsA have been observed, suggesting context-dependent regulation.35,42,43
In the present study, a moderate negative correlation (r = -0.699) between ABA and AsA contents was observed throughout fruit development (Tables S1 and S2, SI section), whereas Siebeneichler et al.,57 reported a stronger correlation (95%) when analyzing five developmental stages. This difference may be attributed to cultivar specific variations or the higher resolution of sampling in the current work. Previous studies78-80 in AsA deficient mutants revealed delayed flowering and reduced growth associated with increased ABA and ethylene biosynthesis. Conversely, exogenous AsA application has been shown to increase gibberellin and auxin levels while suppressing ABA, supporting the hypothesis that AsA modulates phytohormone balance via redox-dependent mechanisms.72,81
Finally, although the M1 stage is visually classified as an early ripening stage due to its initial red pigmentation, both the PCA and heatmap analyses revealed its metabolic profile closely resembles that of the intermediate growth group. According to the biplot (Figure 5b), pelargonidin 3-O-rutinoside, apigenin-4’-glucoside, and eriodictyol-7 O-glucoside were the main contributors to this similarity in the PCA, while the heatmap (Figure 6) visually confirmed M1’s clustering with intermediate stages. This shows that color development begins before the metabolism of the fruit fully shifts to the ripening program, suggesting these processes are not perfectly synchronized.
Late ripening stages: aba-driven induction of anthocyanins and phenolic glycosylation dynamics
From stage M2 onward, ABA concentration began to rise steadily, reaching its peak at M3. It is likely that both the endogenous ABA pool and the recycling of its conjugated form, ABA-GE, were sufficient to trigger anthocyanin biosynthesis-particularly the accumulation of pelargonidin derivatives. This pattern aligns with previous reports52,57,82-84 indicating a late increase in ABA during strawberry ripening, which has been shown to play a central role in regulating anthocyanin synthesis.
The main anthocyanins identified in this study were pelargonidin-3-glucoside and pelargonidin-3-O-rutinoside, whose levels increased sharply from M2 onwards. Their strong positive correlations with ABA (r = 0.83 and r = 0.91, respectively) reinforce the regulatory link between ABA accumulation and color development (Tables S1 and S2, SI section). These pigments are responsible for the characteristic red hue of ripe strawberries, with pelargonidin-3-glucoside and pelargonidin-3-O-rutinoside contributing approximately 77-90% and 6-11% of the total anthocyanin content, respectively. Anthocyanins are well known for their antioxidant and health-promoting properties, adding both nutritional and sensory value to the fruit.70
The biosynthesis of anthocyanins is influenced by multiple regulatory layers-hormonal, genetic, and environmental. Among plant hormones, ABA and jasmonic acid act synergistically with sucrose signaling to promote anthocyanin production, whereas gibberellins tend to inhibit it.8,85 Silencing of the key ABA biosynthetic gene FaNCED1 in strawberry and LbNCED1 in Lycium species drastically reduced anthocyanin accumulation, further confirming ABA’s pivotal role.41,86 Interestingly, sucrose treatment alone did not induce anthocyanin biosynthesis in unripe bilberries, whereas ABA treatment did, indicating that ABA-dependent regulation of ripening is fruit-specific and may vary even among non-climacteric species.87
In addition to anthocyanins, ABA content was positively correlated with several phenolic compounds, including apigenin, apigenin-4’-glucoside, luteolin-3’-glucuronide, eriodictyol-7-O-glucoside (both isomers), methylsyringate, and rutin.58,88 Notably, among the eight glycosylated phenolics identified in this study, six showed a positive correlation with ABA. This relationship can be explained by the structural modifications that occur during ripening: as cell turgor decreases and the cell wall undergoes enzymatic degradation, glycosylation of phenolics contributes to their chemical stability and water solubility.89,90 Hence, the inclusion of a greater number of ripening stages, as done in this study, is crucial to uncover previously unrecognized metabolic events associated with this process.
The interplay between ABA and AsA also deserves attention. ABA is synthesized through the xanthophyll cycle, where carotenoids derived from photosynthetic pigments serve as precursors.91 In strawberries, AsA accumulation precedes that of ABA, likely due to the residual photosynthetic activity of the fruit during the early ripening stages,57 Within this cycle, increased ABA production might lead to decreased AsA utilization, suggesting an antagonistic relationship between these metabolites. Despite this connection, strawberries generally contain low levels of carotenoids, which actually decline during fruit maturation.92,93 Moreover, sucrose-one of the photosynthetic products-has been hypothesized to act synergistically with ABA in regulating the ripening process.52,76,77
Additionally, achene-based studies have revealed spatial differences in these metabolites: Aragüez et al.,94 found that AsA content decreased from green to red fruits in achenes, opposite to what occurs in the receptacle, while ABA content was consistently higher in achenes. This suggests that achenes may actively contribute to the coordination of ripening between tissues.83,95
Together, these results confirm that the late maturation stages of strawberry are characterized by a tight hormonal-metabolic network, where ABA orchestrates both anthocyanin biosynthesis and phenolic glycosylation, while also interacting with AsA and sucrose metabolism to fine tune the ripening process. The positive correlations between ABA and glycosylated phenolics, and the antagonistic interaction between ABA and AsA, suggest a coordinated balance between oxidative metabolism, hormonal signaling, and pigment accumulation. The inclusion of nine developmental stages was crucial to unveil intermediate transitions in ABA metabolism and anthocyanin induction that are not apparent in conventional stage-based analyses.
Future studies should explore how environmental factors (e.g., light spectrum, temperature, and water availability) and cultivar-specific traits modulate ABA metabolism and its crosstalk with AsA and sugar signaling. Integrating multi-omics approaches-such as transcriptomics and metabolomics-with high-resolution temporal sampling could help uncover upstream regulatory networks controlling phenylpropanoid metabolism. Furthermore, spatial analyses distinguishing receptacle and achene metabolism may provide deeper insights into the tissue-specific coordination of strawberry ripening.
Understanding these mechanisms opens new possibilities for breeding and biotechnological strategies aimed at improving fruit color, nutritional value, and postharvest quality, while reducing losses associated with premature or uneven ripening.
Conclusions
This study established a detailed temporal metabolic profile of strawberry fruit development across nine distinct stages, revealing coordinated biochemical and hormonal transitions from early growth to full ripening. Early developmental stages were characterized by high levels of catechins, epicatechins, and phenolic acids, whereas intermediate stages marked the onset of redox remodelin with the increased AsA levels. Ripening was associated with a sharp accumulation of ABA and ABA-GE, concomitant with enhanced anthocyanins biosynthesis and phenolic glycosylation. Overall, the results demonstrate a tightly regulated temporal integration between primary metabolism, specialized phenolic pathways, and ABA signaling during strawberry fruit maturation.
Supplementary Information
Supplementary information is available free of charge at http://jbcs.sbq.org.br as PDF file.
Supplementary material 1
Acknowledgments
This study was financed in part by the CAPES - Finance Code 001, and Fundação de Amparo a Pesquisa do Rio Grande do Sul, under Foundation No. 21/2551-0001977-8 and 22/2551-0000834-8. During the preparation of this work the authors used ChatGPT (OpenAI, GPT-5.3) in order to improve the English writing. After using this tool, the authors reviewed and edited the content as needed and take full responsibility for the content of the published article.
Data Availability Statement
All data are available in the text.
References
-
1 Giampieri, F.; Forbes-Hernandez, T. Y.; Gasparrini, M.; Alvarez Suarez, J. M.; Afrin, S.; Bompadre, S.; Quiles, J. L.; Mezzetti, B.; Battino, M.; Food Funct. 2015, 6, 1386. [Crossref]
» Crossref -
2 Perkins-Veazie, P.; In Horticultural Reviews, vol. 17; Janick, J., ed.; Wiley: Hoboken, NJ, 1995, p. 267. [Crossref]
» Crossref -
3 Gapper, N. E.; McQuinn, R. P.; Giovannoni, J. J.; Plant Mol. Biol. 2013, 82, 575. [Crossref]
» Crossref -
4 Gu, T.; Jia, S.; Huang, X.; Wang, L.; Fu, W.; Huo, G.; Gan, L.; Ding, J.; Li, Y.; Planta 2019, 250, 145. [Crossref]
» Crossref -
5 Edger, P. P.; Poorten, T. J.; VanBuren, R.; Hardigan, M. A.; Colle, M.; McKain, M. R.; Smith, R. D.; Teresi, S. J.; Nelson, A. D. L.; Wai, C. M.; Alger, E. I.; Bird, K. A.; Yocca, A. E.; Pumplin, N.; Ou, S.; Ben-Zvi, G.; Brodt, A.; Baruch, K.; Swale, T.; Shiue, L.; Acharya, C. B.; Cole, G. S.; Mower, J. P.; Childs, K. L.; Jiang, N.; Lyons, E.; Freeling, M.; Puzey, J. R.; Knapp, S. J.; Nat. Genet. 2019, 51, 541. [Crossref]
» Crossref -
6 Liu, T.; Li, M.; Liu, Z.; Ai, X.; Li, Y.; Hortic. Res 2021, 8, 41. [Crossref]
» Crossref -
7 Shulaev, V.; Sargent, D. J.; Crowhurst, R. N.; Mockler, T. C.; Folkerts, O.; Delcher, A. L.; Jaiswal, P.; Mockaitis, K.; Liston, A.; Mane, S. P.; Burns, P.; Davis, T. M.; Slovin, J. P.; Bassil, N.; Hellens, R. P.; Evans, C.; Harkins, T.; Kodira, C.; Desany, B.; Crasta, O. R.; Jensen, R. V.; Allan, A. C.; Michael, T. P.; Setubal, J. C.; Gessler, J. C.; Shiu, M. F.; Vaillancourt, K. D.; Tang, H.; Zhu, Y.; Goff, J. R.; De Jong, W. M.; Chen, J.; Thomas, P. D. W.; Lopez-Girona, A. M.; Zhebentyayeva, T.; Wipf, D.; Pliego-Alfaro, F.; Arús, P.; Mitreva, M.; Clough, S. J.; Haudry, A.; Maliepaard, C. A.; Gabel, B.; Wünsch, A.; Salzberg, S. L.; Folta, K. M.; Nat. Genet 2011, 43, 109. [Crossref]
» Crossref -
8 Chen, J.; Mao, L.; Lu, W.; Ying, T.; Luo, Z.; Planta 2016, 243, 183. [Crossref]
» Crossref -
9 Galli, V.; Messias, R. S.; Guzman, F.; Perin, E. C.; Margis, R.; Rombaldi, C. V.; Physiol. Plant. 2019, 166, 979. [Crossref]
» Crossref -
10 Kim, J.; Lee, J. G.; Hong, Y.; Lee, E. J.; J. Plant Physiol. 2019, 239, 52. [Crossref]
» Crossref -
11 Li, D.; Mou, W.; Xia, R.; Li, L.; Zawora, C.; Ying, T.; Mao, L.; Liu, Z.; Luo, Z.; Hortic. Res. 2019, 6, 26. [Crossref]
» Crossref -
12 Xu, P.; Zawora, C.; Li, Y.; Wu, J.; Liu, L.; Liu, Z.; Cai, R.; Lian, H.; Plant Growth Regul 2018, 86, 121. [Crossref]
» Crossref -
13 Yi, G.; Shin, H.; Min, K.; Lee, E. J.; PLoS One 2021, 16, e0252685. [Crossref]
» Crossref -
14 Bianco, L.; Lopez, L.; Scalone, A. G.; Di Carli, M.; Desiderio, A.; Benvenuto, E.; Perrotta, G.; J. Proteomics 2009, 72, 586. [Crossref]
» Crossref -
15 Baldi, P.; Orsucci, S.; Moser, M.; Brilli, M.; Giongo, L.; Si Ammour, A.; Planta 2018, 248, 1143. [Crossref]
» Crossref -
16 Ji, K.; Chen, P.; Sun, L.; Wang, Y.; Dai, S.; Li, Q.; Li, P.; Sun, Y.; Wu, Y.; Duan, C.; Leng, P.; Funct. Plant Biol. 2012, 39, 351. [Crossref]
» Crossref -
17 Li, C.; Jia, H.; Chai, Y.; Shen, Y.; Plant Signaling Behav 2011, 6, 1950. [Crossref]
» Crossref -
18 Nunes, M. C. N.; Brecht, J. K.; Morais, A. M. M. B.; Sargent, S. A.; J. Sci. Food Agric 2006, 86, 180. [Crossref]
» Crossref -
19 Perkins-Veazie, P. M.; Huber, D. J.; Brecht, J. K.; Plant Growth Regul. 1995, 17, 33. [Crossref]
» Crossref -
20 Liu, Z.; Zhao, P.; Cui, L.; Fang, J.; Jia, H.; Hortic. Plant J. 2015, 1, 147. [Crossref]
» Crossref -
21 Iannetta, P. P. M.; Laarhoven, L. J.; Medina-Escobar, N.; James, E. K.; McManus, M. T.; Davies, H. V.; Harren, F. J. M.; Physiol. Plant. 2006, 127, 247. [Crossref]
» Crossref -
22 Merchante, C.; Vallarino, J. G.; Osorio, S.; Aragüez, I.; Villarreal, N.; Ariza, M. T.; Martínez, G. A.; Medina-Escobar, N.; Civello, M. P.; Fernie, A. R.; Botella, M. A.; Valpuesta, V.; J. Exp. Bot 2013, 64, 4421. [Crossref]
» Crossref -
23 Tosetti, R.; Elmi, F.; Pradas, I.; Cools, K.; Terry, L. A.; Front. Plant Sci 2020, 11, 174. [Crossref]
» Crossref -
24 Zhang, Y.; Deng, M.; Gu, X.; Guo, C.; Chen, Y.; Lin, Y.; Chen, Q.; Wang, Y.; Zhang, Y.; Luo, Y.; Zhang, M.; Zhong, J.; Wu, Q.; Agronomy 2023, 13, 1930. [Crossref]
» Crossref -
25 Liao, X.; Li, M.; Liu, B.; Li, J.; Zhang, N.; Yang, G.; Li, J.; Yamamuro, C.; Proc. Natl. Acad. Sci. U. S. A. 2018, 115, E11542. [Crossref]
» Crossref -
26 Giovannoni, J. J.; Plant Cell 2004, 16, S170. [Crossref]
» Crossref -
27 Milosavljević, D.; Maksimović, V.; Milivojević, J.; Djekić, I.; Wolf, B.; Zuber, J.; Vogt, C.; Maksimović, J. D.; Plants 2023, 12, 2238. [Crossref]
» Crossref -
28 Pap, N.; Fidelis, M.; Azevedo, L.; Carmo, M. A. V.; Wang, D.; Mocan, A.; Pereira, E. P. R.; Xavier-Santos, D.; Sant’Ana, A. S.; Yang, B.; Granato, D.; Curr. Opin. Food Sci 2021, 42, 167. [Crossref]
» Crossref -
29 Dzhanfezova, T.; Barba-Espín, G.; Müller, R.; Joernsgaard, B.; Hegelund, J. N.; Madsen, B.; Larsen, D. H.; Martínez Vega, M.; Toldam-Andersen, T. B.; Food Biosci 2020, 36, 100620. [Crossref]
» Crossref -
30 Giampieri, F.; Tulipani, S.; Alvarez-Suarez, J. M.; Quiles, J. L.; Mezzetti, B.; Battino, M.; Nutrition 2012, 28, 9. [Crossref]
» Crossref -
31 Smirnoff, N.; Free Radical Biol. Med 2018, 122, 116. [Crossref]
» Crossref -
32 Fenech, M.; Amaya, I.; Valpuesta, V.; Botella, M. A.; Front. Plant Sci 2019, 9, 2006. [Crossref]
» Crossref -
33 do Nascimento, J. R. O.; Higuchi, B. K.; Gómez, M. L. P. A.; Oshiro, R. A.; Lajolo, F. M.; Postharvest Biol. Technol 2005, 38, 34. [Crossref]
» Crossref -
34 Agius, F.; González-Lamothe, R.; Caballero, J. L.; Muñoz Blanco, J.; Botella, M. A.; Valpuesta, V.; Nat. Biotechnol. 2003, 21, 177. [Crossref]
» Crossref -
35 Crizel, R. L.; Perin, E. C.; Siebeneichler, T. J.; Borowski, J. M.; Messias, R. S.; Rombaldi, C. V.; Galli, V.; Plant Physiol. Biochem 2020, 152, 211. [Crossref]
» Crossref -
36 Vighi, I. L.; Crizel, R. L.; Perin, E. C.; Rombaldi, C. V.; Galli, V.; Crit. Rev. Plant Sci. 2019, 38, 99. [Crossref]
» Crossref -
37 Dong, N. Q.; Lin, H. X.; J. Integr. Plant Biol. 2021, 63, 180. [Crossref]
» Crossref -
38 Vogt, T.; Mol. Plant 2010, 3, 2. [Crossref]
» Crossref -
39 Xu, Y.; Charles, M. T.; Luo, Z.; Mimee, B.; Tong, Z.; Roussel, D.; Rolland, D.; Véronneau, P. Y.; Food Chem 2019, 299, 125138. [Crossref]
» Crossref -
40 Jiang, Y.; Joyce, D. C.; Plant Growth Regul 2003, 39, 171. [Crossref]
» Crossref -
41 Jia, H. F.; Chai, Y. M.; Li, C. L.; Lu, D.; Luo, J. J.; Qin, L.; Shen, Y. Y.; Plant Physiol. 2011, 157, 188. [Crossref]
» Crossref -
42 Galli, V.; Messias, R. S.; Perin, E. C.; Borowski, J. M.; Bamberg, A. L.; Rombaldi, C. V.; LWT - Food Sci. Technol 2016, 73, 693. [Crossref]
» Crossref -
43 Jia, H.; Jiu, S.; Zhang, C.; Wang, C.; Tariq, P.; Liu, Z.; Wang, B.; Cui, L.; Fang, J.; Plant Biotechnol. J. 2016, 14, 2045. [Crossref]
» Crossref -
44 Fecka, I.; Nowicka, A.; Kucharska, A. Z.; Sokół-Łętowska, A.; J. Food Compos. Anal 2021, 95, 103669. [Crossref]
» Crossref -
45 Simpson, K.; Cerda, A.; Stange, C. In Carotenoids in Nature; Stange, C., ed.; Springer: Cham, Switzerland, 2016, ch. 7. [Crossref]
» Crossref -
46 Jahns, P.; Latowski, D.; Strzalka, K.; Biochim. Biophys. Acta, Bioenerg 2009, 1787, 3. [Crossref]
» Crossref -
47 Wang, P.; Lu, S.; Zhang, X.; Hyden, B.; Qin, L.; Liu, L.; Bai, Y.; Han, Y.; Wen, Z.; Xu, J.; Cao, H.; Chen, H.; Plant Sci. 2021, 304, 110739. [Crossref]
» Crossref -
48 Nambara, E.; Marion-Poll, A.; Annu. Rev. Plant Biol 2005, 56, 165. [Crossref]
» Crossref -
49 Finkelstein, R.; Arabidopsis Book 2013, 11, e0166. [Crossref]
» Crossref -
50 Simkova, K.; Veberic, R.; Grohar, M. C.; Pelacci, M.; Smrke, T.; Ivancic, T.; Medic, A.; Cvelbar Weber, N.; Jakopic, J.; Plants 2024, 13, 1419. [Crossref]
» Crossref -
51 Fait, A.; Hanhineva, K.; Beleggia, R.; Dai, N.; Rogachev, I.; Nikiforova, V. J.; Fernie, A. R.; Aharoni, A.; Plant Physiol 2008, 148, 730. [Crossref]
» Crossref -
52 Jia, H.; Wang, Y.; Sun, M.; Li, B.; Han, Y.; Zhao, Y.; Li, X.; Ding, N.; Li, C.; Ji, W.; Jia, W.; New Phytol 2013, 198, 453. [Crossref]
» Crossref -
53 Zhang, J.; Wang, X.; Yu, O.; Tang, J.; Gu, X.; Wan, X.; Fang, C.; J. Exp. Bot 2011, 62, 1103. [Crossref]
» Crossref -
54 Vinci, G.; Botrè, F.; Mele, G.; Ruggieri, G.; Food Chem 1995, 53, 211. [Crossref]
» Crossref -
55 Antunes, A. C. N.; Acunha, T. S.; Perin, E. C.; Rombaldi, C. V.; Galli, V.; Chaves, F. C.; J. Sci. Food Agric 2019, 99, 6973. [Crossref]
» Crossref -
56 Perin, E. C.; Crizel, R. L.; Galli, V.; Messias, R. S.; Rombaldi, C. V.; Chaves, F. C.; Food Anal. Methods 2018, 11, 2547. [Crossref]
» Crossref -
57 Siebeneichler, T. J.; Crizel, R. L.; Reisser, P. L.; Perin, E. C.; Messias, R. S.; Rombaldi, C. V.; Galli, V.; J. Food Compos. Anal 2022, 108, 104398. [Crossref]
» Crossref -
58 Aaby, K.; Mazur, S.; Nes, A.; Skrede, G.; Food Chem. 2012, 132, 86. [Crossref]
» Crossref -
59 Daglia, M.; Curr. Opin. Biotechnol 2012, 23, 174. [Crossref]
» Crossref -
60 Singh, S.; Kaur, I.; Kariyat, R.; Int. J. Mol. Sci 2021, 22, 1442. [Crossref]
» Crossref -
61 Wani, A. B.; Chadar, H.; Wani, A. H.; Singh, S.; Upadhyay, N.; Environ. Chem. Lett 2017, 15, 101. [Crossref]
» Crossref -
62 Changwal, C.; Shukla, T.; Hussain, Z.; Singh, N.; Kar, A.; Singh, V. P.; Abdin, M. Z.; Arora, A.; Front. Plant Sci 2021, 12, 663943. [Crossref]
» Crossref -
63 Srivastava, M. K.; Dwivedi, U. N.; Plant Sci 2000, 158, 87. [Crossref]
» Crossref -
64 Tareen, M. J.; Singh, Z.; Khan, A. S.; Ullah, Q. H. M. B.; J. Plant Growth Regul 2017, 36, 983. [Crossref]
» Crossref -
65 Wang, J.; Zhu, J. Z.; Liu, X. F.; Allan, A. C.; Gao, H. Y.; Yin, X. R.; Wang, W. Q.; Postharvest Biol. Technol 2022, 194, 112100. [Crossref]
» Crossref -
66 Coelho, J.; Almeida-Trapp, M.; Pimentel, D.; Soares, F.; Reis, P.; Rego, C.; Mithöfer, A.; Fortes, A. M.; Plant Sci. 2019, 283, 266. [Crossref]
» Crossref -
67 Valero, D.; Díaz-Mula, H. M.; Zapata, P. J.; Castillo, S.; Guillén, F.; Martínez-Romero, D.; Serrano, M.; J. Agric. Food Chem 2011, 59, 5483. [Crossref]
» Crossref -
68 Lee, G. B.; Lee, J. E.; Lee, J. H.; Jo, G. H.; Cho, Y. T.; Park, H. M.; Lee, S. G.; Kang, B. Y.; Hortic. Environ. Biotechnol 2020, 61, 229. [Crossref]
» Crossref -
69 Ornelas-Paz, J. J.; Yahia, E. M.; Ramírez-Bustamante, N.; Pérez Martínez, J. D.; Escalante-Minakata, M. P.; Ibarra Junquera, V.; Acosta-Muñiz, C.; Guerrero-Prieto, V.; Ochoa-Reyes, E.; Food Chem 2013, 138, 372. [Crossref]
» Crossref -
70 Cai, C.; Shen, J.; Chen, L.; Li, J.; HortScience 2023, 58, 988. [Crossref]
» Crossref -
71 Carr, A. C.; Rowe, S.; Nutrients 2020, 12, 3286. [Crossref]
» Crossref -
72 Arabia, A.; Munné-Bosch, S.; Muñoz, P.; Postharvest Biol. Technol 2024, 207, 112614. [Crossref]
» Crossref -
73 Zou, M. Y.; Nie, S. P.; Yin, J. Y.; Xie, M. Y.; Int. J. Biol. Macromol 2020, 151, 483. [Crossref]
» Crossref -
74 Adaskaveg, J. A.; Blanco-Ulate, B.; Curr. Opin. Biotechnol 2023, 79, 102872. [Crossref]
» Crossref -
75 Xu, X.; Zhang, Q.; Gao, X.; Wu, G.; Wu, M.; Yuan, Y.; Zheng, X.; Gong, Z.; Hu, X.; Gong, M.; Qi, T.; Li, H.; Luo, Z.; Li, Z.; Deng, W.; Plant Cell 2022, 34, 4409. [Crossref]
» Crossref -
76 Luo, Y.; Ge, C.; Ling, Y.; Mo, Z.; Yang, Y.; Jiang, L.; Chen, Q.; Lin, Y.; Sun, B.; Zhang, Y.; Wang, Y.; Li, M.; Wang, X.; Tang, H.; Mol. Genet. Genomics 2020, 295, 421. [Crossref]
» Crossref -
77 Siebeneichler, T. J.; Crizel, R. L.; Camozatto, G. H.; Paim, B. T.; Messias, R. S.; Rombaldi, C. V.; Galli, V.; Food Chem 2020, 317, 126407. [Crossref]
» Crossref -
78 Kerchev, P. I.; Pellny, T. K.; Vivancos, P. D.; Kiddle, G.; Hedden, P.; Driscoll, S.; Vanacker, H.; Verrier, P.; Hancock, R. D.; Foyer, C. H.; Plant Cell 2011, 23, 3319. [Crossref]
» Crossref -
79 Caviglia, M.; Morales, L. M. M.; Concellón, A.; Grozeff, G. E. G.; Wilson, M.; Foyer, C. H.; Bartoli, C. G.; Free Radical Biol. Med 2018, 122, 130. [Crossref]
» Crossref -
80 Plumb, W.; Townsend, A. J.; Rasool, B.; Alomrani, S.; Razak, N.; Karpinska, B.; Ruban, A. V.; Foyer, C. H.; J. Exp. Bot 2018, 69, 2823. [Crossref]
» Crossref -
81 Terzi, R.; Kalaycıoglu, E.; Demiralay, M.; Ozcan, F.; Yildiz, G.; Demirkaya, E.; Tuna, M.; Acta Physiol. Plant. 2015, 37, 43. [Crossref]
» Crossref -
82 Symons, G. M.; Chua, Y. J.; Ross, J. J.; Quittenden, L. J.; Davies, N. W.; Reid, J. B.; J. Exp. Bot 2012, 63, 4741. [Crossref]
» Crossref -
83 Li, B. J.; Grierson, D.; Shi, Y.; Chen, K. S.; Hortic. Res. 2022, 9, uhac089. [Crossref]
» Crossref -
84 Bai, Q.; Huang, Y.; Shen, Y.; Front. Plant Sci 2021, 11, 619953. [Crossref]
» Crossref -
85 Zhang, Y.; Butelli, E.; Martin, C.; Curr. Opin. Plant Biol 2014, 19, 81. [Crossref]
» Crossref -
86 Li, G.; Zhao, J.; Qin, B.; Chen, C.; Li, M.; Li, P.; Luo, Z.; Ye, C.; Shang, Q.; BMC Plant Biol 2019, 19, 317. [Crossref]
» Crossref -
87 Karppinen, K.; Tegelberg, P.; Häggman, H.; Jaakola, L.; Front. Plant Sci 2018, 9, 1259. [Crossref]
» Crossref -
88 González-Villagra, J.; Cohen, J. D.; Reyes-Díaz, M. M.; Physiol. Plant 2019, 165, 855. [Crossref]
» Crossref -
89 Xu, W.; Dubos, C.; Lepiniec, L.; Trends Plant Sci 2015, 20, 176. [Crossref]
» Crossref -
90 Paniagua, C.; Ric-Varas, P.; García-Gago, J. A.; López-Casado, G.; Blanco-Portales, R.; Muñoz-Blanco, J.; Schückel, J.; Knox, J. P.; Matas, A. J.; Quesada, M. A.; Posé, S.; Mercado, J. A.; J. Exp. Bot. 2020, 71, 7103. [Crossref]
» Crossref -
91 Sun, T.; Rao, S.; Zhou, X.; Li, J.; Sun, Z.; Li, Y.; Zhang, Y.; Chen, Y.; Yuan, L.; Li, J.; Mol. Hortic 2022, 2, 3. [Crossref]
» Crossref -
92 Caller, M.; Mackinney, G.; J. Food Sci 1965, 30, 393. [Crossref]
» Crossref -
93 Zhu, H.; Chen, M.; Wen, Q.; Li, Y.; Sci. Hortic 2015, 182, 134. [Crossref]
» Crossref -
94 Aragüez, I.; Osorio, S.; Hoffmann, T.; Rambla, J. L.; Medina Escobar, N.; Granell, A.; Botella, M. Á.; Schwab, W.; Valpuesta, V.; Plant Physiol. 2013, 163, 946. [Crossref]
» Crossref -
95 Kojima, K.; Aoki, C.; Chino, S.; Environ. Control Biol. 2021, 59, 35. [Crossref]
» Crossref
Edited by
-
Editor handled this article:
Hector Henrique F. Koolen (Associate)