 Application of MIR Spectroscopy Combined with Multivariate Analysis for Detection of Adulteration in Commercial Buffalo Ricotta Cheese
Abstract
The aim was to verify the authenticity of commercial buffalo ricotta cheese samples by means of composition, chemical characteristics, electrophoresis and mid-infrared (MIR) spectroscopy combined with chemometric techniques. Eleven formulations with different proportions of cow whey (CW) and buffalo whey (BW), including samples with 100% CW and 100% BW, were produced and stored for 0, 15, and 30 days. A total of 14 commercial buffalo ricotta cheese samples was collected for authenticity verification. The analyses included composition (fat, protein, moisture, and ash), chemical characteristics (pH and titratable acidity), MIR spectroscopy, and electrophoresis. MIR data were subjected to principal component analysis (PCA) and analysis of covariance (ANCOVA). The composition and electrophoresis data did not identify fraud in commercial samples or distinguish between pure and adulterated samples. PCA discriminated samples primarily based on storage time. ANCOVA confirmed the relevance of time in most MIR bands, but the isolated concentration of CW was not significant, indicating the need for additional techniques to detect adulteration.
Keywords:
adulteration; chemical composition; electrophoresis; chemometrics
Introduction
Ricotta is a traditional Italian cheese, obtained through the coagulation of whey proteins, a process that occurs due to acidification and heating, with temperatures ranging between 80 and 90 °C. It is characterized by its high moisture content, mild flavor, and soft texture.1 In addition to its physical and sensory properties, ricotta cheese plays an important role in the sustainability of the dairy industry, as its production reuses whey, a byproduct that, if improperly discarded, can cause environmental impacts.2
A notable characteristic of ricotta cheese is its versatility, as it is produced from whey, a byproduct derived of cheese production from milk of various species such as goat, sheep, cow, and buffalo. The whey of each species gives the final product unique attributes in terms of physical and chemical characteristics and nutritional value.1,3 This diversity in milk origin enriches the organoleptic profile of ricotta cheese, making it an ideal base for distinct taste perceptions.2
Among the different types of whey obtained during ricotta cheese production, buffalo whey stands out for its advantages over cow whey due to its properties of original milk, as physicochemical, composition, and nutritional value, with higher levels of fat (7.0-8.0%), lactose (4.5 4.9%), protein (4.2-4.7%), and minerals (0.75 0.85%).4,5 However, its lower availability and higher cost may favor product adulteration, such as the addition of cow whey in buffalo ricotta cheese production, thereby compromising its authenticity.6
Faced with this scenario, guaranteeing food compliance has become a central concern for the industry. It is essential that products meet the established requirements, ensuring that the labeling is in line with the ingredients used, the production technology employed, and the genetic identity of the product. Incorrect labeling constitutes fraud and can have negative consequences for consumer health. In this context, milk stands out as one of the raw materials most susceptible to changes in its composition, either through partial substitution with other dairy or non-dairy ingredients. Therefore, identifying the milk species present in dairy products is essential to determine their composition, ensure traceability and provide accurate information to the consumer.7
To enable this identification, various analytical methods are available to determine the species of origin of the milk and its derivatives. These include immunological,8,9 electrophoretic,10,11 chromatographic12,13 and spectroscopic, including mid-infrared spectroscopy2,8,14 in conjunction with multivariate statistical techniques that assist in the extraction and interpretation of data sets.
A promising and still underexplored approach to verifying the authenticity of buffalo ricotta cheese is the combination of chemical composition, chemical properties, electrophoresis, and mid-infrared (MIR) data associated with chemometrics. While chemical composition provides information on the constituents of the product, MIR spectroscopy detects variations in the functional groups of the molecules present,15 and electrophoresis enables the separation and identification of specific proteins.10 The application of these techniques can help identify potential differences between buffalo ricotta cheese samples and those that may contain bovine whey, contributing to the improvement of quality control methods and product traceability.
The aim was to use compositional analysis, chemical characteristics, electrophoresis (sodium dodecyl sulfate-polyacrylamide gel electrophoresis (SDS-PAGE)) and MIR spectroscopy combined with multivariate analysis to determine the presence of cow milk whey in commercial buffalo ricotta cheese.
Experimental
Sample collection
To obtain standard samples for model development, buffalo ricotta cheese with different levels of adulteration was produced. The whey samples from bovine and buffalo species used to produce the ricotta cheese were obtained by making Minas Frescal cheese following the procedures described by Andreatta et al.16 Bovine (Dutch × Zebu) and buffalo (Jafarabadi × Murrah) milk, both obtained under appropriate hygienic and sanitary conditions, were filtered to remove impurities and slowly pasteurized at 64 ± 1 ºC for 30 min under constant agitation.
The total volume used to produce the ricotta cheese was 2.375 L (milk and whey), with 1.9 L of whey, varying the amount of buffalo and bovine whey according to the treatment, and 0.475 L of pasteurized buffalo milk, corresponding to 20% of what is allowed by law.17 The experimental ricotta cheese samples were processed using buffalo whey (BW) and cow whey (CW). The ricotta cheese were produced in 11 treatments, with 100% BW (T1), and with increasing amounts of CW added to BW: addition of 10% CW (T2), 20% CW (T3), 30% CW (T4), 40% CW (T5), 50% CW (T6), 60% CW (T7), 70% CW (T8), 80% CW (T9) and 90% CW (T10), as well as samples made with 100% CW (T11). All treatments were performed with three independent replicates, and each replicate was evaluated at three storage times: 0, 15, and 30 days under refrigeration (4 ± 2 °C), allowing for the analysis of variations in the composition and quality of the ricotta cheese over time. The samples were frozen (-18 °C) at each storage time for later analysis.
To produce the ricotta cheese, the titratable acidity of the whey mixture was adjusted to 6-8 °D using sodium bicarbonate (1.425 g) (Casalab, Belo Horizonte-MG, Brazil). After standardizing the acidity, the whey mixture was heated to 70 ± 2 °C, and buffalo milk was added under slow and constant stirring. After reaching a temperature of 85 ± 2 °C, 3.8 mL of lactic acid (Rica Nata LTDA, Minas Gerais, Brazil) diluted in water were added. Heating was, then, continued under slow stirring at 90 ± 2°C until coagulum formation was observed. Once heating was complete, the coagulum was removed, molded (15 cm × 9 cm × 8 cm), manually pressed, and vacuum-packed (model BS 320, R Baião, Minas Gerais, Brazil).
Additionally, 14 commercial buffalo ricotta cheese samples from various batches and brands, all officially registered, were collected from local markets. These samples were collected in their original form, stored under refrigeration (4 ± 2 °C), and analyzed at two storage times (15 and 30 days) to verify authenticity with possible addition of cow whey. All commercial samples were purchased as buffalo ricotta cheese, according to the information provided on the packaging.
Chemical composition and chemical characteristics
All produced and commercial ricotta cheese samples were subjected to the following analyses: moisture (AOAC 926.08), protein (AOAC 920.123), ash content (AOAC 935.42), fat in dry matter (AOAC 920.125), and titratable acidity (AOAC 920.124). Analytical measurements were performed in triplicate, following the described methodologies.18 The pH value was determined using a digital pH meter with a glass electrode, calibrated with pH 7.0 and 4.0 solutions (model QA338 - ECV Hanna Instruments Inc., Quimis, São Paulo, Brazil).
Mid-infrared spectroscopy (MIR)
MIR spectroscopic analysis was performed on buffalo ricotta cheese samples, both produced and commercial. The spectra were obtained through mid-infrared spectroscopy with Fourier transform and attenuated total reflection FTIR-ATR (Cary 630 FTIR, Agilent Technologies Inc., Santa Clara, CA, USA), using the spectral range from 4000 to 600 cm-1, with a resolution of 4 cm-1, 64 scans, and reading through the diamond crystal. Before each collection, a background spectrum reading was performed. Approximately 0.5 g of the homogenized sample was placed on the diamond surface for the reading, with spectra being obtained in absorbance mode. The software for spectral acquisition was the Agilent MicroLab PC software. During the analysis, the ambient temperature was maintained around 18 °C. The variables were the wavenumber values at which the bands reached maximum absorbance.
Electrophoresis
The electrophoretic characterization of the produced and commercial ricotta cheeses at different storage times was performed according to the methodology of Egito et al.,19 using the polyacrylamide gel technique under denaturing conditions with the addition of SDS (Cromoline, São Paulo, Brazil). The molecular weight standard (Bio-Rad, Hercules, CA, USA) was used as a reference to compare the proteins present in the cheese. The molecular weight standard was composed of aprotinin (6.5 kDa), lysozyme (14.4 kDa), trypsin inhibitor (21.5 kDa), carbonic anhydrase (31 kDa), ovalbumin (45 kDa), serum albumin (66.2 kDa), phosphorylase b (97.4 kDa), β-galactosidase (116.2 kDa), and myosin (200 kDa).
The gels were stained in a dye solution containing 0.1% Coomassie Brilliant Blue G250 (Vetec, Rio de Janeiro, Brazil), dissolved in a mixture of 50% (v/v) ethanol (Vetec, Rio de Janeiro, Brazil) and 12% (m/v) trichloroacetic acid (Sigma, St. Louis, MO, USA), for 12 h. The gels were then de-stained in 30% (v/v) ethanol and 7.5% (v/v) acetic acid (Vetec, Rio de Janeiro, Brazil) for approximately 4 h, with constant slow agitation on a shaker.
Statistical analyses
For the data on the composition and chemical characteristics of the produced ricotta cheese, statistical analysis was performed following a completely randomized design with three replications. To evaluate the effect of storage time, a 3 × 11 factorial scheme was used.
The factor storage time presented 3 levels (0, 15, and 30 days), and the different formulations presented 11 levels (0, 10, 20, 30, 40, 50, 60, 70, 80, 90, and 100% addition of CW). Analysis of variance (ANOVA) was performed to evaluate the independent effects of storage time and the different formulations, as well as the interaction between these factors. The mathematical models were chosen based on the significant effects of the proposed model (p ≤ 0.05) and the determination coefficients (R2). In relation to the treatment mean square sum (SQTRAT), a t-test was also conducted. The analysis was also performed for the 14 commercial samples at 15 and 30-day storage times.
The dataset of the cheese samples obtained by MIR spectroscopy was organized in the form of matrices, consisting of n maximum absorbances (variables) performed on m samples (different concentrations of bovine serum addition), such that they were formed by m × n elements (m rows corresponding to the different serum concentrations and n columns corresponding to the variables). Matrices were constructed to evaluate the absorbance of the full MIR spectrum (matrix A1), the absorbance of the chosen bands from the spectrum obtained by MIR for the samples produced with different concentrations of CW at different storage times under refrigeration (0, 15, and 30 days) (matrix A2), and the absorbance of the chosen bands from the spectrum obtained by MIR for commercial samples at different storage times under refrigeration (15 and 30 days) (matrix A3).
The data were standardized (μ = 0, σ = 1, where μ is the mean and σ is the standard deviation), and for spectroscopic analysis, the data were pre-processed using the standard normal variate (SNV) to reduce non-linear baseline deviations, which are common in reflectance measurements. Matrices A2 and A3 were subjected to principal component analysis (PCA), and matrix A2 was subjected to analysis of covariance (ANCOVA), using the Statistical Analysis System software.20
Principal component analysis (PCA)
PCA was performed by transforming the original data matrices into covariance matrices, which express the individual variances and linear combinations (covariances) between two variables. The eigenvalues and their respective normalized eigenvectors were used to construct the principal components (PCs). The number of PCs was chosen based on the evaluation of cumulative variance, selecting the first PCs that together accounted for more than 70% of the total variance. The scatter plots of the correlation coefficients between the variables and the PCs were generated using the OriginPro software (version 8.0, Microcal Software, USA, in two-dimensional space).
Analysis of covariance (ANCOVA)
ANCOVA was performed to evaluate the effect of the levels of adulteration with the addition of CW and the storage time (0, 15, and 30 days) on the spectra obtained by MIR, considering possible influences of covariates. ANCOVA was applied to different spectral bands representative of chemical components of ricotta cheese, in order to determine whether the differences observed between treatments were due to the actual effect of adulteration and storage time, or could be explained by the covariate. The statistical model adopted included the fixed factors adulteration and time, as well as the continuous covariate, and significance was assessed at the 5% level.
Results and Discussion
Chemical composition and chemical characteristics
Variations in composition (fat, protein, moisture, ash) and chemical characteristics (pH and acidity) of ricotta cheese samples produced with different concentrations of CW showed no significant differences (p > 0.05). However, pH and acidity were significant (p ≤ 0.05) in relation to storage time, indicating that only these factors were affected (Table S1 in the Supplementary Information (SI) section). The increase in storage time led to a decrease in pH and an increase in acidity in the ricotta cheese samples. According to Mohammadi et al.,21 the continuous growth of lactic acid bacteria in cheese, along with the fermentation of lactose and its conversion into lactic acid and other metabolites, may explain the increase in acidity over time.
For the 14 commercial samples, no significant differences (p > 0.05) were observed for the composition and chemical characteristics parameters, with mean values of 18.49% fat, 11.93% protein, 70.02% moisture, 1.23% ash, 2.33% acidity, and pH 6.04.
According to Brazilian legislation,18 ricotta cheese must meet specific standards of identity and quality, following physical-chemical parameters, being classified as a cheese with very high moisture content (greater than 55%), and fat ranging from 10% (skimmed) to 44.9% (semi-fat). All commercial samples met the legal requirements for physicochemical parameters. It should be noted that variations in composition that fall outside established legal standards characterize it as non-compliant, meaning the product could not be legally marketed.
Mid-infrared spectroscopy (MIR)
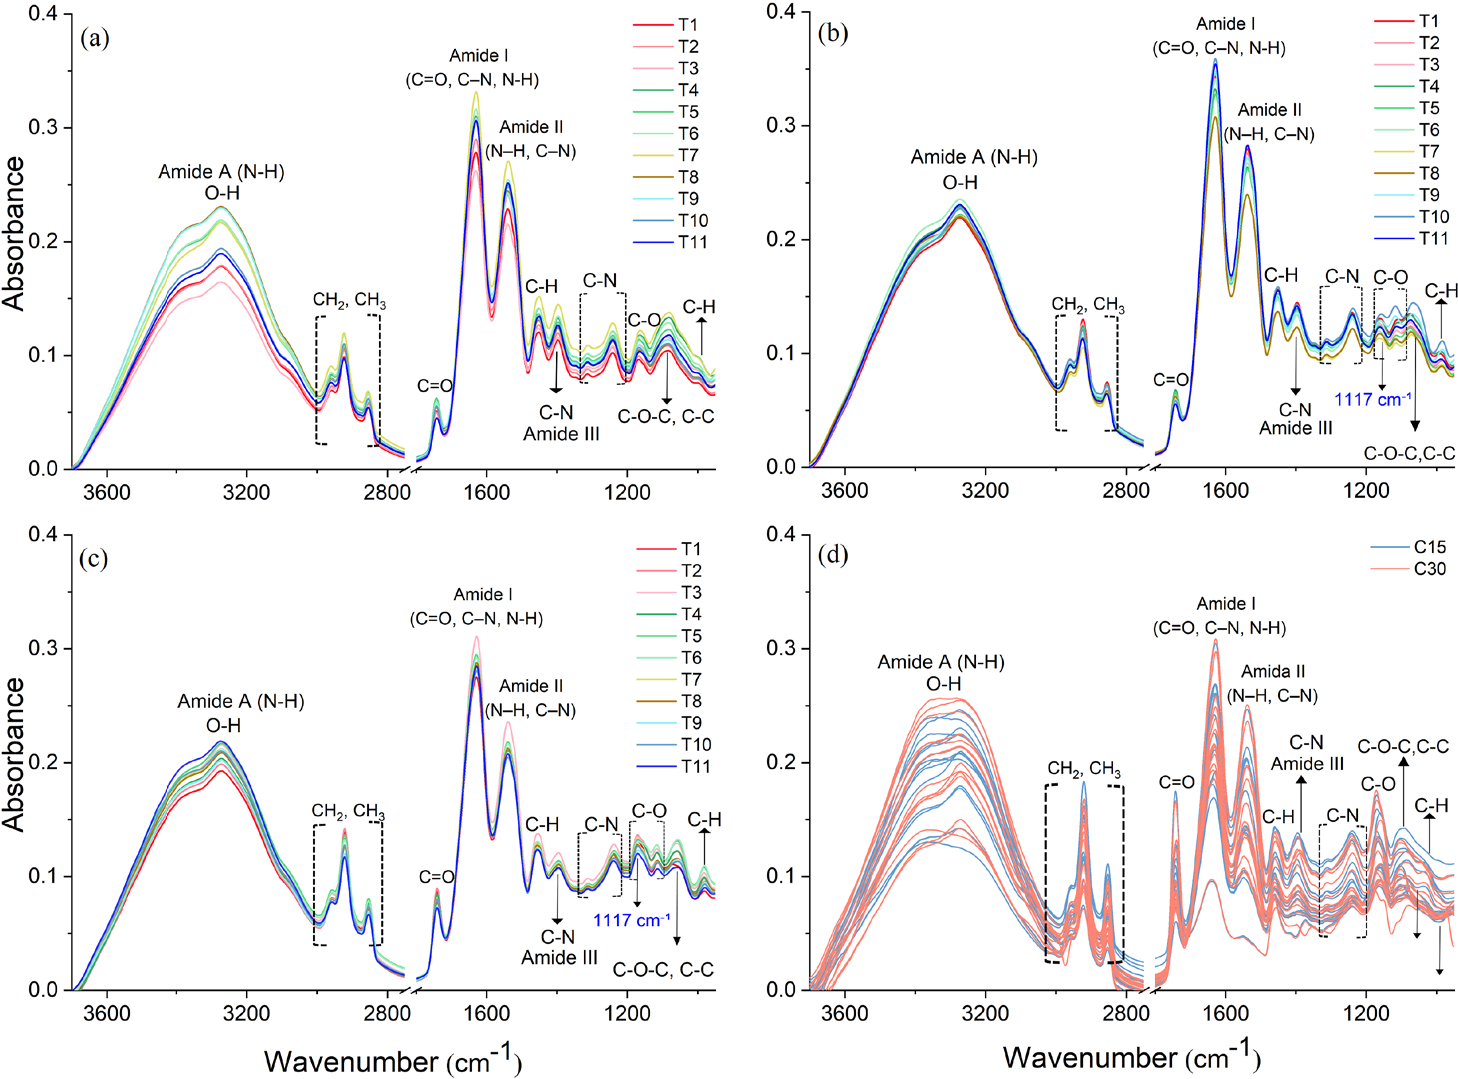
The spectral regions of interest between 3600-2800 and 1750-999 cm-1 (Figure 1) highlight the presence of functional groups and their vibrational modes, identified based on information from Barbosa22 and Coates.23 In the spectroscopic profiles of the ricotta cheese, 15 bands with maximum absorbance were identified (Figures 1a, 1b, and 1c), all showing similar behavior, varying in absorption intensity, which can be explained by the similar chemical composition of the product. Although the spectroscopic profiles reveal a similar chemical composition between the samples, the detailed analysis identified the formation of a specific protein band (1117 cm-1), associated with the C-O group, which, varying in intensity over time, points to small changes in the proteins of the ricotta cheese during storage (Figures 1b and 1c).
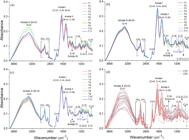
Mid-infrared spectra of produced ricotta cheese with different concentrations of cow whey (CW) and buffalo whey (BW) obtained by MIR spectroscopy: (a) 0 days of storage; (b) 15 days of storage; (c) 30 days of storage; and (d) spectra of commercial ricotta cheese at 15 (C15) and 30 (C30) days of storage; T1: 100% BW; T2: 90% BW and 10% CW; T3: 80% BW and 20% CW; T4: 70% BW and 30% CW; T5: 60% BW and 40% CW; T6: 50% BW and 50% CW; T7: 40% BW and 60% CW; T8: 30% BW and 70% CW; T9: 20% BW and 80% CW; T10: 10% BW and 90% CW; T11: 100% CW.
In the range of 3200-3600 cm-1, where the band at 3274 cm-1 is located, a probable band overlap occurred, both in the vibrational stretching modes of O-H, free or in hydrogen bonds, as well as N-H stretching bands related to secondary amides A, associated with water and protein content, respectively. This band with greater intensity was expected due to the moisture and protein values found in the analytical measurements.
Between 3000-2850 cm-1, asymmetric stretching bands of CH3 (2957 cm-1), CH2 (2923 cm-1), and symmetric stretching of CH2 (2853 cm-1) appear, reflecting the content of fatty acids. The band at 1743 cm-1 corresponds to the stretching of the C=O bond, related to the ester groups of fatty acids (Figures 1a, 1b, and 1c). It was also possible to observe an increase in intensity of the band at 999 cm-1 corresponding to the C-H functional group, present in fatty acids, proteins, and carbohydrates, at the 15 and 30 days storage times (Figures 1b and 1c).
The region from 1637-1313 cm-1 is associated with functional groups present in proteins. The band at 1637 cm-1 (amide I) is related to the C=O bond of the peptide bond, while the band at 1549 cm-1 (amide II) refers to the combination of mixed vibrations of N-H bending and C-N stretching. The band at 1160 cm-1 is attributed to the symmetric C-N stretching, related to primary, secondary, and tertiary amines. The band at 1450 cm-1 is attributed to the angular deformation of the N-H group of amide II, the band at 1408 cm-1 corresponds to the amide III band, linked to the C-N stretching. The band at 1313 cm-1 is related to the saturated aliphatic amide group and the C-N stretching (Figures 1a, 1b, and 1c). At the band of 1093 cm-1, the characteristic absorption of lactose occurs, associated with the stretching vibrations of the C-O, C-C, and C-O-C bonds, which are essential for the formation of carbohydrates.
For the commercial samples, the main difference observed over the storage time was in the absorption intensity, indicating that storage affects the concentration of some components, but without causing chemical reactions or structural changes for the formation of new peaks (Figure 1d).
This detailed spectral analysis is essential for a comprehensive understanding of the ricotta cheese composition. Although the treatments showed similar behaviors, further investigations are needed to differentiate them, with chemometric analyses proving to be a promising alternative.
Statistical analysis
Principal component analysis (PCA)
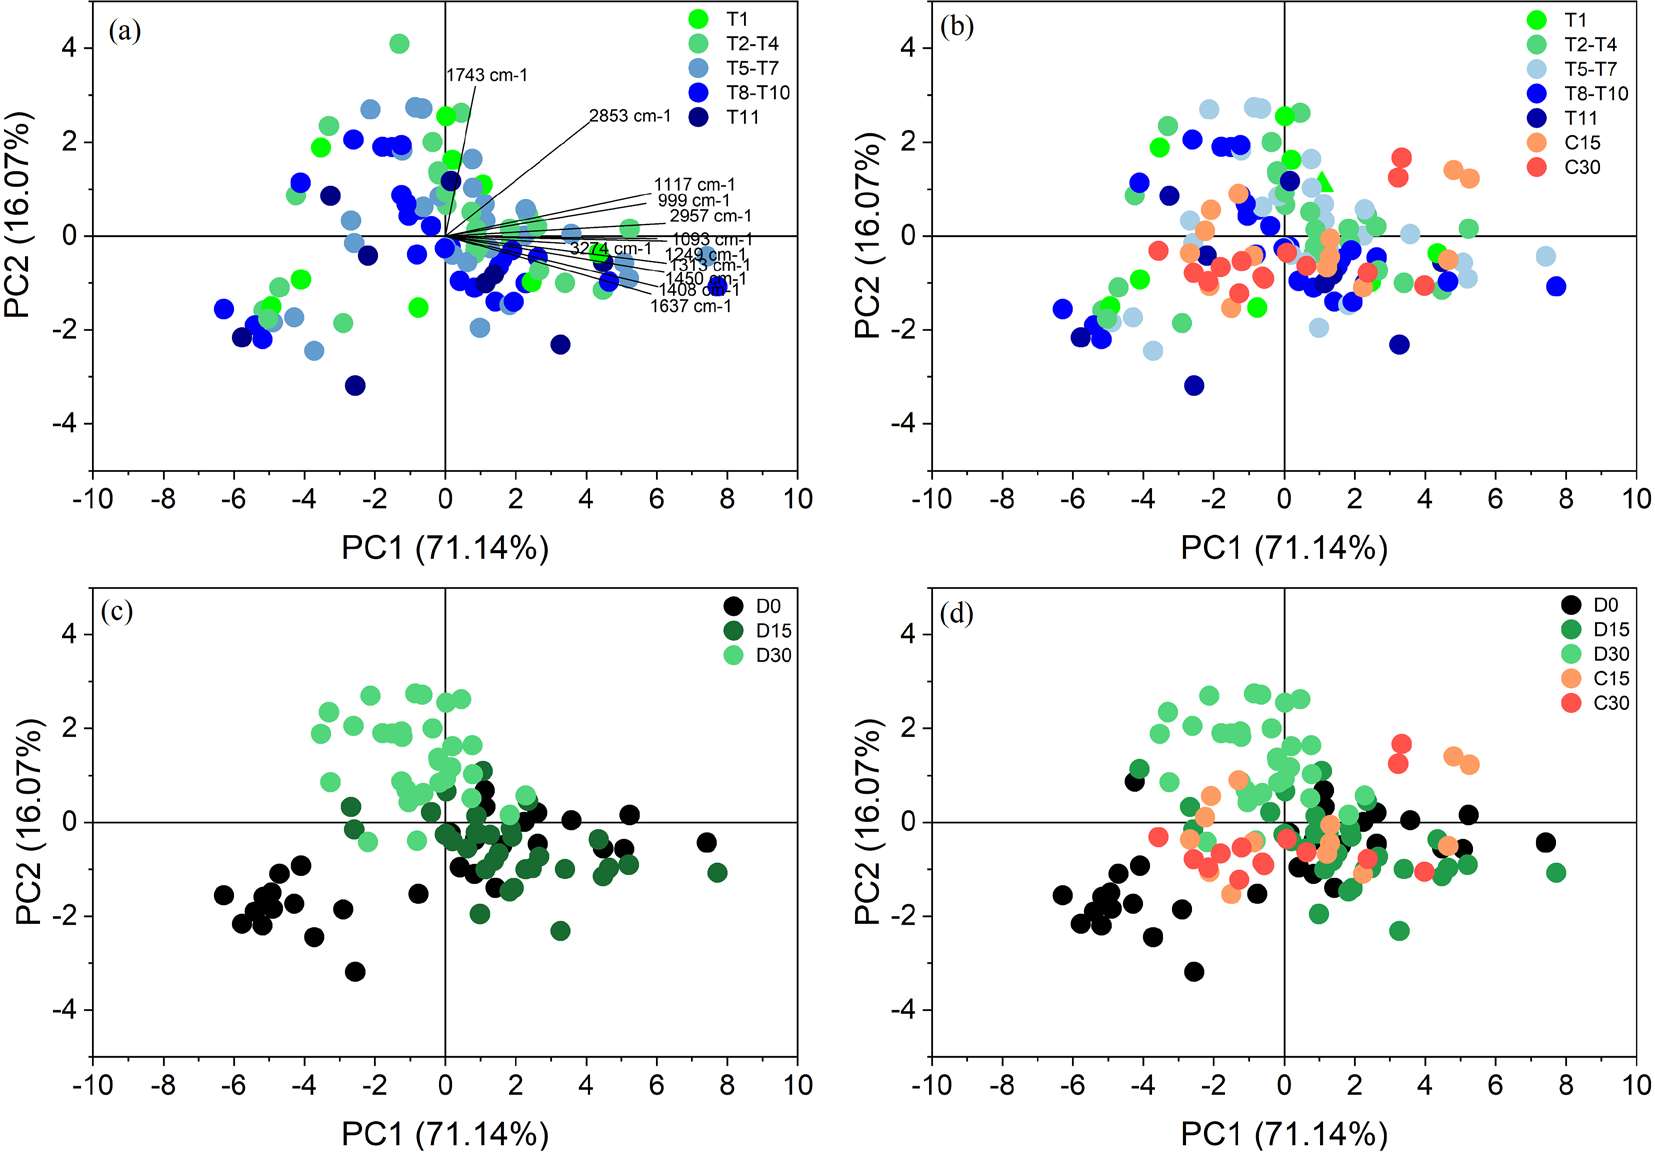
Figure 2 shows the scatter plot of PCs of the ricotta cheese samples with the treatments T1 (100% BW and 0% CW), T11 (0% BW and 100% CW), the CW concentration ranges added to the ricotta cheese (T2-T4: 10 to 30%; T5 T7: 40 to 60% and T8-T10: 70 to 90%) and the commercial samples according to the data obtained by MIR.
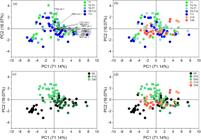
Scatter plots of the principal components of the ricotta cheese samples at different concentrations (T1-T11), storage times: 0 (P0), 15 (P15), and 30 days (P30), and commercial samples at 15 (C15) and 30 days (C30). The representations include: (a) concentration of the produced samples (T1 T11); (b) concentration of the samples T1-T11 and commercial samples; (c) storage time of P0, P15, and P30 (T1-T11); and (d) storage time of P0, P15, and P30 and commercial samples C15 and C30; T1: 100% BW; T2: 90% BW and 10% CW; T3: 80% BW and 20% CW; T4: 70% BW and 30% CW; T5: 60% BW and 40% CW; T6: 50% BW and 50% CW; T7: 40% BW and 60% CW; T8: 30% BW and 70% CW; T9: 20% BW and 80% CW; T10: 10% BW and 90% CW; T11: 100% CW.
Based on the interpretability criteria associated with the eigenvalue diagram, 2 PCs with the highest variance proportions of the original attributes were selected. PC1 explained 71.14% and PC2 represented 16.07% of the total variance of the data. It can be observed that one of the objectives of PCA was successfully achieved by reducing 13 variables to just two variables, PC1 and PC2, with the least possible loss of information.
PC1 was positively and significantly correlated (p ≤ 0.05) with all the variables: 3274 cm-1 (O-H, N-H) associated with water and proteins; 2957 cm-1 (CH3), 2853 cm-1 (CH2), and 1743 cm-1 (C=O) associated with lipids; 1637 cm-1 (C=O), 1450 cm-1 (N-H), 1408 cm-1 (C-N), 1313 cm-1 (C-N), 1117 cm-1 (C-O), and 1249 cm-1 (C-N) associated with proteins; 1093 cm-1 (C-O-C) associated with carbohydrates; and 999 cm-1 (C-H), indicating that the higher the value of a sample for PC1, the higher the content of these compounds and the intensity of the MIR spectrum.
PC2 exhibited a positive and significant correlation (p ≤ 0.05) with spectral variables mainly associated with lipids, including 2957 cm-1 (CH3), 2853 cm-1 (CH2), 1743 cm-1 (C=O), and 999 cm-1 (C-H). Additionally, a positive correlation was observed with the 1117 cm-1 (C-O) band, related to proteins. These results suggest that the positive portion of the PC2 plot is associated with the samples stored for 30 days, which show a greater lipid contribution, especially in the form of CH2 and C=O groups. In contrast, PC2 showed a negative correlation with variables associated with proteins (1637 cm-1, C=O; 1450 cm-1, N-H; 1408 cm-1, C-N; 1313 cm 1, C-N; 1249 cm 1, C-N) and also with bands linked to carbohydrates (1093 cm-1, C-O-C) and the presence of water and proteins (3274 cm-1, O-H, N-H). This negative correlation indicates a higher presence of these variables, particularly the N-H and C-N groups of proteins, in the samples stored for 0 and 15 days.
The wide dispersion of the commercial samples (C15 and C30) in the space defined by the samples produced with different levels of adulteration (T1-T11) suggests considerable heterogeneity in the composition of the products available on the market. Some commercial samples resemble pure buffalo ricotta cheese (T1), while others indicate different degrees of adulteration with CW (Figure 2b).
A separation of the samples along CP1 (which explains most of the variance, 71.14%) is observed based on storage time (Figure 2c), with less influence from the addition of CW concentration (CP2: 16.07%). The inclusion of the commercial samples (Figure 2d) shows that, despite the temporal influence on the produced samples, the commercial samples exhibit distinct spectral profiles, possibly due to variations in manufacturing or composition, and show greater variability over storage time.
Analysis of covariance (ANCOVA)
ANCOVA was performed on the MIR data to assess the significance of the independent variables (IV), CW concentration, and storage time, in the produced ricotta cheese samples. The objective was to identify which dependent variables (DV), represented by absorbances, had a significant effect (p ≤ 0.05). Among the analyzed DVs in the ricotta cheese spectrum, only those corresponding to 1093 and 999 cm-1 did not show significance for the IV. Therefore, these bands were not relevant for quantifying the CW content in the product authentication.
Storage time had a significant effect on most of the DVs (3274, 2957, 2853, 1637, 1549, 1450, 1408, 1313, 1249, 1176, and 1117 cm-1), indicating that these bands can be used to detect changes occurring in ricotta cheese during storage. This result confirms the findings obtained in the PCA, where the samples were better distributed with respect to storage time.
The peaks at 1743 and 2923 cm-1 were sensitive to the changes caused by the interaction between storage time and CW concentration. This indicates that the combination of these two factors influenced the vibrations of the C=O (carbonyl, associated with lipids) and CH2 (present in lipid and protein chains) bonds, suggesting changes in the chemical composition of ricotta cheese over time due to adulteration.
The CW concentration variable in the different ricotta cheese formulations did not show significant differences (p ≤ 0.05) in relation to the analyzed DVs. This does not necessarily imply the absence of fraud, but suggests the need for complementary methods to improve detection.
For the commercial samples, this same pattern was maintained, as the absence of significant differences in the produced samples indicated low variability in the MIR response regarding CW concentration. Therefore, there was insufficient basis to evaluate adulterations in the commercial samples, reinforcing the need to combine this technique with other analytical methodologies for more accurate fraud identification.
The finding that MIR combined with PCA and ANCOVA did not provide sufficient discriminatory power to detect adulteration in commercial buffalo ricotta cheese samples highlights the complexity of this food matrix. Although the chemometric strategy adopted (PCA/ANCOVA) was appropriate for exploratory analysis and validation of the laboratory formulations, the adulteration signal from cow whey was masked by the greater spectral variability of commercial samples (matrix effect).
To mitigate this effect in future studies, the use of supervised methods such as partial least squares (PLS) discriminant analysis (DA) or regression is recommended, as they can relate spectral variations to adulterant content, improving classification and quantification in complex matrices. Applying these models with a broader and more diverse calibration set represents the next step toward refining detection in commercial products and establishing a fully validated and scalable authenticity method.
Electrophoresis
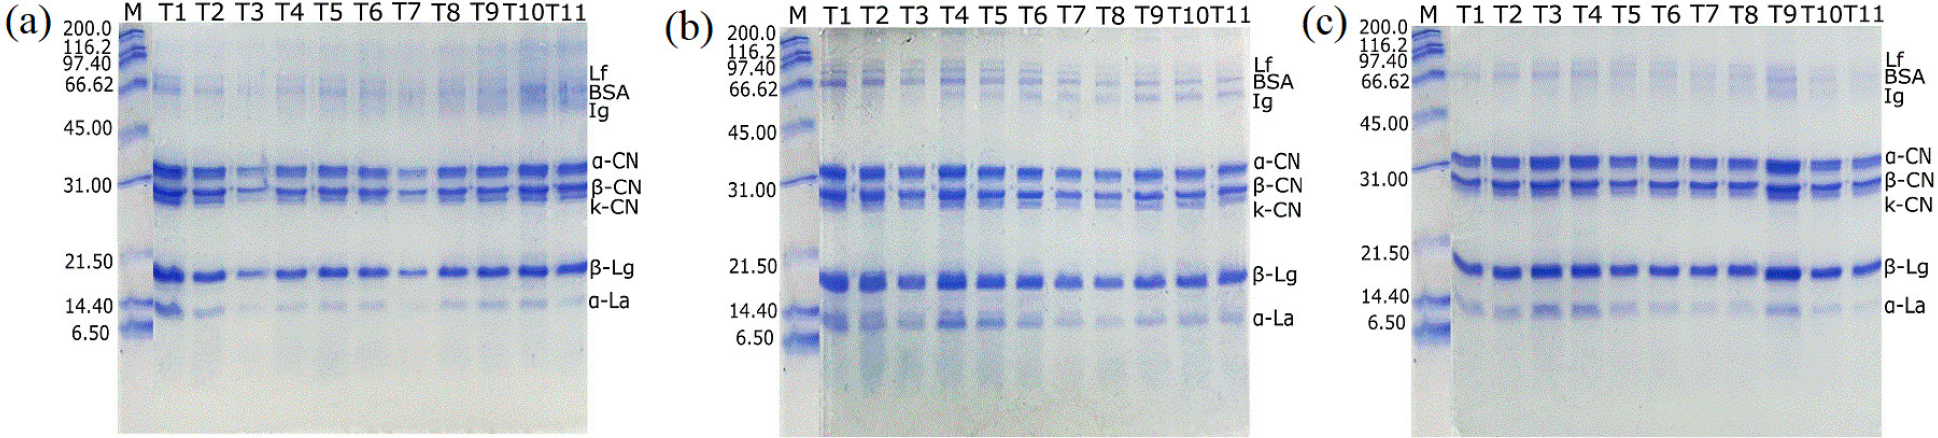
The proteolytic pattern of the cheeses was assessed by SDS-PAGE, comparing the protein bands with molecular mass markers. The analyses revealed the presence of typical whey proteins in the samples, including lactoferrin (ca. 80 kDa), bovine serum albumin (ca. 66 kDa), immunoglobulin (ca. 53 kDa), β-lactoglobulin (ca. 18 kDa), and α-lactalbumin (ca. 14 kDa). In addition, caseins such as α-casein (ca. 32 kDa), β-casein (ca. 26 kDa), and κ-casein (ca. 19 kDa) were identified in the ricotta cheese samples due to the use of buffalo milk in its production (Figure 3). These findings are consistent with previous studies, such as those by Ricciardi et al.24 and Shelke et al.,25 which also observed the presence of these proteins in ricotta cheese samples.
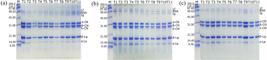
Electrophoretic profiles of produced ricotta cheese samples with different treatments T1-T11 at different storage times: (a) 0 days; (b) 15 days; and (c) 30 days; β-Lg: lactoglobulin; α-La: α-lactalbumin; α-CN: α-casein; β-CN: β-casein; k-CN: κ-casein; BSA: bovine serum albumin; Ig: immunoglobulin; Lf: lactoferrin; M: molecular weight marker (kDa); T1: 100% BW; T2: 90% BW and 10% CW; T3: 80% BW and 20% CW; T4: 70% BW and 30% CW; T5: 60% BW and 40% CW; T6: 50% BW and 50% CW; T7: 40% BW and 60% CW; T8: 30% BW and 70% CW; T9: 20% BW and 80% CW; T10: 10% BW and 90% CW; T11: 100% CW.
Despite attempts to use the 100% BW (T1) and 100% CW (T11) samples as references for treatment differentiation, it was not possible to establish a reliable electrophoretic marker to distinguish between them and detect potential fraud. Although the immunoglobulin (Ig) fraction was visible as a thin line in T11 (bovine) and absent in T1 (buffalo) (Figure 3b), the progressive addition of CW resulted in an electrophoretic pattern that did not allow for a clear distinction of the intermediate treatments.
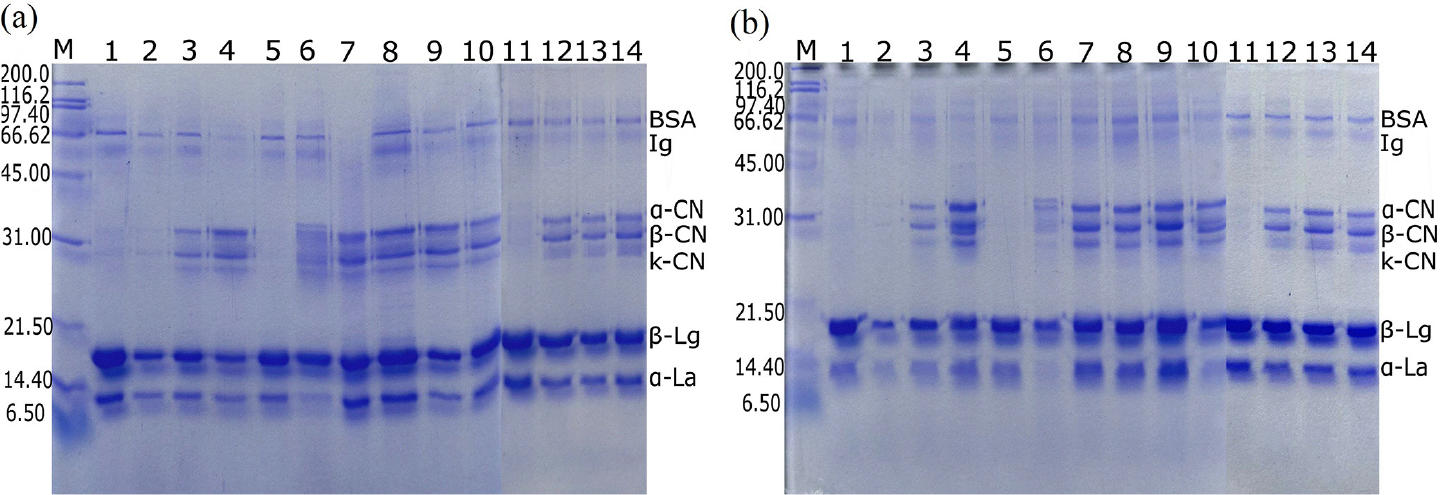
In the analyzed commercial ricotta cheese samples, the proteins β-Lg, α-La, α-CN, β-CN, κ-CN, BSA, and Ig were identified. However, the casein bands were absent in samples 1, 2, 5, and 11 after 15 and 30 days of storage (Figure 4). This may be related to the manufacturing process, which obligatorily uses whey and optionally milk, influencing the amount of caseins in the final product. Additionally, proteolytic degradation during storage, caused by enzymes or microbial activity, may hydrolyze these proteins, making them undetectable in electrophoresis.
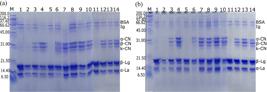
Electrophoretic profiles of commercial ricotta cheese samples at different storage times: (a) 15 days and (b) 30 days; β-Lg: lactoglobulin; α-La: α-lactalbumin; α-CN: α-casein; β-CN: β-casein; κ-CN: κ-casein; BSA: bovine serum albumin; Ig: immunoglobulin; M: molecular weight marker (kDa).
For the analyzed commercial samples by electrophoresis at storage times of 15 and 30 days, it was not possible to identify potential adulterations. The absence of a characteristic protein specific to buffalo or cow milk in the produced samples makes the evaluation of commercial samples more difficult. Without this protein marker, it is not possible to establish a clear comparison standard or to precisely differentiate between the two types of milk.
The main practical implication of the electrophoretic profile is that the method, in isolation, proved limited to act as a robust tool for quality control or for the conclusive detection of adulteration in commercial samples. The absence of a clear protein marker that differentiates buffalo and cow ricotta cheese makes the inspection routine based solely on electrophoresis challenging for regulatory agencies.
The differences in the profiles of the produced samples and commercial samples can be explained by various factors. Commercial samples may contain additives or preservatives, or undergo variations in the manufacturing process, altering the protein profile. Additionally, storage and transport conditions for the commercial samples, such as temperature and humidity, may affect protein structure. However, the presence of adulterants in the commercial samples could also contribute to these variations.
Conclusions
The practical implications of these findings are significant, even as they demonstrate the limitations of conventional methods (compositional analysis, chemical characterization, and electrophoresis) in ensuring the authenticity of commercial samples. Furthermore, the heterogeneity observed in the composition of commercial samples highlights the need for rigorous regulatory enforcement to ensure compliance with identity and quality standards. These findings emphasize the importance of further investigations and the integration of more sensitive analytical techniques, such as combining MIR with other advanced methodologies, to enhance fraud detection and ensure product authenticity.
Supplementary Information
Supplementary material 1
Supplementary data (average values of chemical composition and chemical characteristics, external mean, equations, and regression coefficients for buffalo ricotta cheese with different CW concentrations, evaluated at 0, 15, and 30 days of storage) are available free of charge at http://jbcs.sbq.org.br as a PDF file.
Acknowledgments
The authors thank the Coordenação de Aperfeiçoamento de Pessoal de Nível Superior (CAPES) for granting scholarships to the Universidade Estadual do Sudoeste da Bahia (UESB), the Postgraduate Program in Food Engineering and Science, and the Cabana da Ponte dairy for kindly providing buffalo milk for obtaining whey.
Data Availability Statement
The authors confirm that all data generated and analyzed during this study are accessible in the article and supplementary information.
References
-
1 Mangione, G.; Caccamo, M.; Natalello, A.; Licitra, G.; J. Dairy Sci. 2023, 106, 3807. [Crossref]
» Crossref -
2 Foschi, M.; Biancolillo, A.; Reale, S.; Poles, F.; D’archivio, A. A.; J. Food Compos. Anal. 2025, 138, 107019. [Crossref]
» Crossref -
3 Pizzillo, M.; Claps, S.; Cifuni, G. F.; Fedele, V.; Rubino, R.; Livest. Prod. Sci. 2005, 94, 33. [Crossref]
» Crossref -
4 Mejares, C. T.; Huppertz, T.; Chandrapala, J.; Int. Dairy J. 2023, 141, 105627. [Crossref]
» Crossref -
5 Pantoja, L. S. G.; Amante, E. R.; Rodrigues, A. M. C.; Silva, L. H.; J. Cleaner Prod. 2022, 364, 132605. [Crossref]
» Crossref -
6 Camerini, S.; Montepeloso, E.; Casella, M.; Crescenzi, M.; Marianella, R. M.; Fuselli, F.; Food Chem. 2016, 197, 1240. [Crossref]
» Crossref -
7 Hong, E.; Lee, S. Y.; Jeong, J. Y.; Park, J. M.; Kim, B. H.; Kwon, K.; Chun, H. S.; J. Sci. Food Agric. 2017, 97, 3877. [Crossref]
» Crossref -
8 Lopez-Calleja, I. M.; Gonzalez, I.; Fajardo, V.; Hernandez, P. E.; Garcia, T.; Martin, R.; Int. Dairy J. 2007, 17, 87. [Crossref]
» Crossref -
9 Ren, Q. R.; Zhang, H.; Guo, H. Y.; Jiang, L.; Tian, M.; Ren, F. Z.; J. Dairy Sci. 2014, 97, 6000. [Crossref]
» Crossref -
10 Gonçalves, B. R. F.; Silva, G. J.; Conceição, D. G.; do Egito, A. S.; Ferrão, S. P. B.; Cien. Agrar. 2017, 38, 1841. [Crossref]
» Crossref -
11 Mayer, H. K.; Burger, J.; Kaar, N.; Anal. Bioanal. Chem. 2012, 403, 3031. [Crossref]
» Crossref -
12 Ji, Z.; Zhang, J.; Deng, C.; Hu, Z.; Du, Q.; Guo, T.; Wang, J.; Fan, R.; Han, R.; Yang, Y.; Food Chem. 2023, 405, 134901. [Crossref]
» Crossref -
13 Jia, W.; Dong, X.; Shi, L.; Chu, X.; J. Agric. Food Chem. 2020, 68, 6638. [Crossref]
» Crossref -
14 Gonçalves, B. R. F.; Silva, G. J.; Jesus, J. C.; Conceição, D. G.; Santos, L. S.; Ferrão, S. P. B.; J. Braz. Chem. Soc. 2020, 31, 1453. [Crossref]
» Crossref -
15 Tolentino, I. C. S. A.; Jesus, J. C.; Conceição, D. G.; Oneli, R. R. V.; Reis, L. C. C.; Santos, L. S.; Ferrão, S. P. B.; Int. Dairy J. 2023, 142, 105643. [Crossref]
» Crossref -
16 Andreatta, E.; Fernandes, A. M.; Santos, M. V.; Mussarelli, C.; Marques, M. C.; Gigante, M. L.; de Oliveira, C. A. F.; Food Technol. 2009, 44, 320. [Crossref]
» Crossref -
17 Ministério da Agricultura, do Abastecimento e da Reforma Agrária (MAPA); Instrução Normativa No. 65, de 21 de julho de 2020, Dispõe sobre a Identidade e os Requisitos de Qualidade que Deve Apresentar o Produto Denominado Ricota; Diário Oficial da União (DOU), Brasília, 2020. [Link] accessed in February 2026
» Link -
18 Association of Official Analytical Chemists (AOAC); Official Methods of Analysis of AOAC International, 18th ed.; AOAC International: Maryland, 2005. [Link] accessed in February 2026
» Link -
19 Egito, A. S.; Girardet, J. M.; Laguna, L. E.; Poirson, C.; Mollé, D.; Miclo, L.; Humbert, G.; Gaillard, J. L.; Int. Dairy J. 2007, 17, 816. [Crossref]
» Crossref - 20 Statistical Analysis System (SAS), Student version; SAS Institute Inc., USA, 2018.
-
21 Mohammadi, F.; Yousefi, M.; Heliyon 2023, 9, 21564. [Crossref]
» Crossref - 22 Barbosa, L. C. A.; Espectroscopia no Infravermelho na Caracterização de Compostos Orgânicos, vol. 1, 2nd ed.; Editora UFV: Viçosa, Brasil, 2007.
-
23 Coates, J. In Encyclopedia of Analytical Chemistry: Applications, Theory and Instrumentation; Meyers, R. A., ed.; John Wiley & Sons: Chichester, USA, 2006. [Link] accessed in February 2026
» Link -
24 Ricciardi, F. E.; Plazzotta, S.; Conte, A.; Manzocco, L.; Food Sci. Technol. 2021, 139, 110556. [Crossref]
» Crossref -
25 Shelke, P. A.; Sabikhi, L.; Khetra, Y.; Ganguly, S.; Baig, D.; Food Sci. Technol. 2022, 162, 113405. [Crossref]
» Crossref
Edited by
-
Editor handled this article:
Paula Homem de Mello (Executive)