 A Chemometric Method to Quickly and Efficiently Guarantee the Authenticity of Commercialized Cigarettes in Brazil
Abstract
Cigarette smuggling and counterfeiting undermine public health and border security. Conventional analytical methods are expensive, non-specific and often ignore multicollinearity and robust validation. No current supervised multiclass model meets forensic laboratory needs for simplicity and scalability. In this context, this study proposed a cheaper and faster novel chemometric method to confirm the origin of cigarette brands marketed in Brazil. The method employs ultrasonic extraction using dichloromethane followed by gas chromatography coupled to flame ionization detection (GC FID), and full chromatographic fingerprints (peak areas and retention times) aligned with the R package GCalignR. This method developed can captures and exploits a larger number of chromatographic peaks, thereby providing greater chemical information per sample than conventional targeted analytical approaches. The aligned data were used in a Hierarchical Cluster Analysis (HCA) for exploratory grouping and in a Linear Discriminant Analysis (LDA) for supervised classification. Model validation employed train/test partitioning and a one vs one receiver operating characteristic (ROC) analysis, yielding area under the curve (AUCs) > 0.95 for all classes and cross validated accuracy > 90%. The workflow requires under 15 min of sample preparation per batch and can be automated for high throughput screening in standard analytical laboratories. The method validation results demonstrated high sensitivity, accuracy, and AUC confirming the robustness of the model and strong potential for use as a practical, predictive, and scalable forensic screening tool in regulatory and enforcement settings. This cost effective, quick and predictive method fills a critical gap, providing agencies with a robust workflow that is both operationally practical and easily integrated into routine analytical environments.
Keywords:
cigarettes; counterfeiting; extraction; linear discriminant analysis; smuggling
Introduction
Cigarette authenticity involves both economic aspects and consumer health concerns. Cigarette brands may differ not only in retail price but also in the levels of potentially harmful substances.1,2 Thus, verifying the accuracy of cigarette labeling and identifying illegal products are analytical challenges that warrant investigation.
Recent data indicate that approximately 11% of all cigarettes consumed globally are sourced through smuggling.3 In Latin America, the cigarette market has made smuggling an especially attractive and profitable activity due to the easy transport and high profit margins of this product.4 In Brazil, over 30% of consumed cigarettes originate from smuggling, with rates reaching up to 60% in border regions with Paraguay.5,6 The Brazilian scenario is further complicated by the presence of five major categories of cigarettes consumed by the population: (i) smuggled brands, (ii) brands that have lost their health registration, (iii) products from large multinational companies, (iv) brands produced by small local companies involved in illicit activities, and (v) counterfeit brands.4
Regarding counterfeit products, a documented expansion of clandestine factories producing illicit cigarettes has been noted.7 These operations replicate the packaging of Paraguayan brands, supplying the domestic market and exporting these illegal products.7 This form of counterfeiting has proven highly profitable, given the established presence of Paraguayan cigarettes in both national and international markets. By reproducing these brands, criminal groups avoid Brazilian taxation, which can exceed 90% of the retail price depending on the state, as well as Paraguay’s 18% cigarette tax. Furthermore, this strategy helps circumvent risks associated with cross-border smuggling, such as the seizure of goods on federal and state highways.7 In 2021 alone, nine illegal factories were discovered in Brazil, jointly producing approximately 5.3 billion counterfeit cigarettes mimicking Paraguayan brands, according to police and customs enforcement agencies.7 Besides revenue losses at the state and federal levels, this illegal trade is also associated to labor violations.7
Currently, cigarette packaging analysis in Brazil is primarily conducted through visual inspection to verify the presence of mandatory information, such as health warnings, minimum age for consumption, manufacturing date, lot number, hotline contact, and the Federal Revenue’s IPI seal, which aims to prevent illegal trade.7 Cigarettes are classified based on visual and sensory characteristics, such as taste and aroma, comprising a subjective approach that may compromise the reliability of results. Moreover, the commercialization of cigarette brands in Brazil requires the registration of a representative company with Brazil’s National Health Surveillance Agency (ANVISA). To date, however, no chemical analysis tools are available to support forensic reports in identifying counterfeit, smuggled, or unregistered products.7
Reverse tobacco smuggling from Paraguay to Brazil also takes place. Based on production and trade data from 1970 to 1998, Shafey et al.8 revealed an increase in cigarette exports from Brazil to Paraguay from 1 to 51% of the national production, followed by the re-entry of large volumes into the Brazilian market through untaxed smuggling characterizing a “reverse smuggling” phenomenon. More recently, Cresta et al.9 estimated that the cigarette production of Paraguay surplus averaged 2.5 billion packs per year between 2008 and 2019, far exceeding domestic demands and legal exports, suggesting the systematic diversion of these products to the Brazilian illicit market. Value chain assessments also report significant discrepancies between the availability of unprocessed tobacco in Brazil and the volume of taxed cigarette production, indicating that part of the legally cultivated raw material is diverted into illicit trade.9 This dynamic is further supported by findings that Brazilian input suppliers, who operate without strict export controls, providing raw materials to Paraguayan manufacturers, who then reintroduce these products into Brazil as smuggled cigarettes, constituting a complex transnational network of reverse smuggling.9
Several studies have employed instrumental techniques to obtain more objective and reliable assessments of cigarette samples, applying liquid chromatography (LC MS),10-12 inductively coupled plasma mass spectrometry (ICP MS),13 inductively coupled plasma optical emission spectrometry (ICP OES),14,15 nuclear magnetic resonance (NMR),16 single-photon ionization time-of-flight mass spectrometry by pyrolysis (Py SPI TOFMS),17 and near-infrared reflectance spectroscopy (NIR).18
An alternative to these quantitative approaches is a qualitative assessment that considers a wide variety of organic compounds in the sample. This strategy allows for even analytical interferences, present in different amounts, to contribute to product origin determinations. Additionally, including a qualitative or semi-quantitative analysis of a broader range of variables can significantly enhance the discriminatory power of statistical tools. However, most studies focus primarily on major organic compounds such as n-alkanes or nicotine,19 neglecting the more than 20,000 organic substances that may be present in cigarettes.20,21
Dichloromethane (DCM, CH2Cl2) is widely employed in the literature as an extraction solvent for organic compounds in tobacco owing to its effectiveness in recovering volatile and semi-volatile constituents from both the free and the bound fractions of the matrix.22,23 Studies using techniques such as simultaneous distillation-extraction (SDE) and Soxhlet extraction followed by gas chromatographic analysis have demonstrated that DCM produces comprehensive and reproducible chromatographic profiles, making it suitable for the determination of retention times as reliable analytical variables.22,23
Accordingly, the present study sought to establish a rapid and user-friendly method for differentiating cigarette brands across the five categories described above. The approach combines ultrasound-bath extraction of organic compounds with subsequent chemometric modeling. Different chemometric tools were applied for the data analysis, including (i) the GCalignR package, (ii) Hierarchical Cluster Analysis (HCA), and (iii) Linear Discriminant Analysis (LDA). The predictive model was validated based on sensitivity, specificity, accuracy, and receiver operating characteristic (ROC) curve construction.
Experimental
Chemicals and reagents
All employed chemicals were of analytical reagent grade. Stabilized dichloromethane (CAS 75-09-2, ≥ 99.9%, by GC SUPRASOLV hypergrade) for trace organic analysis was used for ultrasonic extraction. A 2 mL internal standard solution (125 μg mL-1 of deuterated n-C24) were prepared by serial dilution from a 500 μg mL-1 stock solution (CAS 16416-32-3, isotopic enrichment ≥ 98%, Sigma-Aldrich) in n-hexane (CAS 110-54-3; high performance liquid chromatography (HPLC) grade, ≥ 99.5%, Sigma-Aldrich). The internal standard was employed to align retention times (tR) and normalize peak areas.
Cigarette sampling
Thirty-two cigarette brands representative of the Brazilian market were selected,24,25 categorized into five distinct groups: (i) multinational brands (Multinational), (ii) regional brands (Regional), (iii) smuggled Paraguayan brands (Paraguay), (iv) counterfeit versions of Paraguayan brands (Counterfeit), and (v) unregistered national brands (No Health Registration). Each sample was analyzed in triplicate, totaling 96 valid datasets (comprising 11, 8, 7, 3, and 3 samples, respectively). Cigarette samples were purchased from tobacconists, supermarkets, and street vendors, and were stored in a desiccator until analysis.
Ultrasonic bath-assisted extraction
For each brand, one pack containing 20 cigarettes was opened and the paper wrappers and filters were removed from all cigarettes. The combined tobacco from each pack weighed approximately 12 g. From each pack, three replicate aliquots of ca. 1.0 g of shredded tobacco were weighed into 100 mL beakers. Each aliquot was placed in an ultrasonic bath (Elmasonic Easy 60 H, 37 kHz) and extraction was carried out in three consecutive cycles, each lasting 5 min and employing 10 mL of dichloromethane per cycle. The triplicates were then brought to a final volume of 50 mL and a 1 mL aliquot of each extract was filtered using a 2 mL glass syringe fitted with a 0.22 μm Millex® filter (Merck, Darmstadt, Germany). The filtered extracts were transferred to 2 mL vials, and 20 μL of deuterated n-C24 internal standard solution (125 ng μL-1) was added. Samples were then analyzed by gas chromatography coupled to flame ionization detection (GC-FID) for organic compound quantification. Procedural blanks were included in each batch and processed alongside the samples as quality control measures.
Gas chromatography coupled to flame ionization detection (GC-FID)
Samples were injected into the GC-FID under the conditions detailed in Table 1. The internal standard (IS) was used to monitor drift, align chromatograms, and calculate the relative peak areas (compound area/IS area).
Chromatographic conditions for the determination of organic compounds present in different cigarette brands representative of the Brazilian market
Statistical analyses
GcalignR package theory
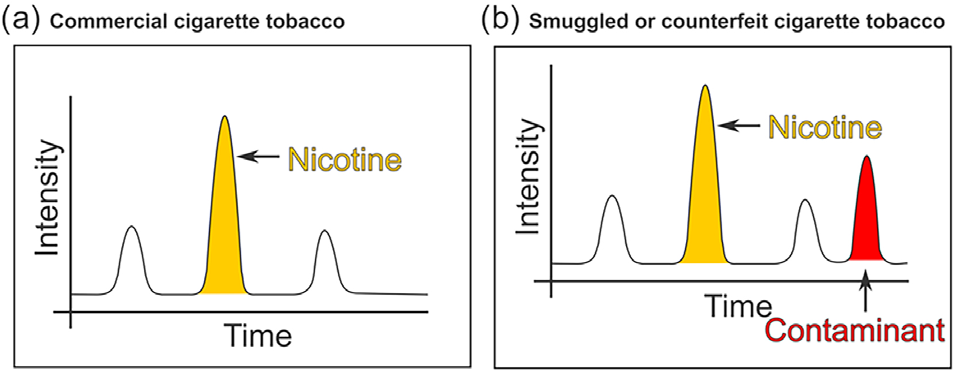
During a chromatographic run, the tR of the same compound may have slight variations due to several factors, including column aging, carrier gas flow fluctuations and system temperature instabilities. Although these effects can be minimized through good laboratory practices, they cannot always be entirely eliminated. In such cases, the use of the GCalignR package becomes particularly relevant, especially when assessing the chemical similarity among multiple samples. To ensure reliable comparisons, adequate alignment of peaks corresponding to the same compounds across samples is essential. Figure 1 illustrates the use of the GcalignR package for chromatographic data alignment as employed herein.
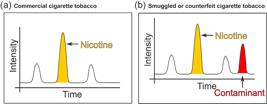
Hypothetical chromatogram of cigarette tobacco samples (n = illustrative), highlighting a contaminant peak. This figure is intended to illustrate potential impurities or unexpected compounds in tobacco samples analyzed in this study.
The first chromatogram (Figure 1a) depicts a representative tobacco sample presenting three distinct peaks, namely a main peak corresponding to nicotine and two minor peaks attributed to secondary compounds commonly found in this matrix. This chromatogram serves as an example for the expected chemical profile of an authentic, unadulterated sample. In the second chromatogram (Figure 1b), the original three peaks remain unchanged in both tR and area, but a fourth peak is observed, visually distinguished by a different color. This new signal is interpreted as a contaminant, indicating a possible alteration in the composition of the sample due to contamination, intentional adulteration, or natural variability among production batches.
In this sense, the manufacturing process must be considered to understand how different cigarette brands may present varying chromatograms. The tobacco used in cigarettes is typically a blend of different tobacco types and grades, each undergoing specific cultivation and curing practices. Furthermore, the chemical composition of this substance is subject to seasonal variations and crop differences. Manufacturers also commonly add humectants, sugars, starches, and preservatives, all of which can contribute to differences in the organic compounds present in the final product, leading to brand-specific chromatographic profiles.26-28
The visualization of interfering compounds highlights the potential of gas chromatography not only for identifying target substances but also for qualitatively distinguishing complex chemical profiles. To enable statistically robust comparisons between chromatograms, peak alignment based on tR and normalization of relative peak areas are essential to correct for experimental variations such as injection volume or detector response, ensuring that all resolved compounds are consistently treated in multivariate analyses, enhancing the sensitivity and specificity of the method.29,30 In this context, the GCalignR package was employed to automate the alignment and standardization of chromatographic data, allowing for more accurate, reproducible, and appropriate statistical analyses in studies focused on product authentication, quality control, and traceability.31
The chromatographic alignment generates a data matrix in which columns correspond to the tR of peaks detected in the reference sample, which are automatically selected by the algorithm based on global similarity across chromatographic profiles. Rows represent the temporal shifts of corresponding peaks in the other samples relative to the reference. Each cell in the matrix therefore reflects the retention time difference between a given sample and the reference. To reach normality and homoscedasticity assumptions, which are essential for multivariate statistical methods, a logarithmic transformation [log (x + 1)] was applied to the matrix values.31
Linear Discriminant Analysis (LDA)
Following peak alignment, the chromatographic data were normalized as a preprocessing step to account for differences in compound concentration among cigarette samples.32 The GCalignR developers recommend non-metric multidimensional scaling (NMDS) as a standard tool for multivariate analysis and interpretation, comprising a distance-based ordination technique that builds a distance matrix to visualize sample similarity.32
In this study, however, the LDA was selected over NMDS. While NMDS is an unsupervised, exploratory technique that visualizes general sample similarities without considering pre-assigned class labels, the LDA is a supervised approach that explicitly uses known sample categories to maximize separation between groups, constructing discriminant functions that optimize between-group variance while minimizing within-group variance. This allows not only for the projection of chromatographic profiles into a low-dimensional space, but also for the development of objective classification rules, i.e., cutoff values and linear functions, that can be used to predict the class of unknown samples. In addition, the LDA enables the calculation of predictive performance metrics, including sensitivity, specificity, accuracy, ROC curves, and area under the curve (AUC), which are crucial for model validation and comparison. In contrast, an NMDS does not generate a formal predictive model or provide quantitative evaluation of classification performance on independent datasets. Therefore, an LDA was applied herein due to its ability to reduce dimensionality while supporting interpretability and predictive generalization.
The LDA classification method relies on Mahalanobis distance,33,34 which is used to assign a given object to one of c possible classes. With x = [x1, x2, ... xd]T comprising a vector representing an observation to be classified. In the context of GC-FID data, each variable x1, x2, ... xd corresponds to a tR measurement that has been aligned and normalized. The squared Mahalanobis distance r2(x, j) between the vector x and the centroid of the j-th class (where j = 1, 2, ..., c) is defined as:
where μj (d × 1) and Σj(d × d) are the mean vector and the covariance matrix for the considered class.35
When the true population mean and covariance values are unknown, as is typically the case, maximum likelihood estimates mj and Sj can be used in place of μj and Σj(d × d), respectively. These estimates are obtained from a finite set of training samples with known class labels.36 It is important to note that the LDA estimates a single pooled covariance matrix S, instead of computing separate covariance matrices for each class. This regularization step simplifies the classification model and results in linear decision surfaces (hyperplanes) in rd.37-39 With this modification, the squared Mahalanobis distance between a x and the centroid of the jth class is calculated as follows:
The object x (cigarette samples) is then assigned to class j (cigarettes groups), in which r2 (x, mj) displays the lowest value.
Model validation
Unlike models limited to binary classification, the LDA is intrinsically multiclass, making it well-suited for more complex problems involving multiple categories simultaneously. It was applied herein to classify samples into five cigarette brand groups: Multinational, Unregistered, Regional, Counterfeit, and Smuggled.
To evaluate model performance, a combined validation strategy was employed, integrating both data partitioning and ROC curve analysis with AUC metrics, to ensure robustness and reliability. The dataset was split into two subsets, 70% for training and 30% for testing. The training set was used to fit the model, enabling LDA to learn the discriminant patterns among classes, while the test set simulated a real-world scenario, where the model is evaluated on previously unseen data. This partitioning approach reduces the risk of overfitting, wherein a model might memorize training data but perform poorly on new observations. Since the test dataset contained more variables than samples, multicollinearity among variables was assessed. A threshold of r ≥ 0.5 was adopted, reducing the final set to 85 effective variables.
Evaluating multiclass model performance with ROC and AUC metrics requires methodological adaptations, as traditional ROC curves are designed for binary classification. Therefore, a one-vs-one strategy was employed, in which the model is evaluated across all unique binary class combinations. With five classes, this yields ten pairwise comparisons (e.g., Multinational vs. Counterfeit, Regional vs. Smuggled, etc.). For each pair, the model is treated as a binary classifier and evaluated accordingly. The ROC curves and corresponding AUC values are calculated independently for each pair, reflecting the ability of the model to distinguish between those two specific classes. This approach mitigates class imbalance effects, offering a more balanced evaluation of discriminatory performance.
Combining data partitioning with one-vs-one ROC/AUC analysis results in a rigorous and detailed validation. Partitioning ensures the model is tested on unseen data, assessing generalizability, while ROC curves and AUC scores provide quantitative metrics of discriminative performance for each class comparison. When adequately implemented with a balanced dataset, this dual strategy offers a much deeper and more reliable insight than simply reporting overall accuracy.
Thus, the multiclass LDA model validation involved (i) partitioning the dataset into 70% training and 30% testing subsets, (ii) applying the LDA model to the training data, (iii) using the trained model to predict class labels for the test data and constructing a confusion matrix; (iv) employing a one-vs-one strategy to construct ROC curves and compute AUC for all class pairs and (v) interpreting these metrics to assess the discriminative performance of the model. This approach enables both stringent validation and nuanced interpretation of the model’s real-world classification capabilities across complex, multivariate scenarios.
Results and Discussion
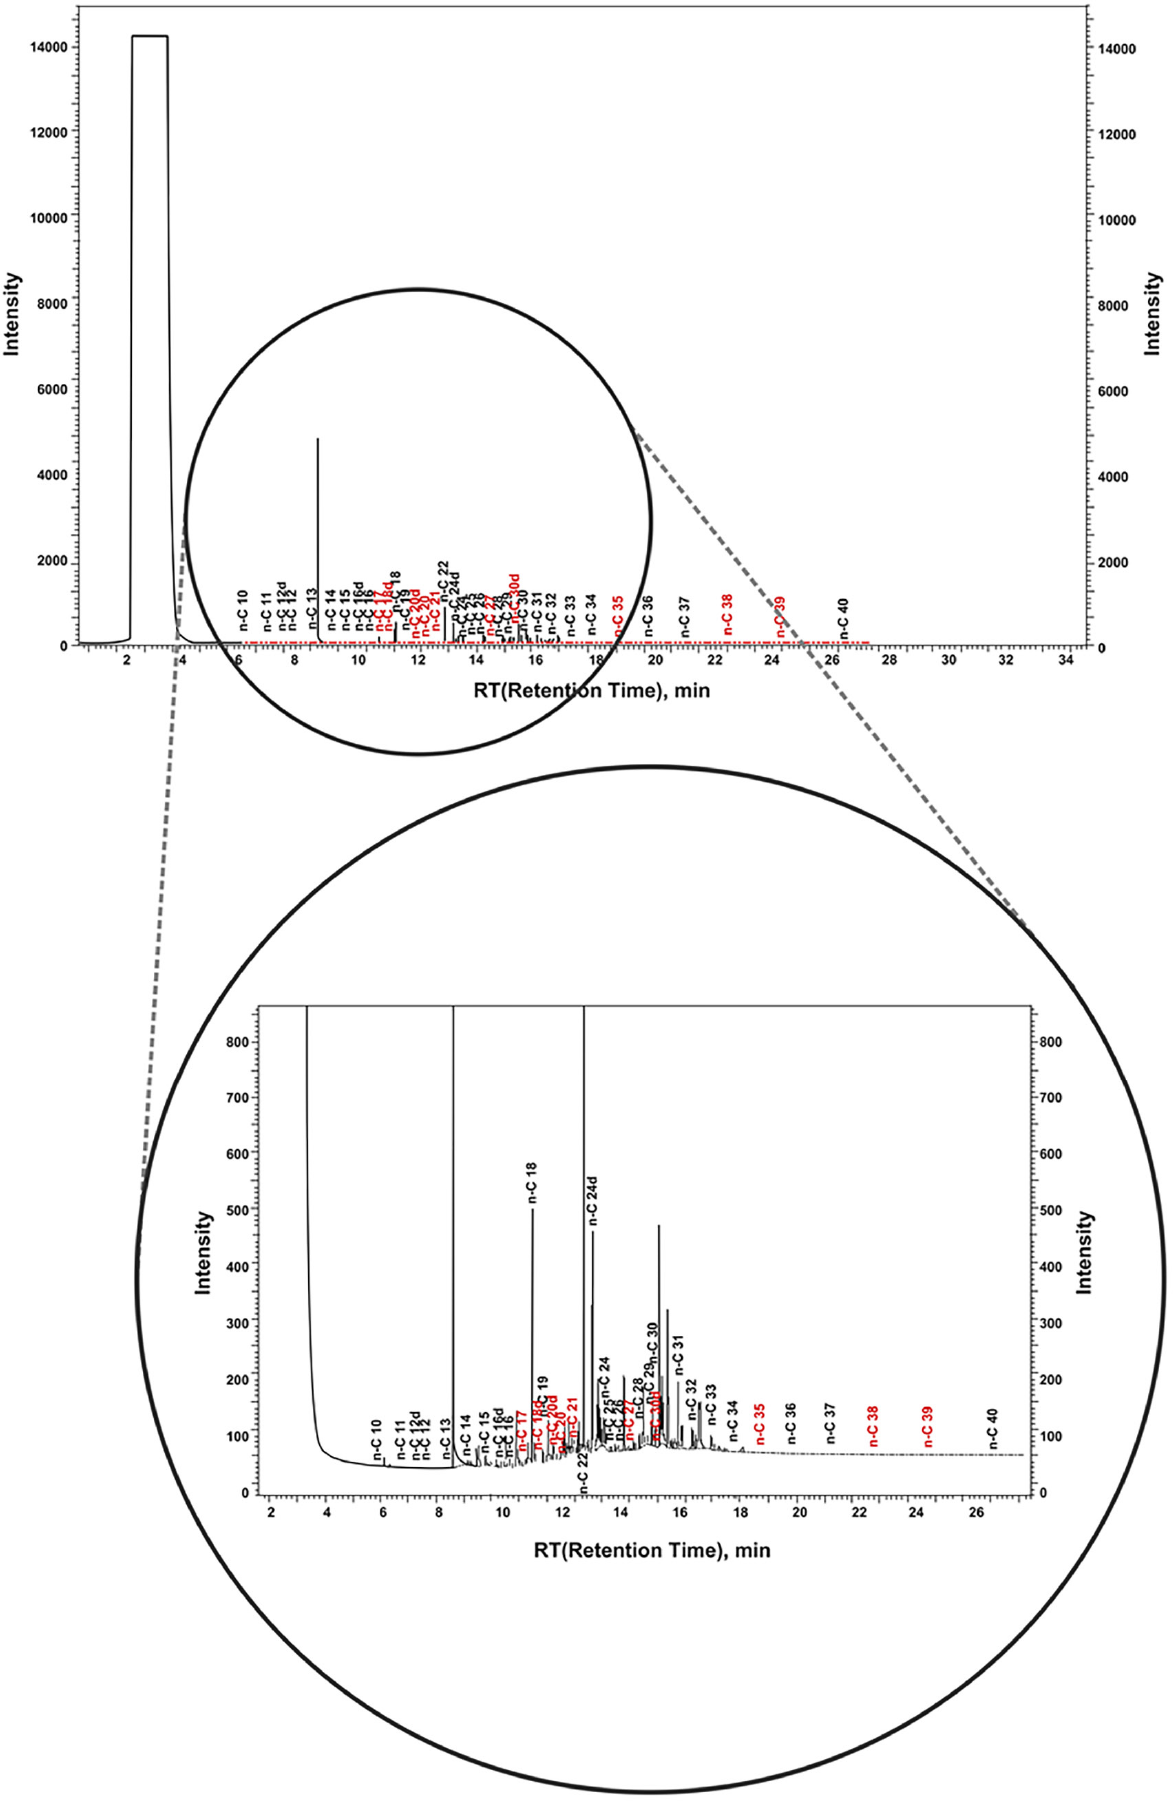
A total of 102 injections (32 brands analyzed in triplicate plus 6 control injections) yielded 275 ± 13 chromatographic peaks. An tR threshold of ≤ 10 min was established to exclude early eluting peaks, since the solvent eluted around tR ca. 6 min and no high-intensity peaks were observed between 6 < tR < 10 min, except for the nicotine peak, which was present in all samples analyzed and did not constitute a peak of interest in this research. After applying chromatographic alignment and filtering, a total of 124 effective peaks remained. An example of the obtained chromatograms for the investigated cigarettes is depicted in Figure 2.
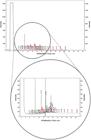
Representative chromatograms obtained for cigarette samples (n = 1 sample) analyzed using the ultrasound-assisted extraction followed by gas chromatography-flame ionization detection (UAE-GC-FID) method. The chromatograms show the separation and profile of the main chemical components present in the samples.
All alignment procedures, as described in Supplementary Information section, were successfully executed, resulting in excellent chromatographic alignment. Subsequently, a log transformation [log (x + 1)] was applied, as previously described, followed by the removal of covariances among variables. To eliminate collinear variables, a correlation threshold of r ≥ 0.5 was applied to detect strong correlation tendencies. As a result, the dataset used in the method was reduced to 85 variables and 96 total samples.
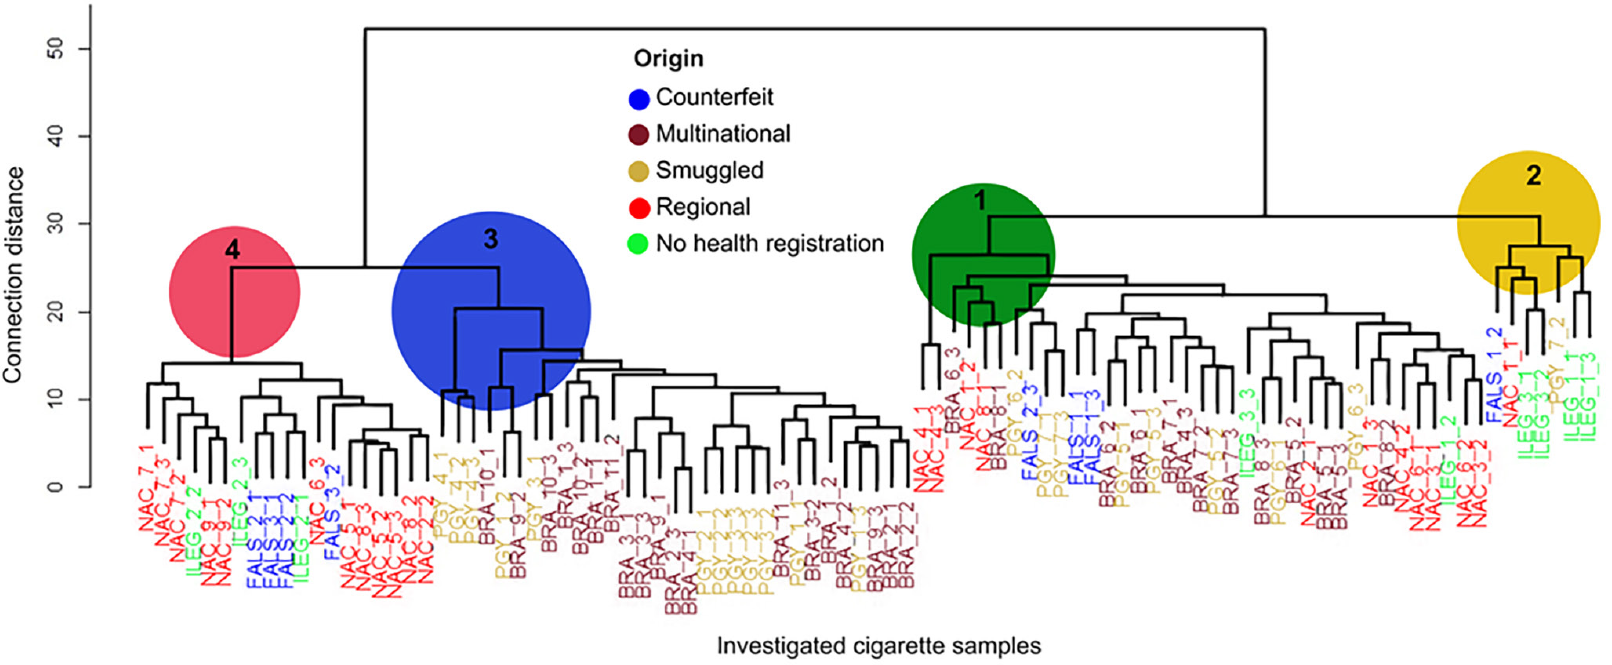
By exploring the complete chromatographic profile rather than a restricted list of targeted analytes, the method captures subtle chemical differences among cigarette brands that targeted approaches might overlook. This comprehensive strategy not only enhances classification accuracy but also sets a new standard for method validation in chemometric studies of tobacco products. Following multicollinearity testing, an unsupervised cluster analysis was performed to examine potential proximities among the studied cigarette brand groups. Clusters were formed based on Euclidean distance using Ward’s method (Figure 3).

Clusters of cigarette samples (n = 96 samples) obtained from UAE-GC-FID analysis, showing the grouping of different brands based on their chemical composition. Distinct clusters indicate clear differentiation among brands.
In general, the cluster analysis only revealed proximity patterns between groups without clearly distinguishing them. An interesting observation is the proximity between multinational brands and Paraguayan brands, as well as between replicates of regional brands, unregistered products, and counterfeit brands.
LDA and cigarette brand discrimination
The LDA identified four linear discriminants, which together explained 100% of the variability in the dataset. Figure 4 presents the variance accounted for by each linear discriminant.
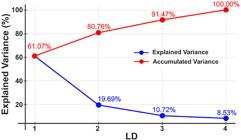
Summary of Linear Discriminant Analysis (LDA) values characterizing the studied cigarette samples (n = 96 samples). The figure shows the discriminant scores used to differentiate brands and indicates which variables contribute most to sample discrimination.
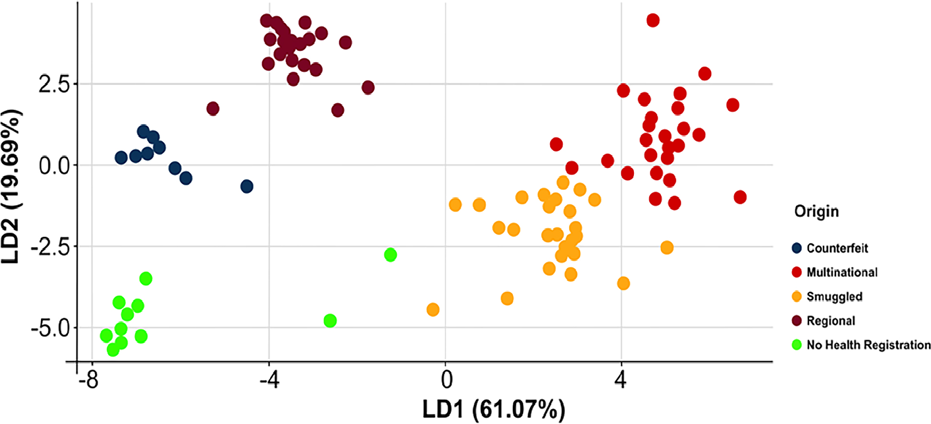
Figure 5 displays a scatterplot of the first versus the second linear discriminant, with group labels indicating the spatial distribution and interrelationships among the cigarette brand categories. Figure 6 presents a confusion matrix based on the complete sample database.

Plot of the first linear discriminant versus the second linear discriminant from the extract analysis of cigarette samples (n = 96 samples). The figure demonstrates the separation among brands and the relative position of each sample in the discriminant space.
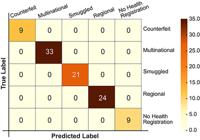
Confusion matrix for the complete database of cigarette samples (n = 96 samples), presented in absolute values. This figure shows the classification accuracy of each brand using the developed LDA method, highlighting correctly and incorrectly classified samples.
The proposed multiclass model achieved 100% classification accuracy, demonstrating strong discriminative power despite the chemical and structural complexities inherent to different manufacturing processes. Moreover, counterfeit brands clustered closely with regional brands, suggesting shared production practices and raw materials. This proximity supports the hypothesis that regional and counterfeit cigarettes follow interconnected manufacturing routes, either through shared suppliers or analogous processing stages. These findings highlight the potential of chemometric treatment based on aligned chromatographic profiles to distinguish cigarette groups that targeted approaches fail to separate.
Validation of the linear discriminant analysis model
Validation via training - test set partitioning
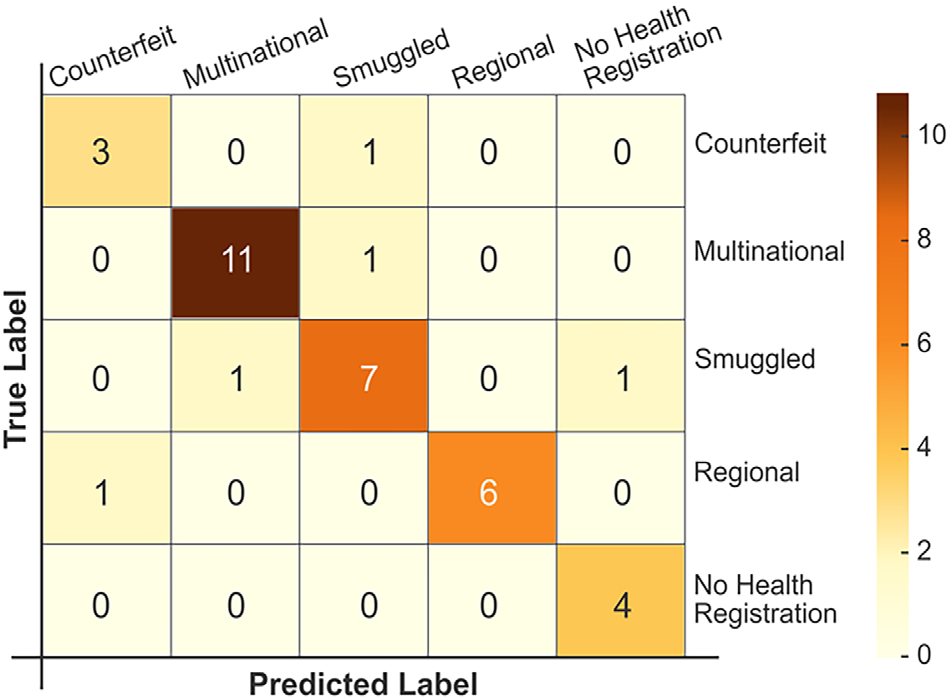
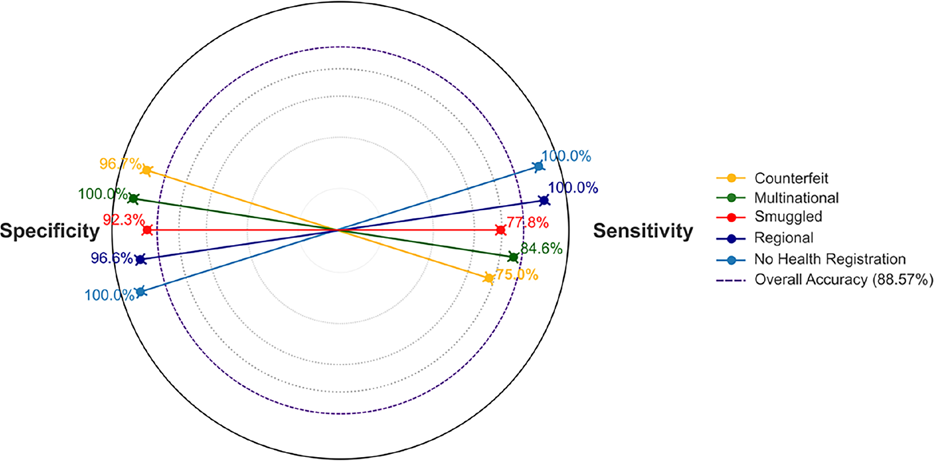
To evaluate the effectiveness of the proposed chemometric model, the dataset was partitioned into training (70%) and test (30%) subsets. The LDA model was fitted to the training data and then used to predict class labels for the test set; a confusion matrix was constructed by comparing predicted and true labels. Sensitivity (true positive rate) and specificity (true negative rate) were computed for each class using a one-vs-rest scheme: sensitivity denotes the proportion of true positives for a given class correctly identified by the classifier, while specificity denotes the proportion of true negatives for that class correctly rejected. Both metrics are unitless and range from 0 to 1, with higher values indicating superior classification performance.40 Per-class sensitivity and specificity values were employed as primary metrics to assess the reliability and robustness of the proposed model. Figures 7 and 8 present the results of the trained model to predict class labels for the test data.
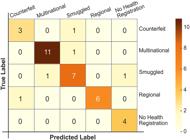
Confusion matrix for the test set of cigarette samples (n = 36 samples), applying Linear Discriminant Analysis (LDA) in absolute values. The figure illustrates the predictive performance of the model for unseen samples, indicating model reliability.
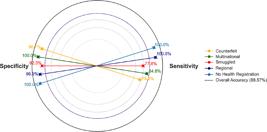
Radar chart representing the discrimination of cigarette brands (n = 36 samples) using the developed LDA method, expressed in percentage values (%). The chart highlights differences among brands across multiple chemical variables.
The results presented in Figures 7 and 8 show that the LDA model applied to the test set, using 85 chromatographic peaks free of multicollinearity, demonstrated strong discriminative power in classifying the five cigarette categories. The confusion matrix (Figure 7) indicates that the “Regional” and “No Health Registration” groups were classified with near-perfect accuracy, showing only a single misclassification of one “Regional” sample as “Counterfeit” and no errors in the “No Health Registration” group. Similarly, the “Multinational” and “Counterfeit” groups exhibited high classification precision, with only one sample from each group misclassified as “Smuggled.” This suggests a high degree of chemical similarity between legally produced multinational brands and contraband cigarettes, supporting the hypothesis of reverse smuggling. The “Smuggled” group showed two false negatives, namely one sample misclassified as “Multinational” and another as “No Health Registration”, indicating a more diffuse boundary between these groups.
Regarding performance metrics (Figure 8), sensitivity ranged from 75% for “Counterfeit” to 100% for both “Regional” and “No Health Registration”, while specificity reached up to 100% for the “Multinational” and “No Health Registration” groups. The overall classification accuracy was 88.6%. These findings confirm that using chromatographic profiles with careful covariance control not only enhances classification power but also reduces the risk of overfitting. A key limitation, however, is the small overlap between “Multinational” and “Smuggled,” (9.5%) which may require complementary analyses for more definitive separation.
ROC curve analysis and AUC evaluation
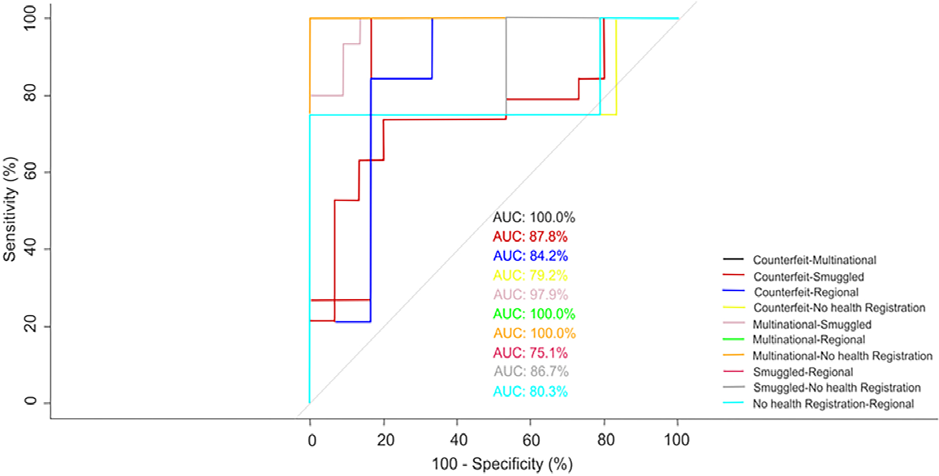
Receiver operating characteristic (ROC) curves were produced from the LDA model’s predicted labels on the test dataset by applying a one-vs-one pairwise approach; the corresponding AUCs were then calculated for each class pair (Figure 9).
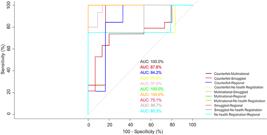
Receiver operating characteristic (ROC) curves for the multiclass classification of cigarette samples (n = 36), assessing the sensitivity and specificity of the developed method for each brand. The curves indicate the overall performance of the classification model.
The ROC curve analysis (Figure 9) confirms and deepens the findings presented in Figures 7 and 8. An AUC of 100% was observed in the comparisons between Counterfeit vs. Multinational, Multinational vs. Regional, and Multinational vs. No Health Registration, which corroborates the high sensitivity (> 84.6%) and specificity (100%) rates obtained for the Multinational class (Figure 6), as well as the near absence of misclassifications in the confusion matrix (Figure 7). On the other hand, the lowest AUC values were recorded for Smuggled vs. Regional (75.1%), Counterfeit vs. No Health Registration (79.2%), and No Health Registration vs. Regional (80.3%) groups, indicating less distinct decision boundaries between these classes. In particular, the Smuggled-Regional pair, which showed an AUC of only 75.1%, reflects the two false negatives observed for the Smuggled class (Figure 7), its intermediate sensitivity (77.8%), and specificity of 92.3% (Figure 8). Similarly, although the “No Health Registration” class presented global sensitivity and specificity of 100%, its comparison with the “Counterfeit” class resulted in an AUC of 79.2%, possibly due to the small number of samples and the near absence of negative examples to calibrate the ROC curve in this pair. Even so, the ROC analysis supports the excellent discriminative power of the LDA model, especially in pairs involving the Multinational class, while also highlighting areas of greater chemical overlap between the Smuggled, Regional, and Counterfeit groups, offering valuable insights for future improvements in variable refinement or the inclusion of complementary methods.
For comparative purposes, we selected several prior researches on this topic and compared their findings with the results obtained in the present research. For example, Shuangyan et al.,41 aimed to develop a chemometric model for discriminating among five cigarette brands using near-infrared (NIR) spectra associated with PCA-LDA, achieving accuracy values ranging from approximately 77 to 95%. Discrimination methods based on Fourier transform infrared spectroscopy (FTIR) spectroscopy, however, have the disadvantage of requiring the selection of specific spectral bands. The method proposed herein however, does not present this limitation, as it allows the possibility of working with tR of minor impurities present in the samples. Another interesting study was conducted by Gharaghani et al.,42 who developed an analytical method to differentiate between counterfeit and legal cigarettes based on a sensor constructed with MoS2 quantum dots (QDs) and the colorimetric responses of organic reagents. This sensor was designed to detect volatile organic compounds (VOCs) present in cigarette smoke and applied to a total of 126 cigarette samples, both authentic and counterfeit. The resulting LDA model achieved an accuracy of 98%, slightly higher than that obtained with the ultrasound-assisted extraction followed by gas chromatography-flame ionization detection (UAE-GC-FID) method in the present study, although the latter is a multiclass technique used to discriminate among five different cigarette groups. Furthermore, the proposed sensor-based method is more practical, as it does not require QD synthesis or the use of complex organic reagents.
Analysis of the proximity between groups of multinational and smuggled brands
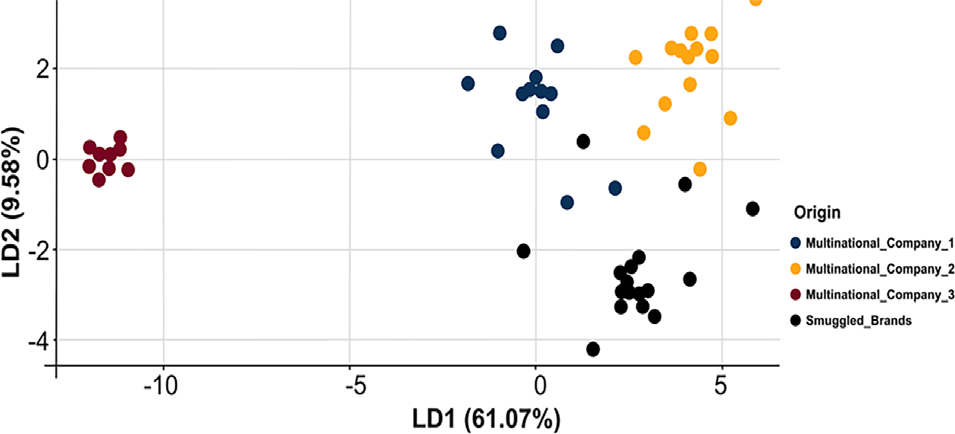
Following confirmation of the differentiation effectiveness between the studied cigarette brands, an assessment concerning which companies within the multinational brand group are most closely related to the smuggled cigarette samples was carried out. For this, samples from these two groups were selected from the full dataset containing normalized chromatograms, and a new LDA was applied. The results are depicted in Figure 10.
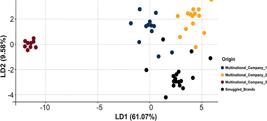
Plot of the first versus second linear discriminant for multinational companies vs. smuggled brands (n = 64 samples) in cigarette samples. The figure demonstrates the ability of the proposed method to distinguish between legitimate and smuggled products.
Multinational Companies 1 and 2 represent the two largest stakeholders in the legal tobacco market, while Multinational Company 3 ranks as the third-largest cigarette company in the country. As noted in Figure 10, Companies 1 and 2 are more closely related to each other, while Company 3 shows less similarity to the other multinational cigarette brands analyzed. Furthermore, Companies 1 and 2 appear closer to the smuggled brands, as also observed in the cluster analysis, indicating that both companies may share similar raw materials or production processes with each other and with the smuggled brands.
This connection is plausible given that the manufacturing facilities of these two companies are located in the state of Rio Grande do Sul, a region bordering Paraguay. Between 2009 and 2012, Brazil supplied over 50% of the raw tobacco used in Paraguay. Although this figure has declined to approximately 45% in recent years, Brazil continues to provide various inputs for cigarette production-such as 50% of the paper used in Paraguayan cigarette packaging, around 67% of the aluminum foil used inside the packs, as well as foam filters and nearly 50% of the filtering material.43 These findings, supported by literature and reinforced by the present data, suggest the existence of “reverse smuggling,” in which smugglers may be using the same type of tobacco cultivated and sold to multinational companies.
Conclusions
The model developed in this study provides a quick and efficient alternative to conventional analytical methods for differentiating cigarette brands. The ultrasonic-assisted extraction is completed in three short cycles totaling only 15 min, enabling rapid and effective transfer of analytes from the matrix to the solvent. Subsequent sample preparation for chromatographic injection requires approximately 2 h, while the chromatographic run itself takes about 30 min per sample.
In addition, the model developed here is a multivariate, multiclasse approach, representing the first multiclasse discrimination model for cigarette brands reported in Brazil. Therefore, the proposed method represents a rapid, straightforward, and reproducible approach, allowing the direct analysis of complex samples without the need for time-consuming synthetic procedures, and offers a novel and practical solution for routine multiclasse classification of cigarette brands. This characteristic broadens the applicability of the method and reduces dependence on highly specific, costly, and operationally complex techniques such as selective quantification by inductively coupled plasma mass spectrometry (ICP-MS) or detailed identification via mass spectrometry.
Although certain chromatographic peaks demonstrate greater discriminatory power, the proposed method takes a qualitative multiresidue approach. Disclosing the identities and retention times of these compounds would run counter to the objectives of this study, as it could provide counterfeiters and smugglers with valuable information to improve their illicit processes and hinder regulatory enforcement.
Moreover, this model has the potential to expand regulatory oversight by enabling implementation in laboratories with more modest analytical infrastructure. This democratizes access to quality control and forensic investigation of tobacco-derived products, representing a low-cost and accessible alternative compared to more sophisticated and restrictive methods. As such, the proposed model stands out as a robust, efficient, and economically viable tool for the discrimination of cigarette brands, with strong potential for regulatory and enforcement applications targeting counterfeiting and smuggling.
The findings of this study also provided valuable insights into the possible origins and relationships among different cigarette brand groups. For instance, similarities were observed between regional and counterfeit brands, suggesting that both may share manufacturing methods and/or raw material suppliers.
Supplementary Information
Supplementary Information
Acknowledgments
The authors thank the PUC-RIO Chemistry Department, the Laboratory of Water Characterization (LabAguas) and the Marine and Environmental Studies Laboratory (LabMAM) for the opportunity to carry out this work; to those who helped us to get the Paraguayan cigarette samples. Thanks, are also due to Álvaro Serpa for the figures presented in this article, and to CAPES and CNPq for the granted scholarship. This work was carried out with the support of the Improvement Coordination of Higher Education Personnel - Brazil (CAPES) - Financing Code 001.
Data Availability Statement
Data supporting the findings of this study are mostly presented in the article. Any further relevant data are available from the corresponding author upon reasonable request.
References
-
1 Adamu, C. A.; Bell, P. F.; Mulchi, C.; Chaney, R.; Environ. Pollut. 1989, 56, 113. [Crossref]
» Crossref -
2 Golia, E. E.; Dimirkou, A.; Mitsios, I. K.; Commun. Soil Sci. Plant Anal. 2009, 40, 106. [Crossref]
» Crossref -
3 Golia, E. E.; Dimirkou, A.; Mitsios, I. K.; Bull. Environ. Contam. Toxicol. 2007, 79, 158. [Crossref]
» Crossref -
4 Stephens, W. E.; Calder, A.; Newton, J.; Environ. Sci. Technol. 2005, 39, 479. [Crossref]
» Crossref -
5 Wu, D.; Landsberger, S.; Larson, S. M.; J. Radioanal. Nucl. Chem. 1977, 217, 77. [Crossref]
» Crossref -
6 Kalcher, K.; Kern, W.; Pietsch, R.; Sci. Total Environ. 1993, 128, 21. [Crossref]
» Crossref -
7 Folha de São Paulo; Fábricas no Brasil Falsificam Cigarro Paraguaio para Lucrar Mais e até Exportam; [Link] accessed November 2025
» Link -
8 Shafey, O.; Cokkinides, V.; Cavalcante, T. M.; Teixeira Pinto, M.; Vianna, C.; Thun, M.; Tobacco Control 2002, 11, 215. [Crossref]
» Crossref -
9 Cresta, J.; Ovando, R.; Servín, B. In Tobacco Oversupply in Paraguay and Its CrossBorder Impacts (Revised Second Version; Massi, F., ed.; Centro de Análisis y Difusión de la Economía Paraguaya (CADEP): Chicago, USA, 2021. [Crossref]
» Crossref -
10 Pieraccini, S.; Fulanetto, S.; Orlandini, G.; Bartolucci, I.; Giannini, S.; Pinzauti, G. M.; J. Chromatogr. A 2008, 1180, 138. [Crossref]
» Crossref -
11 Huang, L. F.; Zhong, K. J.; Sun, X. J.; Wu, M. J.; Huang, K. L.; Liang, F. Q.; Guo, Y.; Li, W.; Anal. Chim. Acta 2006, 575, 236. [Crossref]
» Crossref -
12 Chang, M. J.; Naworal, J. D.; Walker, K.; Connell, C. T.; Spectrochim. Acta, Part B 2003, 58, 1979. [Crossref]
» Crossref -
13 Pappas, R. S.; Polzin, G. M.; Zhang, L.; Watson, C. H.; Paschal, D. C.; Ashley, D. L.; Food Chem. Toxicol 2006, 44, 714. [Crossref]
» Crossref -
14 Crispino, C. C.; Fernandes, K. G.; Kamogawa, M. Y.; Nóbrega, J. A.; Nogueira, A. R. A.; Ferreira. M. M. C.; Anal. Sci 2007, 23, 435. [Crossref]
» Crossref -
15 Axelson, D. E.; Wooten, J. B.; J. Anal. Appl. Pyrolysis 2007, 78, 214. [Crossref]
» Crossref -
16 Adam, T.; Ferge, T.; Mitschke, S.; Streibel, T.; Baker, R. R.; Zimmermann, R.; Anal. Bioanal. Chem. 2005, 381, 487. [Crossref]
» Crossref -
17 Governo do Pará; CPCRC Realiza Perícia em Cigarros Apreendidos em Operação Policial. [Link] accessed in November 2025
» Link -
18 Cecinato, A.; Bacaloni, A.; Romagnoli, P., Perilli, M.; Balducci, C.; Environ. Sci. Pollut. Res. 2022, 29, 65904. [Crossref]
» Crossref -
19 Li, Y.; Hecht, S. S.; Food Chem. Toxicol 2022, 165, 113179. [Crossref]
» Crossref -
20 Chiang, S. Y.; Grunwald, C.; Phytochemistry 1976, 15, 961. [Crossref]
» Crossref -
21 Banožić, M.; Aladić, K.; Jerkovićb, I.; Jokića, S.; J. Sci. Food Agric 2021, 101, 1822. [Crossref]
» Crossref -
22 Luo, H.; Cheng, H.; Du, W.; Wang, S.; Wang, C.; Chang, S.; Dong, S.; Xu, C.; Zhang, J.; J. Chromatogr. Sci 2013, 51, 250. [Crossref]
» Crossref -
23 Cai, J.; Liu, B.; Ling, P.; Su, Q.; J. Chromatogr. A 2002, 947, 267. [Crossref]
» Crossref -
24 Ipec Inteligência; Impactos do Mercado Ilegal de Cigarros no Brasil; 2022. [Link] accessed in November 2025
» Link -
25 Agência Nacional de Vigilância Sanitária (ANVISA); Alertas-Tabaco [Link] accessed in September 2025
» Link -
26 Krüsemann, E. J. Z.; Visser, W. F.; Cremers, J. W. J. M.; Pennings, J. L. A.; Talhout, R.; Tobacco Control 2018, 27, 105. [Crossref]
» Crossref -
27 Bitzer, Z. T.; Mocniak, L. E.; Trushin, N.; Smith, M.; Richie, J. P.; Nicotine Tob. Res 2023, 25, 1400. [Crossref]
» Crossref -
28 Zelínková, Z.; Wenzil, T.; Nicotine Tob. Res 2020, 22, 997. [Crossref]
» Crossref -
29 Wilde, M. J.; Zhao, B.; Cordell, R. L.; Ibrahim, W.; Singapuri, A.; Greeting, N. J.; Brightling, C. E; Siddiqui, S.; Monks, P. S.; Free, R. C.; Anal. Chem 2020, 92, 1353. [Crossref]
» Crossref -
30 Reisetter, A. C.; Muehlbauer, M. J.; Bain, J. R.; Nodzenski, M.; Stevens, R. D.; Ilkayeva, O.; Metzger, B. E.; Newgard, C. B.; Lowe Jr., W. L.; Scholtens, D. M.; BMC Bioinformatics 2017, 18, 84. [Crossref]
» Crossref -
31 Ottensmann, M.; Stoffel, M. A.; Nichols, H. J.; Hoffman, J. I.; PLos One 2018, 13, e0198311. [Crossref]
» Crossref -
32 Eddy, S. R.; Nat. Biotechnol 2004, 22, 909. [Crossref]
» Crossref -
33 Bloemberg, T. G.; Gerretzen, J.; Wouters, H. J. P.; Gloerich, J. van Dael M.; Wessels, H. J.; Chemom. Intell. Lab. Syst 2010, 104, 65. [Crossref]
» Crossref -
34 Daszykowski, M.; Vander Heyden, Y.; Boucon, C.; Walczak, B.; J. Chromatogr. A 2010, 1217, 6127. [Crossref]
» Crossref -
35 University of Washington; NMDS [Link] accessed in November 2025
» Link - 36 Duda, R. O.; Hart, P. E.; Pattern Classification; John Wiley & Sons: New Jersey, USA, 2006.
-
37 de Maesschalck, R.; Jouan-Rimbaud, D.; Massart, D. L.; Chemom. Intell. Lab. Syst 2000, 50, 1. [Crossref]
» Crossref -
38 Caneca, A. R.; Pimentel, M. F.; Galvão, H. R. K.; da Matta, C. L.; de Carvalho, F. R.; Raimundo Jr., I. M.; Pasquini, C.; Rohwedder, J. J. R.; Talanta 2006, 70, 344. [Crossref]
» Crossref -
39 Wu, W.; Mallet, Y.; Walczak, B.; Penninckx, W.; Massart, D. L.; Heuerding, S.; Erni, F.; Anal. Chim. Acta 1996, 329, 257. [Crossref]
» Crossref -
40 López, M. I.; Callao, M. P.; Ruisánchez, I.; Anal Chim. Acta 2015, 891, 62. [Crossref]
» Crossref -
41 Shuangyan, Y.; Ying, H.; Lingchun, Y.; Jianqiang, Z.; Weijuan, L.; Changgui, Q.; Ming, L.; Yanmei, Y.; J. Braz. Chem. Soc 2018, 29, 1480. [Crossref]
» Crossref -
42 Gharaghani, F. M.; Mostafapour, S.; Hemmateenejad, B.; Biosensors 2023, 13, 705. [Crossref]
» Crossref -
43 Escola Nacional de Saúde Pública Sérgio Arouca; Entrevista: ‘Brasil é o Principal Fornecedor do Complexo Produtivo do Cigarro Paraguaio’. [Link] accessed in November 2025
» Link
Edited by
-
Editor handled this article:
Andrea R. Chaves (Executive)