 Development of an Analytical Method for Identification and Quantification of Glycerol Ethers
Abstract
Glycerol is a co-product of biodiesel production and an important raw material for the synthesis of economically and ecologically valuable compounds. The etherification of glycerol with benzyl alcohol is a promising chemical route that leads to the formation of highly volatile monoand diethers with low viscosity and polarity. These compounds can be used as fuel additives to improve physicochemical properties, representing an alternative to increasing the biodiesel content in commercial diesel. Therefore, accurate and reliable protocols are required for the identification and quantification of the reaction products. In this study, a high-performance liquid chromatography method with ultraviolet-visible detection (HPLC-UV-Vis) was developed and validated to identify and quantify two ethers produced by glycerol benzylation. Method validation was carried out in accordance with Brazilian legislation and allowed efficient separation of the target compounds, here referred to as ether 1 and ether 2, showing satisfactory linearity in the concentration range of 150 to 400 µg mL-1, coefficients of determination of 0.9963 and 0.9990, and average recoveries of 105 and 74%, respectively. The method demonstrated accuracy, precision, and simplicity, proving suitable for monitoring the formation of glycerol ethers.
Keywords:
glycerol ethers; etherification; fuel additives; validation; HPLC-UV-Vis
Introduction
The growing demand for fossil fuels has increased concerns about global warming, bringing the search for new energy sources to the forefront of the global market. In this context, the so-called biofuels, or green fuels, have emerged; these are fuels derived from renewable biomass that can partially or fully replace petroleum and natural gas-derived fuels in combustion engines or other types of energy generation.1 In this scenario, biodiesel appears as a viable and promising solution in the quest for sustainable energy sources. Thus, the production of biodiesel in Brazil has gained relevance and has experienced constant growth in recent years.2-4
In Brazil, the current requirement to mix 10% biodiesel with conventional diesel has resulted in consistent growth in the production of this biofuel, generating significant volumes of residual glycerol. Generally, the production of 100 kg of biodiesel generates approximately 10 kg of glycerol, with a purity of around 50 to 55%.5
Biodiesel is produced through transesterification, in which triglycerides from vegetable oils, animal fats and domestic waste (including used frying oil), react in the presence of an alcohol and a catalyst that can be acidic, basic or enzymatic.6-8
This transesterification reaction produces methyl esters of fatty acids (biodiesel) and glycerol as the main co-product.9 Glycerol (1,2,3-trihydroxypropane or propane-1,2,3-triol) is a polar, colorless, odorless, viscous liquid that is soluble in water and has a sweet taste, remaining in liquid form at room temperature. It possesses hygroscopic properties, which enhance its applicability in various industrial processes. Glycerol is an additive commonly used in the chemical and cosmetic industries. It can be found in oils and fats of animal and vegetable origin.10-12 However, locating glycerol in its pure form can be challenging due to its typical association with fatty acids such as oleic, palmitic, stearic and lauric.13
As a co-product of biodiesel production, various studies14-19 have been conducted to convert this raw material into compounds with greater technological applicability and to increase its added value.
The reuse or transformation of glycerol into value-added compounds offers both economic and environmental advantages, contributing to the sustainability of biodiesel production. Although several technologies and chemical processes for converting residual glycerol have been established and extensively applied in the chemical industry, continuous improvements and monitoring are necessary to ensure consistent performance. Therefore, new methods and innovative approaches are still being explored for the valorization of this co-product.20,21
In the search for efficient transformation pathways, various studies22-24 have focused on converting glycerol into products such as acetals, ethers, carbonates, and esters through different chemical reactions. One of the main etherification strategies involves the reaction of glycerol with alkenes in the presence of acid catalysts, leading to the formation of mono-, di-, and tert-butyl glycerol ethers.
Among glycerol conversion reactions, etherification stands out as one of the most promising due to the generation of oxygenated compounds that can be incorporated into fuels. This reaction can be carried out using alcohols (e.g., ethanol, methanol, benzyl alcohol, tert butyl alcohol) as etherifying agents, in the presence of acid catalysts such as p-toluenesulfonic acid or ion-exchange resins like Amberlyst 15®. The resulting ethers exhibit low polarity and viscosity, high volatility, and strong affinity for hydrocarbons, making them suitable for use as fuel additives or biodegradable surfactants.25-28
For instance, the etherification of glycerol with ethanol in a fixed-bed Parr reactor, using Amberlyst 15 as a catalyst under various pressure conditions, achieved a glycerol conversion of 97% and an ether yield of 68%.29,30
Research on the conversion of glycerol into value-added products through reactions such as oxidation, esterification, etherification, hydrogenolysis, and polymerization represents a growing field in green chemistry. These processes are considered emerging technologies that offer significant potential and scientific interest.31-33
In the context of biodiesel production and glycerol valorization, the implementation of robust analytical methods is essential for monitoring chemical and physical parameters. Chromatographic techniques, particularly high-performance liquid chromatography (HPLC), are widely employed to separate and analyze compounds in biodiesel and glycerol samples.34 These methods provide critical information to support decisions related to production, quality control, and chemical transformation of by products. Accordingly, method validation is necessary to ensure analytical reliability and performance.35
Although method validation enhances the credibility of chemical analyses, validated protocols are not always available for all glycerol-derived compounds.36 HPLC, coupled with various detection systems, meets the essential requirements for the separation, identification, and quantification of organic substances.37
Thus, the objective of this study was to develop and validate a simple and reliable HPLC method with ultraviolet-visible detection (HPLC-UV-Vis) for the identification and quantification of the ethers formed during the benzylation reaction of glycerol.
Experimental
Material
The glycerol ethers 3-(benzyloxy)propane-1,2 diol (ether 1) and 1,3-bis(benzyloxy)propan-2-ol (ether 2) were used to apply the proposed methodology. Table 1 presents selected physicochemical properties and the chemical structures of these glycerol ethers.
Ether standards, both with a purity of 97%, were acquired from Sigma-Aldrich (São Paulo, Brazil). Glycerol (analytical grade), with a purity of 99.5%, was obtained from Vetec (São Paulo, Brazil). Chromatographic-grade acetonitrile (ACN; Merck, Germany) and ultrapure water obtained from a Milli-Q Direct 8 system (18 MΩ cm; Merck, Brazil) were used as the HPLC mobile phase and for the preparation of standard solutions. Standard solutions of each ether at a concentration of 1000 µg mL-1 were prepared in acetonitrile and used for subsequent dilutions. The solutions were stored at 4 °C until use.
HPLC-UV-Vis analysis
The analyses were performed using a modular high-performance liquid chromatograph (HPLC) equipped with a UV-Vis detector (SPD-20) and an LC-20AT pump, both from Shimadzu (Kyoto, Japan). Manual injections were carried out using a 20 µL loop injector. Ether separation was achieved on a Zorbax ODS C18 reversed-phase column (Agilent, São Paulo, Brazil), 250 mm × 4.6 mm internal diameter (i.d.), packed with 5 µm particles.
All samples were injected in triplicate using an injection volume of 20 µL. The mobile phase consisted of water (pump A) and acetonitrile (pump B), delivered at a flow rate of 1.0 mL min-1 under gradient elution conditions, as described in Table 2. Detection was performed at 230 nm.
Validation of the HPLC-UV-Vis method for the quantification of glycerol ethers
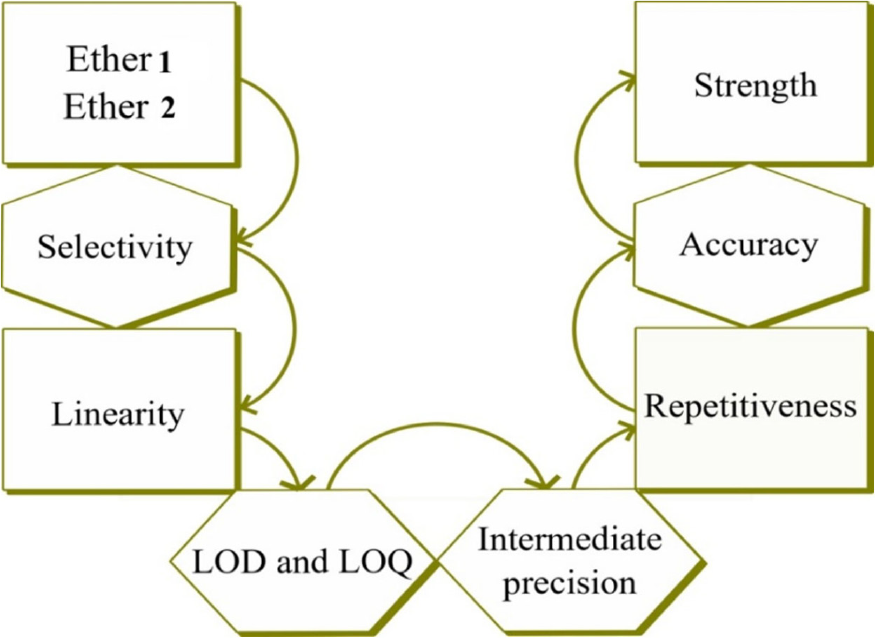
Method validation was performed after the chromatographic conditions were established for the analytes, including mobile phase composition, elution gradient, retention times, and maximum absorption wavelengths. The method was validated according to the performance parameters shown in Figure 1; selectivity, linearity, limits of detection (LOD) and quantification (LOQ), intermediate precision, repeatability, accuracy (recovery), and robustness, following the protocols and guidelines established by the Brazilian Health Regulatory Agency (Anvisa)38 and the National Institute of Metrology, Quality and Technology (Inmetro).39
Selectivity
The selectivity of the method was evaluated through injections, in triplicates, of the ACN (blank) and the mixture of standard solutions of the two ethers (150 and 400 µg mL 1), establishing a comparison between the retention times of both in the chromatograms.
Linearity
Linearity refers to the range within which the analytical signal is directly proportional to the analyte concentration, typically described by a calibration or analytical curve. In this study, linearity was assessed by external standardization using acetonitrile solutions prepared in triplicate at six concentration levels (150, 200, 250, 300, 350, and 400 µg mL-1). The solutions were injected into the chromatographic system to construct the analytical curves, and linear equations were obtained using the least squares method.
The calibration curves were generated using Microsoft Excel 2013 (Microsoft, Redmond, WA, USA). Statistical evaluation of linearity was performed through one-way analysis of variance (ANOVA), using the F-test as the statistical criterion, with calculations performed a 95% confidence interval.40
Limits of detection (LOD) and quantification (LOQ)
The limits of detection and quantification of a method define the smallest amount of a given substance that can be detected by the instrumental technique and quantified within the precision and accuracy limits of the method. In this work, both limits were determined using the parameters of the analytical curve (standard deviation and slope of the line), according to equations 1 and 2:
where: DPa is the standard deviation of calibration curve and IC is the slope of the analytical curve.41
Precision
Method precision was evaluated using the relative standard deviation (RSD, in percentage) obtained from intermediate precision and repeatability tests. Intermediate precision was assessed over three consecutive days at three concentration levels. Both standards and samples were analyzed in triplicate, using the lowest and highest concentration levels of the analytical calibration curve. The concentration levels were 150, 350, and 400 µg mL-1 for the standard solutions; 136, 328, and 374 µg mL-1 for ether 1 in the samples; and 150, 250, and 350 µg mL-1 for ether 2 in the samples.
Repeatability was evaluated by calculating the RSD from ten replicate injections of both the standard solutions and the reaction samples at concentrations of 350 and 328 µg mL-1 for ether 1 and its corresponding sample, and 250 µg mL-1 for ether 2 and its corresponding sample.
Accuracy (recovery)
Accuracy was assessed by recovery experiments in which samples were fortified with the respective ethers at three concentration levels corresponding to the low, intermediate, and high points of the analytical calibration curve. During the fortification step, aliquots of the ether stock solutions (1000 µg mL-1) were diluted in 10 mL volumetric flasks using the sample matrix to obtain final concentrations of 150, 250, and 350 µg mL-1.
The accuracy was determined by the equation 3:
where: C1 is the concentration of the fortified sample, C2 is the concentration determined in the sample without adding the standard and C3 is the concentration of the added standard.
Application of the method
To evaluate the effectiveness of the proposed method, six etherification reactions were selected. The reactions were carried out using benzyl alcohol, previously purified glycerol, and the ionic liquid catalyst pyridinium p-toluenesulfonate, under microwave irradiation, yielding glycerol ethers as the final products.
At the end of the reaction, the products were transferred to 45 mL centrifuge tubes, followed by the addition of 0.1 g of anhydrous sodium sulfate. The mixtures were shaken and centrifuged. Subsequently, 1.0 mL aliquots were collected and filtered through 13 mm polyvinylidene fluoride (PVDF) membrane filters prior to HPLC analysis.
Results and Discussion
Analytical method validation
The analytical method was developed and validated in accordance of Figure 1, which follows the guidelines described in the Analytical Method Validation guide, available in Anvisa.41
Selectivity and linearity
Selectivity was the first parameter evaluated, which analyzes the ability of the method to assess analytes in the presence of components that could potentially interfere with quantification. The chromatograms of the standards and the blank in acetonitrile (ACN) were obtained through analyses using HPLC-UV-Vis. In Figure 2, it is possible to observe the overlap of the solvent blank chromatogram (pink line) and the two ethers (black line). Ether 1 elutes at a retention time of 2.7 min and ether 2 at 5.2 min, respectively, without the presence of interfering peaks at the retention times of the two compounds, thus confirming the selectivity of the method.
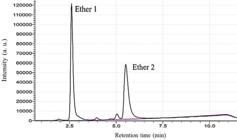
Overlay of the chromatograms of the blank (ACN) and the mixture of ether 1 and ether 2 standards.
The linearity of the method was confirmed by means of linear regression or the least squares method, using the values of the correlation coefficients (R) and determination coefficients (R2).
The analytical calibration curves of the ethers, obtained from injections of increasing concentrations (working range: 150-400 µg L-1), showed R2 values higher than 0.99 for both analytes, confirming a strong linear correlation between the variables y (peak area) and x (concentration) of the ethers (Figure S1, presented in Supplementary Information (SI) section).
The statistical test by single-factor analysis of variance (ANOVA) using the F-test was performed to determine the fit of the linear regression model, where it was observed for ether 1 that the calculated F-value, obtained by the ratio between the mean square of regression and the mean square of residuals (MSreg/MSres), was greater than 10 times the tabulated F-value (or F-critical), at a 95% confidence level. This confirm that the model exhibits linearity and good fit within the studied concentration range (Table S1, SI section).
Similarly, for ether 2 (Table S2, SI section), the calculated F-value was also more than ten times higher than the tabulated F-value at the 95% confidence level, indicating that the model exhibits linear characteristics and provides a good fit for the concentration range studied. The hypothesis test (t-test) was also performed (Table S3, SI section) using Excel statistical software. The p-values obtained for both ether 1 (0.012) and ether 2 (0.016) are below the adopted significance level of 0.05 (5%), indicating that the linear coefficients are significantly different from zero.
Limits of detection and quantification
The values for LOD and LOQ were calculated using the validation spreadsheet.36 The LOD for ether 1 was 29.3 µg mL-1 and for ether 2, 15.4 µg mL-1. Regarding the LOQ, the values presented for ether 1 were 44.4 µg mL-1 and for ether 2, 23.0 µg mL-1. The analyses were conducted within a concentration range above the limits. According to the results presented, the method demonstrates high sensitivity and specificity for the determination of glycerol ethers.
Precision
The precision of the method was evaluated through tests of intermediate precision and repeatability. The results are described in Table 3 for ether 1 and in Table 4 for ether 2. Intermediate precision assays were determined for six solutions (three samples and three standards) and performed on three consecutive days (continuous), expressed by RSD, in percentage. The RSD values were accurate with regard to consecutive days and ranged from 0.10 to 1.42% for ether 1 and 0.21 to 1.17% for ether 2.
Analytical method precision data at repeatability and intermediate precision levels for ether 1
Analytical method precision data at repeatability and intermediate precision levels for ether 2
The Anvisa regulations require that precision results do not exceed 5%. Based on the data, we can affirm that the proposed method complies with current legislation and produces reliable results. The repeatability parameter, assessed as RSD, in percentage, shows RSD results between 1.33 and 1.05% for ether 1 and between 0.23 and 1.28% for ether 2, respectively (Table 5). The RSD values are within the expected limits for repeatability, as they ensure no dispersion of results, thus confirming the precision of the method.
Accuracy
In terms of accuracy (Table 6), the values were expressed in recovery, considering standard solutions at three different concentration levels (low, medium, and high), added to the samples and analyzed by the proposed method. The linear equations used in the recovery calculation were the same as those obtained in the linearity parameter.
Accuracy data obtained by the analytical method for the quantification of ether 1 and ether 2 (λ = 230 nm)
The recovery values obtained for the method ranged from 72.6 to 86.2% for ether 1. The average recoveries at the three fortification levels were 99.4, 100.5, and 98.8%, with corresponding standard deviations of 2.03, 0.29, and 0.42%, respectively. For ether 2, recovery values ranged from 98.0 to 101.7%, with mean recoveries of 99.4, 100.5, and 98.8% across the three concentration levels and standard deviations of 2.49, 0.44, and 1.18%, respectively.
The experimental concentrations obtained for both ethers showed deviations from the nominal fortification levels, which can be attributed to matrix effects arising from the presence of co-eluting or interfering species in the reaction medium. Such matrix effects are known to affect analyte response and contribute to variability in quantitative results.
Application of the method for analysis of reaction products
Table 7 summarizes the concentration values obtained for six glycerol etherification reactions with benzyl alcohol, determined using the validated HPLC-UV-Vis method. Each reaction mixture was injected once, and quantification was carried out by external standardization using analytical calibration curves constructed for both target ethers under the same chromatographic conditions.
The reaction products consisted predominantly of the benzyl monoether (ether 1). In contrast, the formation of the benzyl diether (ether 2) was limited and was detected only in reactions 1 and 3. The absence of ether 2 in the remaining reactions can be attributed to variations in the reaction conditions, including reaction time, temperature, nature of the etherifying agent, and both the amount and type of catalyst employed (acidic or basic). These factors are known to strongly influence the extent of glycerol etherification and the distribution between monoand di-substituted products.
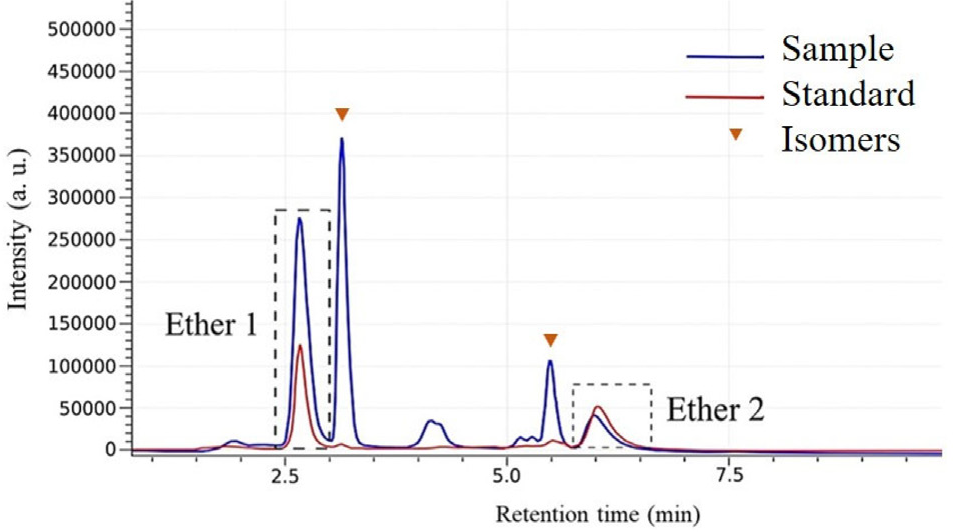
Figure 3 presents an overlay chromatogram of a representative reaction sample obtained using the validated HPLC-UV-Vis method and the standard solution containing both ethers. In this comparison, the reaction mixture exhibits signal corresponding to the target ethers as well as additional peaks associated with their isomeric forms. The retention times of 2.5 min for ether 1 and 5.7 min for ether 2 are consistent with those of the respective standards, clearly indicating the formation of both compounds.
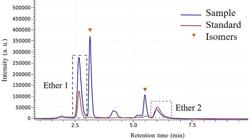
Chromatogram of the reaction product superimposed with ether standards (red line) and reaction products (blue line) obtained by HPLC-UV-Vis (λ = 230 nm).
Previous studies by Kubota et al.42 on the etherification of glycerol with benzyl alcohol over zeolitic catalysts have reported that the reaction may yield two monoether isomers, two diether isomers, and potentially a triether derivative. In agreement with these findings, well-defined chromatographic signals attributed to isomeric species are observed in the analyzed sample.
The presence of the monoether isomer 2-(benzyloxy)propane-1,3-diol and the diether isomer 2,3-bis(benzyloxy)propan-1-ol was further confirmed by gas chromatography-mass spectrometry (GC-MS) analysis (see Figures S2 and S3, SI section). Compound identification was performed by comparison with mass spectral data from the National Institute of Standards and Technology (NIST 08) mass spectral library.
The method developed and validated in this study demonstrated high efficiency in the separation and resolution of glycerol ether peaks, allowing for reliable identification and quantification of the analytes present in the reaction products. Moreover, it is a simple and fast analytical procedure.
Conclusions
In accordance with the objective proposed in this study, an HPLC analytical method was developed and validated for the quantification of glycerol ethers formed in etherification reactions with benzyl alcohol. Chromatographic separation was assessed based on retention time and peak resolution, and the selection of a detection wavelength at 230 nm provided adequate sensitivity for the analytes. All figures of merit, including sensitivity, linearity, precision, limit of detection, limit of quantification, and robustness, met the acceptance criteria established in the protocols and guidelines for the validation of analytical methods. In future studies, the method may be further optimized to enable the quantification of individual isomers of ether 1 and ether 2 present in the reaction products.
Supplementary Information
Supplementary Information
Supplementary information is available free of charge at http://jbcs.sbq.org.br as PDF file.
Acknowledgments
The authors thank UFMA, the Nucleus of Fuels, Catalysis and Environmental (NCCA), CAPES (finance code 001), CNPq, and FAPEMA. D.G.R.G. acknowledges to CAPES (Brazil) for the scholarship received.
Data Availability Statement
All data are available in the text and in the SI section.
References
-
1 Agência Nacional do Petróleo, Gás Natural e Biocombustíveis (ANP); Anuário Estatístico Brasileiro do Petróleo, Gás Natural e Biocombustíveis; ANP: Rio de Janeiro, 2022. [Link] accessed in January 2026
» Link -
2 Ramos, L. P.; Silva, F. R.; Mangrich, A. S.; Cordeiro, C. S.; Rev. Virtual Quim. 2011, 3, 385. [Crossref]
» Crossref -
3 Ramos, L. P.; Kothe, V.; César-Oliveira, M. A. F.; Muniz Wypych, A. S.; Nakagaki, S.; Krieger, N.; Wypych, F.; Cordeiro, C. S.; Rev. Virtual Quim. 2017, 9, 317. [Crossref]
» Crossref -
4 El Malt, F. I.; Souza, C. B.; Rev. Bras. Gest. Ambiental Sustent. 2019, 6, 385. [Crossref]
» Crossref -
5 Giuseppe, B.; Iulianelli, A.; Sanna, A.; Basile, A.; Membranes 2017, 7, 17. [Crossref]
» Crossref -
6 Kalita, P.; Basumatary, B.; Saikia, P.; Das, B.; Basumatary, S.; Energy Nexus 2022, 6, 10087. [Crossref]
» Crossref -
7 Meneghetti, S. M. P.; Meneghetti, M. R.; Brito, Y. C.; Rev. Virtual Quim. 2013, 5, 63. [Crossref]
» Crossref -
8 Santos, S. J.; Braun, J. V.; Espíndola, G. C.; da Silva, J. A.; Renner, R. E.; Fontoura, L. A. M.; J. Braz. Chem. Soc. 2024, 35, 7. [Crossref]
» Crossref -
9 Cordeiro, S. C.; Silva, F. S.; Wypych, F.; Ramos, L. P.; Quim. Nova 2011, 34, 477. [Crossref]
» Crossref -
10 Arruda, P. V.; Rodrigues, R. C. L. B.; Felipe, M. G. A.; Rev. Anal. 2007, 26, 56. [Link] accessed in January 2026
» Link -
11 Quispe, C. A. G.; Coronado, C. J. R.; Carvalho Jr., J. A.; Renewable Sustainable Energy Rev. 2013, 27, 475. [Crossref]
» Crossref -
12 Lacerda, C. V.; Souza, R. O. L.; Essayem, N.; Gonzalez, W. A.; Rev. Virtual Quim. 2014, 6, 1332. [Crossref]
» Crossref -
13 Bagheri, S.; Julkapli, N. M.; Yehye, A. W.; Renewable Sustainable Energy Rev. 2015, 41, 113. [Crossref]
» Crossref -
14 Valerio, O.; Horvath, T.; Pond, C.; Misra, M.; Mohanty, A.; Ind. Crops Prod. 2015, 78, 141. [Crossref]
» Crossref -
15 Cavalcante, K. S. B.; Silva, M. G. S.; Sinfronio, F. S. M.; Valois, R. R. S.; Maciel, A. P.; Souza, A. G.; Silva, F. C.; Ecletica Quim. 2011, 36, 55. [Crossref]
» Crossref -
16 Monteiro, M. R.; Kugelmeier, C. L.; Pinheiro, R. S.; Batalha, M. O.; César, A. S.; Renewable Sustainable Energy Rev. 2018, 88, 109. [Crossref]
» Crossref -
17 Peiter, G. C.; Alves, H. J.; Sequinel, R.; Bautitz, I. R.; Rev. Bras. Energ. Renov. 2016, 5, 519. [Crossref]
» Crossref -
18 Cornejo, A.; Barrio, I.; Campony, M.; Lázaro, J.; Navarrete, B.; Renewable Sustainable Energy Rev. 2017, 79, 1400. [Crossref]
» Crossref -
19 Banu, I.; Bumbac, G.; Bombos, D.; Velea, S.; Galan, A. M.; Bozga, G.; Renewable Energy 2020, 148, 548. [Crossref]
» Crossref -
20 Alashek, F.; Keshe, M.; Alhassan, G.; Results Chem. 2022, 4, 100359. [Crossref]
» Crossref -
21 Chilakamarry, C. R.; Sakinah, A. M.; Zularisam, A. W.; Pandey, A.; Syst. Microbiol. Biomanuf. 2021, 1, 378. [Crossref]
» Crossref -
22 Mota, C. J. A.; da Silva, C. X. A.; Gonçalves, V. L. C.; Quim. Nova 2009, 32, 639. [Crossref]
» Crossref -
23 Mota, C. J. A.; Pestana, C. F. M.; Rev. Virtual Quim. 2011, 3, 416. [Crossref]
» Crossref -
24 Rahmat, N.; Abdullah, A. Z.; Mohamed, A. R.; Renewable Sustainable Energy Rev. 2010, 14, 987. [Crossref]
» Crossref -
25 Hossein, N.; Dailey, W. R.; Hunt, B. A.; Papers in Biomaterials 1998, 2, 232. [Link] accessed in January 2026
» Link -
26 Clacens, J. M.; Pouilloux, Y.; Barrault, J.; Appl. Catal., A 2002, 227, 18. [Crossref]
» Crossref -
27 Aguado-Deblas, L.; Estevez, R.; Russo, M.; La Parola, V.; Bautista, F. M.; Testa, M. L.; Materials 2020, 13, 1584. [Crossref]
» Crossref -
28 Gonçalves, M.; Castro, C. S.; Oliveira, L. C. A.; Carvalho, W. A.; Fuel Process. Technol. 2015, 138, 695. [Crossref]
» Crossref -
29 Lemos, C. O. T.; Rade, L. L.; Barrozo, M. A. S.; Cardozo-Filho, L.; Hori, C. E.; Fuel Process. Technol. 2018, 78, 1. [Crossref]
» Crossref -
30 Marinho, C. M.; Barrozo, M. A. S.; Hori, C. E.; Energy 2020, 207, 118301. [Crossref]
» Crossref -
31 Jia, G.; He, B.; Li, Y.; Liu, L.; Zhao, J.; Lv, B.; AIChE J. 2022, 68, 17610. [Crossref]
» Crossref -
32 Palanychamy, P.; Lim, S.; Yap, Y. H.; Leong, L. K.; Catalysts 2020, 12, 1487. [Crossref]
» Crossref -
33 Bhargava, A.; Shelke, S.; Dilkash, M.; Chaubal-Durve, N. S.; Patil, P. D.; Nadar, S. S.; Marghade, D.; Tiwari, M. S.; Rev. Chem. Eng. 2022, 39, 1187. [Crossref]
» Crossref - 34 Mendonça, C. J. S.; Luz, D. A.; Tavares, A. F. C. In Biocombustíveis de Babaçu: Ensaio Técnico sobre Oportunidades de Produção de Biocombustíveis a partir do Coco Babaçu; Maciel, A. P., ed.; EDUFMA: São Luís, Brazil, 2016, ch. 12.
-
35 Chaves, M. J. S.; Verbinnen, R. T.; Diniz, M. S.; Viana, J. L. M.; Mendonça, C. J. S.; Franco, T. C. R. S.; Rev. Virtual Quim. 2018, 10, 1474. [Crossref]
» Crossref -
36 Ribani, M.; Bottoli, C. B. G.; Collins, C. H.; Jardim, I. C. S. F.; Melo, L. F. C.; Quim. Nova 2004, 27, 771. [Crossref]
» Crossref - 37 Lanças, F. M. In Cromatografia Líquida Moderna, HPLC CLAE, 2nd ed.; Átomo: Campinas, Brazil, 2016, ch 13.
-
38 Agência Nacional de Vigilância Sanitária (ANVISA); Resolução No. 899, de 29 de maio de 2003, Determina a Publicação do Guia de Validação de Métodos Analíticos e Bioanalíticos; Diário Oficial da União (DOU), Brasília, No. 111, de 22/12/2000. [Link] accessed in January 2026
» Link -
39 DOQ-CGCRE-008: Orientação sobre Validação de Métodos Analíticos; INMETRO: Rio de Janeiro, 2020. [Link] accessed in January 2026
» Link -
40 Pimentel, M. F.; Barros Neto, B.; Quim. Nova 1996, 19, 268. [Link] accessed in January 2026
» Link -
41 Ribeiro, F. A. L.; Ferreira, M. M. C.; Morano, S. C.; Silva, L. R.; Schneider, R. P.; Quim. Nova 2007, 31, 164. [Crossref]
» Crossref -
42 Kubota, M.; Sakamoto, A.; Masanori, K.; Maeno, K.; Msuyama, A.; J. Oleo Sci. 2014, 63, 1057. [Crossref]
» Crossref
Edited by
-
Editor handled this article:
César Ricardo Teixeira Tarley (Associate)