 Baru, Macaw Palm, and Castor Oils as Promising Feedstocks for 3D-Printed Renewable Polymers
Abstract
The growing demand for renewable alternatives has driven the exploration of vegetable oils as promising raw materials for polymer production. In this study, three oils of relevance in Brazil, baru oil, macaw oil, and castor oil were characterized in terms of their iodine value, free fatty acid content, and thermal and spectroscopic properties. These oils were also structurally modified to obtain monomers suitable for 3D printing. Characterization was performed using thermoanalytical and spectroscopic techniques to evaluate thermal stability, degradation events, the presence of functional groups, fatty chain composition, and the conversion of each structural modification. The results revealed notable differences: baru oil presented significant levels of monounsaturated fatty chains, mainly oleate ester, which represents 48% of the total composition; the macaw oil showed the highest iodine value among the oils studied, while castor oil stood out for its high content of ricinoleate ester. Additionally, the results demonstrate that even low degrees of acrylation in epoxidized oils are sufficient to yield polymeric materials, underscoring the potential of these renewable resources for the development of sustainable polymers derived from natural feedstocks of Brazil.
Keywords:
vegetable oils; renewable polymers; photopolymerization; 3D printing; biobased monomers
Introduction
Interest in renewable alternatives to petroleum derivatives has intensified in recent decades, driven by both the need to reduce environmental impacts and the pursuit of a more sustainable economy.1 In this context, vegetable oils (VOs) stand out as promising raw materials, as they are predominantly composed of triglycerides and contain a wide variety of fatty chains whose structures allow for chemical modifications, including epoxidation, maleinization, and acrylation (or methacrylation) reactions, among others. Some examples are presented in Figure 1.2-4 Structural variability among different vegetable oils is a determining factor in their physicochemical properties and, consequently, in the selection of structural modification routes and industrial applications. Parameters such as acid, peroxide, and iodine values5-7 provide essential information about the composition, oxidation state, and degree of unsaturation of oils, allowing correlations between their individual characteristics and their performance in modification processes. Furthermore, the thermal properties of VOs are important for determining the temperature limits to be employed during modification reactions. In addition, the thermal profile of these precursors tends to change when new functional groups are incorporated into their structures, indicating the occurrence of structural modifications. Therefore, thermal characterization is a fundamental step for the targeted use of these renewable resources.
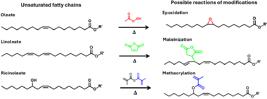
Examples of unsaturated fatty chains present in vegetable oils and representative reactions that can be performed to promote structural modification and enhanced reactivity.
In Brazil, the diversity of native and cultivated oilseeds offers a unique opportunity for the valorization of vegetable oils with distinct chemical profiles.8 Baru nut oil, obtained from Dipteryx alata, a native species of the Brazilian Cerrado, exhibits a high level of unsaturation and remains relatively underexplored in terms of polymer production.9 Macaw palm oil, derived from Acrocomia aculeata, a widely distributed native palm species, stands out for its non-edible nature10 and high oil productivity, with estimated yields of up to 4,000 L of oil per hectare11 (higher than that of soybean oil), which is widely used in the food industry.12 Castor oil, obtained from Ricinus communis, is non-competitive with food resources and is a well-established raw material in the chemical sector due to its high ricinoleate ester content. These characteristics confer unique properties and structural features, making it a promising precursor for polyurethane and polyester production.13,14
The versatility of VOs in the production of reactive monomers has been widely explored, yielding materials with diverse properties tailored for various applications. For example, Gaglieri et al.15 performed epoxidation and maleinization reactions on grape seed oil to produce thermosetting polymers. The resulting monomeric mixture showed potential for application as a coating on metallic and wooden surfaces. In another study, Alarcon et al.16 reacted carbonated macaw oil with different diamines to develop flexible and luminescent isocyanate-free polyurethanes. This approach not only represents a more sustainable and less hazardous route to obtaining renewable polymers but also contributes to reducing the carbon footprint, as the carbonation reaction utilizes carbon dioxide as a reagent. Dynamic polymer networks (DPNs), which contribute to the circular economy, can also be developed using VOs, enabling the production of polymers with self-healing properties.17 VOs also show potential in additive manufacturing, as demonstrated by dos Santos et al.,18 who incorporated acrylic groups into VO structures by reacting acrylic acid with epoxidized passion fruit oil. The resulting monomer was used with the type I photoinitiator diphenyl(2,4,6-trimethylbenzoyl)phosphine oxide in digital light processing (DLP) 3D printing of complex objects. Overall, VOs demonstrate strong potential to enhance the sustainability of materials production. Although some raw materials for VO production are seasonal, Santos et al.19 recently proposed a solution by developing VO blends with different mass fractions, resulting in mixtures with tailored iodine values suitable for renewable polymer development.
Despite the individual relevance of each oil, the combined spectroscopic and thermal analysis of baru, macaw, and castor oils reveals unique features and similarities that can guide their application in various industrial processes, particularly in the synthesis of sustainable monomers and renewable-based polymers. Thus, this work provides a comparative evaluation of oils with distinct fatty chain compositions, examining their structural and physicochemical characteristics. To produce renewable materials via photopolymerization, particularly vat photopolymerization 3D printing, all studied vegetable oils were structurally modified through epoxidation followed by acrylation, during which parallel reactions occurred. Therefore, we aimed to evaluate whether syntheses that did not achieve similar values of conversion, yield, and selectivity could still be successfully applied in vat photopolymerization 3D printing. Overall, this study not only advances the understanding of the potential of vegetable oils widely produced in Brazil for polymer production but also demonstrates their applicability as photocurable resins for greener additive manufacturing, even when conversion and selectivity are not maximized. Consequently, this work aligns with the Sustainable Development Goals (SDGs), particularly SDG 12, “Responsible Consumption and Production”.20
Experimental
Materials and reagents
The vegetable oils from baru nut (BO), macaw palm (MO), and castor bean (CO) were purchased from Mundo dos Óleos (Brasília-DF, Brazil), batches BA006/19, MAOP023/19, and 12-60319, respectively, and were used as received. In addition, sodium carbonate (99.5%), amberlite IR-120 (98.0%), imidazole (99.5%), hydroquinone (99.0%), and photoinitiator diphenyl (2,4,6-trimethylbenzoyl) phosphine oxide (TPO) (97.0%), hydrogen peroxide (50.0%), ethyl acetate (99.5%), magnesium sulfate (98.0%), acrylic acid (99.0%), diethyl ether (≥ 99.9%), acetic acid (99.7%), chloroform (99.8%), deuterated chloroform (99.8%), isopropyl alcohol (99.5%), toluene (99.8%), sodium thiosulfate (99.5%), potassium iodide (99.5%), and sodium hydroxide (97.0%) were obtained from Sigma-Aldrich. Starch and phenolphthalein 1% (m/v) solutions were used as indicators in the volumetric procedures.
Methods
Titrations: free fatty acids (FFA) and peroxide value (PV)
The free fatty acid (FFA) content represents the mass of potassium hydroxide (KOH), in milligrams, required to neutralize the free fatty acids present in 1 g of the sample. The FFA was determined by titration according to the ASTM D5555-95 standard.5
The peroxide value (PV) quantifies the active oxygen present in a sample, reflecting the concentration of peroxides and hydroperoxides formed during the initial stages of lipid oxidation. PV is expressed in milliequivalents of active oxygen per kilogram of sample (meq O2 kg-1) and was determined by iodometric titration according to the AOCS Cd 8-53 standard.6
Synthesis of epoxidized and acrylated vegetable oils
For the epoxidation reaction, a procedure described in the literature was followed with some modifications.11 The vegetable oil, acetic acid, and amberlite IR-120 were added to a round-bottom fask equipped with a magnetic stir bar and stirred for 30 min at 60 °C. Hydrogen peroxide (50%) was then added, and the reaction mixture was refluxed at 60 °C for 4 h. The reagents were used at a molar ratio of 1:6:1 (C=C:H2O2:CH3COOH). After cooling, 50 mL of ethyl acetate was added to the product, which was further filtered to recover the catalyst. The organic layer was then washed with a sodium carbonate solution (0.1 mol L-1), alternating with washes of water. This process was repeated until the aqueous phase reached a pH of 7.0, as verified using universal pH paper. Finally, the organic layer was concentrated using a rotary evaporator to obtain the epoxidized oil.
Prior to the acrylation reaction, the epoxide content of the epoxidized vegetable oils was determined according to the ASTM D1652-11 standard,21 yielding 0.32 mol of epoxy groups per 100 g of oil for epoxidized baru oil (EB) and epoxidized macaw oil (EM), and 0.20 mol per 100 g for epoxidized castor oil (EC).
The acrylation reaction was based on a literature procedure with minor modifications.4 The respective epoxidized oil was reacted with acrylic acid at a molar ratio of 1:3 (epoxide groups to acrylic acid), using imidazole as the catalyst (1 mol% relative to the epoxide groups) and hydroquinone as an inhibitor (1 mol% relative to the acrylic acid). The reaction was conducted under stirring for 3 h at 80 °C. After cooling, each reaction mixture was transferred to a separatory funnel with diethyl ether, and the organic phase was washed with water and a sodium carbonate solution (0.1 mol L-1) until the aqueous phase reached pH 7.0. The organic phase was then dried over magnesium sulfate, vacuum-filtered, and the solvent was removed to obtain the corresponding acrylated vegetable oil.
Table 1 shows the acronym for each vegetable oil used as well as for each product obtained after epoxidation and acrylation.
Resin formulation
Each acrylated vegetable oil was used to produce polymeric materials via photopolymerization. Accordingly, photocurable resins were prepared by mixing the respective modified vegetable oil with 3 wt.% of the type I photoinitiator diphenyl(2,4,6-trimethylbenzoyl)phosphine oxide (TPO). After the addition of TPO, the mixtures were stirred at room temperature for 30 min prior to characterization or application. In this case, three resins were obtained (Table 1): acrylated baru oil (AB) + TPO (denoted as ABR), acrylated macaw oil (AM) + TPO (denoted as AMR), and acrylated castor oil (AC) + TPO (denoted as ACR).
Characterization
Thermal analysis: simultaneous thermogravimetric-differential thermal analysis (TG-DTA); differential scanning calorimetry (DSC)
Simultaneous thermogravimetric-differential thermal analysis (TG-DTA) was performed on a STA 449F3 (NETZSCH) equipment, using approximately 10 mg of sample and open α-alumina crucibles (200 µL). The analyses were conducted in a dry air atmosphere, with a flow rate of 70 mL min-1, and a heating rate of 10 °C min-1 in the temperature range of 30 to 800 °C. The thermal stability and temperature intervals of mass loss were determined using TG curves and their first derivative curve (DTG). Therefore, from this point forward, the technique TG-DTA will be referred to throughout the text as “TG/DTG-DTA”.
Differential scanning calorimetry (DSC) curves were obtained on a DSC1 Stare (Mettler-Toledo) equipment, using closed aluminum crucibles (40 µL) with a perforated lid and approximately 5 mg of sample. The analyses were performed under dry air atmosphere, with a flow rate of 50 mL min-1, applying a heating rate of 10 °C min-1 in the range of –30 °C to the temperature corresponding to the thermal stability of each system analyzed.
Spectroscopy analysis: mid-infrared spectroscopy (MIR) and proton nuclear magnetic resonance (1H NMR)
Mid-infrared (MIR) spectra were obtained using a Bruker Vertex 70 spectrometer equipped with a diamond crystal attenuated total reflectance (ATR) accessory. Analyses were performed in the 4000-400 cm-1 range, with 32 scans and a resolution of 4 cm-1. The degree of monomer-to-polymer conversion was determined by MIR analysis using the same equipment described above. For this purpose, each resin was spread onto the diamond crystal and subsequently irradiated with ultraviolet light (UV) (370 nm) for 120 s using a Kessil PR160 lamp at 100% intensity (Emax = 352.0 mW cm-2), with a distance of 2 mm between the lamp and the resin surface. A spectrum was collected every 10 s over a total irradiation time of 120 s. The decrease in the integrated area of the C=C band at 1640 cm-1 was monitored over time.4 This band corresponds to the vinyl groups present in the acrylic moieties of the triglyceride chains. All spectra were normalized using the band attributed to C-H stretching in methylene groups at 2856 cm-1. The monomer conversion (MC%) was calculated using equation 1, where At=0 represents the integrated area of the C=C band in the initial monomer mixture, and At=x corresponds to the same band at different irradiation times.
The rate of polymerization (Rp) was determined from MIR spectra according to the literature22 and using equation 2, where ΔA is the difference between the areas of the C=C band before and after 10 s of irradiation, A0 is the area of this band prior to UV exposure (i.e., in the resin), and Δt is the time interval between the two measurements, equal to 10 s. All spectra were normalized as described above.
All 1H NMR spectra were obtained in an Agilent 400 MHz Premium Shield spectrometer, using deuterated chloroform (CDCl3) as solvent. Before any calculation, all spectra were normalized by integrating the methylene hydrogens of the α-carbonyl groups (2.30 ppm) as six hydrogens. The iodine value (IV) was calculated using equation 3, considering the integration of the multiplet between 5.2-5.6 ppm, which refers to the vinylic hydrogens attached to the carbons of the double bond. In this equation, K corresponds to the sum of the integrations of these spectral regions.23
The average number of double bonds (DBaverage) per triglyceride molecule was determined using equation 4, in which K is the integration value of the vinyl hydrogens signal at 5.30 ppm, Nf refers to the four methylene hydrogens of the glycerol backbone, whose signals appear at 4.14 and 4.29 ppm, and the value obtained is divided by the total number of related hydrogens.23
Furthermore, the fatty chain profile was determined following the method described by Guillén and Ruiz,24 using equations 5-8.
where Ln, L, O and Sat represent the percentage of linolenic, linoleic, oleic, and saturated fatty chains, respectively. The symbol “I” denotes the signal integration, and the corresponding subscript numbers indicate the area of the respective hydrogen signals. Signals 1 and 2 correspond to terminal methyl hydrogens of the fatty chains at 0.86 and 0.96 ppm, respectively, with the signal at 0.96 ppm being characteristic of linolenic chains. Signals 3, 4, and 5 correspond to allylic hydrogens (1.98 ppm), α-carbonyl hydrogens of the acyl chains (2.29 ppm), and bis-allylic hydrogens (2.74 ppm), which are present only in linoleic and linolenic chains.
Conversion (X%), selectivity (S%) and yield (Y%) values for the epoxidized systems were calculated based on the literature25 using equations 9-11. In these calculations, the IV was determined from the corresponding 1H NMR spectra, EO represents the epoxy content in the sample (determined by titration), and EOmax is the maximum theoretical epoxy content considering the experimental conversion. Finally, the variables X and S used in the yield calculation (equation 11) correspond to the respective fractional values (X%) and (S%).
Furthermore, using equation 12, the average number of acrylate groups per molecule was calculated, where C and αH correspond to the integrated areas of the respective 1H NMR signals: the vinylic hydrogen of the acrylate group (5.70-6.40 ppm) and the α-carbonyl hydrogens of the acyl chain (2.3 ppm).
3D printing test
For the tests, approximately 100 g of each resin were used. The exposure time and layer height were adjusted to ensure adequate interfacial adhesion of the solidified resin to the build plate during printing. The exposure time was set to 15 s for each layer, except for the base layers, which were exposed for 60 s. The layer height was 0.05 mm. The tests were performed using an Elegoo Mars 2 Pro 3D printer (405 nm), followed by washing in an Elegoo Mercury Plus system using isopropyl alcohol and post-curing under 405 nm light. The printing parameters were kept constant for all samples, and the printed parts were characterized by TG/DTG-DTA and DSC.
Results and Discussion
Characterization of vegetable oils
The FFA value is an important parameter for assessing vegetable oil quality, as it indicates the extent of triglyceride hydrolysis that may occur during storage, handling, or processing. Furthermore, a high FFA content can impair the mechanical properties of the resulting polymers, as free fatty acid chains do not participate in the formation of a cross-linked network. According to ASTM D5554-15,7 the FFA results, expressed as percentage of oleic acid, were converted into acid value (mg KOH g-1 of oil) using a conversion factor of 1.99. This factor is based on the stoichiometric relationship between the amount of free fatty acids present and the amount of potassium hydroxide required for their neutralization, with the acid value defined as the milligrams of KOH necessary to neutralize the free fatty acids in 1.0 g of sample. The acid values are presented in Table 2.
BO exhibited the lowest acid value 0.40 ± 0.20 mg KOH g-1.26 According to the Codex Alimentarius,27 the maximum acid value for unrefined, cold-pressed oils is 4.0 mg KOH g-1. The determined value for BO is significantly below this limit, demonstrating high raw material quality and reflecting effective extraction and handling.28,29 In addition, this low acidity suggests that the triglycerides remain largely intact, reflecting appropriate processing and storage conditions to avoid hydrolysis.
In contrast, while fresh samples typically show low acidity (near 2 mg KOH g-1),30 extraction methods, storage conditions, or intense enzymatic activity in the pulp can lead to much higher values. This was observed in MO, where an acid value corresponding to 55.3 ± 0.4 mg KOH g-1 was found, which may be a result of the parameters used during the extraction process (such as time and drying temperature) or triglyceride breakdown caused by enzymatic activity.31
CO is characterized by a predominance of ricinoleate chains (> 84%).32 In this study, CO showed an FFA value of 3.3 ± 0.3%, corresponding to an acid value of 6.6 ± 0.6 mg KOH g-1, placing it in an intermediate position relative to the other oils. This aligns with the literature, which reports FFA of approximately 3.4%,32 indicating a moderate degree of hydrolysis and suggesting adequate preservation prior to chemical modification. The values are shown in Table 2.
The PV is essential for evaluating oxidative stability, as it quantifies the peroxides and hydroperoxides formed during the initial stages of lipid oxidation.33 Following their formation, unsaturated fatty chains decompose into aldehydes, ketones, and smaller fragments.34,35 This degradation consumes double bonds, reducing the reactive sites available for functionalization. Consequently, monomer production is hindered, potentially resulting in polymers with lower cross-linking density compared to those derived from oils with lower PV.
Among the analyzed oils, BO showed a PV of 6.3 ± 0.9 meq O2 kg-1, indicating greater oxidative susceptibility than soybean oil reported in other work.36 MO presented an intermediate value of 1.6 ± 0.3 meq O2 kg-1, while CO demonstrated high stability at 0.7 ± 0.1 meq O2 kg-1. These results confirm that CO and MO do not oxidize as readily as BO.36 Notably, these values are highly dependent on extraction methods, storage temperature, humidity, light exposure, and the presence of natural antioxidants or impurities.37,38
Due to the similarity of MIR spectra of BO, MO, and CO to those of other vegetable oils, their MIR spectra, as well as their corresponding discussions, are presented in the Figure S1, Supplementary Information (SI) section.
The 1H NMR spectra of vegetable oils are presented in Figure 2. The representative structure at the top of Figure 2 is associated with BO and MO, in which each letter corresponds to the respective proton signal in the 1H NMR spectra. BO (Figure 2a) and MO (Figure 2b) present a small signal at 0.98 ppm (magnified and highlighted in grey), which is related to the terminal methyl group present in linolenate chains. Although the main signals in the MO spectrum present similar chemical shifts to those of BO, the presence of small signals between 3.85-3.45 ppm (magnified and highlighted in orange) is observed. In addition, the region of double doublet resulting from the protons bonded to the glycerol backbone (indicated by letter ‘h’) between 4.40-4.10 ppm also presents small and overlapping signals (magnified and highlighted in blue). Comparing the regions between 2.34-2.28 ppm (magnified and highlighted in green in all spectra), it is clear that the multiplet of MO presents more signals than those observed for BO and CO. This region results from methylene protons (indicated by the letter ‘f’) of all fatty chains in the triglyceride and may also result from diglycerides, which can be found in MO oils.39 Therefore, the resulting integrations present small values compared to those obtained for the other VOs. These few variations in the MO spectrum may be attributed to the presence of minor components in this VO, such as carotenoids, tocopherols, sterols, and diglycerides.39,40 Although a deeper study involving spectroscopic studies is required to attribute each signal in the 1H NMR spectrum to each structure, in the present work it is clear that they are present in MO and affect the thermal behavior of this vegetable oil.

The representative structure of CO is present together with its spectrum (Figure 2c), which does not show the signals related to small contaminants as observed for MO. However, due to the ricinoleate chains, new signals are observed between 2.24-2.17 ppm (magnified and highlighted in red) and 3.65-3.57 ppm (magnified and highlighted in yellow). In addition, the presence of a hydroxyl group at the C12 of the fatty chain affects the chemical shift of vinyl protons of ricinoleate chains (indicated by the letters ‘m’ and ‘n’, respectively).23
Although none of the VOs present the signal related to the proton of free acid chains (between 10 and 13 ppm, regions highlighted in purple), the titration related to the acid value indicates that all of them contain traces of these chains (Table 2). The absence of signals in this region is attributed to the solvent CDCl3 used in the analysis.
Based on the respective spectra of each VO, it was possible to obtain the IV values, DBaverage, and fatty chain profiles of each vegetable oil. The resulting values are shown in Table 3, in which the IV of BO and MO are close to those reported in the literature (BOIV = 103.5 ± 0.9 and MOIV = 116.0 ± 0.6 g of I2 per 100 g of vegetable oil).11 In the case of CO, a difference in the IV was observed compared with the literature (COIV = 102.2 g of I2 per 100 g of vegetable oil),23 which may be associated with the amount of ricinoleate chains in the VO. Therefore, this highlights the importance of thoroughly characterizing the oil prior to its chemical modification reactions. It seems that MO presented the highest IV as well as DBaverage, which is attributed to the high content of polyunsaturated (45.2%) and monounsaturated (39.3%) chains. Although it was not possible to calculate the fatty chain profile of CO using the same method used for BO and MO, it is expected that most fatty chains in CO are ricinoleates. However, DBaverage > 3 suggests that some chains linked to the glycerol backbone present at least two double bonds. As the DBaverage for CO was equal to 3.2, and there is a signal related to the bis-allylic proton at 2.7 ppm (signal ‘g’ in the spectra), it is suggested that a small fraction of fatty chain is linoleate (C18:2).
Iodine value (IV), double bond average (DBaverage), and fatty chains profile calculated for different vegetable oils based on their respective 1H NMR spectra
The TG/DTG-DTA curves for BO, MO, and CO presented in Figures S2a-S2c and Table S1(SI section) summarizes information on the temperature range (θ), mass loss values (Δm) and peak temperatures (Tp), maximum degradation rates (MDR), as well as the respective temperatures (TMDR) associated with each mass loss stage of the samples.
BO, MO, and CO exhibit thermal stability at 226.5, 181.9 and 223.9 °C, respectively. Thermal stability generally decreases with an increase in the amount of double bonds.41 However, MO presents lower thermal stability than expected, since its IV is similar to that of BO. This difference may be attributed to the presence of carotenoids (suggested by 1H NMR), which are compounds highly sensitive to the action of oxygen, light, and heat.42 In this study, MO exhibited lower thermal stability than that reported for the same oil in the literature.11 This behavior may be attributed to the predominant presence of β-carotene in MO, which can contribute to reduced thermal stability.43 Variations in the carotenoid content are likely intrinsically related to the extraction methods employed. The detailed discussion of the thermal decomposition of each vegetable oil is available in the SI section, along with their respective TG/DTG-DTA curves.
The DSC curves of vegetable oils are shown in Figure 3. In BO (Figure 3a), during the first cooling, an exothermic event is observed starting at –20.5 °C and attributed to its crystallization;11 its magnification can be seen in the center of the BO curve (Figure 3a). The end of this event is observed during the isotherm (Figure 3b), resulting in a ΔH = 3.71 J g-1. When the sample is subjected to the first heating, a large endothermic event is observed, which is associated with melting and occurs between –23.2 and –2.9 °C (ΔH = 7.70 J g-1). During the second cooling, the exothermic crystallization event occurs between –20.4 and –29.7 °C (Figure 3c), resulting in an enthalpy of ΔH = 7.71 J g-1. The second heating maintained the characteristics of the first.

DSC curves and their respective magnifications of cooling isotherms at the first and second stage for the systems. (a-c) BO, (d-f) MO and (g-i) CO.
The DSC curve for MO (Figure 3d) is similar to that of BO. Thus, in the first cooling stage, an exothermic event occurs between –12.5 and –23.8 °C (ΔH = 1.77 J g-1), which is related to sample solidification.11 As expected, this event also appears during the second cooling between –9.7 and –20.6 °C (ΔH = 0.86 J g-1). The cooling stages, as well as the isotherms at –30 ºC are presented in Figures 3e and 3f. As expected, the melting process occurs during the heating stages, resulting in an endothermic event between –22.4 and –0.5 °C (ΔH = 8.26 J g-1) in the first heating stage and between –22.3 and –1.3 °C (ΔH = 8.70 J g-1) in the second one.
In the DSC curves of CO (Figures 3g-3i), no thermal events are observed under experimental conditions.
Characterization of modified vegetable oils: epoxidized and acrylated vegetable oils
The MIR spectra of the epoxidized oils (Figures 4a-4c) show a reduction in the characteristic bands of alkene groups, namely C=C stretching (highlighted in red) and =C-H stretching (highlighted in blue), indicating that these unsaturations were consumed during the reaction, although not completely, as later confirmed by ¹H NMR data. The appearance of a new band near 840 cm-1 (highlighted in yellow in Figures 4a-4f) is also observed and is attributed to the C-O-C stretching of the epoxy ring.11

MIR spectra for modified vegetable oils. (a) EB, (b) EM, (c) EC, (d) AB, (e) AM, and (f) AC.
The spectra of the acrylated oils (Figures 4d-4f) show the presence of double bonds, evidenced by the band at 1640 cm-1 (highlighted in red), characteristic of acrylic groups. Bands in the region between 1100 and 1200 cm-1 (highlighted in green) are attributed to the stretching of α,β-unsaturated esters [C=C-C(=O)-O-C].4 In the range of 3600-3200 cm-1, broad bands are observed (highlighted in gray), indicative of O-H groups from free alcohols. The spectrum of acrylated castor oil (AC) shows the most intense band in this region, which is attributed to the presence of hydroxyl groups in the structure of castor oil, originating from ricinoleate ester chains.44 Furthermore, characteristic bands of the epoxide ring are still observed (highlighted in yellow), indicating incomplete conversion, which was later confirmed by conversion data obtained from ¹H NMR.
The ¹H NMR spectrum of EB is shown in Figure 5a, while the spectra of EM and EC are presented in Figures S3a and S3c (SI section), respectively. A decrease in the signals corresponding to vinyl hydrogens (5.30-5.60 ppm) can be observed, indicating that the epoxidation reaction has occurred. Signals associated with the formed epoxide rings are also observed between 3.15 and 2.86 ppm (highlighted in green).11,12

The conversion of double bonds after the epoxidation reaction was calculated for each vegetable oil based on the decrease in the integral of the vinyl hydrogen signal. This approach allows the determination of the IV of the epoxidized system, which is then used in equation 9. Additionally, the selectivity (S) and yield (Y) of the epoxidation reaction were calculated using equations 10 and 11,2 respectively (Table 4).
Conversion, selectivity, and yield values of the epoxidation reactions, and conversion of epoxy rings throughout the acrylation reaction
All systems exhibited double-bond conversions ≥ 98%. However, the epoxy content (Table 4) indicates that not all consumed double bonds were converted into epoxy rings by the end of the reaction. This observation is supported by the MIR results, in which all systems show a broad band around 3000 cm-1, characteristic of structures formed after epoxy ring opening. Accordingly, the selectivity values calculated using equation 10 (Table 4) are consistent with these findings.
Consequently, the yield values are lower than the corresponding conversion values, indicating the occurrence of parallel reactions. Although EC exhibits conversion comparable to the other systems (ca. 98%), it shows the lowest selectivity (55.2%) and yield (54.3%). This behavior is likely due to reactions between epoxy rings and hydroxyl groups inherently present in ricinoleate chains. As a result, EC is prone to both inter- and intramolecular side reactions involving epoxy groups, in addition to reactions with species present in the reaction medium. In contrast, EB and EM primarily undergo side reactions with external reactants.
After acrylation, signals corresponding to epoxide groups are still present, albeit with lower intensity, as observed in the spectrum of AB (Figure 5b) and in the spectra of AM and AC (Figures S3b and S3d, SI section), indicating incomplete conversion of epoxide rings into acrylic groups. Furthermore, the incorporation of acrylic groups into the oil structure is evidenced by signals attributed to vinyl hydrogens appearing between 5.80 and 6.50 ppm (highlighted in blue). The conversion of epoxide groups into acrylic groups was determined by monitoring the decrease in the integral of the epoxide signal after the reaction. As shown in Table 4, EB and EM exhibited similar epoxide consumption, resulting in comparable conversion values. In contrast, EC showed the lowest conversion, suggesting that the presence of hydroxyl groups may affect the reaction kinetics under the same conditions. This may also help explain the relatively low conversions of EB and EM into AB and AM, respectively, since parallel reactions during the epoxidation step may lead to epoxy ring opening and the formation of hydroxyl groups.
The number of acrylate groups per sample was determined by ¹H NMR and calculated using equation 12, yielding values of 2.3 for AB, 2.8 for AM, and 2.3 for AC. These values are directly related to the number of reactive sites available for the formation of crosslinked polymer networks during photopolymerization. Nevertheless, even with relatively low conversion values, it was possible to obtain polymeric materials via vat photopolymerization 3D printing.
Due to the similarity of the 1H NMR spectra and to avoid repetitive discussion, the complete spectra of EM, AM, EC, and AC are provided in the SI section (Figures S3a-S3d).
Among the epoxidized oils, the thermal stability temperatures were 125.4 °C for EB and 126.9 °C for EM (Figures S4a and S4c, SI section, respectively), and 111.1 °C for EC (Figure 6). For all systems, a reduction in thermal stability is observed relative to the raw oils, indicating that the introduced epoxide groups are more susceptible to thermal ring opening, which promotes fragmentation of the fatty chains at lower temperatures.45 This process occurs in consecutive steps, explaining the complex nature of the degradation behavior, as evidenced by the multiple stages observed in the DTG curves. The lower thermal stability observed for EC may be attributed to the higher content of hydroxyl groups in its structure, consistent with its lower selectivity and yield values (Table 4). Samples EB and EM exhibit decomposition in two main stages, as shown in the TG curves. The first stage is characterized by a complex process involving consecutive and partially overlapping reactions, as evidenced by the DTG curves. The second stage is associated with the degradation of carbonaceous material. Overall, the curves show similar behavior, indicating comparable decomposition profiles among the analyzed samples. All TG/DTG-DTA data for the epoxidized vegetable oils are summarized in Table S2 (SI section).
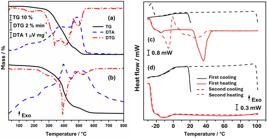
TG/DTG-DTA curves for (a) EC, (b) AC, and DSC curves for (c) EB, and (d) AB in dry air atmosphere.
Among the acrylated oils, AC (Figure 6b) showed the lowest thermal stability temperature (130.2 °C), while AB (Figure S4b, SI section) and AM (Figure S4d, SI section) exhibited similar values of 164.3 and 162.7 °C, respectively. In general, under a dry air atmosphere, the first mass-loss step observed for acrylated oils is associated with the degradation of functional groups introduced during chemical modification, while subsequent steps are related to the degradation of the triglyceride chains, followed by the oxidation of carbonaceous material.4,18 Table S3 (SI section) summarizes all TG/DTG-DTA data for the acrylated vegetable oils.
The DSC curve corresponding to EB is presented in Figure 6c, and it shows a thermal behavior distinct from that observed for BO (Figure 3a). During the first cooling, no thermal event is detected, while during the first heating, two endothermic events are present. The first occurs at –12.5 °C (Tp), with a ΔH= 4.84 J g-1, and may be associated with the melting of triacylglycerols with poorly intersoluble chains, particularly those containing a higher proportion of saturated fatty acids. The second endothermic event corresponds to a peak at 40.8 °C and ΔH = 62.86 J g-1, related to the melting of the main structure of EB, as the intermolecular interaction between epoxides is higher than the C=C interaction.46 In the second cooling stage, the observed thermal event ends at the isotherm (Figure S5a, SI section). The melting process of the less intersoluble compounds occurs in a single stage, with a peak at –3.4 °C, and an exothermic event is also observed at 1.5 °C. This event may be associated with a solid transition between different crystalline forms, possibly resulting from the rapid cooling of the material, which can lead to the formation of a less stable solid phase than that obtained after solidification at room temperature. This thermal behavior is in accordance with that previously reported for epoxidized baru oil.11 The DSC curve corresponding to EM (Figure S6a, SI section) shows an exothermic peak at –23.6 °C during the first cooling, associated with the crystallization process; its cooling isotherms are shown in Figure S5b (SI section). The melting process occurs in both heating cycles, between –25.4 and 4.9 °C (ΔH = 15.00 J g-1) in the first stage and between –24.4 and 4.2 °C (ΔH = 13.00 J g-1) in the second stage. In the EC DSC curve (Figure S6c, SI section), an endothermic event associated with the melting of the sample is observed between –5.1 and 19. °C (ΔH = 1.50 J g-1). In the second heating, this same event is observed occurring between –22.0 and –12.6 °C (ΔH = 0.60 J g-1) and between –8.3 and 6.0 °C (ΔH = 3.11 J g-1). The decrease in the baseline observed in the first heating stage, absent in the second heating, is related to the loss of residual solvent, an interpretation corroborated by the TG curves, which show small mass losses before the onset of thermal stability. The cooling isotherms of the sample are shown in Figure 5c.
The DSC curves of the acrylated oils show similar behavior in the heating and cooling cycles. For AB (Figure 6d), an endothermic event is observed between –17.5 and 2.3 °C (ΔH = 3.14 J g-1) during the first heating and between –16.9 and 2.3 °C (ΔH = 3.05 J g-1) during the second, associated with the melting process. The isotherms of AB are shown in Figure 5d. In the AM sample (Figure S6b, SI section), the beginning of an exothermic event is observed during the first cooling, ending at the isotherm (Figure S5e, SI section), and is related to its crystallization. In the heating cycles, endothermic events are observed between –12.6 and 8.4 °C (ΔH = 5.40 J g-1) in the first stage and between –11.5 and 8.5 °C (ΔH = 4.40 J g-1) in the second, corresponding to the melting process. In the AC curve (Figure S6d, SI section), only a small endothermic event is observed near the baseline in the first heating cycle. Since the curve did not return to the baseline, it was not possible to accurately determine the temperature limits or the enthalpy associated with this event. Their cooling isotherms are shown in Figure 5f.
Photopolymerization, 3D printing, and thermal characterization of polymers
In Figure 7a, it is possible to observe a graph correlating the MC% values (calculated using equation 1) with the time of photopolymerization for each resin. In Table S4 (SI section), the MC% values at 120 s and the Rp at 10 s for each formulation are shown. At the end of 120 s, all resins presented a high conversion degree, as ABR reached a conversion of 86.3 ± 3.0%, while AMR showed 89.5 ± 1.5% and ACR 82.6 ± 2.0%.

(a) Monomer conversion (MC%), (b) rate of polymerization (Rp) under UV light (370 nm), and (c) polymers from vat photopolymerization.
Regarding Rp (Figure 7b), all resins reached their maximum values at 10 s, indicating a rapid polymerization process. Notably, ABR exhibited the highest Rp (0.089 ± 0.002 s–1), although this value did not differ significantly from those of AMR (0.074 ± 0.004 s-¹) and ACR (0.078 ± 0.002 s-¹). Overall, these results confirm that all resins exhibit good photopolymerization performance, achieving high conversion and polymerization rates within short times.
Due to the suitability of the acrylated vegetable oils for rapid polymerization under UV irradiation in the presence of the photoinitiator TPO, they were subjected to 3D printing tests, and the resulting objects are shown in Figure 7c. In general, all monomers were able to produce simple printed shapes.
Visually, the polymers exhibited a yellowish color, with samples derived from baru and macaw oils showing a more intense hue, a characteristic already observed in the liquid precursors. Furthermore, the materials obtained exhibited malleable behavior after curing, as assessed by qualitative tests. These results demonstrate that, even with relatively low conversion of epoxy rings into acrylic groups, the resulting resins are capable of producing simple printed objects.
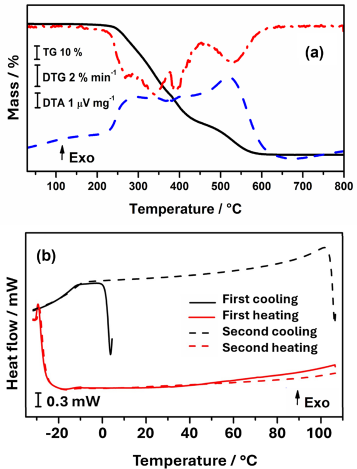
As the TG/DTG-DTA curves of all polymers are similar, only the polymer of acrylated castor oil resin (PACR) curves are presented in Figure 8a. The curves for polymers of acrylated baru oil resin (PABR) and acrylated macaw oil resin (PAMR) are available in the SI section, in Figures S8a and S8b, while the data related to the TG/DTG-DTA curves are presented in Table S5 (SI section). A small mass loss (ca. 1%) is observed for all samples before the temperature of thermal stability, which resulted from the evaporation of residual isopropanol, a solvent used to wash the materials after printing and prior to the post-cure process. As expected, after photopolymerization, an increase in the thermal stability of the polymeric materials is observed in relation to their respective acrylate precursors: 209.2 °C for PABR, 209.3 °C for PAMR, and 207.7 °C for PACR. This behavior can be attributed to the formation of a crosslinked network structure, which restricts chain mobility and makes the thermal degradation process less favored. Based on TG/DTG curves, it was noticed that the materials present consecutive and overlapping mass loss events during their degradation process.18
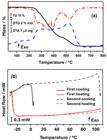
For polymeric materials, PABR (Figure 8b) exhibits a glass transition Tg (Figure S9, SI section) with a mid-point at 3.8 °C in the first heating and 3.5 °C in the second. In the PAMR (Figure S8c, SI section), the glass transition (Tg) occurs at –10.5 and –9.2 °C in the first and second heating, respectively.
Endothermic events occur below room temperature, which is consistent with the temperature ranges observed for the acrylated monomers. Therefore, these events can be attributed to the presence of residual monomers and saturated chain components in the polymer network. In the PACR (Figure S8d, SI section), under the experimental conditions used, it was not possible to clearly identify the glass transition temperature. However, an endothermic event is observed in the first heating between 47.8 and 66.0 °C, which may be associated with the evaporation of residual solvent (since isopropyl alcohol was used to wash the object after the printing process).
Under the experimental conditions employed, VOs with distinct IV and epoxide-to-acrylate conversions of approximately 50% (for AB and AM) yielded resins capable of producing simple objects via vat photopolymerization 3D printing, with comparable thermal properties. However, the occurrence of parallel reactions during the epoxidation process, evidenced by the discrepancy between conversion values obtained by ¹H NMR and epoxy content determined by titration, highlights the need for further investigation to optimize the synthetic conditions according to the intrinsic structural characteristics of each vegetable oil. Nevertheless, this study advances the use of Brazilian renewable precursors for the development of greener additive manufacturing materials.
Conclusions
Physicochemical and structural characterizations revealed clear distinctions among BO, MO, and CO oils. BO and CO exhibited low acid values, indicating a low content of free fatty acids, while MO exhibited slightly higher acidity, indicating a higher content of free fatty acids. FTIR and 1H NMR confirmed the typical triglyceride structure of the oils, in agreement with iodine value results, which indicated MO as the most unsaturated oil. After epoxidation, spectroscopic analyses confirmed the conversion of double bonds into epoxy groups while preserving the main triglyceride structure. Acrylation was also successfully achieved, as evidenced by the appearance of characteristic acrylate signals. Thermal analyses showed a decrease in stability after epoxidation and an increase after photopolymerization, indicating the formation of crosslinked networks. All acrylated oils were successfully photopolymerized, forming solid materials. The resins exhibited efficient curing behavior, indicating good reactivity under the applied conditions. The resulting polymers showed similar thermal stability, indicating comparable crosslinking efficiency among the systems. Additionally, the materials were suitable for 3D printing, yielding flexible structures, enabling targeted monomer design with potential for additive manufacturing applications. Overall, BO, MO, and CO are promising renewable feedstocks to produce epoxidized and acrylated monomers for further polymer production, offering sustainable alternatives to conventional oils and enabling targeted monomer design based on their chemical and thermal properties.
Supplementary Information
Supplementary information (additional results, discussions, figures, and tables) is available free of charge at http://jbcs.sbq.org.br as PDF file.
Supplementary PDF
Acknowledgments
The authors are grateful to the Brazilian agencies: CNPq (grant Nos. 167096/2025-7, 303968/2024-9), FAPESP (grant Nos. 2024/14279-1, 2024/00779-2, 2025/25333-0), CAPES (grant No. 88887.146236/2025-00). The authors acknowledge the multi-user equipment center of the Faculty of Sciences (CEMFC) and FAPESP (grant Nos. 09/14628-6, 24/02935-1) for the MIR analyses.
ChatGPT (OpenAI, GPT-5.3) was used solely to assist with grammar and language correction under human supervision. The authors reviewed and approved all content to ensure accuracy and intended meaning.
Data Availability Statement
The authors confirm that the data supporting the findings of this study are available within the text.
References
-
1 Meier, M. A. R.; Metzger, J. O.; Schubert, U. S.; Chem. Soc. Rev. 2007, 36, 1788. [Crossref]
» Crossref -
2 Gaglieri, C.; Alarcon, R.; de Moura, A.; Magri, R.; da Silva-Filho, L.; Bannach, G.; J. Braz. Chem. Soc. 2021, 32, 2120. [Crossref]
» Crossref -
3 Magri, R.; Gaglieri, C.; Alarcon, R. T.; dos Santos, G. I.; Bannach, G.; J. Polym. Res. 2023, 30, 236. [Crossref]
» Crossref -
4 Alarcon, R. T.; Gaglieri, C.; Lamb, K. J.; Cavalheiro, E. T. G.; North, M.; Bannach, G.; J. Polym. Res. 2021, 28, 425. [Crossref]
» Crossref - 5 ASTM D5555-95: Standard Test Method for Determination of Free Fatty Acids Contained in Animal, Marine, and Vegetable Fats and Oils Used in Fat Liquors and Stuffing Compounds, Philadelphia, PA, USA, 2023.
- 6 AOCS Cd 8-53: Peroxide Value Acetic Acid-Chloroform Method, Champaign, IL, USA, 2017.
- 7 ASTM D5554-15: Standard Test Method for Determination of Iodine Value of Fats and Oils, Philadelphia, PA, USA, 2015.
-
8 Correa, K. L.; de Carvalho-Guimarães, F. B.; Mourão, E. S.; Santos, H. C. O.; Sanches, S. C. C.; Lamarão, M. L. N.; Pereira, R. R.; Barbosa, W. L. R.; Ribeiro-Costa, R. M.; Converti, A.; Silva-Junior, J. O. C.; Foods 2024, 13, 1565. [Crossref]
» Crossref -
9 Fetzer, D. L.; Cruz, P. N.; Hamerski, F.; Corazza, M. L.; J. Supercrit. Fluids 2018, 137, 23. [Crossref]
» Crossref -
10 Silva, L. N.; Cardoso, C. C.; Pasa, V. M. D.; Bioenergy Res. 2016, 9, 864. [Crossref]
» Crossref -
11 Alarcon, R. T.; Gaglieri, C.; Lamb, K. J.; North, M.; Bannach, G.; Ind. Crops Prod. 2020, 154, 112585. [Crossref]
» Crossref -
12 Alarcon, R. T.; Lamb, K. J.; Bannach, G.; North, M.; ChemSusChem 2021, 14, 169. [Crossref]
» Crossref -
13 Ristic, I. S.; Budinski-Simendic, J.; Krakovsky, I.; Valentova, H.; Radicevic, R.; Cakic, S.; Nikolic, N.; Mater. Chem. Phys. 2012, 132, 74. [Crossref]
» Crossref -
14 Zhang, Y.; Lei, Q.; Zhang, S.; Dai, L.; Lyu, B.; Liu, L.; ACS Sustainable Chem. Eng. 2025, 13, 374. [Crossref]
» Crossref -
15 Gaglieri, C.; Alarcon, R. T.; Magri, R.; North, M.; Bannach, G.; J. Appl. Polym. Sci. 2022, 139, e52990. [Crossref]
» Crossref -
16 Alarcon, R. T.; Gaglieri, C.; Bannach, G.; Cavalheiro, E. T. G.; Green Chem. 2024, 26, 3261. [Crossref]
» Crossref -
17 Gaglieri, C.; Alarcon, R. T.; dos Santos, G. I.; Bannach, G.; J. Therm. Anal. Calorim. 2025, 150, 6697. [Crossref]
» Crossref -
18 dos Santos, G. I.; Gaglieri, C.; Alarcon, R. T.; Magri, R.; Hartlieb, M.; Bannach, G.; J. Polym. Environ. 2024, 32, 4748. [Crossref]
» Crossref -
19 Santos, F. B.; Gaglieri, C.; dos Santos, G. I.; Alarcon, R. T.; Bannach, G.; J. Polym. Res. 2024, 31, 334. [Crossref]
» Crossref -
20 United Nations; Sustainable Development Goals [Link] accessed in January 2026
» Link - 21 ASTM D1652-11: Standard Test Method for Epoxy Content of Epoxy Resins, Philadelphia, PA, USA, 2019.
-
22 dos Santos, G. I.; Gaglieri, C.; Santos, F. B.; Moreno, S. M.; Bannach, G.; Polym. Chem. 2026, 17, 1461. [Crossref]
» Crossref -
23 Alarcon, R. T.; Bergoglio, M.; Cavalheiro, E. T. G.; Sangermano, M.; Polymers 2025, 17, 587. [Crossref]
» Crossref -
24 Guillén, M. D.; Ruiz, A.; Eur. J. Lipid Sci. Technol. 2003, 105, 688. [Crossref]
» Crossref -
25 Catalá, J.; García-Vargas, J. M.; Ramos, M. J.; Rodríguez, J. F.; García, M. T.; Catalysts 2021, 11, 1490. [Crossref]
» Crossref - 26 AOCS Cd 3d-63: Acid Value of Fats and Oils, Champaign, IL, USA, 2009.
- 27 CODEX-STAN: Codex Standard for Named Vegetable Oils, Rome, Italy, 2024.
-
28 Mundo dos Óleos, Óleo de Baru. [Link] accessed in January 2026
» Link -
29 Rojas, V. M.; Marconi, L. F. C. B.; Guimarães-Inácio, A.; Leimann, F. V.; Tanamati, A.; Gozzo, A. M.; Fuchs, R. H. B.; Barreiro, M. F.; Barros, L.; Ferreira, I. C. F. R.; Tanamati, A. A. C.; Gonçalves, O. H.; Food Chem. 2019, 274, 220. [Crossref]
» Crossref -
30 Ferrari, R. A.; Azevedo Filho, J. A.; J. Agric. Sci. Technol. B 2012, 2, 1119. [Crossref]
» Crossref -
31 Coimbra, M. C.; Jorge, N.; J. Food Sci. 2011, 76, C1115. [Crossref]
» Crossref -
32 Salimon, J.; Mohd Noor, D. A.; Nazrizawati, A. T.; Mohd Firdaus, M. Y.; Naraishah, A.; Sains Malays. 2010, 39, 761. [Crossref]
» Crossref -
33 Cui, Y.; Ye, Q.; Peng, Y.; Hao, J.; Rao, H.; Zhao, X.; Zhao, D.; Food Bioprocess Technol. 2026, 19, 31. [Crossref]
» Crossref -
34 Budilarto, E. S.; Kamal-Eldin, A.; Eur. J. Lipid Sci. Technol. 2015, 117, 1095. [Crossref]
» Crossref -
35 Grebenteuch, S.; Kroh, L. W.; Drusch, S.; Rohn, S.; Foods 2021, 10, 2417. [Crossref]
» Crossref -
36 Alarcon, R. T.; Gaglieri, C.; Souza, O. A.; Rinaldo, D.; Bannach, G.; J. Polym. Environ. 2020, 28, 1265. [Crossref]
» Crossref -
37 Zhang, N.; Li, Y.; Wen, S.; Sun, Y.; Chen, J.; Gao, Y.; Sagymbek, A.; Yu, X.; Food Chem. 2021, 358, 129834. [Crossref]
» Crossref -
38 Méndez, A. I.; Falqué, E.; Food Control 2007, 18, 521. [Crossref]
» Crossref -
39 del Río, J. C.; Evaristo, A. B.; Marques, G.; Martín-Ramos, P.; Martín-Gil, J.; Gutiérrez, A.; Ind. Crops Prod. 2016, 84, 294. [Crossref]
» Crossref -
40 Coimbra, M. C.; Jorge, N.; J. Sci. Food Agric. 2012, 92, 679. [Crossref]
» Crossref -
41 Moura, A.; Gaglieri, C.; Turra Alarcon, R.; Osório Ferreira, P.; Geraldo Magdalena, A.; Bannach, G.; Braz. J. Therm. Anal. 2017, 6 [Crossref]
» Crossref -
42 Ferreira, C. D.; da Conceição, E. J. L.; Machado, B. A. S.; Hermes, V. S.; Rios, A. O.; Druzian, J. I.; Nunes, I. L.; Food Bioprocess Technol. 2016, 9, 124. [Crossref]
» Crossref -
43 Valerio, P. P.; Frias, J. M.; Cren, E. C.; J. Therm. Anal. Calorim. 2021, 143, 2983. [Crossref]
» Crossref -
44 Paluvai, N. R.; Mohanty, S.; Nayak, S. K.; Can. J. Chem. Eng. 2015, 93, 2107. [Crossref]
» Crossref -
45 Magri, R.; Gaglieri, C.; Alarcon, R. T.; Bannach, G.; J. Polym. Res. 2021, 28, 343. [Crossref]
» Crossref -
46 Yang, L.; Dai, H.; Yi, A.; Lin, B.; Li, G.; J. Therm. Anal. Calorim. 2008, 93, 875. [Crossref]
» Crossref
Edited by
-
Editor handled this article:
Hector Henrique F. Koolen (Associate)