 Simple and Low-Cost Method for Quantifying Total Phenolic Compounds in Extra Virgin Olive Oils Using Digital Images
Abstract
A simple, low-cost, and rapid analytical method for determination of the total phenolic content (TPC) in extra virgin olive oil samples (EVOOs) was developed, using digital images as an analytical tool. The method is based on an optimized Folin-Ciocalteu (F-C) colorimetric reaction, followed by digital image acquisition using a smartphone and processing with ImageJ® software to obtain red, green, and blue (RGB) values. The method was successfully validated, with recoveries between 73.11 and 112.65%, limits of detection (LOD) and quantification (LOQ) of 0.41 and 1.38 mg L-1, respectively. The TPC determined for eight EVOOs from different regions of the world were in the range of 186.38 to 378.87 mg gallic acid equivalent (GAE) kg-1, in accordance with some values reported in the literature. Statistical tests confirmed agreement between the results obtained using the digital image method and a reference method employing UV-Vis spectroscopy. The method complies with the principles of green chemistry, with reductions of cost, solvent use, and analysis time.
Keywords:
digital images; total phenolic compounds; EVOOs; smartphones
Introduction
Olive oil is extracted from the fruit of the olive tree (Olea europaea L.), mainly employing mechanical processes that involve pressing the olives.1 Production occurs in many countries, especially those surrounding the Mediterranean,2 as well as at a smaller scale elsewhere, in countries including Brazil.3 Olive oil is widely used in nutritional diets, due to its health benefits and sensory attributes.4 According to European Union regulations,5 olive oils are classified in three categories, based on their quality, as extra virgin olive oil (EVOO), virgin olive oil (VOO), and common olive oil (OO), with maximum acidity contents of ≤ 0.8, ≤ 2.0, and > 2.0% per 100 g of oil, respectively.
EVOO is renowned for its health benefits, particularly in the prevention or reduction of inflammatory processes associated with conditions such as cardiovascular-cerebral diseases and cancer.6 The benefits are mainly due to the presence of high levels of fatty acids (comprising 98-99% of the total weight of EVOO), especially oleic acid.7 There is also evidence that the phenolic fraction (1-2% of the total weight) contains bioactive compounds (50-1000 mg kg-1) that may prevent oxidative damage and provide benefits concerning plasma lipid levels in humans.8
To determine the total phenolic content (TPC) present in EVOOs, the Folin-Ciocalteu (F-C) method is widely used.9 The procedure is performed with a colorimetric reagent formed by phosphotungstic acid (H3PW12O40) and phosphomolybdic acid (H3PMo12O40), where the phenolate ion is oxidized, while the phosphotungstic-phosphomolybdic complex is reduced to form tungsten oxide (W8O23) and molybdenum oxide (Mo8O23) (Figure S1, Supplementary Information (SI) section). In addition, partially reduced forms of phosphotungstic acid and phosphomolybdic acid are formed, resulting in the production of byproducts such as phosphate derivatives (PO43-) or other phosphorus-containing compounds.10 The reaction produces a blue color, enabling quantification of TPC by UV-Vis spectrophotometry at a wavelength of 760 nm.9,11 In addition to the reference method, other techniques that have been employed for the same purpose include analysis by high-performance liquid chromatography with diode array detection (HPLC DAD),12 liquid chromatography coupled to mass spectrometry (HPLC-MS),6 and the use of solid phase extraction (SPE) for sample preparation.13 These methods aim to individually quantify phenols to obtain the TPC.6,13,14 However, all of them involve specific handling procedures, significant consumption of reagents and waste generation, and lengthy analysis times.15
In contrast, the use of the smartphone as an analytical tool to perform qualitative and quantitative analyses by the capture of digital images has emerged as an attractive option, due to the cost reduction achieved by replacing expensive instruments with portable devices, while at the same time making analyses faster and more accessible.16-18 Furthermore, the portability of the smartphone enables analysis, processing of results, and sharing of data to be performed in situ.19-21 Recent studies have used digital images as a tool for the determination of TPC in olive oil,22 beer,23 fruits,18,24 and vegetables.17
Analysis using a smartphone requires software to perform the acquisition and processing of digital images. An example is ImageJ® software, developed by Wayne Rasband at the National Institutes of Health (NIH).25,26 This software allows the capture of images and their subsequent processing using red, green, and blue (RGB) channels for decomposition of a selected area of the image.27 The values of the channels are directly correlated with the color intensity of the solution and can then be related to the concentration of the analyte.17 To ensure the reproducibility of acquired images, they must be obtained in an environment isolated from external interference and with consistent environmental conditions. An example of this is using an insulated box with an illumination system, as mentioned in the literature.20,28,29
The aim of the present study was to develop a simple, fast, and low-cost method for the quantification of TPC in EVOO samples, using an optimized colorimetric reaction with the Folin-Ciocalteu reagent and acquisition of digital images with a smartphone. Three analytical protocols were employed, as follows: (i) the reference method employing the F-C reaction followed by UV-Vis analysis;9 (ii) an adapted reference method with optimization of the F-C colorimetric reaction followed by UV-Vis analysis; and (iii) a digital image method using the optimized colorimetric reaction followed by the acquisition of digital images with a smartphone. Finally, the characteristics of the methods, considering their compliance with the principles of green chemistry, were evaluated using the Green Analytical Procedure Index (GAPI).30
Experimental
Materials and reagents
The F-C reagent was purchased from Sigma-Aldrich (Steinheim, Germany). Sodium carbonate was purchased from Neon (São Paulo, Brazil). The solvents used were HPLC-grade methanol and hexane, purchased from Sigma-Aldrich (Darmstadt, Germany). A gallic acid standard was purchased from Sigma-Aldrich (Steinheim, Germany). All the solutions were prepared with ultrapure water (resistivity >18.0 MΩ cm).
Analytical curve
A stock solution of gallic acid was prepared at 500 mg L-1 in a methanol-water mixture (80:20, v/v), with subsequent dilutions to obtain seven solutions for construction of the analytical curve, at concentrations of 0.77, 1.92, 3.84, 5.76, 7.69, 11.00, and 15.38 mg L-1. Chromogenic solutions were prepared using the F-C reagent, following the procedures described in “Reference method” and “Adapted reference method (optimization of the colorimetric reaction)” sub sections, for subsequent analysis by the UV-Vis and digital image methods.
Samples
Eight different samples of EVOOs were purchased locally in the city of Recife (Pernambuco state, Brazil). The samples, labeled A1 to A8, were kept in amber bottles under refrigeration, until extraction and analysis. Table S1 (SI section) provides information about the oils, including code, bottling and expiry dates, and country of origin.
Sample extraction
The extraction of TPC was performed as described previously by Ricciutelli et al.13 For this, 2.5 g of the sample were diluted in 2.5 mL of hexane, followed by addition of 2.5 mL of methanol:water (80:20, v/v). The mixture was then agitated using a vortex mixer (KASVI, Brazil) for 5 min and separated in a centrifuge (Quimis, São Paulo, Brazil) at 5000 rpm for 5 min. This procedure separated the methanolic phase (containing the phenolic components) from the supernatant. The same procedure was repeated twice, obtaining a final 7.5 mL volume of methanolic extract, which was washed using 2.5 mL of hexane. The resulting extract rich in phenols was then analyzed immediately.
Quantification of total phenolic content (TPC)
Reference method
The TPCs of the EVOOs were quantified using a previously validated UV-Vis reference method employing the Folin-Ciocalteu (F-C) reagent.9 A 0.5 mL volume of the methanolic extract obtained by the above procedure (“Sample extraction” sub-section) was transferred to a 50 mL volumetric flask and diluted by addition of 2.5 mL of F-C reagent and then 7.5 mL of 20% (m/v) Na2CO3 solution. The final volume was adjusted with deionized water and the reaction was performed for 120 min (in the dark). Analysis was then performed using a UV-Vis spectrophotometer (model UV-1280, Shimadzu, Japan) set at 760 nm. The TPC values were expressed as mg gallic acid equivalent (GAE) kg-1 oil.
Adapted reference method (optimization of the colorimetric reaction)
The reference method described in “Reference method” sub-section was adapted to make it more accessible and faster, since its original implementation required substantial quantities of reagents and a long analysis time. For this purpose, the colorimetric method was optimized using a 24 full factorial design (Table S2, SI section) with five central points (21 runs), aiming to find the best condition, considering the following parameters: F-C reagent volume (A), Na2CO3 solution volume (B), Na2CO3 concentration (C), and reaction time (D). The experiments were performed using a random sample of EVOO, applying the same extraction procedure described in “Sample extraction” sub-section. The analytical response was the absorbance value for TPC, which was measured using the UV-Vis spectrophotometer, as described in “Reference method” sub section. The 24 full factorial design was implemented using Design Expert v. 7.0 software31 adopting a 95% confidence level. The best conditions were then defined as follows: 0.25 mL of F-C reagent, 2 mL of 10% (m/v) Na2CO3 solution, and reaction time of 30 min. Evaluation was also made of the stability of the colorimetric reaction during 120 min, employing a 9 mg L-1 gallic acid solution and analysis at 10-min intervals using the UV-Vis spectrophotometer.
Proposed method using digital images
To perform the acquisition of digital images, a homemade box was constructed that had inlets for a smartphone camera and a sample cuvette. An internal light emitting diode (LED) lighting system was installed that allowed adjustment of the light intensity.29 The digital image acquisition parameters were established after carrying out univariate tests to evaluate the effects of LED intensity (off, minimum, and maximum), distance between the sample and the camera (10, 13, and 16 cm), and RGB channel selection. The response used was based on the highest coefficient of determination (R2) from analysis of the analytical curves (in duplicate) for the solutions described in “Analytical curve” sub-section. The best condition was as follows: minimum distance of 10 cm between the sample and the smartphone camera, LED light source at maximum intensity, and use of the green channel, resulting in R2 ≥ 0.99, as shown in Table S3 (SI section, see runs 3 and 4). This digital image capture condition was then used to obtain the analytical curves and quantify TPC in the samples.
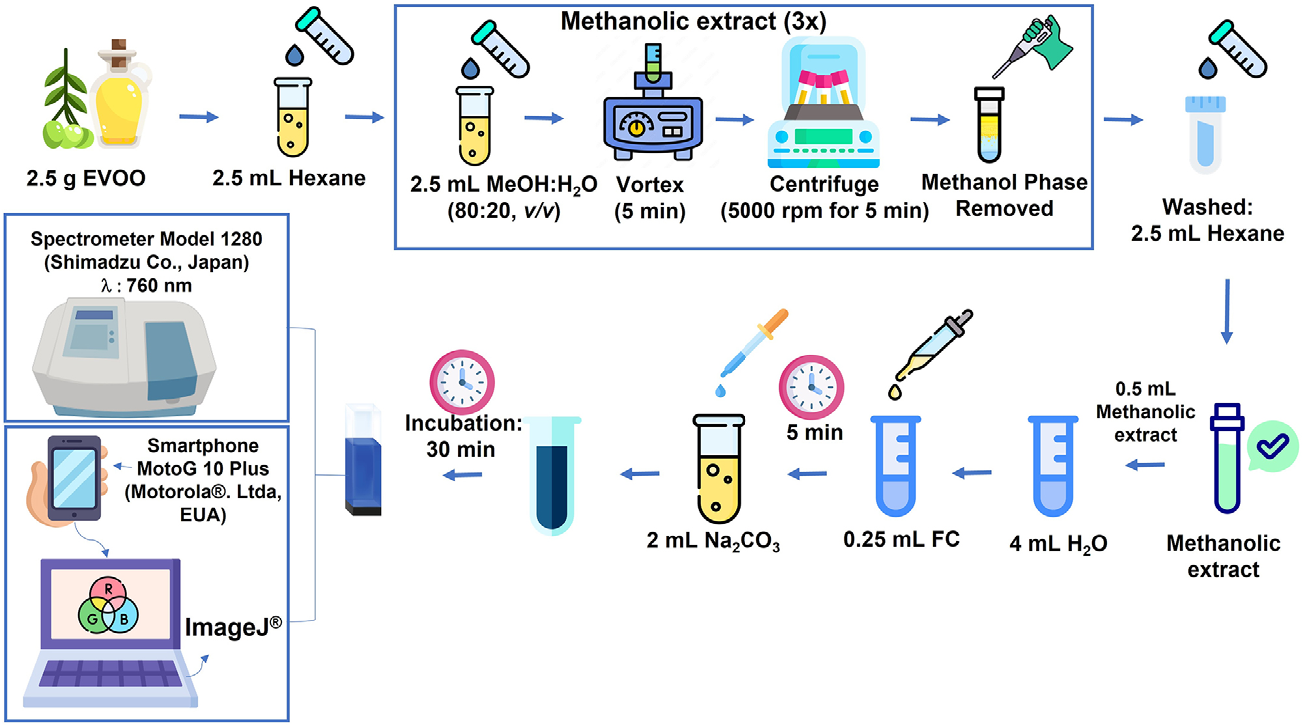
All samples were prepared according to the extraction procedure described in “Sample extraction” sub-section, followed by the optimized colorimetric reaction for the samples and standard solutions, as presented in “Adapted reference method (optimization of the colorimetric reaction)” sub-section. The digital images were captured and saved in JPG format, according to the primary color pattern formed by the red (R), green (G), and blue (B) histograms. The region of interest (ROI) of the digital images was selected and processed using the ImageJ® software.22,25,26 The digital image of the blank (composed of the F-C reagent mixed with Na2CO3 and ultrapure H2O) was used as the background. The default value adopted for the area of the region of interest was 32 × 32 pixels. The analytical signal was obtained using the equation S (signal) = -log(l/l0), based on the Lambert-Beer law, where l is the R, G, or B value of the sample or standard solution, and l0 is the value measured for the blank. A diagram of the methodologies described in “Adapted reference method (optimization of the colorimetric reaction)” and “Proposed method using digital images” sub-sections is provided in Figure 1.
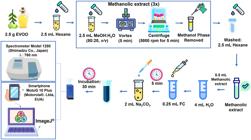
Diagram of the methodologies for preparation and analysis of the EVOO samples using the adapted reference method (“Adapted reference method (optimization of the colorimetric reaction)” sub-section) and the proposed digital image method (“Proposed method using digital images” sub-section).
Method validation
The validation parameters were determined as stipulated by the National Institute of Metrology, Quality, and Technology (INMETRO)32 and National Health Surveillance Agency (Anvisa).33 The parameters evaluated were precision, recovery, and limits of detection (LOD) and quantification (LOQ), as described below.
Precision
Precision was determined using the coefficient of variation (CV), calculated as CV (%) = (SD/x) × 100, where x is the sample group mean and SD is the standard deviation. A value ≤ 5.3% was considered acceptable.
Recovery
Recovery (R, in percentage) was determined by analysis in triplicate of three different samples fortified with gallic acid standard at three concentration levels (2, 8, and 14 mg L-1). The values were calculated using the equation R (%) = (C1 - C2/C3) × 100, where, C1 is the concentration measured in the fortified sample, C2 is the concentration for the unfortified sample, and C3 is the added concentration.
Limits of detection (LOD) and quantification (LOQ)
LOD and LOQ were determined using the formulas 3 × σ/m and 10 × σ/m, respectively, where σ is the standard deviation from ten measurements of the analytical blank, and m is the slope of the analytical curve.
Statistical analysis
Statistical analysis of the precision and accuracy of the methods was performed using the F-test to evaluate similarity of the variances. Additionally, the significance of differences was determined using the paired t-test with a 95% confidence level. The analyses were performed using the R (v. 2022.12.0) environmental software package.34
Results and Discussion
Optimization of the colorimetric reaction using F-C reagent
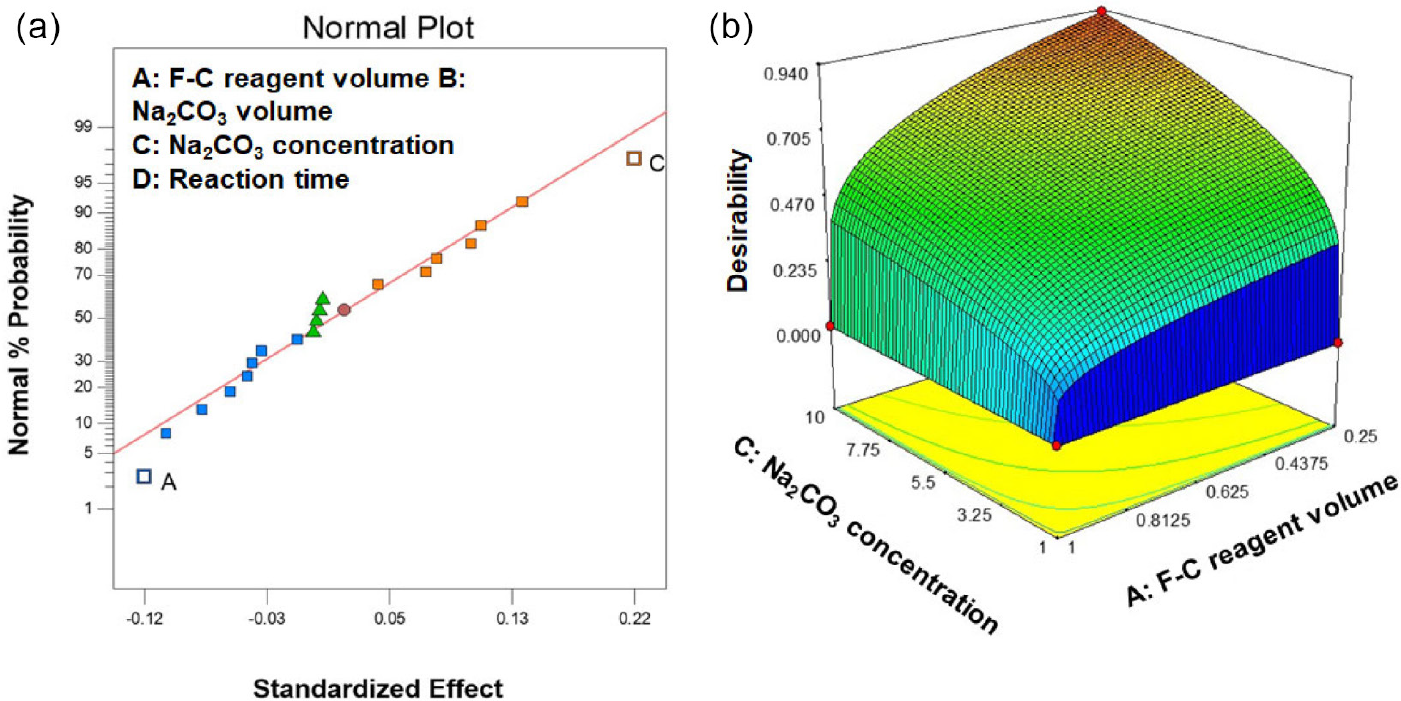
The results obtained by the 24 full factorial design were analyzed using a normal plot graph (Figure 2a). The primary effects were negative for F-C reagent volume (parameter A) and positive for Na2CO3 concentration (parameter C). The effects associated with Na2CO3 volume (parameter B), reaction time (parameter D), and interactions among the parameters were not significant. Hence, the best condition was using F-C reagent volume at 0.25 mL, Na2CO3 volume at 2 mL, Na2CO3 concentration at 10% (m/v), and reaction time at 30 min, resulting in numerical optimization at the 93% desirability level, as shown in the response surface graph of Figure 2b.
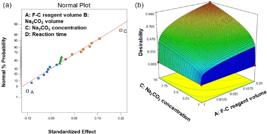
Normal plot (a) and response surface graph (b) referring to 24 full factorial design for optimization of colorimetric reaction.
In addition, a univariate evaluation was performed of the stability of the complex over time, in the interval from 10 to 120 min, comparing the optimized method and the reference method. Figure S2 (SI section) shows the stability graph, indicating that stability was reached in 30 min, in a shorter time and with higher absorbance, when compared with the reference method, which was described using a reaction time of 120 min.9 Therefore, the optimized colorimetric reaction provided significant decreases of reagents consumption, reaction time, and waste generation, relative to the reference method.
Analytical curves
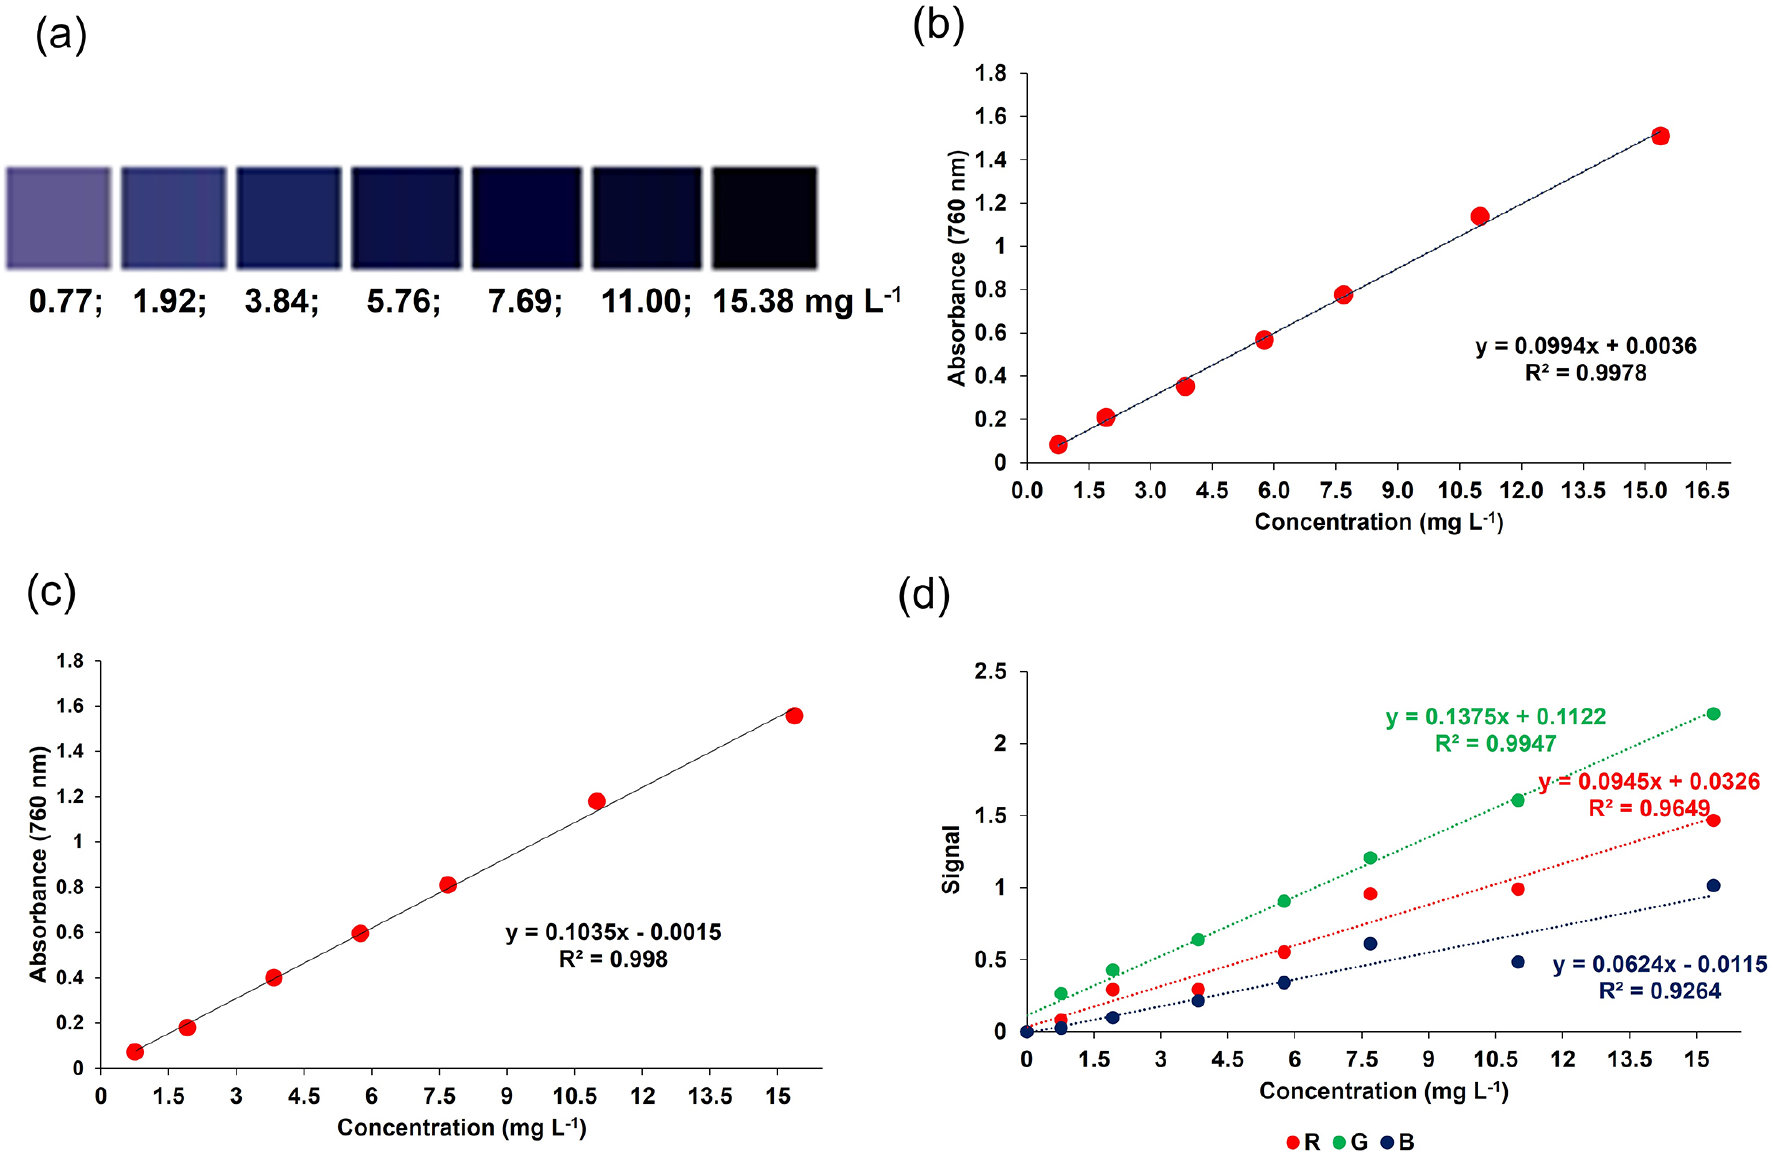
For all three methods, linear correlation was observed between the analytical signal and the concentration of gallic acid (mg L-1) (Figure 3a), with R2 ≥ 0.99 for the reference method (Figure 3b), adapted reference method (Figure 3c), and proposed digital image method (Figure 3d), in accordance with validation guidelines.32,33 For the digital imaging method, the green channel (G) (Figure 3d) was selected for the quantification of TPC in the EVOO samples. It presented greater analytical sensitivity (angular coefficient = 0.1375), and exhibited the highest coefficient of determination (R2 = 0.9947), which indicates superior analytical performance.
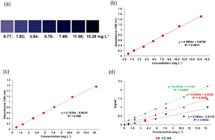
Color scale according to concentration (a), and analytical curves for the reference method (b), the adapted reference method (b), and the digital image method for the three channels (R, G, and B) (d).
Methods validation
Table 1 shows the results of the recovery tests using three random EVOO samples and three quality control (QC) levels. The recoveries obtained were within the range from 70 to 120%, which are the limits of the validation guideline.32,33,35
Recovery values for low (2 mg L-1), medium (8 mg L-1), and high (14 mg L-1) quality control (QC) levels, for the adapted reference and digital image methods
The LOD and LOQ values for the adapted reference method were 0.36 and 1.21 mg L-1, respectively, with CV of 0.42%. For the proposed digital image method, the LOD and LOQ values were 0.41 and 1.38 mg L-1, respectively. The simplicity and sensitivity of our method are notable when compared to other studies in the literature. However, Calabria et al.,22 who also utilized digital images, reported LOD of 30 mg L-1, which is approximately 70 times higher than our value. Hence, the values for the two methods were very similar, with low coefficient of variation (CV), within the maximum limit stipulated in the validation guideline.32,33 These values were lower than the LOD and LOQ of 0.946 and 2 mg L-1, respectively, found by Dini et al.4 using the F-C reaction and UV-Vis analysis.
Sample analyses
The methods were applied for quantification of TPC in the EVOO samples (Table 2). The values, relative errors (%), and statistical parameters are summarized in Table S4 (SI section). The values for the reference method were from 186.38 to 378.87 mg GAE kg-1, while those for the adapted reference method were from 170.85 to 403.94 mg GAE kg-1. Low relative errors were obtained for comparison of the two methods, ranging from -1.40 to 9.72%. In addition, for all the samples, application of the two-sided paired t-test (95% confidence level, p > 0.05) revealed no statistically significant differences between the methods. Application of the F-test resulted in values lower than the critical F-value (19.00), indicating that the methods were statistically the same. Therefore, the adapted reference method was confirmed to be effective in quantifying TPC in the EVOOs, with performance equivalent to that of the reference method.
TPC values for analysis of the eight extra virgin olive oil samples (EVOOs) using the reference, adapted reference and digital image methods
The TPC values (Table 2), relative errors (%), and statistical parameters for analysis of the EVOOs by the reference and digital image methods are summarized in Table S5 (SI section). For the digital image method, the TPCs ranged from 185.86 to 379.59 mg GAE kg-1. In comparison with the reference method, the relative errors ranged from 0.28 to 11.75%, highlighting the similarity between them. For all the samples, application of the two-sided paired t-test (95% confidence level, p < 0.05) revealed no statistically significant differences between the methods, with the calculated t-values being lower than the critical t-value (4.30). In addition, the calculated F-test values were lower than Fcritical (19.00). Therefore, the analytical results and the statistical tests confirmed the similarity of the digital image method to the reference method for determination of TPC in the EVOO samples.
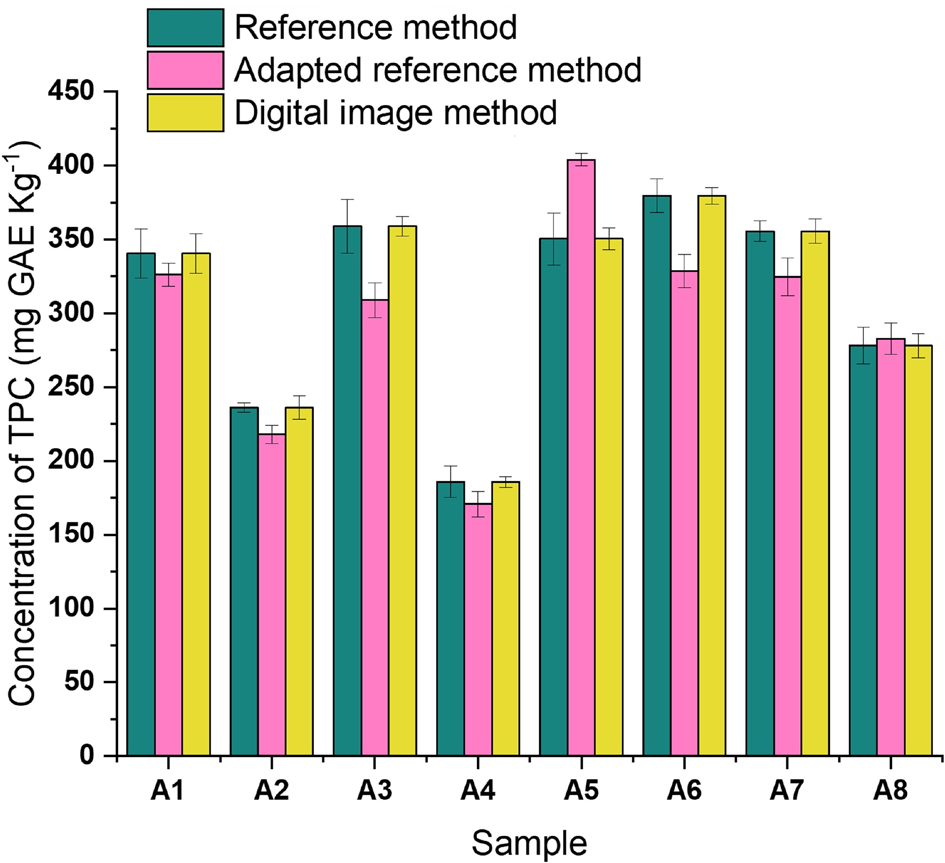
Figure 4 provides a summary of the TPC concentrations for all the samples, obtained using the three methods. In all cases, the mean TPC values and the error bars for the three methods were similar, indicating that satisfactory results were obtained after optimization of the colorimetric reaction, as well as by using digital images to determine TPC.
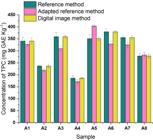
TPC values and standard deviations for analysis of the eight EVOOs using the reference, adapted reference, and digital image methods.
The TPC values obtained by the three methods (Figure 4) were for EVOOs produced in Spain (n = 2), Portugal (n = 5), and Uruguay (n = 1), and were within the concentration range found in other studies, where the TPC values ranged from 52.2 to 594.2 mg GAE kg-1.36-38 It should be noted that factors such as region, variety, growing conditions, ripeness, harvest time, and processing can affect the TPC in EVOO.22
Assessment of green metrics for the analytical methods
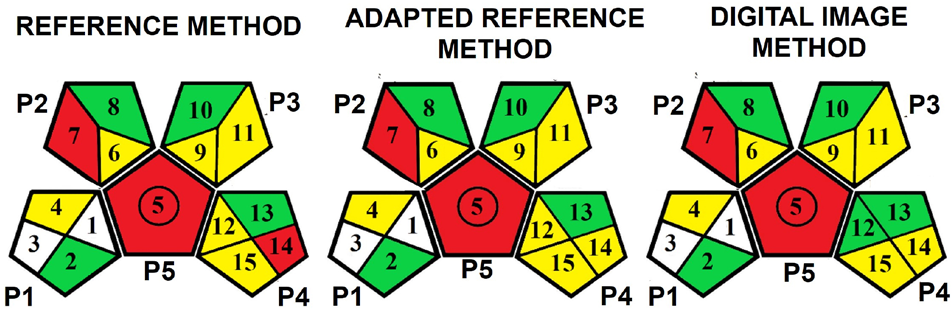
Evaluation of the compliance of the methods with the principles of green chemistry was performed using the Green Analytical Procedure Index (GAPI),29 which includes 15 criteria, as summarized in Table S6 (SI section). The results for these criteria, divided into five categories (P1 P5), are shown in Figure 5 for the three methods, where the green color indicates stronger alignment with the principles of green chemistry, yellow is intermediate, red signifies lower proximity to a green method, and white indicates that no sample collection or transport step was performed.
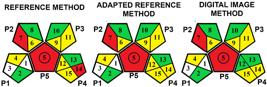
GAPI evaluation of the reference, adapted reference, and digital image methods. Pictogram categories: (P1) sample collection, preservation, transport, and storage; (P2) sample preparation; (P3) reagents and solvents; (P4) instrumentation; (P5) quantification.
For all three methods, P1 shows a green color for criterion 2, as it does not require specific sample preservation, and a yellow color for criterion 4 due to storage under normal conditions. However, criteria 1 and 3 are colored white and do not require sample collection or transport.
For P2, criterion 6 is yellow, criterion 7 is red due to using non-green solvents, and criterion 8 is green because no additional treatments are required for any of the methods. In P3, criterion 9 is yellow for all methods because a sample volume of 10-100 mL is required. Criterion 10 is green for all methods, as long as safety measures are rigorously implemented. For criterion 11, the proposed methods are yellow as they pose a special safety hazard due to the solvents used. In P4, criterion 12 is yellow in the reference and optimized reference methods, but green in the digital image method due to lower energy consumption.
Criterion 13 is green for all methods due to hermetic sealing. In criterion 14, the proposed methods are marked in yellow, while the reference method is marked in red due to the higher number of residues. For criterion 15, both methods are indicated in yellow, as they require passivation to reduce the harmfulness of the waste.
In category P5, criterion 5 presented a red color for all the methods, due to the need for extraction. Finally, a central circle in the GAPI pictograms indicated that all the methods were quantitative. It is important to highlight that replacing expensive equipment by a smartphone, as an analytical tool, results in significant reductions of energy consumption, equipment costs, specialized labor, and maintenance. The GAPI analysis showed that the developed method provided enhancements in various aspects of green analytical chemistry. It is also important to note that the GAPI tool does not include criteria related to analysis time. Considering this aspect, it should be highlighted that the colorimetric reaction time in the developed method was significantly reduced from 120 to 30 min, in comparison to the reference method.
Conclusions
An adaptation of the reference method for the determination of TPC in EVOO samples was successfully performed to obtain the best conditions for the colorimetric reaction using F-C reagent, resulting in significant reductions of reagent volume, colorimetric reaction time, and waste generation. A digital image method was then developed and validated, which also proved to be suitable for the determination of TPC in EVOOs, achieving satisfactory linearity, precision, and recovery, as well as low limits of detection and quantification. The digital image method was applied to determine TPC in commercial EVOO samples, showing statistical similarity with the reference method, but with the advantages of being simpler, low-cost, easy to operate, portable, fast, and in better compliance with the requirements of green analytical chemistry. Therefore, the developed method stands out as a viable alternative technique for the determination of TPC in EVOOs, suitable for use in both routine procedures and in situ analysis.
Supplementary Information
Additional information, conditions for optimizing the analytical method and green analytical procedure index (GAPI) are available free of charge at http://jbcs.sbq.org.br as PDF file.
Acknowledgments
The authors would like to thank the Fundação de Amparo a Ciência e Tecnologia do Estado de Pernambuco (FACEPE, Brazil) and the Coordenação de Aperfeiçoamento de Pessoal de Nível Superior (CAPES, Brazil).
References
-
1 Al Hashemi, M. Y.; Al Maktoumi, H.; Akhtar, Md. J.; Khan, S. A.; Pharmacol. Res. Nat. Prod. 2024, 2, 100012. [Crossref]
» Crossref -
2 Liu, W.; Liu, C.; Yu, J.; Zhang, Y.; Li, J.; Chen, Y.; Zheng, L.; Food Chem. 2018, 251, 86. [Crossref]
» Crossref -
3 Borges, T. H.; Pereira, J. A.; Cabrera-Vique, C.; Lara, L.; Oliveira, A. F.; Seiquer, I.; Food Chem. 2017, 215, 454. [Crossref]
» Crossref -
4 Dini, I.; Seccia, S.; Senatore, A.; Coppola, D.; Morelli, E.; Food Anal. Methods 2020, 13, 457. [Crossref]
» Crossref -
5 Official Journal of the European Union; Document 32022R210: Commission Delegated Regulation (EU) 2022/2104 of 29 July 2022 supplementing Regulation (EU) No. 1308/2013 of the European Parliament and of the Council as Regards Marketing Standards for Olive Oil, and Repealing Commission Regulation (EEC) No. 2568/91 and Commission Implementing Regulation (EU) No. 29/2012, https://eur-lex.europa.eu/legal-content/EN/TXT/?uri=CELEX%3A32022R2104, accessed in November 2024.
» https://eur-lex.europa.eu/legal-content/EN/TXT/?uri=CELEX%3A32022R2104 -
6 De Bruno, A.; Romeo, R.; Piscopo, A.; Poiana, M.; J. Sci. Food Agric. 2021, 101, 1119. [Crossref]
» Crossref -
7 Romani, A.; Ieri, F.; Urciuoli, S.; Noce, A.; Marrone, G.; Nediani, C.; Bernini, R.; Nutrients 2019, 11, 1776. [Crossref]
» Crossref -
8 Boronat, A.; Serreli, G.; Rodríguez-Morató, J.; Deiana, M.; de la Torre, R.; Antioxidants 2023, 12, 1472. [Crossref]
» Crossref -
9 Singleton, V. L.; Orthofer, R.; Lamuela-Raventós, R. M.; Methods Enzymol. 1999, 299, 152. [Crossref]
» Crossref -
10 Britannica; Isopoly, Heteropoly, Anions, https://www.britannica.com/science/coordination-compound/Isopoly-and-heteropoly-anions, accessed in November 2024.
» https://www.britannica.com/science/coordination-compound/Isopoly-and-heteropoly-anions -
11 Pérez, M.; Dominguez-López, I.; Lamuela-Raventós, R. M.; J. Agric. Food Chem. 2023, 71, 17543. [Crossref]
» Crossref -
12 Klikarová, J.; Rotondo, A.; Cacciola, F.; Česlová, L.; Dugo, P.; Mondello, L.; Rigano, F.; Food Anal. Methods 2019, 12, 1759. [Crossref]
» Crossref -
13 Ricciutelli, M.; Marconi, S.; Boarelli, M. C.; Caprioli, G.; Sagratini, G.; Ballini, R.; Fiorini, D.; J. Chromatogr. A 2017, 1481, 53. [Crossref]
» Crossref -
14 De La Torre-Carbot, K.; Jauregui, O.; Gimeno, E.; Castellote, A. I.; Lamuela-Raventós, R. M.; López-Sabater, M. C.; J. Agric. Food Chem. 2005, 53, 4331. [Crossref]
» Crossref -
15 Schlesner, S. K.; Voss, M.; Helfer, G. A.; Costa, A. B.; Cichoski, A. J.; Wagner, R.; Barin, J. S.; Green Anal. Chem. 2022, 1, 100003. [Crossref]
» Crossref -
16 Herrero-Latorre, C.; Barciela-García, J.; García-Martín, S.; Peña-Crecente, R. M.; Food Chem.: X 2019, 3, 100046. [Crossref]
» Crossref -
17 Bazani, E. J. O.; Barreto, M. S.; Demuner, A. J.; Dos Santos, M. H.; Cerceau, C. I.; Blank, D. E.; Firmino, M. J. M.; Souza, G. S. F.; Franco, M. O. K.; Suarez, W. T.; Stringheta, P. C.; Food Anal. Methods 2021, 14, 631. [Crossref]
» Crossref -
18 Martins, L. C.; Silva, A. F. S.; de Moraes, L. M. B.; Gonçalves, I. C.; de Godoy, B. B. R.; Rocha, F. R. P.; Proceedings 2020, 70, 20. [Crossref]
» Crossref -
19 Fan, Y.; Li, J.; Guo, Y.; Xie, L.; Zhang, G.; Measurement 2021, 171, 108829. [Crossref]
» Crossref -
20 Soares, S.; Fernandes, G. M.; Rocha, F. R. P.; TrAC, Trends Anal. Chem. 2023, 168, 117284. [Crossref]
» Crossref -
21 Fernandes, G. M.; Silva, W. R.; Barreto, D. N.; Lamarca, R. S.; Gomes, P. C. F. L.; Petruci, J. F. S.; Batista, A. D.; Anal. Chim. Acta 2020, 1135, 187. [Crossref]
» Crossref -
22 Calabria, D.; Mirasoli, M.; Guardigli, M.; Simoni, P.; Zangheri, M.; Severi, P.; Caliceti, C.; Roda, A.; Sens. Actuators, B 2020, 305, 127522. [Crossref]
» Crossref -
23 Ledesma, C. M.; Krepsky, L. M.; Borges, E. M.; J. Chem. Educ. 2019, 96, 2315. [Crossref]
» Crossref -
24 Costa, R. C.; Leite, J. C.; Brandão, G. C.; Ferreira, S. L. C.; dos Santos, W. N. L.; Food Anal. Methods 2023, 16, 1261. [Crossref]
» Crossref -
25 Schneider, C. A.; Rasband, W. S.; Eliceiri, K. W.; Nat. Methods 2012, 9, 671. [Crossref]
» Crossref - 26 Rasband, W.; ImageJ, 2.0.0-rc-3; National Institutes of Health, USA, 2014.
-
27 Azeem, S. M. A.; Madbouly, M. D.; El-Shahat, M. F.; J. Food Compos. Anal. 2019, 81, 28. [Crossref]
» Crossref -
28 Minh-Huy, D.; Anh-Dao, L. T.; Thanh-Nho, N.; Nhon-Duc, L.; Cong-Hau, N.; Food Chem. 2023, 401, 134147. [Crossref]
» Crossref -
29 de Souza Gomes, B. R.; Coutinho, M. E. B.; Santos, J. M.; Food Anal. Methods 2024, 17, 1161. [Crossref]
» Crossref -
30 Płotka-Wasylka, J.; Wojnowski, W.; Green Chem. 2021, 23, 8657. [Crossref]
» Crossref - 31 Design Expert, v. 7.0; Stat-Ease, Inc., Minneapolis, MN, USA, 2005.
-
32 Instituto Nacional de Metrologia, Qualidade e Tecnologia (INMETRO); DOQ-CGCRE-008: No. 09, Orientação sobre Validação de Métodos Analíticos, 2020. [Link] accessed in November 2024.
» Link -
33 Agência Nacional de Vigilância Sanitária (Anvisa); Resolução da Diretoria Colegiada (RDC) No. 166, de 24 de Julho de 2017, Dispõe sobre a Validação de Métodos Analíticos e Dá Outras Providências; Diário Oficial da União (DOU): Brasília, No. 141, de 25 de julho de 2017. [Link] accessed in November 2024
» Link -
34 RStudio Team; R, version 2023.06.1; Rstudio, Boston, USA, 2023. [Link] accessed in November 2024
» Link -
35 Ribani, M.; Bottoli, C. B. G.; Collins, C. H.; Fontes Jardim, I. C. S.; Costa Melo, L. F.; Quim. Nova 2004, 27, 771. [Crossref]
» Crossref -
36 Caporaso, N.; Savarese, M.; Paduano, A.; Guidone, G.; de Marco, E.; Sacchi, R.; J. Food Compos. Anal. 2015, 40, 154. [Crossref]
» Crossref -
37 Gavahian, M.; Mousavi Khaneghah, A.; Lorenzo, J. M.; Munekata, P. E. S.; Garcia-Mantrana, I.; Collado, M. C.; Meléndez-Martínez, A. J.; Barba, F. J.; Trends Food Sci. Technol. 2019, 88, 220. [Crossref]
» Crossref -
38 Pedan, V.; Popp, M.; Rohn, S.; Nyfeler, M.; Bongartz, A.; Molecules 2019, 24, 2041. [Crossref]
» Crossref
Edited by
-
Editor handled this article:
Ivo M. Raimundo Jr. (Associate)