 Influence of Different Cocoa Varieties on the Fatty Acid Composition, Thermal Properties, and Physicochemical Properties of Cocoa Butter
Abstract
The chocolate and cosmetics industries are interested in cocoa varieties that yield high levels of cocoa butter with low acidity, a high melting point, and thermal stability. This study aims to analyze how different cocoa varieties influence the fatty acid composition, thermal properties, and physicochemical characteristics of cocoa butter. Three cocoa varieties (BN34, CCN51, PS1319) that had already been fermented and dried were roasted, and peeled before undergoing mechanical pressure to extract cocoa butter. The fat content was then calculated. Analyses were conducted, including the almond cutting test, density measurements, fatty acid composition analysis, differential scanning calorimetry (DSC), thermogravimetric analysis (DTA/DTG), physicochemical property assessment, and mid-infrared spectroscopy (MIR) of the butter samples. The BN34 and CCN51 cocoa varieties have a higher fat content than PS1319, but PS1319 has a higher melting point and greater thermal stability, despite having a similar fatty acid composition. Physical-chemical analyses reveal significant differences in moisture and acidity, with BN34 showing the lowest values. Acidity and refractive indices met quality standards, and MIR spectra demonstrate similar profiles among varieties. Thus, PS1319 is better suited for the chocolate industry, while the BN34 and CCN51 varieties are more appropriate for applications that prioritize a high cocoa butter yield.
Keywords:
cocoa butter; melting point; thermal stability; BN34; CCN51; PS1319
Introduction
Cocoa butter is a natural fat extracted from cocoa beans, the seeds of the cacao tree (Theobroma cacao L.). It is highly regarded for its well-known sensory, nutritional, and functional properties. Cocoa butter contributes to skin health and is commonly used in cosmetic products.1,2 In the food industry, it is essential for creating the smooth texture, shine, and flavor of chocolate, making it a key ingredient in confectionery. This importance establishes cocoa butter as one of the most valuable components in the cocoa supply chain.1,3
It is primarily composed of triacylglycerols, which account for 97% of its composition. These triacylglycerols consist of three main types of fatty acids: oleic acid (C18:1), which is unsaturated and makes up approximately 34.8%; stearic acid (C18:0), which is saturated and comprises about 34.4%; and palmitic acid (C16:0), also saturated, at around 26%.4 The main triglycerides present are: POP (1,3-dipalmitoyl-2-oleoyl-glycerol), which represents about 21%; POS (1-palmitoyl-2-oleoyl-3-stearoyl-glycerol), accounting for 44%; and SOS (1,3-distearyl-2 oleoyl-glycerol), which makes up 28%.4,5
Cocoa butter contains small amounts of phospholipids and various sterol fractions, including free sterols, sterol esters, sterol glycosides, and acylated sterol glycosides.6 The composition of its fatty acids significantly influences its thermal properties. These fatty acids affect the crystallization and melting behavior of cocoa butter, which has a high melting point of approximately 35 °C and melts quickly at body temperature (ca. 37 °C).7,8 The melting point of a substance is influenced by its crystalline structure, specifically, the more stable the polymorphic form, the higher its melting point. Consequently, the tempering process is essential in achieving these characteristics, which are crucial for the chocolate industry, as they affect both the mouthfeel and stability of the product.7-9
The process of fat crystallization in cocoa butter is essential for determining the physical and sensory characteristics of chocolate. This phenomenon varies among triglycerides based on their molecular composition. When cocoa butter is melted and subsequently cooled, fully saturated triglycerides (SSS) crystallize first due to their completely saturated structure, which allows for a more rigid and organized molecular arrangement.4 Following this, the triglyceride combinations SOS (stearic-oleic-stearic), POS (palmitic-oleic-stearic), and POP (palmitic-oleic-palmitic) crystallize, playing a crucial role in chocolate texture and its resistance to surface fat development.4 Finally, SSO (stearic-stearic-oleic) triglycerides crystallize at lower temperatures and later in the process.4
In addition to its fatty acid composition, various physical and chemical properties are crucial for determining the quality of cocoa butter. According to the Codex Alimentarius10 and the European Parliament and Council Directive 2000/36/EC,11 which pertains to cocoa and chocolate products intended for human consumption, high-quality cocoa butter should have a free fatty acid content of less than 1.75% and an unsaponifiable matter content of less than 0.7%. The refractive index should range from 1.456 to 1.459, and the moisture content must not exceed 0.1% (International Office of Cocoa, Chocolate and Sugar Confectionery (IOCCC)).12,13
The quality of chocolate is greatly influenced by the type of cocoa used, which largely determines its aromatic profile.14 Cocoa butter has the ability to absorb the natural aromas of the cocoa seeds.14 Research has shown that different cocoa varieties can affect the fat content, fatty acids, and triglycerides found in cocoa butter.15,16
The three major categories of cocoa recognized worldwide are Forastero, Criollo, and Trinitario.4 To combat disease issues such as witches’ broom, caused by the fungus Moniliophthora perniciosa, hybrid varieties have been developed to improve cocoa cultivation.17 The Executive Committee of the Brazilian Cocoa Farming Plan (CEPLAC) recommends several of these hybrid varieties for commercial production, particularly CCN51 and PS1319, which are among the most productive options available.18
These cacao varieties are recognized for their high productivity and disease resistance. Although CCN51 is not classified as a fine-flavored cacao, it is widely cultivated due to its high yield.18,19 In contrast, PS1319 is favored by many farmers for its slightly acidic flavor with spicy notes.20,21 Another promising variety, BN34, studied by CEPLAC, is noted for its productivity and is distinguished by its aroma of dried fruits. According to Macêdo et al.18 and Fonseca Maciel et al.,17 these varietal differences significantly influence farmers’ choices regarding which varieties to cultivate and the types of chocolate production.
Despite recent advancements, our understanding of how different cocoa varieties influence the physical, chemical, and thermal properties of cocoa butter remains incomplete, particularly for the BN34, CCN51, and PS1319 varieties. Gaining insight into these relationships is crucial for optimizing product quality, meeting market demands, and enhancing the competitiveness of cocoa producers. This study aims to analyze how the cocoa varieties BN34, CCN51, and PS1319 affect the fatty acid composition, thermal properties, and physicochemical characteristics of cocoa butter.
Experimental
Materials and reagents
Analytical grade reagents and deionized water from the Milli-Q system (18.2 MΩ cm, Millipore, Bedford, MA, USA) were used to prepare all solutions and standards. Petroleum ether (boiling point 30-70 °C) was used to determine the fat content by the Soxhlet method. To determine the acidity index, ethyl ether and ethyl alcohol were used to prepare an ether-alcohol solution (2:1, v/v), together with 0.1 mol L-1 sodium hydroxide and 1% (m/v) phenolphthalein. To determine the saponification index, potassium hydroxide (KOH) was used to prepare alcoholic KOH, in addition to 0.5 mol L-1 hydrochloric acid (HCl).
Instrumentation
A hydraulic press (model X5S) at 135 °C and a centrifuge (model Universal 320 R) at 3305 g were used to extract the cocoa butter. The following equipment was used for physical-chemical analyses: Soxhlet extractor (model SL-201/6), drying oven, analytical balance (model M214Ai), desiccator, muffle furnace (model MA 385/3), Abbé digital refractometer (model Q767BD), thermostatic water bath (model TE-184), and digital bench density meter (model DMA 5000M). A gas chromatograph (model QP-2010) was used to determine the fatty acid profile. An infrared Fourier transform spectrometer (FTIR) (model Cary® 630 FTIR) was used for spectroscopic analysis of the samples. For thermal analysis, a DTA/DTG thermal analyzer (model STA PT-1000) and a differential scanning calorimeter (DSC) (model DSC250) were used.
Obtaining cocoa samples of the BN34, CCN51, and PS1319 varieties
Approximately 2 kg of fermented and dried cocoa beans from each variety were collected in the city of Uma, Bahia, Brazil. The beans were sourced from cultivars on the same property, located at the geographical coordinates 150°16’41.38”S; 39°11’31.00”W. All varieties were harvested multiple times at different timings (early and late harvest) to enhance variability. The acquisition took place during three distinct periods in 2024: March, June, and November. The samples were packaged in boxes and stored at room temperature. The study involved three cocoa varieties (BN34, CCN51, and PS1319) with three replicates per variety.
Cutting test
For each variety studied, a cutting test was conducted on 300 almonds according to International Organization for Standardization (ISO) 2451.22 The collected samples were gradually reduced into smaller portions, with a fraction eliminated at each stage until the desired amount was achieved. The cocoa beans were then cut lengthwise and categorized by color in a grading table that indicated the degree of fermentation. The classifications included: well-fermented (brown and internally compartmentalized), partly fermented (brown with purple areas), unfermented (purple), slaty (gray), and defective (moldy, germinated, or rotten). The percentage of beans in each category was recorded to evaluate the fermentation index of each cocoa variety. This test aimed to establish the baseline fermentation level of each sample, allowing for verification that the cocoa butters extracted from these samples originated from beans with a similar degree of fermentation.23
Obtaining cocoa butter
Cocoa bean processing began with roasting. 800 g of beans were placed in an oven (Perfecta Curitiba, Vipinho 0448, Brazil) at 110 °C for 50 min. After roasting, the beans were cooled to room temperature and then ground in a mill. The shells were separated using an acrylic seed cleaning blower (Chocmaster, model 1009, Brazil) to obtain the nibs. To extract cocoa butter, the nibs were pressed using a hydraulic press at 135 °C (Comopez brand, model X5S, Brazil). This process resulted in the separation of unclarified cocoa butter and defatted cocoa mass. The unclarified cocoa butter was then centrifuged (Hettich-Universal 320 R, Germany) of 3305 g and temperature of 37 °C for 15 min. This step removed fine particles from suspension, yielding clarified cocoa butter. After centrifugation, the clarified cocoa butter was weighed, and the fat content obtained from this press was calculated for each variety using the appropriate equation (equation 1). The samples were finally stored in a freezer at -18 °C for further analysis.
Analysis of the physical and chemical properties of cocoa butter samples
The moisture and ash content of the cocoa butter samples were determined using methods 920.151 and Ca 11-55, respectively.24,25 The acidity and saponification indices were measured according to the methodologies outlined in Cd 3d-63 and Cd 3c-91.25 The refractive index was assessed following method Cc 7-25 with a digital Abbé refractometer (model Q767BD, Quimis, Diadema, Brazil) connected to a thermostatic water bath (Tecnal, Te-184, Piracicaba, Brazil), which was set at a temperature of 60 °C, the recommended temperature for fats.25
Determination of fatty acids
The cocoa butter samples were initially transesterified using the method described by Bannon et al.26 Following transesterification, the samples were analyzed by gas chromatography on a Shimadzu QP-2010 gas chromatograph equipped with a flame ionization detector. The components were separated on a Supelco SP-2560 capillary column using helium as the carrier gas. Fatty acids were identified by comparing the retention times of the samples to those of the Supelco™ 37 Component FAME Mix standard. The areas of the chromatographic peaks were determined and quantified using LabSolutions GC Postrun software (Shimadzu, Kyoto, Japan).
Mid-infrared spectroscopy analysis (MIR)
Cocoa butter samples were analyzed using Fourier transform infrared spectroscopy (FTIR) with a Cary® 630 FTIR from Agilent Technologies Inc. (CA, USA), equipped with an attenuated total reflection (ATR) cell. The analysis covered a spectral range of 4000 to 60 cm-1, with a resolution of 4 cm-1 and 64 scans per sample, to identify and characterize the chemical bonds and molecular structures of the different samples. For each analysis, 0.1 g of cocoa butter, melted at 60 °C, was placed on the diamond crystal and analyzed in absorbance mode. The spectra were acquired using Agilent Microlab PC software. After collecting each spectrum, a background spectrum was recorded. The ambient temperature was maintained at 24 °C throughout the analysis.
Thermal analysis (TG) of cocoa butter
The DTA/DTG thermal analysis was performed using the STA PT-1000 Thermal Analyzer (Linseis, Germany), which was controlled by STA Measurement software. This setup was designed to measure the temperatures and energy flows, in the form of heat, associated with material transitions over time and temperature in a controlled atmosphere. For the analysis, approximately 20 mg of the sample were weighed and placed in uncovered alumina crucibles within an inert atmosphere. The TGA thermogram was generated over a temperature range of 25 to 700 °C at a heating rate of 10 °C min-1 under a nitrogen flow.
Melting and crystallization profile
The melting and crystallinity behavior of the cocoa butter samples was analyzed using differential scanning calorimetry (DSC) with a DSC250 instrument from TA Instruments, Brazil, according to the AOCS Cj 1-94 method with some modifications.27 Approximately 8 mg of each sample were placed in hermetically sealed aluminum trays, with an empty tray used as a reference. To ensure complete melting, the samples were maintained at 70 °C for 10 min. They were then cooled to -40 °C at 5 °C min-1 and held at that temperature for 10 min to examine their crystallization behavior. Afterward, the samples were reheated to 70 °C at the same rate of 5 °C per min to analyze their melting behavior. The thermograms obtained during these processes were evaluated using TRIOS v5.8.1.14 software (TA Instruments, New Castle, DE, USA, 2024).
Determination of density
The density of the cocoa butter samples was measured using a DMA 5000M Digital Bench Top Density Meter (Anton Paar, Graz, Austria). Approximately 2 mL of cocoa butter from each variety were injected into the density meter, which displayed the result in kg m-3 after a few minutes. Density measurements were taken at various temperatures (40, 45, 50, 55, and 60 °C) to assess how density varied with temperature. The thermal expansion coefficient was also calculated using the following thermodynamic expression (equation 2).
where β: volumetric thermal expansion coefficient, ρ: fluid density, T: temperature, P: pressure.
Statistical analysis
The studies utilized a completely randomized design, and the results were analyzed using analysis of variance (ANOVA) and a mean test (Tukey) to determine whether there were significant differences among the various butter samples from the cocoa varieties (CCN51, PS1319, and BN34), with three replicates, at a 5% probability level. To assess the effect of temperature on density, the results were analyzed using linear regression and a two-factor factorial experiment, with both variety and temperature as factors. Statistical analyses were conducted with SAS® OnDemand for Academics software (SAS Institute Inc., Cary, NC, USA, 2024).
Results and Discussion
Evaluation of the physical quality of cocoa beans
Fermentation indices and defects in the cocoa varieties BN34, CCN51, and PS1319 were evaluated using the cut test. The results showed no significant differences among the analyzed varieties (see Table 1). This indicates that the butter samples originate from cocoa beans have been fermented to a similar level.
Physical characteristics of fermented and dried beans from different varieties using the cutting test
The low percentage of partly fermented beans indicates that incomplete fermentation was minimal. This level of fermentation is a positive sign, as it helps reduce bitterness and astringency, ultimately enhancing the sensory quality of the product. All varieties were classified as Type I according to ISO 2451,22 which stipulates that the percentage of defective beans, such as moldy, slaty, insect-damaged, germinated, or flat beans, must be limited to 3%.
Determination of the fat content extracted by press from different cocoa varieties
The fat content obtained from the different cocoa varieties is shown in Table 2.
Cocoa butter content extracted from cocoa varieties BN34, CCN51, and PS1319 using hydraulic pressure and the Soxhlet method
A significant difference was observed in the fat content extracted from cocoa nibs using a press. The PS1319 variety had the lowest fat yield. In contrast, the BN34 and CCN51 varieties showed no significant difference in fat content, making them more favorable for sectors seeking higher yields of cocoa butter, the most valuable ingredient in the cocoa supply chain.3 The fat content values found for all cocoa varieties (BN34, CCN51, and PS1319) align with existing literature, which estimates that cocoa contains between 36.8 and 57% fat.28
Determination of the physical and chemical properties of cocoa butter
The results of the physical-chemical analysis of cocoa butter samples from the BN34, CCN51, and PS1319 varieties are presented in Table 3. An analysis of variance was conducted at the 5% significance level for the parameters: moisture, ash content, refractive index, saponification index, and acidity index.
Mean values and standard deviations of physical-chemical parameters for cocoa butters extracted from different varieties (BN34, CCN51, PS1319)
The results reveal significant differences in moisture and acidity indices among the varieties, with BN34 exhibiting lower values (0.150%; 0.489%) compared to CCN51 (0.337%; 1.00%) and PS1319 (0.349%; 1.131%).
The moisture content measured for the various cocoa butter varieties exceeds the maximum limit of 0.1% established by the International Office of Cocoa, Chocolate and Sugar Confectionery (IOCCC) standard.13 In contrast, the acidity levels for all varieties are below the maximum limit of 1.75% set by Directive 2000/36/EC of the European Parliament and the Council of 23 June 2000, which relates to cocoa and chocolate products intended for human consumption, as well as by Codex Alimentarius.10,11
The results indicate that the cocoa butter samples are of good quality. Higher acidity values could compromise crystallization and tempering, and potentially alter the flavor of the product. The differences observed in these parameters may be attributed to the variety of cocoa beans.14 The BN34 variety, in particular, shows a lower moisture content and a lower acidity index, suggesting better preservation and stability. High moisture levels can promote the growth of microorganisms and degrade the product. A lower acidity index indicates a lower level of free acids, which positively affects the flavor and shelf life of cocoa butter.14
This behavior may be associated with the specific variety in question, which likely has lower enzymatic activity. According to Association of Chocolate, Biscuits and Confectionery Industries of Europe/European Cocoa Association/Federation of Cocoa Commerce (CAOBISCO/ECA/FCC),14 the content of free fatty acids (FFA) is largely dependent on enzymatic activity. FFAs are primarily released from the triglycerides that constitute cocoa butter through the action of lipase-type enzymes. Increased enzymatic activity, such as significant lipolysis, leads to a higher concentration of free fatty acids.14,29
No significant differences (p > 0.05) were observed in ash content, saponification index, and refractive index among the three varieties studied. These varieties exhibited very low ash values, which is expected for cocoa butter. This product is primarily composed of triglycerides, making up about 97% of its content, and also contains phospholipids along with various sterol fractions, including free sterols, sterol esters, sterol glycosides, and acylated sterol glycosides.5,6
The saponification index, which indicates the average length of fatty acid chains, shows no significant differences among the samples. This uniformity suggests that the different varieties have similar fatty acid chain lengths.30 The values obtained range from 192.54 to 194.52 mg KOH g-1, which aligns with the findings of Jahurul et al.31 for cocoa butters from various countries. Furthermore, these values are consistent with those reported by Caballero Tovar et al.,32 who reported a saponification index of 194.50 mg KOH g-1.
The refractive index values obtained (1.45) for all varieties align with the recommended values (1.456-1.459) by International Union of Pure and Applied Chemistry (IUPAC),12 confirming the adherence of the sample to established quality standards.
Determination of fatty acids in cocoa butter samples
The fatty acids in the various cocoa butter samples were identified and quantified by gas chromatography. All the cocoa butter samples (BN34, CCN51, PS1319) exhibited similar profiles, primarily consisting of palmitic acid (C16:0), stearic acid (C18:0), and oleic acid (C18:1n9c). Some fatty acids are present in minor concentrations (< 0.2%), such as myristic acid (C14:0), gadoleic acid (C20:1), alpha-linolenic acid (C18:3n3), behenic acid (C22:0), and lignoceric acid (C24:0) (Table 4).
Fatty acid composition of different cocoa butter samples from the BN34, CCN51, and PS1319 varieties
Among the fatty acids, arachidic acid, palmitic acid, and the predominant oily acid are noted in the literature.15 Regarding unsaturated fatty acids, the results primarily show monounsaturated levels as follows: BN34 at 33.547%, CCN51 at 32.801%, and PS1319 at 34.422%. The levels of polyunsaturated fatty acids are lower: BN34 at 2.539%, CCN51 at 2.381%, and PS1319 at 2.507%.
There is no significant difference in the total amounts of saturated and unsaturated fatty acids, nor in the levels of monounsaturated and polyunsaturated fatty acids across different types of fat (BN34, CCN51, PS1319). However, specific fatty acids do show variations. The BN34 variety has a low palmitoleic acid content (0.266%), while the CCN51 variety has a high stearic acid content (33.405%), and the PS1319 variety is notable for its high myristic acid content (0.101%). This demonstrates that different cocoa varieties can influence the fatty acid composition of cocoa butter.15
Examining the differences between fatty acids reveals their significant impact on melting points and thermal stability.33 A study by Melo et al.34 investigated various cocoa types used to produce 70% chocolate. It was found that the PH16 and TSH1188 varieties had higher melting points than other varieties, such as BN34, CCN51, and PS1319, due to differences in their fatty acid composition.
Characterization of cocoa butters by mid-infrared spectroscopy (MIR)
The MIR spectra of cocoa butters from the three varieties (BN34, PS1319, CCN51) in the spectral range of 3500 to 600 cm-1 (Figure 1) show nine distinct absorption peaks. These peaks are characteristic of the organic compounds present in the samples.

The spectra generally display significant similarities among the samples, indicating the presence of common functional groups across the varieties. The peaks observed at around 2919 cm-1 (asymmetric stretching vibration of CH2 groups), 2855 cm-1 (symmetric stretching vibration of CH3 groups), 1463 cm-1 (CH2 bending), 1377 cm-1 (CH3 bending), and 723 cm-1 (CH2 rocking) confirm the presence of fatty acids, which are typical constituents of triglycerides-the main components of cocoa butter. Additionally, the intense peak at 1743 cm-1, attributed to the stretching vibration of the ester C=O group, along with the peaks at 1236, 1161, and 1109 corresponding to C-O stretching vibrations of esters, emphasizes the lipid structure characteristic of triglycerides. These spectral peaks, typical of ester linkages, further support the identification of triglycerides as the predominant components of cocoa butter.35,36
Determination of the thermophysical properties of cocoa butter
Figures 2 and 3 illustrate the DTA and DTG curves of the cocoa butter samples, respectively. Upon exposure to heat, cocoa butter undergoes several transformations at specific temperatures. In Figure 2, numerous significant peaks can be observed.

DTA curves as a function of temperature for the cocoa varieties (a); enlarged region from 25 to 50 °C (b).

The first endothermic peak, occurring around 35-40 °C, corresponds to the melting point of cocoa butter. Following this, there is an exothermic peak between 197.98 and 392.38 °C, which represents the smoke point; this is the temperature at which cocoa butter begins to decompose and produce smoke. Between 392.38 and 456.53 °C, the ignition point is reached, indicating the moment when vapors released from heated cocoa butter ignite briefly in the presence of a heat source. Finally, between approximately 456.53 and 575.88 °C, the combustion point is attained, which is the temperature at which cocoa butter burns continuously without an external ignition source. At this stage, fat decomposition is at its maximum (Table 5).37,38
Onset and end temperatures of the different peaks observed during the DTA analysis of the cocoa butter samples (BN34, CCN51, PS1319), along with their corresponding thermal events
Analysis of the various thermal peaks obtained by DTA reveals differences among cocoa butter varieties. In Figure 2b, the varieties melt at slightly different temperatures, with PS1319 exhibiting the highest melting point at 38.5 °C.
The overall composition of fatty acids determines the physical properties of fats, their positioning within the triacylglycerols (TAGs), and the interactions between chains of varying lengths. These factors can influence macroscopic properties such as melting temperature.39 A study by Figueira and Luccas40 revealed a significant difference in triacylglycerol content between domestic and commercial cocoa butter used in Brazil, despite their fatty acid compositions being very similar.
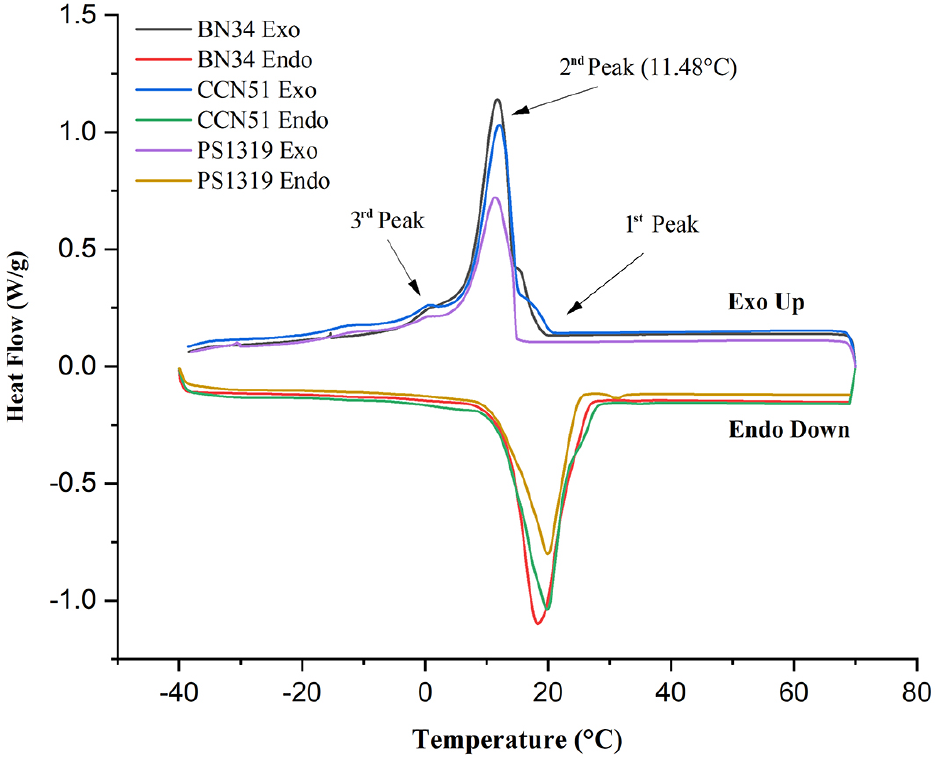
The polymorphic state can influence the melting point of fats.41Figure 4 illustrates that the PS1319 variety exhibits a more distinct crystallization peak, suggesting a predominance of more stable forms. In contrast, the BN34 and CCN51 varieties display three crystallization peaks, indicating the coexistence of various crystalline forms. This may suggest a less homogeneous composition of triacylglycerols.

Crystallization curves-exo up and melting curves-endo down obtained by differential scanning calorimetry (DSC) of cocoa butter from different varieties.
The PS1319 variety has a beneficial characteristic for the chocolate industry, it has a higher melting point. This allows the product to maintain a better texture at elevated temperatures and remain solid at room temperature. These factors are especially advantageous for product shelf life and presentation.4,5,33 The BN34 variety has a lower melting point of 35 °C, which can be attributed to its higher content of palmitoleic acid compared to the other varieties (see Table 4). The CCN51 variety exhibits an intermediate melting behavior, likely due to its unique fatty acid composition and triglyceride structure.38,42
The observations are supported by the DTG curve data (Figure 3), which reveal three exothermic events. The PS1319 variety exhibits greater resistance to these events, losing mass at a higher temperature (311.67 °C) and finishing the process at the same final temperature as the other varieties (575.82 °C). This indicates that PS1319 is more thermally stable and has a more uniform triglyceride composition. Additionally, its mass loss is more significant. This enhanced stability gives PS1319 an advantage in producing products that require improved resistance to thermal treatments, such as baking or the manufacturing of derivatives exposed to high temperatures.37,38
The CCN51 variety begins to lose mass at a lower temperature of 255.41 °C, which indicates lower thermal stability. This behavior may be due to its higher stearic acid content (see Table 4). Although stearic acid is saturated, its effect on the thermal resistance of cocoa butter may be limited by how the fatty acids are combined and distributed within the triglycerides. It is possible that CCN51 contains less stable triglyceride combinations, such as SOO, or even a eutectic mixture of triglycerides like SOS, SSO, or OSO in unequal proportions. These factors could contribute to a reduced melting point and overall thermal stability.4,42
The DTG curve indicates that all cocoa butter samples have low levels of volatile compounds and minimal water content, consistent with the moisture content data. This is demonstrated by the linear behavior observed across a temperature range of approximately 50 to 255 °C.
Melting and crystallization profile (DSC analysis)
Through this analysis, we determined the melting behavior of the cocoa butter samples (an endothermic process), and their crystallization (an exothermic) (Figure 4).
In terms of crystallization, the BN34 and CCN51 varieties exhibit similar behavior, initiating crystallization at nearly the same temperatures: 20.20 °C for BN34 and 20.25 °C for CCN51. Both varieties exhibit three distinct crystallization peaks. These peaks can be attributed to the heterogeneity of triglycerides, which crystallize at specific temperatures, as well as the polymorphic nature of cocoa butter.15
The first peak, observed at higher temperatures between 15 and 20.23 °C, is likely associated with the crystallization of triglycerides containing saturated fatty acids. The second peak, which is the broadest, occurs approximately between 4.42 and 15 °C and may correspond to the crystallization of triglycerides, such as SOS, POS, and POP. The third peak, found between -2.97 and 4.42 °C, is probably related to the crystallization of triglycerides that predominantly contain unsaturated fatty acids.4,42
The PS1319 variety exhibits only two peaks and begins to crystallize later than the other varieties, starting at 15 °C. This behavior may indicate a more homogeneous triglyceride composition, a notion supported by the DTG analysis. A more uniform composition promotes the formation of a more ordered crystalline structure, leading to more stable crystals once formed.42 This could account for its higher melting point and enhanced thermal stability, as noted in the DTA analysis (Figure 2).
PS1319 may contain POS-type triglycerides. Researchers indicate that POS serves as a model for other TAGs found in cocoa butter, affecting its organization within the crystalline structure. A recent study43 concluded that the formation of the two most stable polymorphs of cocoa butter is primarily influenced by the behavior of POS, which is the most abundant TAG in cocoa butter. This is due to the melting and crystallization behavior of pure POS, which closely resembles that of cocoa butter in its β2 and β1 polymorphs. The similarity between these polymorphs is further supported by the melting profiles and X-ray diffraction patterns at both small and wide angles of POS in its β3 and β1 polymorphs.
Differences in peak intensity indicate varying amounts of crystalline triglycerides. A higher intensity indicates greater crystallinity, suggesting that the second peak corresponds to the highest level of crystallinity.15
The DTA analysis reveals that the PS1319 variety has a higher melting point of 20 °C, while the BN34 variety has the lowest melting point at 17.56 °C. However, there is a significant difference in melting point values obtained from the two analytical methods, with DSC consistently producing lower values. This discrepancy can be attributed to the different experimental conditions: during crystallization, samples analyzed by DSC were cooled at a rate of 5 °C min-1, whereas a cooling rate of 10 °C min-1 was used in DTA. The slower cooling rate of 5 °C min-1 allows for a longer crystallization time, which promotes better molecular arrangement, denser packing, and more complete formation of distinct crystalline phases. As a result, the lower melting point observed in DSC (ranging from 17.56 to 20 °C) may correspond to the less stable α polymorphic form.
Density
Figure 5 shows the density of cocoa butter for three varieties, PS1319, BN34, and CCN51, as a function of temperature. Measurements were taken at 40, 45, 50, 55, and 60 °C. It was observed that the density of all varieties decreased progressively with increasing temperature. This trend is typical of fats, as heat causes molecular expansion, which, in turn, reduces density.44

The density of a lipid primarily depends on how efficiently its triacylglycerol molecules are packed. When heat is applied, these triacylglycerol molecules gain more freedom, as the increased temperature weakens the intermolecular bonds that hold them together. This reduction in molecular packing allows the molecules to move more rapidly and occupy a larger volume. Since lipid mass remains constant, an increase in volume results in a decrease in density.33
The volumetric thermal expansion coefficient was calculated for each cocoa butter variety and was found to be relatively consistent. For variety BN34, the coefficient ranged from 0.000753 to 0.000762 °C-1; for CCN51, it ranged from 0.000757 to 0.000763 °C-1; and for PS1319, it ranged from 0.000758 to 0.000764 °C-1 (Table 6). The average coefficients across the different varieties range from approximately 0.000756 to 0.000763 °C-1. This indicates that the density of the cocoa butter samples decreases by about 0.0756 to 0.0763% for every degree Celsius increase in temperature. The low variability in thermal expansion coefficients among the varieties suggests that the density of these three cocoa butter varieties responds similarly to temperature changes.
A two-factor factorial analysis was conducted to assess the effects of variety, temperature, and their interaction on cocoa butter density. The results yielded a p-value of 0.99, which is significantly higher than the established significance threshold of 0.05. This finding indicates that there are no significant differences among the factors studied (variety and temperature) or their interactions. Therefore, it appears that variety does not have a significant impact on density under the experimental conditions tested.
Conclusions
This study examined how different cocoa varieties (BN34, CCN51, and PS1319) affect the fatty acid composition and the thermal and physicochemical properties of cocoa butter. The findings indicated that the variety significantly influences both the fatty acid composition and the thermal properties of cocoa butter. The PS1319 variety demonstrated greater thermal stability and a higher melting temperature. In contrast, the BN34 variety had a lower melting point, while CCN51 exhibited lower thermal stability. The cocoa varieties impacted other parameters such as moisture content and acidity index, with BN34 showing the lowest values. Both the CCN51 and BN34 varieties produced higher butter yields, an important factor for optimizing production.
Some parameters were not significantly affected by cocoa variety. For instance, density, ash content, saponification index, refractive index, and MIR spectra showed no differences among the samples. Additionally, while variations were observed in specific fatty acids, the overall saturated-to-unsaturated fatty acid ratio remained largely unchanged. These findings suggest that the PS1319 variety is better suited to the chocolate industry, whereas the BN34 and CCN51 varieties are better suited to applications that prioritize high cocoa butter yield.
Data Availability Statement
All data are available in the text.
Acknowledgments
The authors are grateful to CAPES (88881.188519/2025-01), CNPq (314656/2021-9), FINEP (01.22.0363.00) and Universidade Estadual do Sudoeste da Bahia - UESB (Term 02/2023).
References
-
1 Naik, B.; Kumar, V.; J. Bioresour. Eng. Technol 2014, 1, 7. [Link] accessed in November 2025
» Link -
2 Nnanga Nga, E.; Ngene, J. P.; Ngoule, C. C.; Beyina Ayissi, F.; Tchinda, A.; Mpondo Mpondo, E.; Health Sci. Dis. 2015, 16 [Crossref]
» Crossref -
3 Garti, N.; Widlak, N. R.; Cocoa Butter and Related Compounds, 1st ed.; AOCS Press: Urbana, IL, USA, 2012. [Crossref]
» Crossref - 4 Beckett, S. T.; The Science of Chocolate, 3rd ed.; Royal Society of Chemistry: Cambridge, UK, 2019.
-
5 Servent, A.; Boulanger, R.; Davrieux, F.; Pinot, M.-N.; Tardan, E.; Forestier-Chiron, N.; Hue, C.; Food Res. Int. 2018, 107, 675. [Crossref]
» Crossref -
6 Alotaibi, R. F.; AlTilasi, H. H.; Al-Mutairi, A. M.; Alharbi, H. S.; Heliyon 2024, 10, e31467. [Crossref]
» Crossref -
7 Castro-Alayo, E. M.; Torrejón-Valqui, L.; Medina-Mendoza, M.; Cayo-Colca, I. S.; Cárdenas-Toro, F. P.; Foods 2022, 11, 1769. [Crossref]
» Crossref -
8 De Clercq, N.; Kadivar, S.; Van De Walle, D.; de Pelsmaeker, S.; Ghellynck, X.; Dewettinck, K.; Eur. Food Res. Technol. 2017, 243, 309. [Crossref]
» Crossref -
9 Chen, J.; Ghazani, S. M.; Stobbs, J. A.; Marangoni, A. G.; Nat. Commun. 2021, 12, 5018. [Crossref]
» Crossref -
10 Codex Alimentarius Standard for Cocoa Butter; CXS 86-1981, 2022. [Link] accessed in November 2025
» Link -
11 Directive 2000/36/EC of The European Parliament and of the Council of 23 June 2000 Relating to Cocoa and Chocolate Products Intended for Human Consumption. [Link] accessed in November 2025
» Link -
12 International Union of Pure and Applied Chemistry (IUPAC); Standard Methods for The Analysis of Oils, Fats and Derivatives Method 2.102: Refractive index; 1987. [Link] accessed in November 2025
» Link -
13 International Office of Cocoa, Chocolate and Sugar Confectionery (IOCCC); Method No. 26: Determination of Moisture in Cocoa and Chocolate Products - Karl Fischer Method; Brussels, 1988. [Link] accessed in December 2025
» Link -
14 Fèves de Cacao: Exigences de Qualité de l’industrie du Chocolat et du Cacao, 2015. [Link] accessed in November 2025
» Link -
15 Silveira, P. T. D. S.; Rodrigues, E. P.; Ribeiro, A. P. B.; Braga, A. V. U.; Martins, M. O. P.; Efraim, P.; J. Food Compos. Anal. 2025, 139, 107122. [Crossref]
» Crossref -
16 Wang, H.; Maleky, F.; Food Res. Int. 2018, 106, 213. [Crossref]
» Crossref -
17 Fonseca Maciel, L.; Felício, A. L. D. S. M.; Hirooka, E. Y.; Br. Food J. 2017, 119, 2117. [Crossref]
» Crossref -
18 Macêdo, M.; Rosa, E.; Luz, E. D.; Pires, J. L.; Agrotrópica Itabuna 2021, 33, 5. [Crossref]
» Crossref -
19 Jaimez, R. E.; Barragan, L.; Fernández-Niño, M.; Wessjohann, L. A.; Cedeño-Garcia, G.; Sotomayor Cantos, I.; Arteaga, F.; PeerJ 2022, 10, e12676. [Crossref]
» Crossref -
20 Alexandre, R. S.; Chagas, K.; Marques, H. I. P.; Costa, P. R.; Cardoso, J.; Rev. Bras. Eng. Agric. Ambient. 2015, 19, 785. [Crossref]
» Crossref -
21 Ferreira, A. C. R; Santana, C. S.; Indicação de Procedência Sul da Bahia: Manual da Indicação Geográfica Sul da Bahia; PCTSB: Ilhéus, Brazil, 2017. [Link]
» Link -
22 ISO 2451:2017: Cocoa Beans-Specification and Quality Requirements, 2017. [Link] accessed in November 2025
» Link -
23 Morales-Rodriguez, W. J.; Morante-Carriel, J.; Herrera-Feijoo, R. J.; Ayuso-Yuste, M. C.; Bernalte-García, M. J.; J. Agric. Food Res. 2024, 16, 101126. [Crossref]
» Crossref - 24 Association of Official Analytical Chemists (AOAC); Official Methods of Analysis, 18th ed., Revision 3; AOAC: Gaithersburg, USA, 2010.
- 25 American Oils Chemist’s Society (AOCS); Official Methods and Recommended Practices of the American Oil Chemists Society, 7th ed.; AOCS: Champaign, 2017.
-
26 Bannon, C. D.; Breen, G. J.; Craske, J. D.; Hai, N. T.; Harper, N. L.; O’Rourke, K. L.; J. Chromatogr. A 1982, 247, 71. [Crossref]
» Crossref - 27 American Oils Chemist’s Society (AOCS); Official Methods and Recommended Practices of the American Oil Chemists Society, AOCS Press: Champaign, USA, 2009.
-
28 Loullis, A.; Pinakoulaki, E.; Eur. Food Res. Technol. 2018, 244, 959. [Crossref]
» Crossref -
29 Camu, N.; De Winter, T.; Addo, S. K.; Takrama, J. S.; Bernaert, H.; De Vuyst, L.; J. Sci. Food Agric. 2008, 88, 2288. [Crossref]
» Crossref -
30 Ferreira, P. G.; Forezi, L. S. M.; da Silva, F. F. C.; Ferreira, V. F.; Rev. Virtual Quim. 2022, 14, 185. [Crossref]
» Crossref -
31 Jahurul, M. H. A.; Zaidul, I. S. M.; Norulaini, N. A. N.; Sahena, F.; Jinap, S.; Azmir, J.; Sharif, K. M.; Omar, A. K. M.; J. Food Eng. 2013, 117, 467. [Crossref]
» Crossref -
32 Caballero-Tovar, A. F.; Sandoval-Aldana, A. P.; Fernández Quintero, A.; J. Food Eng. 2024, 360, 111722. [Crossref]
» Crossref - 33 Damodaran, S.; Parkin, K. L.; Química de Alimentos de Fennema, 5th ed.; Artmed: Porto Alegre, Brazil, 2018.
-
34 de Melo, C. W. B.; Bandeira, M. J.; Maciel, L. F.; Bispo, E. S.; de Souza, C. O. D.; Soares, S. E.; Food Sci. Technol. 2020, 40, 326. [Crossref]
» Crossref - 35 Barbosa, L. C. A.; Espectroscopia no Infravermelho: na Caracterização de Compostos Orgânicos, 1st ed.; UFV: Viçosa, Brazil, 2007.
-
36 Kaur, G.; Kaur, D.; Kansal, S. K.; Garg, M.; Krishania, M.; Food Chem. 2022, 372, 131244. [Crossref]
» Crossref -
37 Bauer, L. C.; Santos, L. S.; Sampaio, K. A.; Ferrão, S. P. B.; Fontan, R. D. C. I.; Minim, L. A.; Veloso, C. M.; Bonomo, R. C. F.; Food Res. Int. 2020, 137, 109474. [Crossref]
» Crossref -
38 Jayathissa, N. P. S.; Silva, A. B. G.; Madhujith, W. M. T.; De Silva, P. G. S. M.; Jayatissa, R.; J. Natl. Sci. Found. Sri Lanka 2023, 51, 69. [Crossref]
» Crossref -
39 Cordina, R. J.; Smith, B.; Tuttle, T.; Compr. Rev. Food Sci. Food Saf. 2024, 23, e13316. [Crossref]
» Crossref -
40 Figueira, A. C.; Luccas, V.; Braz. J. Food Technol. 2022, 25, e2022033. [Crossref]
» Crossref -
41 Declerck, A.; Nelis, V.; Danthine, S.; Dewettinck, K.; Van Der Meeren, P.; Foods 2021, 10, 520. [Crossref]
» Crossref -
42 Macridachis-González, J.; Bayés-García, L.; Calvet, T.; Molecules 2020, 25, 4562. [Crossref]
» Crossref -
43 Ghazani, S. M.; Marangoni, A. G.; Annu. Rev. Food Sci. Technol. 2021, 12, 567. [Crossref]
» Crossref -
44 Bockisch, M.; Fats and Oils Handbook (Nahrungsfette und Öle), 1st ed.; AOCS Press: Urbana, IL, USA, 2015. [Link] accessed in November 2025
» Link
Edited by
-
Editor handled this article:
César Ricardo Teixeira Tarley (Associate)