 TRENDS IN RESEARCH ON ECONOMIC GROWTH AND CLIMATE CHANGE
Abstract
The concept of sustainable development emerged in the 1970s as an alternative to uncontrolled economic growth. It gained relevance through the 1972 Club of Rome report, which highlighted the need for balancing economic growth, environmental protection, and social justice. Accordingly, the aims of the present study are to map the progress of the literature on the Economic Growth/Climate Change intersection based on the bibliometric analysis of 5919 documents selected in the Scopus and Web of Science databases (1978-2024) in the R software. Based on the results, there was yearly growth by 13.77% in scientific production. China was the leader in number of publications, and it was followed by the United States and the United Kingdom. Environmental Science, Social Sciences, Economics, Energy and Medicine were the main research/production fields. Institutions such as Tsinghua University and the Chinese Academy of Sciences, and authors like Wang S., Bekun F. and Adebayo T. stood out among the other institutions and authors. According to the analysis, there were fast expansion of scientific production, significant international collaboration and gaps that still demand investigation, besides the underscoring of the relevant global collaboration to find sustainable solutions.
Keywords:
Bibliometric Analysis; Sustainable Developments; Economic Growth.
Resumo
O conceito de desenvolvimento sustentável surgiu nos anos 1970 como alternativa ao crescimento econômico desenfreado e ganhou relevância com o relatório do Clube de Roma em 1972, destacando a necessidade de equilibrar crescimento econômico, proteção ambiental e justiça social. Nesse contexto, esse estudo visa mapear a evolução da literatura sobre a interseção entre Crescimento Econômico e Mudanças Climáticas, usando análise bibliométrica de 5919 documentos na base Scopus e Web of Science (1978-2024) com uso do software R. Os resultados mostram um crescimento anual de 13,77% na produção científica, com a China liderando em publicações, seguida por Estados Unidos e Reino Unido. As áreas principais de pesquisa/produção são Ciência Ambiental, Ciências Sociais, Economia, Energia e Medicina. Instituições como Universidade Tsinghua e Academia Chinesa de Ciências, e autores como Wang S., Bekun F. e Adebayo T., são destaques. A Análise revela uma expansão rápida da produção científica, colaboração internacional significativa e identifica lacunas que necessitam de investigação, sublinhando a importância da colaboração global para soluções sustentáveis.
Palavras-chave:
Análise Bibliométrica; Desenvolvimentos Sustentáveis; Crescimento EconôMico.
Resumen
El concepto de desarrollo sostenible surgió en la década de 1970 como alternativa al crecimiento económico desenfrenado y ganó relevancia con el informe del Club de Roma de 1972, que destacó la necesidad de equilibrar crecimiento económico, protección ambiental y justicia social. En este contexto, este estudio tiene como objetivo mapear la evolución de la literatura sobre la intersección entre Crecimiento Económico y Cambio Climático, mediante un análisis bibliométrico de 5.919 documentos de las bases Scopus y Web of Science (1978-2024), utilizando el software R. Los resultados muestran un crecimiento anual del 13,77 % en la producción científica, con China a la cabeza en número de publicaciones, seguida de Estados Unidos y el Reino Unido. Las principales áreas de investigación/producción son Ciencias Ambientales, Ciencias Sociales, Economía, Energía y Medicina. Instituciones como la Universidad Tsinghua y la Academia China de Ciencias, y autores como Wang S., Bekun F. y Adebayo T. se destacan en el campo. El análisis revela una rápida expansión de la producción científica, una colaboración internacional significativa e identifica lagunas que requieren investigación adicional, subrayando la importancia de la colaboración global para soluciones sostenibles.
Palabras-clave:
Análisis Bibliométrico; Desarrollos Sostenibles; Crecimiento Económico.
INTRODUCTION
The concept of sustainable development, also known as "ecodevelopment", back in the 1970s, was an effort to find a viable alternative between unrestrained economic growth and the stagnation proposed by the "zero-growth" or "neo-Malthusian" advocates who predicted environmental catastrophes if growth did not stop. This debate got more intense after the 1972 Club of Rome report was issued, given all its warnings about the environmental limits of continuous economic growth (Romeiro, 2012). Back then, the world economy experienced remarkable growth driven by the postwar recovery and the rise of emerging countries like the Asian Tigers and Brazil, although most other nations remained in poverty.
Economic growth has historically focused both GDP increase and expansion, but it often neglects its long-term environmental consequences. This approach brought along technological innovations and improvements in quality of life, but it also boosted environmental degradation, pollution, and climate change. However, as challenges brought by the crisis became increasingly evident, the search for a sustainable development model was demanding. This concept advocates for balance among economic growth, environmental protection, and social justice, since it understands that human well-being depends on natural resources’ preservation and that their indiscriminate exploitation can compromise the future of the next generations.
Economic growth1 and climate change are entangled in a complex connection that leads to intense debates in the scientific community and among policymakers. Greenhouse gas emissions mostly resulting from the current economic growth rates and from dependence on fossil fuels significantly increase these gases concentration in the atmosphere, which causes a series of adverse impacts like climate change, sea level rise, ocean acidification, and biodiversity loss.
Pörtner et al. (2023) emphasized the urgency of taking immediate climate actions to prevent the loss of a critical window aimed at ensuring a livable future. Experts advocate for implementing mitigation measures aimed at reducing the greenhouse gas emissions and, consequently, at limiting global warming. However, these measures often oppose economic priorities that target economic growth as fundamental factor for socioeconomic development and quality of life improvement.
Recent studies have shown that the climate change/growth connection has become the core element in debates among political leaders, economists, and scientists. The 2018 Nobel Prize in Economics was awarded to William Nordhaus and Paul Romer, and it highlighted the relevance of this topic. Nordhaus is known for integrating climate change into long-term economic skills models, whereas Romer contributed to research on how knowledge and innovation can drive sustainable economic growth. This award underlined the urgent need for addressing climate change as economic priority, in addition to its environmental impacts, with emphasis on the fact that mitigation costs are lower than those of the adverse impacts of non-mitigation (Goulder; Pizer, 2006).
Romer (1989) argued that the economic growth core lies in improving the instructions for resources’ combination, i.e., in technological changes. He incorporated variable ‘technology’ as endogenous to its economic model and assumed that it is defined by economic decisions. Nordhaus (1992), in his turn, developed an integrated evaluation model2, the so-called DICE (Dynamic Integrated model of Climate and Economy), which analyzes the economy and climate by projecting how economic growth can generate emissions, how these emissions affect the climate and, consequently, the likely resulting economic impacts. Nordhaus (2013) included induced innovation in one of these model extensions. He acknowledged Romer’s contributions by presenting the technological progress as factor stimulated by economic policies and investments in research.
Yoo et al. (2024) recently explored urban industrial land expansion uneven impacts on economic growth and carbon dioxide emissions. His study was based on using satellite data and machine learning to map industrial land (in high resolution) in ten countries and on analyzing such an expansion impact on 216 subnational regions from 2000 to 2019. His results have shown that industrial land expansion in developing regions was a dominant factor for economic growth and emissions, since it contributed to development by 31% and 55%, respectively. On the other hand, the same impact was significantly lower (8% and 3%, respectively) in developed regions, given a shift to other economic growth mottos, such as education.
Nepal, Musibau and Jamasb (2021) assessed the energy efficiency effect represented by final energy consumption on CO2 emissions in the European Union through a quantile regression approach based on generalized time methods, found that energy efficiency reduced emissions by 8.6%, on average, in all quantiles. Improving oil efficiency would allow the EU to reduce emissions and improve energy security, and this outcome is in compliance with both the European Green Deal and the Efficiency First Principle goal. The authors recommended energy efficiency policies substantiated by likely rebound effects that could limit their effectiveness.
Dolge and Blumberga (2021a) analyzed the impact of GHG emission reduction measures based on the European Green Deal context, since it aims at turning Europe into the first carbon-neutral continent by 2050. The study was based on using Kaya identity and LMDI decomposition to show that improvements in energy efficiency have a two-fold impact on emission reductions than renewable energy strategies. However, economic growth remains the main factor impairing the achievement of more significant emission reductions, which highlights the need for more significant efforts in implementing climate mitigation measures in economies.
Dolge and Blumberga (2021b) assessed how changes in agricultural yield, due to climate change, affect the prices of commodities such as corn, rice, soybeans and wheat, by using yield projections based on the influence of shared socioeconomic pathways. Hickel and Kallis (2019) questioned the green growth theory, according to which, it is possible to go on with economic expansion without compromising the planet’s ecology with technological changes and replacements. The analysis of historical-trend studies and modeled projections showed them that the full resources-use and carbon-emissions decoupling from GDP growth is highly unlikely, mainly at the speed required to avoid global warming, namely: more than 1.5ˇrC or 2ˇrC. Therefore, they suggested that green growth is a misguided goal and that policymakers should seek alternative strategies to it.
Dell, Jones and Olken (2014) reviewed the literature on using panel methods to assess how temperature, rainfall and storms influence economic outcomes. They recorded significant impacts on agricultural yield, industrial productivity, energy demand, health, conflicts, and economic growth. Their review highlighted the relevance of exogenous variations within a specific spatial unit, over time, at the time to credibly identify the channels linking climate to economy, the heterogeneous effects on different sites types and the nonlinear effects of climate variables.
A recent Nature publication by Kotz, Levermann & Wenz (2024) highlighted that the global economy would face a significant income drop estimated at 19% by 2050 due to climate change effects, starting today, even with steep reduction in CO2 emissions. They pointed towards global yearly damage close to the unbelievable amount of 38 trillion dollars, with likely variation ranging from 19 to 59 trillion dollars, due to temperature increase and to changes in rainfall and temperature patterns. The inclusion of other extreme phenomena, such as storms and wildfires, could further increase these costs.
Accordingly, the aim of the herein proposed bibliometric analysis was to map the development of the scientific literature on the economic growth/climate change intersection. Documents collected from the Scopus and Web of Science databases, published from 1978 to 2024, were analyzed in R software and they allowed identifying publication patterns, collaboration networks between researchers, and the main topics within this study field. This analysis type can help better understanding how the scientific community has addressed this multifaceted challenge and the knowledge gaps demanding further investigations.
METHODOLOGICAL PROCEDURES
EMPIRICAL STRATEGY
The Bibliometrix tool was herein applied to achieve specified goals of this bibliometric study. This tool provides quantitative techniques for literary data analysis in combination with results visualization in the biblioshiny graphical interface (Aria; Cuccurullo, 2017).
This approach was implemented by using the R programming language. It is worth noting that the ‘bibliometrics’ corresponds to mapping a systematic review focused on quantitative and statistical modeling. This approach stems from updates in information and communication sciences. Accordingly, the analysis of bibliometric indicators allowed introducing an academic activity assessment on the economics and environmental fields. This procedure follows crucial stages to ensure more consistent and robust results. First, bibliometric data were selected based on keywords, such as "economic growth" and "climate change", extracted from reliable and scientifically acknowledged databases included in the collection of the Federated Academic Community (CAFe). CAFe is an authentication federation service designed for educational and research institutions in Brazil. It promotes collaboration and resource sharing, as well as makes access to academic research platforms easier. Subsequently, the collected data were organized and structured to enable a more accurate and reliable analysis.
DATA
Data were collected from the Scopus Elsevier and Web of Science databases. The choice for the Scopus database was based on the following reasons: (i) content range and variability; (ii) data accuracy and quality, since the platform maintains a rigorous selection of sources and cataloging processes; (iii) citation and impact metrics essential for the co-citation analysis.
The inclusion of Web of Science data was encouraged by the following factors:(i) understandable and multidisciplinary cover, because the information system gives access to a wide range of disciplines, including those in the exact, biological, social and human sciences fields, which enables connections across several knowledge fields; (ii) high credibility of sources; (iii) complementarity information.
The 1978-2024 span emerged from the need for making sure that the analyzed articles would disclose a chronological distribution of publications to allow identifying progress trends between economic growth and climate change. The aim of this approach was to provide an understandable view of knowledge evolution, over time, to highlight relevant milestones and some paradigm shifts that may have taken place on the way. The definition of this time frame made it possible to achieve a more accurate analysis of how certain topics, theories, and methodological approaches have developed and gained relevance over the last decades.
DATA PROCESSING
It was necessary to clean and process the information after data collection at different research platforms. Initially, the collected data were imported to the RStudio environment, where both datasets were converted into data frames to allow their subsequent processing in R language. Interestingly, the databases were exported in different formats, the Scopus file was exported in Comma-Separated Values (CSV) format and the Web of Science file was exported in Plaintext format.
The second study stage consisted of merging these two data frames into a main database by taking into account differences in the amount and presence of duplicate records across both scientific research platforms. A filtering procedure was run in the dplyr package, which is part of the tidyverse collection, to only select articles and increase the accuracy of the analysis applied to scientific production, over time. Then, 2.987 duplicates were discarded, which resulted in the total of 5.919 documents in the main database, which was the very focus of the current bibliometric analysis. Functions available in the Bibliometrix were adopted to carry out automatic analyses and to synthesize the recorded results at the third stage. Finally, the main database was exported in xlsx format to enable its importation to the biblioshiny graphical interface at the fourth and last stage.
Articles’ publication by journals was classified based on the research fields provided by the Scimago Journal & Country Rank3 (SJR) platform, which makes available bibliometric indicators and quartiles for scientific journals, in addition to categorize them by region, country and knowledge field. The presence of the variable referring to journal names made it easier to merge the two datasets in the main database and in the one provided by SJR. Each journal was associated with one or more research fields available in the SJR database over this process, which allowed showing the progress of scientific production across several study fields.
RESULTS
RESEARCH OVERVIEW
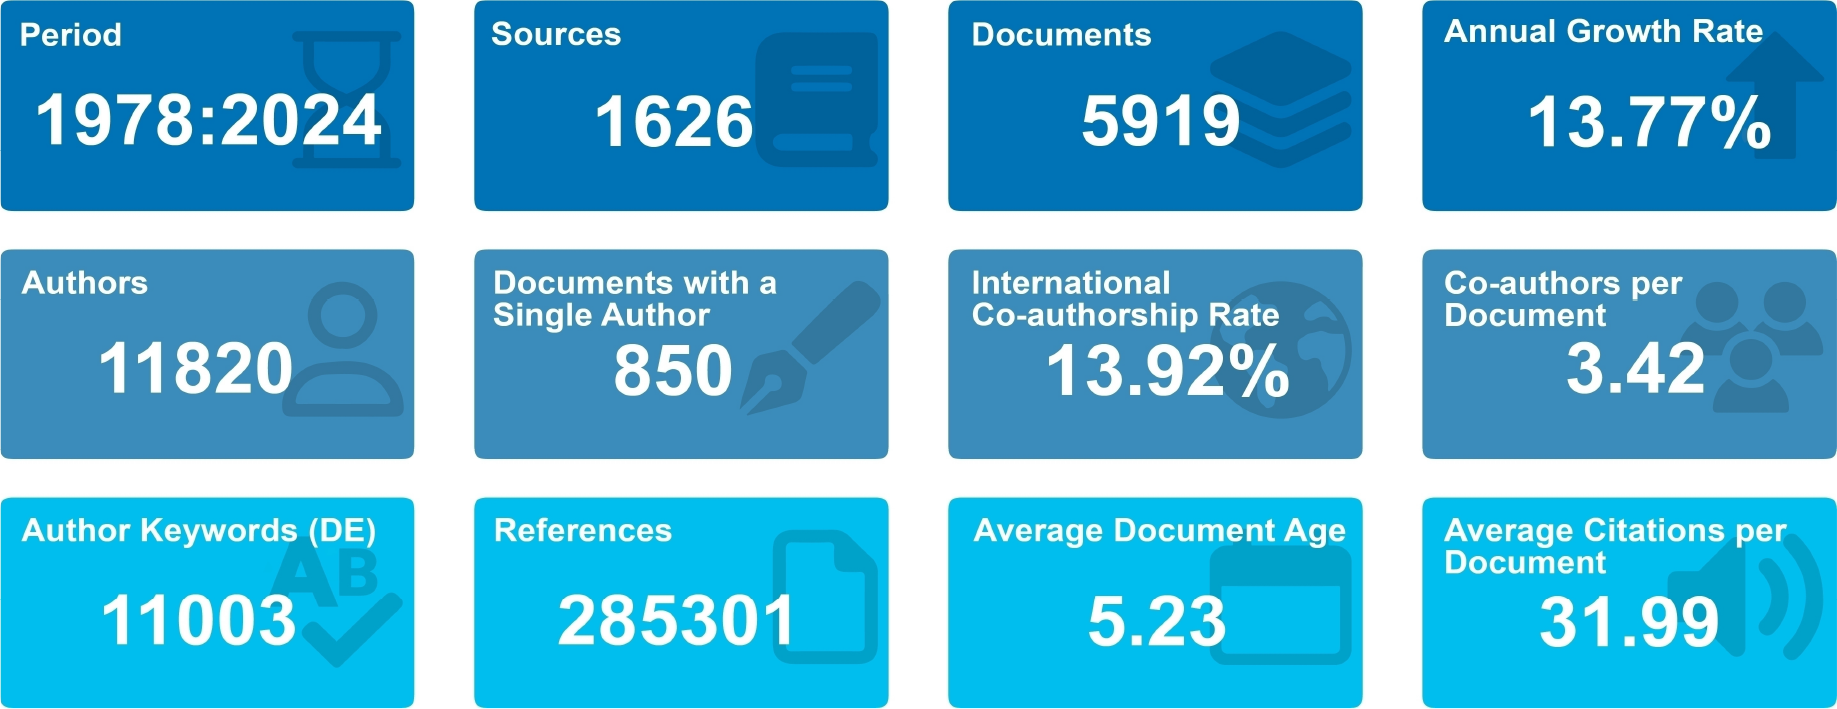
The yearly growth rate of 13.77% was observed over a 46-year period-of-time based on the 5.919 documents coming from 1.626 sources and on the synthesis involving 11.820 authors (Figure 1). Notably, there were 285.301 references and 31.99 citations per document, on average. According to these indicators, there is a solid knowledge base, which partly explains the abundance of references and the diversity of theoretical approaches observed in the analyzed documents.
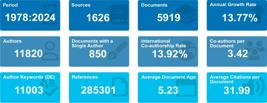
Overview of the gathered information. Source: Elaborated by the authors based on data extracted from Scopus and WoS (2024).
In total, 850 authors were identified in single-authored documents. On the other hand, 3.42 co-authors per document and 13.92% international co-authorship were recorded, on average, and these numbers contributed to the diversity of perspectives and expertise within this research field. Documents’ mean age, if one takes into account the analyzed time span, was 5.23 years. This finding suggested that the documents were relatively recent in comparison to the adopted time frame, which pointed out that a large fraction of the selected articles were published in recent years.
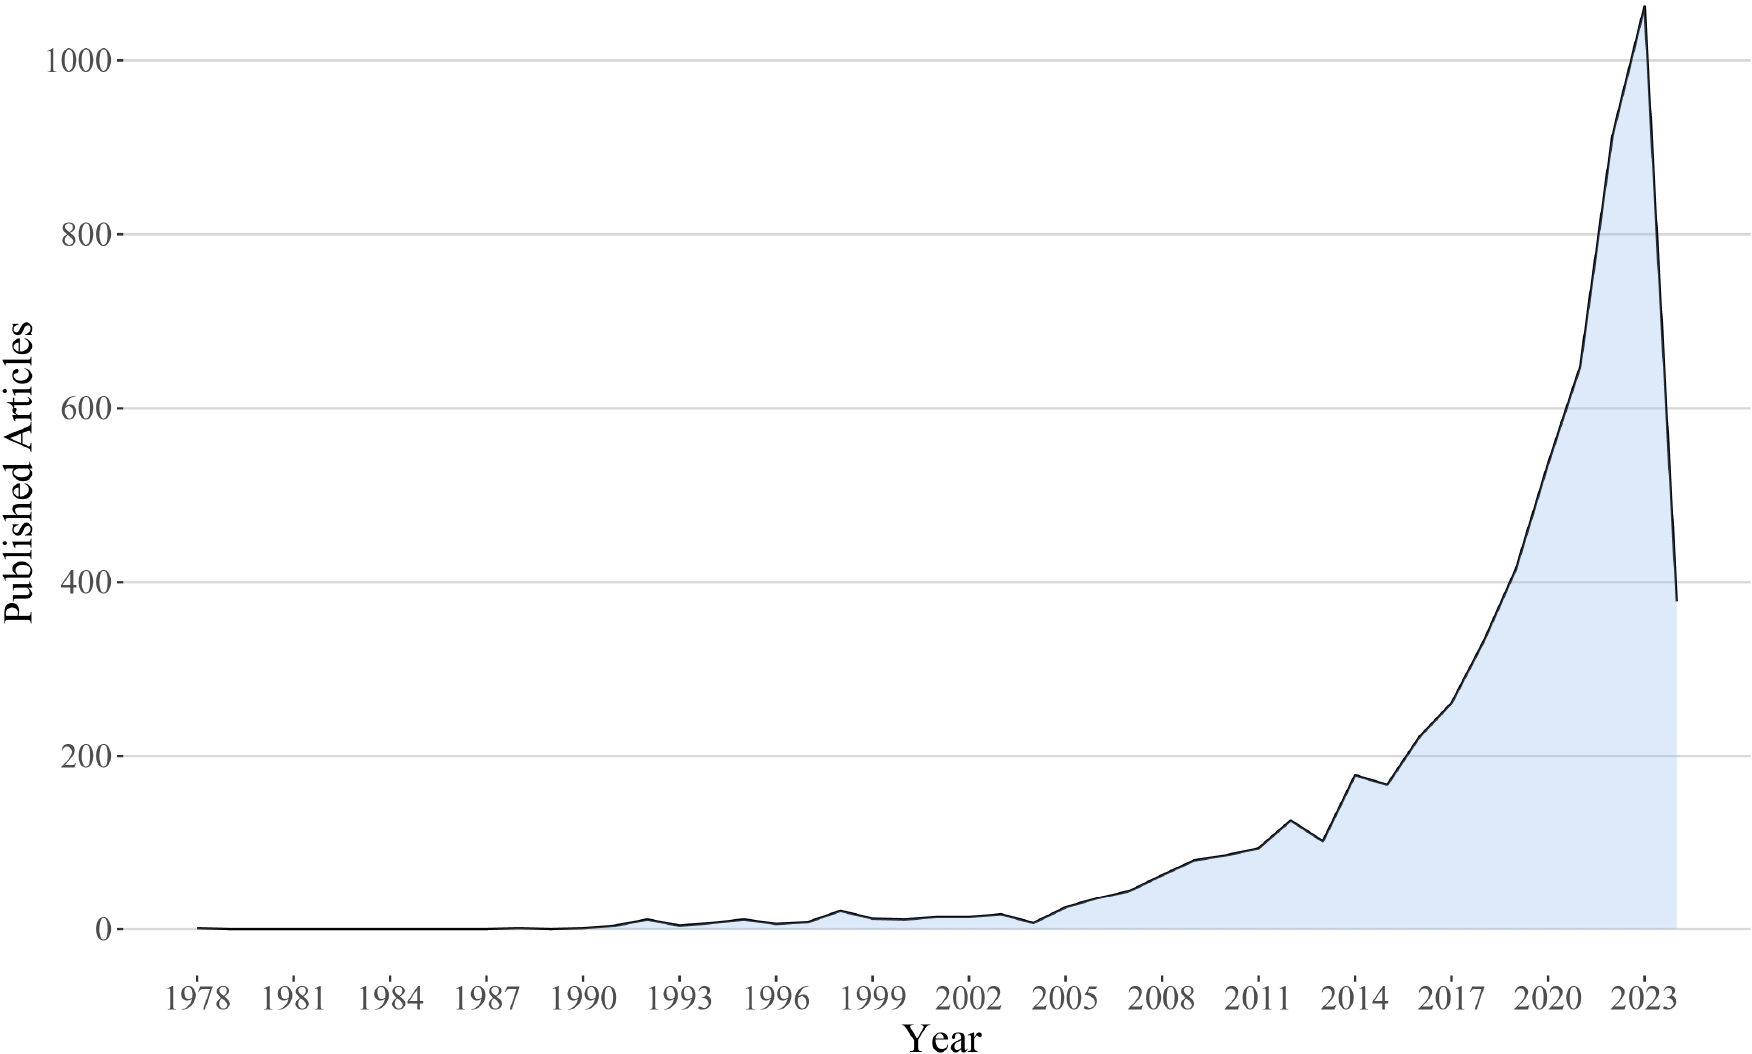
The aim of the temporal analysis applied to the 5.919 documents was to disclose these publications’ distribution over the years (Figure 2). The first article, titled "The Question Mark over Coal: Pollution, Politics, and CO2", was published in 1978 by Marland and Rotty (1978). It stands out as the initial contribution to the Economic Growth and Climate Change topic. No relevant publications were observed from 1979 to 1987; however, there was a noticeable increase in scientific production in 1991 and 1992, with 4 and 11 published articles, respectively. The number of publications remained within this range in the following years, except for 1998, when the total of 21 documents were registered.
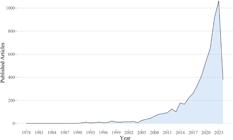
Number of publications over the years. Source: Elaborated by the authors based on data extracted from Scopus and WoS (2024).
This topic went to the mainstream in 2005, when 25 scientific publications were recorded, which was a milestone for its upward trend. There was a significant increase in the number of publications in 2022: 913 published articles, which corresponded to increase by 265 publications in comparison to 2021, when only 648 articles were published. The highest cumulative number of publications was recorded in 2023; it reached 1.062 articles. The frequency of 378 published documents was observed during the first five months of 2024, and it corresponded to the limit observed at the data collection period.
Several elements can explain the surge in publications in 2005, the first milestone of interest in this topic. The Kyoto Protocol was signed in 1997 and came into force in 2005. It turned on warnings on emissions and climate mitigation, which increased the demand for economic evidence and analysis. Furthermore, the climate change/economic growth association embodied a core role after the Stern Review by the British economist Sir Nicholas Stern, which was commissioned in 2005 and published in 2006. Nordhaus (2006) challenged the report’s conclusions by arguing that recommendations for drastic cuts in greenhouse gas emissions stems from the use of a near-zero social discount rate in opposition to more conventional discount rates associated with market interest rates, capital returns, and savings and investment patterns.
According to MMcKibbin and Wilcoxen (2002), the Kyoto Protocol is inefficient because no one precisely knows how much warming will happen, when it will happen or where it will take place (given the high degree of economic and impact uncertainty), nor what the mitigation costs will actually be. Thus, optimal policies must be robust in order to forecast errors. On the other hand, Carter et al. (2006) emphasized that a near-zero social discount rate distorts the weight of future impacts in cost-benefit models, whereas Mendelsohn (2006) pointed out that more conventional discount rates lead to less intense optimal policies in the short run and to gradual reinforcement, over time. Therefore, the debate got more intense after 2005 due the effort to address Kyoto Protocol weaknesses based on robust models that maximize intertemporal welfare rather than on reducing short-term economic growth.
With respect to the second milestone, from 2013 to 2014, the Fifth Assessment Report of the Intergovernmental Panel on Climate Change (IPCC) established climate change scenarios understood as hypothetical projections based on variables, such as population, economic activity and technology, to assess the long-term effectiveness of mitigation and adaptation strategies. At the same time, the United States and China announced joint targets for emission reductions and clean energy expansion. The political signaling of the two largest economies on the globe increased the confidence in multilateral negotiations that led to the 2015 Paris Agreement and opened room for the adoption of the 2030 Agenda, in the same year. Social pressure grew and the Peoples Climate March in New York, which brought to the forefront climate justice and a fair energy transition, was an example of it. Moreover, the launch of satellites such as the Landsat 8 and the Sentinel, in combination with open access to databases and with updates in machine learning, has broadened the quantitative analytical capacity. Altogether, these factors, and the convergence among science, politics and society, created the favorable conditions for more publications on economics and climate.
TEMPORAL DISTRIBUTION AND COUNTRY CONTRIBUTIONS
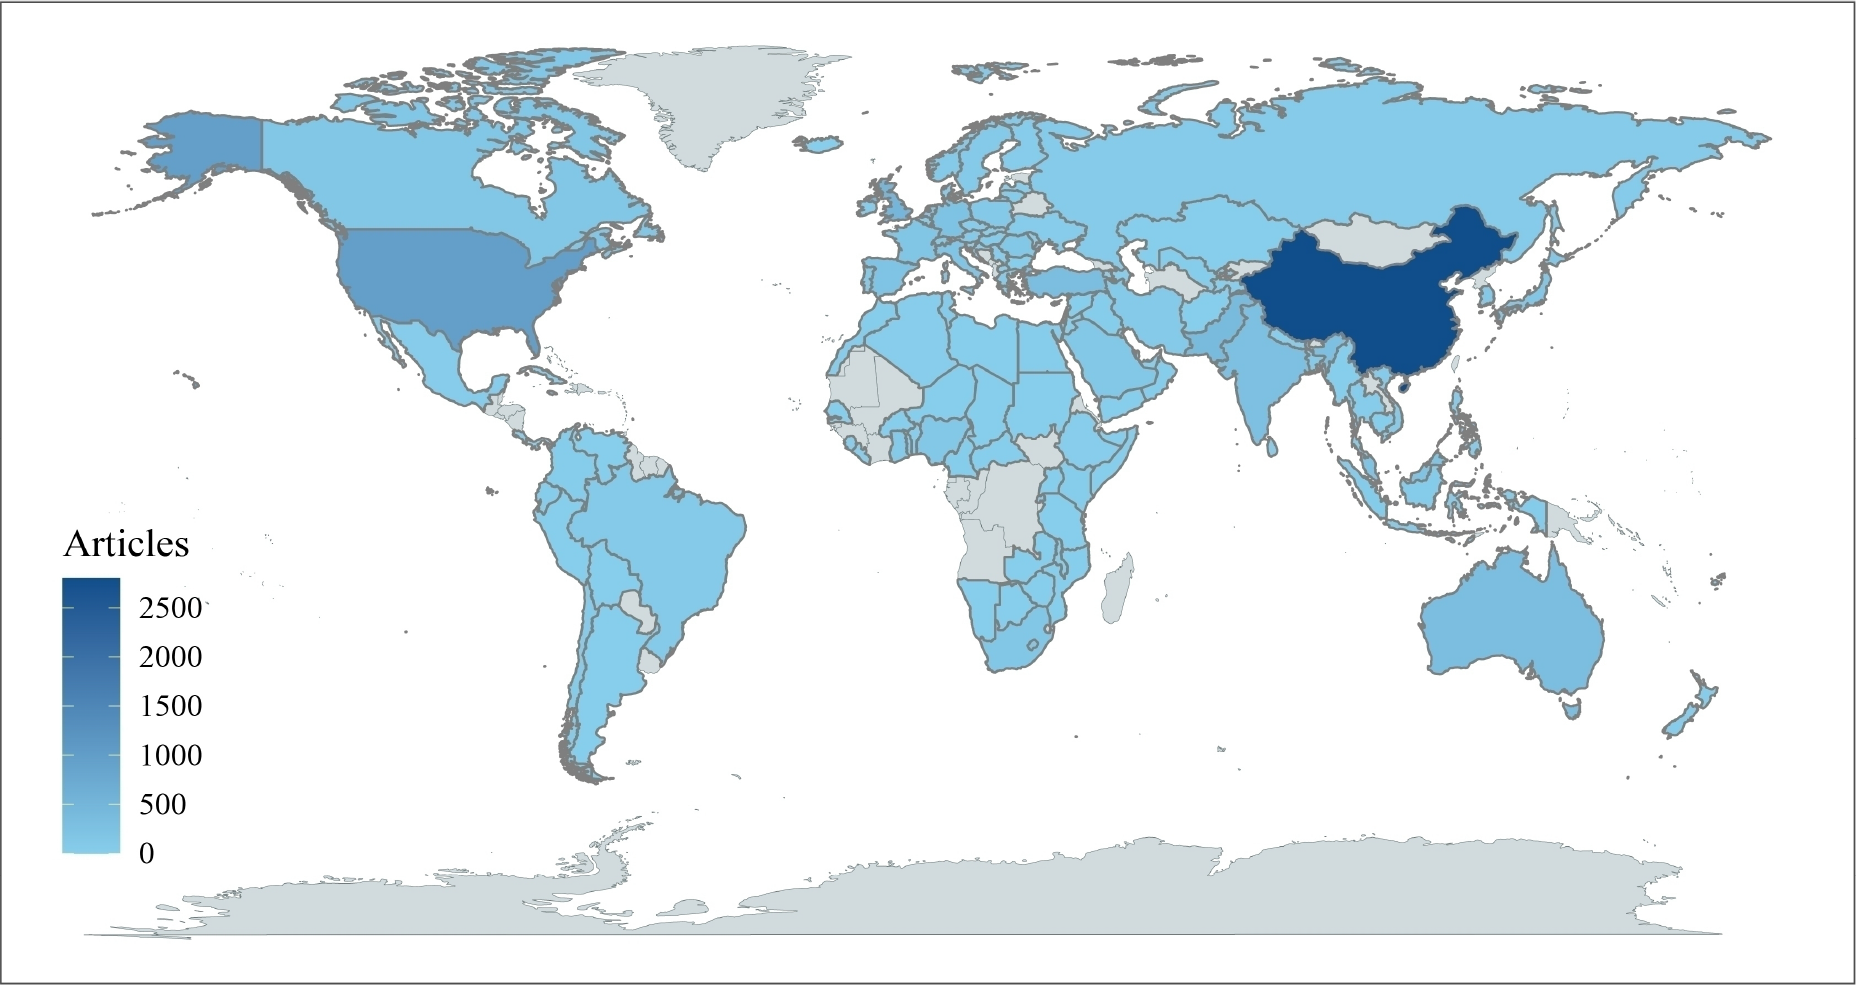
Scientific production values in regards to articles’ spatial distribution were gathered by country, as shown in Figure 3, which presents the contributions from each nation. This procedure allowed assessing how often the authors are associated with their respective countries by bearing in mind that the count of citations mentioning authors from different nationalities in a scientific production is distributed among countries (Aria; Cuccurullo, 2017). It is worth noting that this approach leads to a total contribution count that exceeds the total number of documents analyzed when the frequency of scientific outputs from all countries are summed.
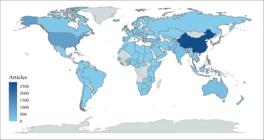
Frequency of scientific production per country. Source: Elaborated by the authors based on data extracted from Scopus and WoS (2024).
A wide global participation in research on economic growth and climate change was shown by this analysis. China, the United States, the United Kingdom, Pakistan, and Türkiye stood out among countries presenting scientific production; they recorded 2,800, 966, 496, 387 and 332 publications, in total, respectively. Australia, India, Germany, Malaysia, and Spain come after them with 318, 281, 233, 208, and 206 publications, respectively. Countries counting for less than 200 publications were the Netherlands (190), Italy (174), France (165), Canada (151), South Africa (144), Japan (138), Saudi Arabia (128), Romania (122), and Nigeria (118). The other countries accounted for less than 100 documents, in total.
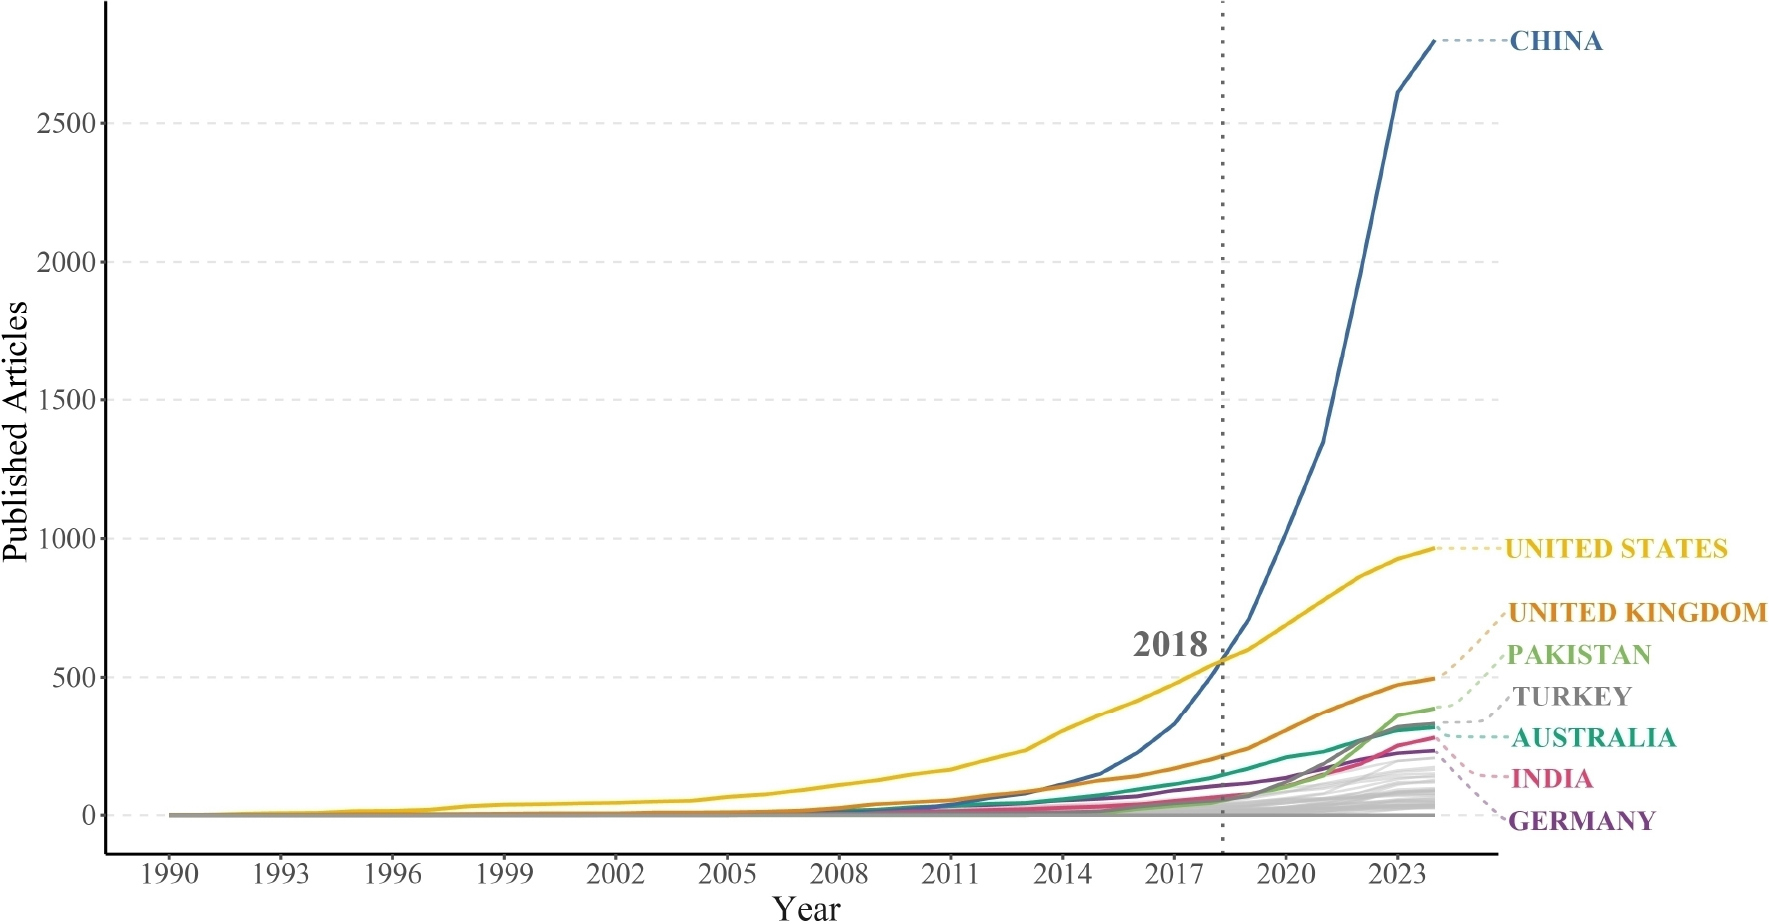
The yearly progress of scientific publications in the main countries discloses an upward trend (Figure 4). The yearly variation on the number of published articles is calculated to analyze the increase or decrease in scientific production. This process demands subtracting the total number of scientific publications recorded in the previous year from that of the current year and dividing this difference by the number of articles recorded in the previous year. The result is multiplied by 100 to find the variation rate. It is important observing that it was not possible to identify the authors’ country of origin before 1990, and is it a temporal limitation covering the 1990-2024 time span. Thus, there was increase in the frequency of scientific publications in all countries from 2010 onwards, whereas only the United States showed significant prevalence of scientific article publication before that: more than 50 publications per year. Moreover, the US also stood out for recording the largest volume of published articles from 2011 to 2018, with variation rate ranging from 11.5% to 30.3%.
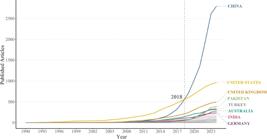
Yearly scientific publication progress in the main countries (1990-2024). Source: Elaborated by the authors based on data extracted from Scopus and WoS (2024).
The United Kingdom accumulated 54, 71 and 85 documents between 2011 and 2013, with yearly variation rates of 14.89%, 31.48% and 19.72%, respectively. China became the second most productive country in terms of scientific publications between 2014 and 2018, with variations ranging from 33% to 53.8%. China became the country with the largest number of published articles in 2019: 710 documents and accumulated 1.021, 1.350, 1.960, 2.612, and 2.800 articles in the following years (from 2020 to 2024), respectively. The United States followed China with 689, 778, 865, 927, and 966 published scientific articles within the same time span.
Pakistan and Türkiye were other countries showing consistent scientific production and growing interest in this research topic, mainly after 2018. These countries stood out for their high variation rates, which reached 74.13% (120) in 2022 and 73.91% (249) in 2020, respectively. India recorded 281 articles in 2024, and it means increase by 11.95% in its production. This number marks the highest yearly variation rate up to the present data collection time. Germany and Australia produced 233 and 318 scientific publications, respectively, in this same year. Although they contributed with a considerable number of articles, they recorded relatively low variation rate (4.02% and 3.58%, respectively) in comparison to 2023.
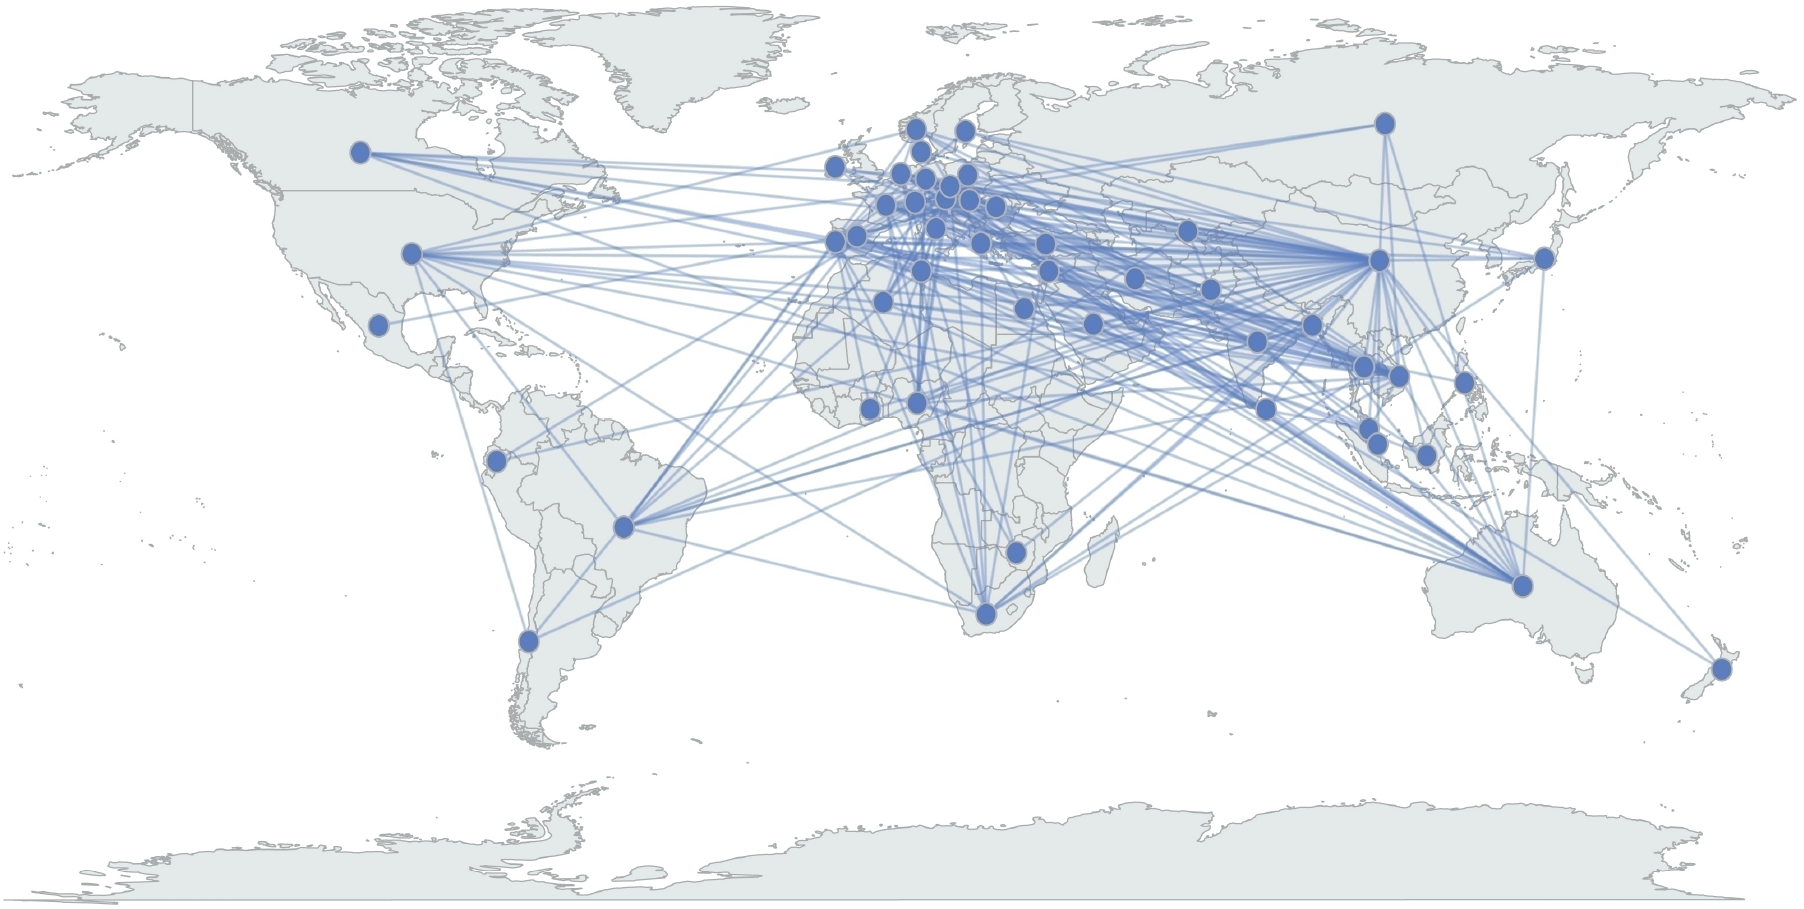
The frequency of connections between nations is calculated to check on the cooperation networks among countries based on the nationalities of scientific publications’ authors and co-authors. The collaboration network is represented by the number of nodes connecting countries, as shown in Figure 5. China stands out in this group for recording the highest frequency of scientific connections with Pakistan (105), the United States (65), the United Kingdom (46), and Türkiye (33). Pakistan ranks the second position in this ranking for collaborating with Saudi Arabia and Malaysia: 31 nodes, in both cases. The United States shows scientific connections with the United Kingdom (21), Australia (15), and France (14), but at lower frequencies. On the other hand, the United Kingdom keeps 14 and 12 connection nodes with Germany and the Netherlands, respectively.
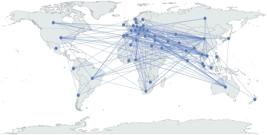
International scientific production cooperation networks among countries. Source: Elaborated by the authors based on data extracted from Scopus and WoS (2024).
China’s trajectory and that by the United States in international collaborations is related to updates in research and development. According to the Organization for Economic Co-operation and Development (OECD) and to the National Science Foundation (NSF), China recorded US$ 667.6 billion in 2021and ranked the second position in this ranking. It only lost a position to the United States, which reached US$ 806 billion. Both countries account for a significant share of global greenhouse gas emissions, and it reinforces the core role played by their scientific agendas. The United Kingdom, Germany and France also stand out among the biggest investors in the global research and development stages, and it enhances their visibility in academic production. The high investments in Research and Development explain the core node positions of the United States and China, as well as their connections with cooperation networks and links extending to developing countries due to industrialization and energy initiatives, and with developed countries due to modeling and publication in high-impact journals.
Pakistan’s growing scientific interest is explained by its strengthened ties with China, which is associated with the 2013 ChinaPakistan Economic Corridor (CPEC), with its initial investment package of approximately US$ 46 billion. This amount was later expanded and focused on economic development through energy, transportation infrastructure and industrial zones (Ali, 2020). However, the Climate and Development Report published by the World Bank in 2022 warned that Pakistan may face Gross Domestic Product losses between 18% and 20% by 2050 if the current climate vulnerability scenarios remain, since it would compromise its development and poverty-reduction goals. Accordingly, betting on CPEC as economic growth motto requires aligning investments with climate resilience demands. The 2025-2029 Action Plan sets climate change, water management and air quality cooperation actions, besides creating joint laboratories and programs focused on early disaster warning and Earth sciences research (Government of the Peoples Republic of China; Government of the Islamic Republic of Pakistan, 2025).
MAIN JOURNALS AND RESEARCH FIELDS
The H index, which is a widely acknowledged metrics, was adopted as simple and useful measure to feature and classify researchers or journals’ scientific productivity. It is calculated based on both the number of published articles and of received citations, which results in a single value (Hirsch, 2005).
Table 1 presents the ten main journals ranked based on H index, total citations and number of articles, in addition to the starting year of publications on the Economic Growth and Climate Change topic. The journal Environmental Science and Pollution Research stood out for its significant productivity and academic impact, which was highlighted by its large number of citations (12,800) and articles (450). It is known by its consistent presence since its very beginning in 2012.
Main scientific journals based on the academic productivity index. Source: Elaborated by the authors based on data extracted from Scopus and WoS (2024).
Although the Journal of Cleaner Production recorded a slightly smaller number of citations (12,797) and articles (192) than the Environmental Science and Pollution Research, it stood out for its high academic productivity: H index equals 62. The initial year of publication varies; journals like Energy (launched in 1991) and Energy Policy (launched in 1994) have kept consistent presence, and younger journals, such as Renewable Energy (2017), have quickly established themselves as influential. Applied Energy and Ecological Economics show significant impact when it comes to number of published articles. Although they have published fewer scientific papers (53 and 59, respectively), they stand out for their academic relevance.
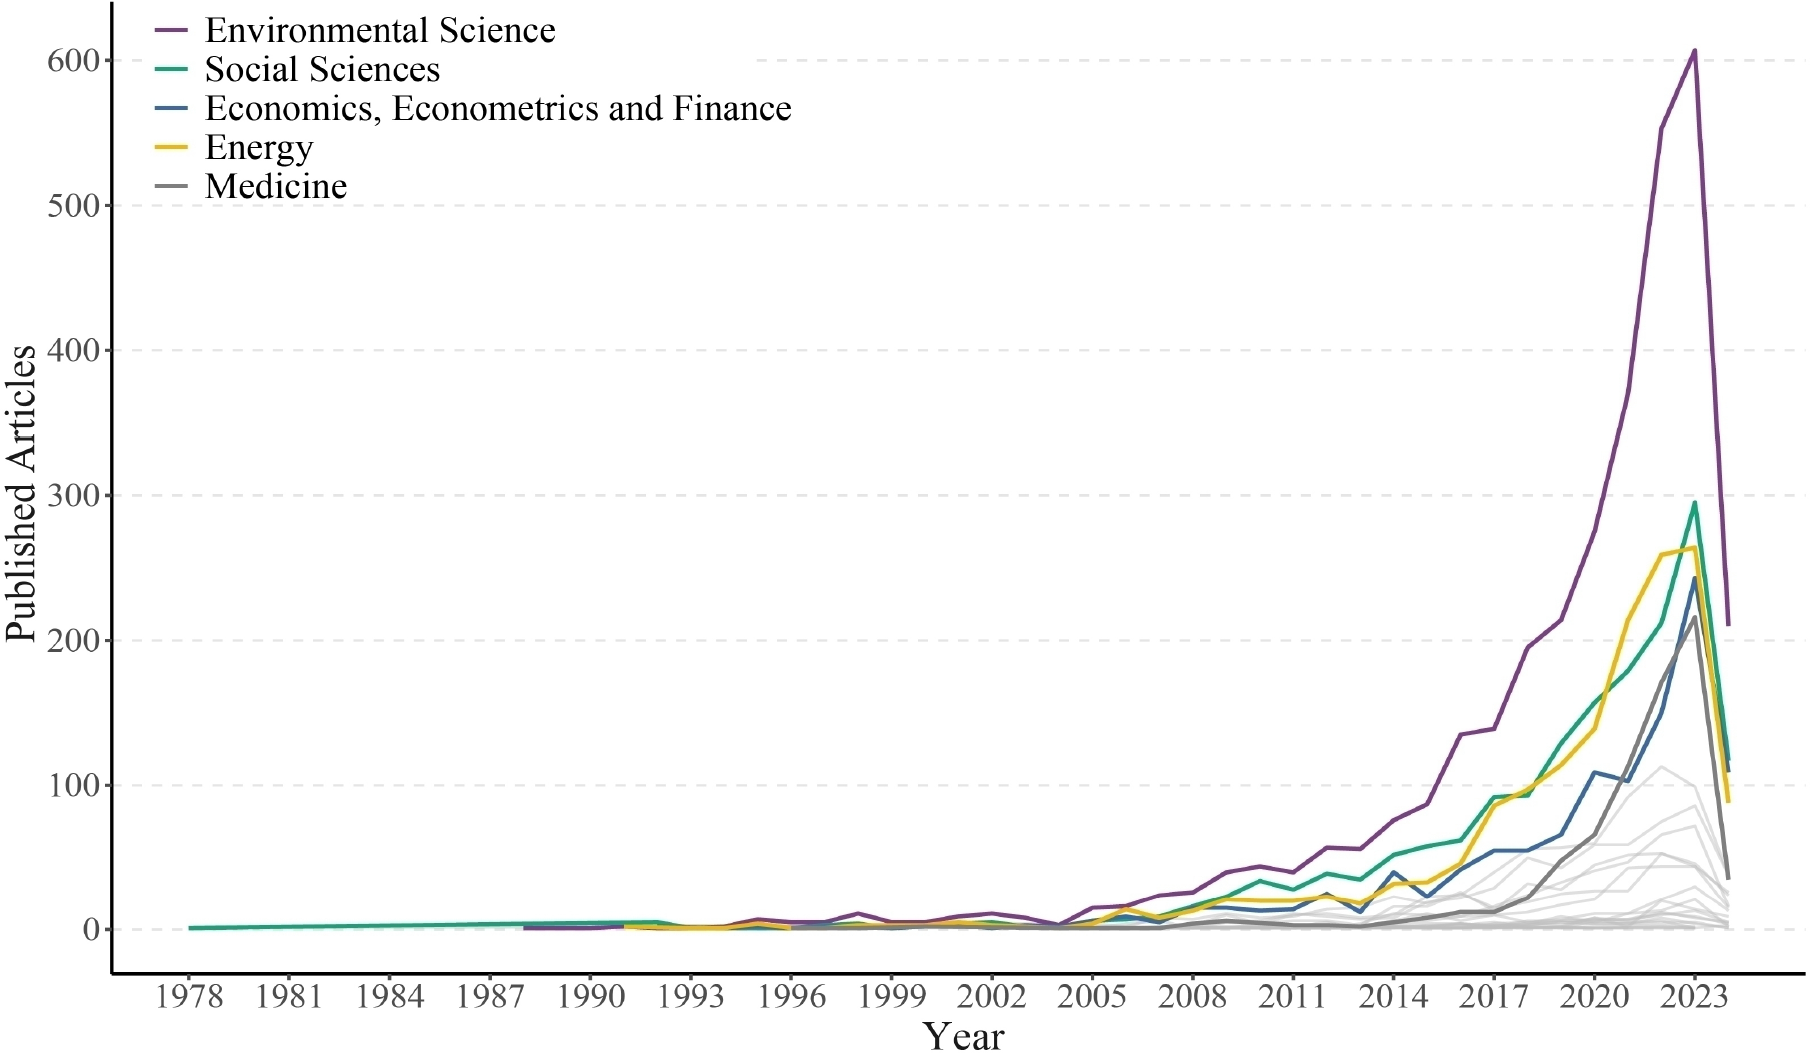
The most prominent fields in research related to the Economic Growth and Climate Change topic are Environmental Science, Social Sciences, Economics (as well as its sub-disciplines, Econometrics and Finance), Energy and Medicine. Figure 6 presents the scientific production progress in these main fields. The Environmental Science field has shown significant growth from 2016 onwards; it reached 607 publications in 2023, which represents increase by 295 publications. The Economics, Econometrics and Finance fields have shown progressive growth with sharp increase after 2019. This number shows notable surges in 2020 and 2023, which suggests growing interest in the herein assessed topic. The Energy field tended to get more intense, with remarkable rise since 2017, whereas Medicine experienced growth after 2018, mainly during the COVID-19 pandemic, between 2020 and 2021, with 66 and 113 publications, respectively.

Scientific production progress in the main research fields. Source: Elaborated by the authors based on data extracted from Scopus and WoS (2024).
The comparison among scientific fields showed that the Environmental Science field led the total number of publications (3.256), and it was followed by the Energy (1.543), Social Sciences (1.672), Economics, Econometrics and Finance (1.131), and Medicine (732) fields.
Most research fields showed publication peaks in recent years, and this finding points out increase in scientific production and growing attention to issues such as sustainability, energy challenges, and the formulation of environmental policies in compliance with the global economic growth. Nordhaus (2019) argued that environmental challenges are examples of issues requiring interdisciplinary understanding. Thus, social, and political sciences are essential for the development of effective solutions, despite their foundation on the natural sciences. These challenges concern a wide range of disciplines, including atmospheric chemistry, climate science, ecology, economics, political science, game theory, and international law.
THE MOST INflUENTIAL INSTITUTIONS AND AUTHORS IN THE SCIENTIFIC LITERATURE
The bibliometric analysis focused on the Economic Growth/Climate Change intersection involved the total of 4.463 institutions. The biblioshiny tool was used to aggregate and group data based on authors affiliated with each research institution in order to summarize the total number of citations received by the authors’ scientific productions. They were ranked based on the total number of citations from each authors’ articles to identify the ten most influential institutions. Other categories were also analyzed to identify trends such as country of origin and total number of published documents.
According to Table 2, Tsinghua University in China leads the ranking with 4.690 citations from 136 articles, in total. The Chinese Academy of Sciences ranks the second position with 4.385 citations across 178 articles, and this finding pinpoints high productivity and academic influence. On the other hand, Princeton University, in the United States, received 3.029 citations from a significantly smaller number of articles (18), and it highlights stronger publication impacts. The Beijing Institute of Technology, which is another Chinese institution, recorded 2.937 citations across 79 articles, and the University of London, in the United Kingdom, reached 2.873 citations from 42 articles. These data highlight the prevalence of Chinese institutions in academic productivity. This finding was proven by their straight focus on scientific studies related to economic growth and climate change. United States and the United Kingdom institutions also stand out in this ranking for showing remarkable presence in and impact on the global scientific landscape.
Most influential scientific institutions in terms total of received citations and published articles. Source: Elaborated by the authors based on data extracted from Scopus and WoS (2024).
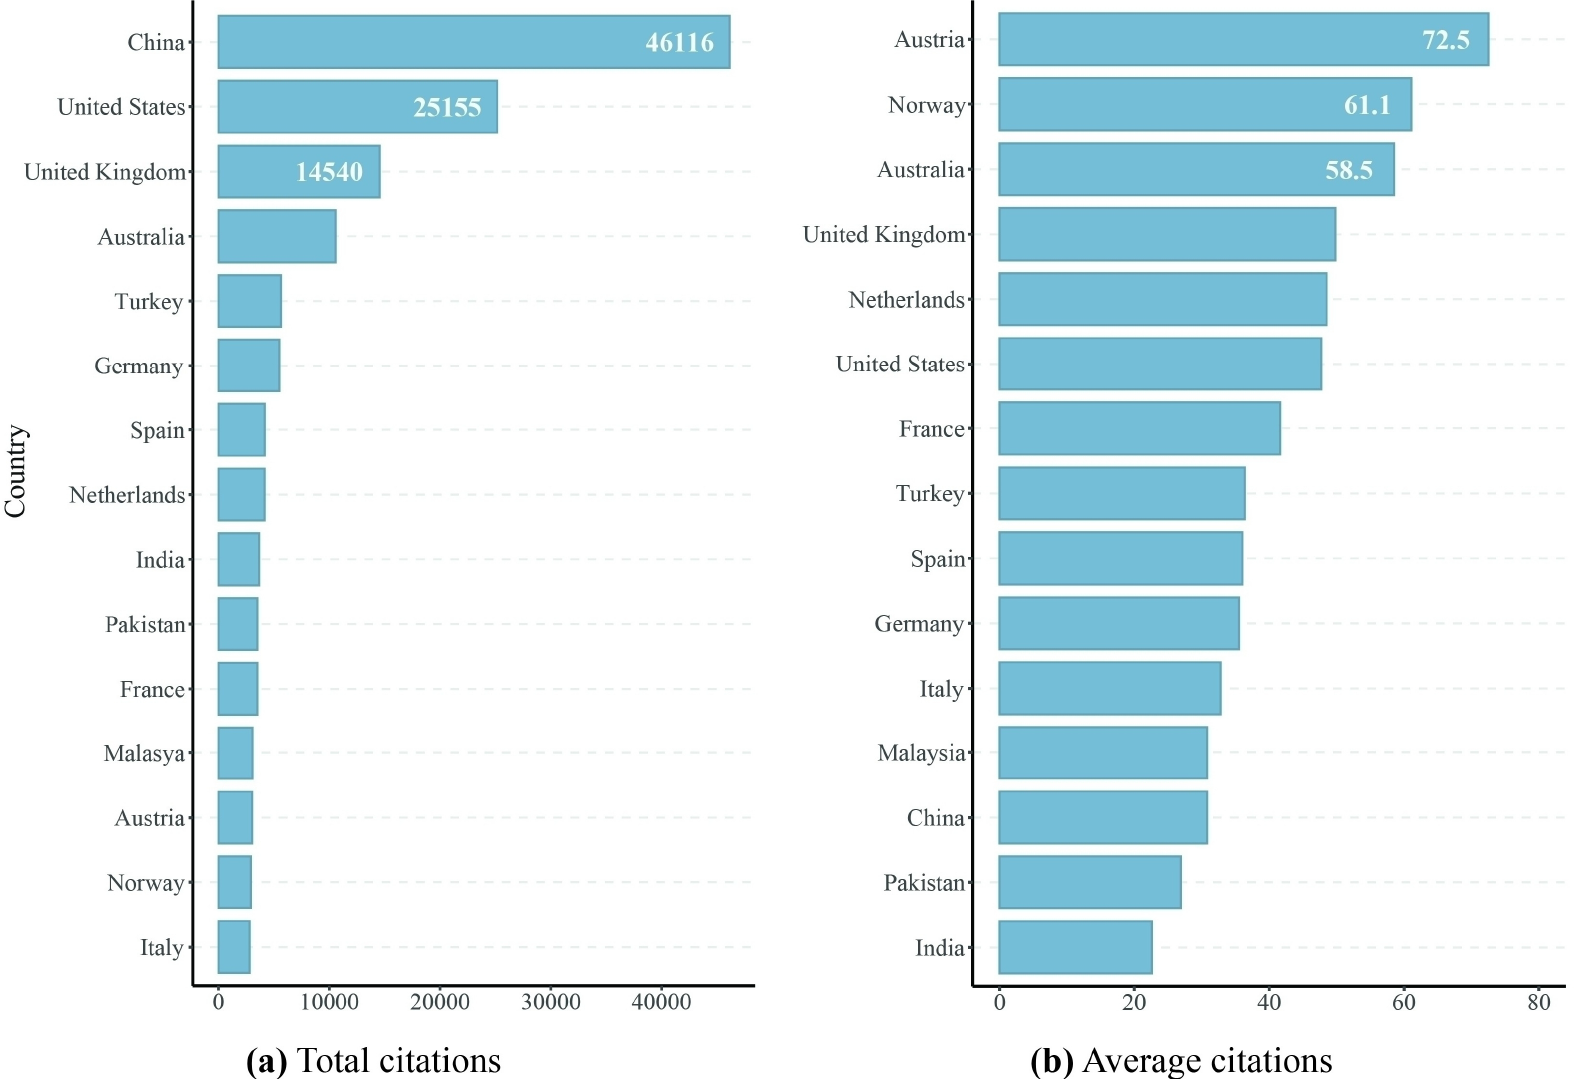
The fifteen most influential countries in total number and mean of citations from 1978 to 2024 are shown in Figure 7(7a and 7b). Figure 7a provides the total number of citations. China leads the ranking with 46.116 citations, and it is followed by the United States, with 25.155 citations. The United Kingdom recorded 14.540 citations and it was followed by Australia (10,580), Türkiye (5,639), Germany (5,503), Spain (4,181), among others. Although China leads the ranking of total citation volume, Austria (72.5), Norway (61.1) and Australia (58.5) stand out for their high mean number of citations per article (Figure 7b), which stresses the significant impact of their individual research contributions.
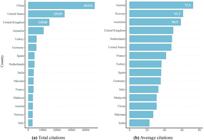
Fifteen most influential countries in total and mean number of citations. Source: Elaborated by the authors based on data extracted from Scopus and WoS (2024).
The H index is calculated based on the scientific productivity performance of the main authors (Table 3). Wang S. leads the ranking with index equals 26; he accumulated 3.720 citations from 39 articles since his first publications in 2014. Bekun F. followed Wang with index equals 24; he received 2.104 citations from 40 articles since 2019. Adebayo T., whose first publication dates back to 2020, holds index equals 22 with 1.726 citations from 31 articles. Ahmad M. (1,429), Li X. (1,227), Li Z. (1,375), Raihan A. (1,165), Wang Y. (1,547) and Zhang Y. (1,925) stand out with H index equals 20, and it proves the significant impact and consistency of their research. The initial publication year diversity points towards the presence of both veteran researchers and emerging authors, which contributes to this field’s robustness and dynamism.
Ten most influential authors: academic productivity index. Source: Elaborated by the authors based on data extracted from Scopus and WoS (2024). NOTE: Authors’ names are abbreviated as presented in the dataset.
The ten most influential documents in this study field were identified to help better visualizing the influence of scientific productions that link economic growth to climate change. These documents’ impact is assessed through metrics calculated in the Biblioshiny tool, particularly the Local Citation Score (LCS), which refers to the number of times an article is cited by other articles within a specific dataset; and the Global Citation Score (GCS), which provides the total number of citations of a document. Local influence was calculated as the ratio of local citations to global citations based on these two metrics.
Table 4 shows that the ten articles accounting for the highest local citation scores were published in different journals, including those focused on economics, such as the American Economic Journal: Macroeconomics and the Journal of Public Economics, as well as in interdisciplinary journals like the Science of The Total Environment and the Journal of Cleaner Production. The article by Dell, Jones and Olken (2012) has GCS = 881, and this finding indicates high global impact. On the other hand, the study by Su and Moaniba (2017) published in the journal Technological Forecasting and Social Change recorded LCS = 35, but GCS = 219. These numbers suggest its greater relevance to the economic studies field given its higher local influence: 15.98% rate.
Main documents on local citation and study field relevance. Source: Elaborated by the authors based on data extracted from Scopus and WoS (2024). Legend: 1- LCS: Refers to the Local Citation Score. 2- GCS: Represents the Global Citation Score.
There was significant variation in the local influence rate among documents. Journals addressing the Economics and Accounting Sciences fields had prevailed. Notable examples among scientific productions in economics journals include the American Economic Journal: Macroeconomics (11.12%), Energy Economics (10.68% and 9.09%) and the Journal of Public Economics (4.77%). Articles addressing accounting-related topics are found in the Technological Forecasting and Social Change (15.98%) and in the Journal of Cleaner Production (7.66%).
KEYWORDS TRENDS AND FREQUENCIES
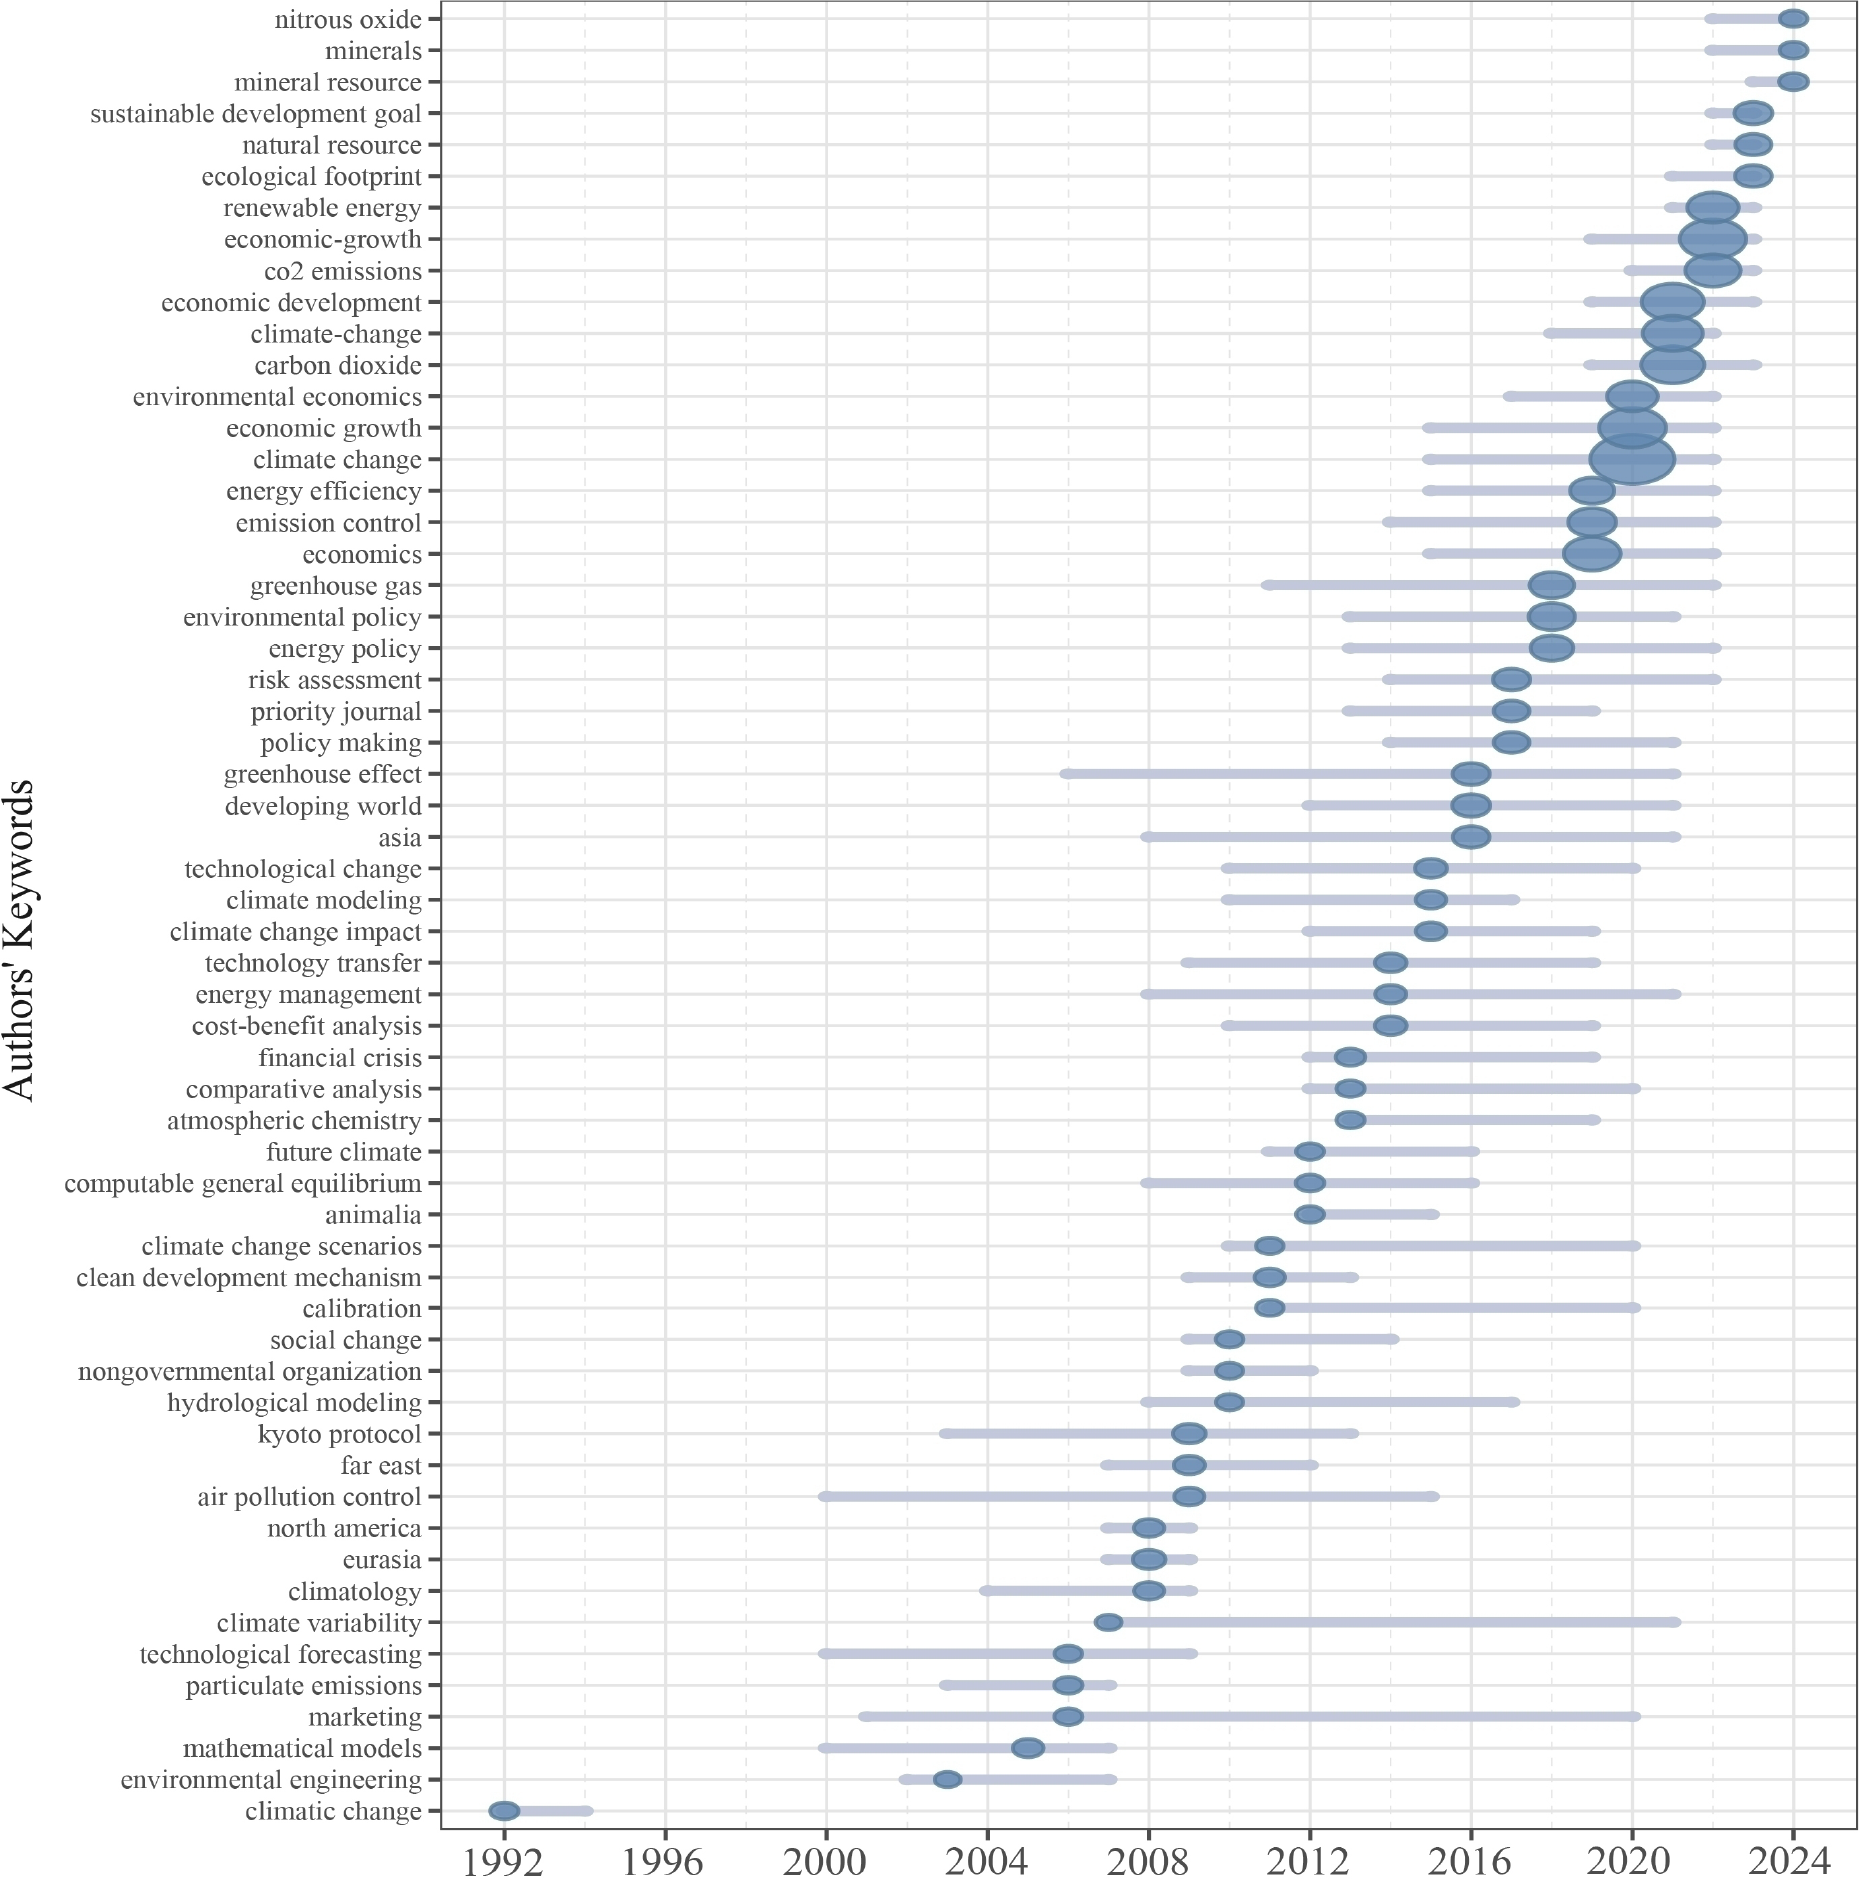
Only 58 keywords used by authors were identified within an understandable dataset comprising 5.919 published articles on economic growth and climate change in the bibliometric analysis. Figure 8 presents these words’ temporal trend. The X-axis corresponds to the publication years and the Y-axis to the keywords. The graphical representation consists of horizontal lines connecting the first quartile to highlight the beginning and the third quartile. It was done to mark the end of the line with a blue point to represent the median along this trace. The filled points indicate the frequency of scientific production occurrences.
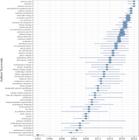
Keywords Temporal trends in scientific productions (19922024). Source: Elaborated by the authors based on data extracted from Scopus and WoS (2024).
The term "climate change" was the most frequent regarding keywords’ popularity and progress in this study field. There were 2.679 articles, mainly between 2015 and 2022. They gained broader popularity in 2020, in addition to a brief presence between 1992 and 1994. The term "economic growth" gained popularity in 2020 and appeared in 1.345 articles. This finding discloses the connection between economic growth and climate policies. Keywords such as "economic development" and "carbon dioxide" stood out from 2019 to 2023, with 1.094 and 1.049 scientific publications, respectively - both gained prominence in 2021. Other relevant keywords were "co2 emissions" (2022), with 682 publications from 2020 to 2023, and "environmental economics" (2020), with 502 articles between 2017 and 2022.Keywords "renewable energy" (2022) gained relevance from 2021 to 2023, with 515 articles in other topics, and "sustainable development goal" stood out in 2023 with 119 scientific publications. Keywords "mineral resource", "minerals", and "nitrous oxide" were notable in 2024; they showed up in 12, 8, and 7 scientific productions, respectively.
The growing prevalence of terms such as "renewable energy" and "sustainable development goal" emphasizes the shift towards a more long lasting and sustainable economic development paradigm. Other keywords have gained relevance over time, such as "environmental policy", "emission control", "climate change", "economic growth", "economic development", and "carbon dioxide". The reflect the scientific community’s interest in economic analyses focused on environmental effects. CO2 relevance as the main greenhouse gas and the efforts to reduce its emissions are essential aspects of economic growth and climate change research.
Despite the large amount of research on carbon emissions and natural resources, few studies explore how countries’ administrative capacity influences the effectiveness of climate policies (Li et al., 2021; Zhou; Sawyer; Safi, 2021; Safi; Chen; Zheng, 2022). Chen et al. (2023) devoted increasing attention to the association among income deriving from natural resources, the effectiveness of governmental institutions and climate change, which has drawn interest from both researchers and policymakers due to its significant impact on environmental pollution.
Azam et al. (2022) observed that many countries have invested substantial resources in developing nuclear and renewable energy to reduce their dependence on external energy sources. (2013), Long et al. (2015) and Shahbaz et al. (2015) agreed that these sources do not emit carbon dioxide during generation; therefore, they are taken as important solutions to fight global warming and to achieve energy security.
CONCLUSION
The aim of the current study was to assess scientific research progress and development based on the economic growth/climate change intersection from 1978 to 2024 through a bibliometric analysis. Accordingly, the RStudio software (and its tools) and the R programming language were used, mainly the biblioshiny application developed within the Bibliometrix package, which enabled data stratification, manipulation, analysis, and mining. A network map was plotted based on connections among countries, articles’ temporal and spatial distributions, scientific production distributions per research field, analysis of keyword temporal trends, and productivity across journals, articles, authors, and institutions.
According to the results, publication distribution faced a growth trend over a 46-year span, mainly after 2005. China, the United States, the United Kingdom, Pakistan, and Türkiye stood out for their participation in this process and for showing the highest collaboration frequencies among the assessed countries. Therefore, Tsinghua University, Princeton University and the Chinese Academy of Sciences were the most influential institutions, whereas the most productive journals in the analyzed field included Environmental Science and Pollution Research, Journal of Cleaner Production and Energy Policy. Influential authors such as Wang S., Bekun F., and Adebayo T. also stood out, whereas the most relevant scientific productions belonged to Dell, Jones and Olken (2012), Nasir, Huynh and Tram (2019), and Destek and Sarkodie (2019).
Results have highlighted significant trends in research fields related to economic growth and climate change. The research has expanded to other fields such as Energy, Social Sciences, Economics (including its subdisciplines), and Medicine after the initial focus on Environmental Science. This expansion points towards increase in scientific publications on topics regarding the environment and the association between environmental policies and economic development over the years. Terms such as "renewable energy" and "sustainable development goal" have prevailed in keyword-use trends within scientific productions. This finding highlighted shifts in research priorities to renewable energies and sustainable development goals. This process stresses adjustments to new environmental realities and challenges.
It is appropriate to consider potential improvements for future studies since the aims of the present study were achieved. An in-depth exploration of the Web of Science is a suggested alternative because this platform provides broader variables than Scopus. Metadata on journal research fields, for example, are included in the Web of Science database, and it puts aside the need for consulting other sources for such information. This proposition could enhance the accuracy of future systematic literature reviews.
NOTES
-
1
Romer (2012) introduces economic growth as process increasing real income per capita andconsequent increase in the population’s living standard.
-
2
According to Nordhaus (2019), integrated assessment consists of approaches integrating theknowledge of two or more Domains in a single structure.
-
3
For more information, see the category Journal Rankings in Scimago and Scopus (2024).
DATA AVAILABILITY
Not applicable.
REFERENCES
-
AL-MULALI, U. et al. Examining the bi-directional long-run relationship between renewable energy consumption and GDP growth. Renewable and Sustainable Energy Reviews, v. 22, p. 209-222, 2013. ISSN 1364-0321. Available at: https://www.sciencedirect.com/science/article/pii/S1364032113000932
» https://www.sciencedirect.com/science/article/pii/S1364032113000932 - ALI, M. China-pakistan economic corridor: prospects and challenges. Contemporary South Asia, Taylor & Francis, v. 28, n. 1, p. 100-112, 2020.
-
ARIA, M.; CUCCURULLO, C. Bibliometrix: An R-tool for comprehensive science mapping analysis. Journal of Informetrics, v. 11, n. 4, p. 959-975, 2017. ISSN 1751-1577. Available at: https://www.sciencedirect.com/science/article/pii/S1751157717300500
» https://www.sciencedirect.com/science/article/pii/S1751157717300500 -
AZAM, A. et al. Mitigating carbon emissions in China: The role of clean energy, technological innovation, and political-institutional quality. Frontiers in Environmental Science, v. 10, 2022. ISSN 2296-665X. Available at: https://www.frontiersin.org/articles/10.3389/fenvs.2022.814439
» https://www.frontiersin.org/articles/10.3389/fenvs.2022.814439 - CARTER, R. M. et al. The stern review: a dual critique. World Economics, v. 7, n. 4, p. 165-232, 2006.
-
CHEN, F. et al. Towards sustainable resource management: The role of governance, natural resource rent, and energy productivity. Resources Policy, v. 85, p. 104026, 2023. ISSN 0301-4207. Available at: https://www.sciencedirect.com/science/article/pii/S0301420723007377
» https://www.sciencedirect.com/science/article/pii/S0301420723007377 -
DELL, M.; JONES, B. F.; OLKEN, B. A. Temperature shocks and economic growth: Evidence from the last half-century. American Economic Journal: Macroeconomics, v. 4, n. 3, p. 66-95, 2012. Available at: https://www.aeaweb.org/articles?id=10.1257/mac.4.3.66
» https://www.aeaweb.org/articles?id=10.1257/mac.4.3.66 - DELL, M.; JONES, B. F.; OLKEN, B. A. What do we learn from the weather? the new climate-economy literature. Journal of Economic Literature, v. 52, n. 3, p. 740-798, 2014.
-
DESTEK, M. A.; SARKODIE, S. A. Investigation of environmental Kuznets curve for ecological footprint: The role of energy and financial development. Science of The Total Environment, v. 650, p. 2483-2489, 2019. ISSN 0048-9697. Available at: https://www.sciencedirect.com/science/article/pii/S0048969718338907 .
» https://www.sciencedirect.com/science/article/pii/S0048969718338907 -
DOLGE, K.; BLUMBERGA, D. Economic growth in contrast to GHG emission reduction measures in green deal context. Ecological Indicators, v. 130, p. 108153, 2021. ISSN 1470-160X. Available at: https://www.sciencedirect.com/science/article/pii/S1470160X21008189
» https://www.sciencedirect.com/science/article/pii/S1470160X21008189 -
DOLGE, K.; BLUMBERGA, D. Economic growth in contrast to GHG emission reduction me-asures in green deal context. Scopus, 2021. Available at: https://www-scopus.ez17.periodicos.capes.gov.br/record/display.uri?eid=2-s2.0-85190364773&origin=resultslist&sort=plf-f&src=s&sid=e9173b6930cf8e831e2a7dae140f4e1a&sot=b&sdt=b&s=%28TITLE-ABS-KEY%28%22Climate+ change%22%29+AND+TITLE-ABS-KEY%28%22Economic+Growth%22%29%29&sl=70& sessionSearchId=e9173b6930cf8e831e2a7dae140f4e1a .
» https://www-scopus.ez17.periodicos.capes.gov.br/record/display.uri?eid=2-s2.0-85190364773&origin=resultslist&sort=plf-f&src=s&sid=e9173b6930cf8e831e2a7dae140f4e1a&sot=b&sdt=b&s=%28TITLE-ABS-KEY%28%22Climate+ change%22%29+AND+TITLE-ABS-KEY%28%22Economic+Growth%22%29%29&sl=70& sessionSearchId=e9173b6930cf8e831e2a7dae140f4e1a -
DONG, K. et al. CO2 emissions, economic and population growth, and renewable energy: Empirical evidence across regions. Energy Economics, v. 75, p. 180-192, 2018. ISSN 0140-9883. Available at: https://www.sciencedirect.com/science/article/pii/S0140988318303256
» https://www.sciencedirect.com/science/article/pii/S0140988318303256 -
FERNÁNDEZ, F.; LÓPEZ, F.; BLANCO, O. Innovation for sustainability: The impact of R&D spending on CO2 emissions. Journal of Cleaner Production, v. 172, p. 3459-3467, 2018. ISSN 0959-6526. Available at: https://www.sciencedirect.com/science/article/pii/S0959652617326513
» https://www.sciencedirect.com/science/article/pii/S0959652617326513 -
GOULDER, L. H.; PIZER, W. A. The Economics of Climate Change. [S.l.], 2006. (Working Paper Series, 11923). Available at: http://www.nber.org/papers/w11923
» http://www.nber.org/papers/w11923 -
Government of the Peoples Republic of China; Government of the Islamic Republic of Pakistan. Action Plan to Foster an Even Closer China-Pakistan Community with a Shared Future in the New Era (2025-2029). 2025. Official Document. Bilateral Action Plan signed during the visit of Prime Minister Muhammad Shehbaz Sharif to China (August 30 - September 4, 2025). Available at: https://cpec.gov.pk/brain/public/uploads/documents/ActionPlan2025-2029.pdf
» https://cpec.gov.pk/brain/public/uploads/documents/ActionPlan2025-2029.pdf -
HASHMI, R.; ALAM, K. Dynamic relationship among environmental regulation, innovation, CO2 emissions, population, and economic growth in OECD countries: A panel investigation. Journal of Cleaner Production, v. 231, p. 1100-1109, 2019. ISSN 0959-6526. Available at: https://www.sciencedirect.com/science/article/pii/S095965261931861X
» https://www.sciencedirect.com/science/article/pii/S095965261931861X -
HICKEL, J.; KALLIS, G. Is green growth possible? New Political Economy, 2019. Available at: https://doi.org/10.1080/13563467.2019.1598964
» https://doi.org/10.1080/13563467.2019.1598964 -
HIRSCH, J. E. An index to quantify an individual’s scientific research output. Proceedings of the National Academy of Sciences, v. 102, n. 46, p. 16569-16572, 2005. Available at: https://www.pnas.org/doi/abs/10.1073/pnas.0507655102
» https://www.pnas.org/doi/abs/10.1073/pnas.0507655102 -
HOLTZ-EAKIN, D.; SELDEN, T. M. Stoking the fires? CO2 emissions and economic growth. Journal of Public Economics, v. 57, n. 1, p. 85-101, 1995. ISSN 0047-2727. Available at: https://www.sciencedirect.com/science/article/pii/004727279401449X
» https://www.sciencedirect.com/science/article/pii/004727279401449X -
LI, Z. et al. Understanding the dynamics of resource curse in G7 countries: The role of natural resource rents and the three facets of financial development. Resources Policy, v. 73, p. 102141, 2021. ISSN 0301-4207. Available at: https://www.sciencedirect.com/science/article/pii/S0301420721001550
» https://www.sciencedirect.com/science/article/pii/S0301420721001550 -
LONG, X. et al. Nonrenewable energy, renewable energy, carbon dioxide emissions and economic growth in China from 1952 to 2012. Renewable and Sustainable Energy Reviews, v. 52, p. 680-688, 2015. ISSN 1364-0321. Available at: https://www.sciencedirect.com/science/article/pii/S1364032115008230 .
» https://www.sciencedirect.com/science/article/pii/S1364032115008230 -
MARLAND, G.; ROTTY, R. M. The question mark over coal: Pollution, politics, and CO2. Futures, v. 10, n. 1, p. 21-30, 1978. ISSN 0016-3287. Available at: https://www.sciencedirect.com/science/article/pii/0016328778901404
» https://www.sciencedirect.com/science/article/pii/0016328778901404 - MCKIBBIN, W. J.; WILCOXEN, P. J. The role of economics in climate change policy. Journal of economic perspectives, American Economic Association, v. 16, n. 2, p. 107-129, 2002.
- MENDELSOHN, R. O. A critique of the stern report. Regulation, HeinOnline, v. 29, p. 42, 2006.
-
NASIR, M. A.; HUYNH, T. L. D.; TRAM, H. T. X. Role of financial development, economic growth, and foreign direct investment in driving climate change: A case of emerging ASEAN. Journal of Environmental Management, v. 242, p. 131-141, 2019. ISSN 0301-4797. Available at: https://www.sciencedirect.com/science/article/pii/S0301479719304256
» https://www.sciencedirect.com/science/article/pii/S0301479719304256 -
NEPAL, R.; MUSIBAU, H. O.; JAMASB, T. Energy consumption as an indicator of energy efficiency and emissions in the european union: A GMM based quantile regression approach. Energy Policy, v. 158, p. 112572, 2021. ISSN 0301-4215. Available at: https://www.sciencedirect.com/science/article/pii/S0301421521004420
» https://www.sciencedirect.com/science/article/pii/S0301421521004420 -
NORDHAUS, W. The ’DICE’ Model: Background and Structure of a Dynamic Integrated ClimateEconomy Model of the Economics of Global Warming. [S.l.], 1992. Available at: https://EconPapers.repec.org/RePEc:cwl:cwldpp:1009
» https://EconPapers.repec.org/RePEc:cwl:cwldpp:1009 -
NORDHAUS, W. The stern review on the economic of climate change. URL: http://nordhaus.econ.yale.edu/SternReviewD2.pdf , 2006.
» http://nordhaus.econ.yale.edu/SternReviewD2.pdf -
NORDHAUS, W. Chapter 16 - integrated economic and climate modeling. In: DIXON, P. B.; JORGEN- SON, D. W. (Ed.). Handbook of Computable General Equilibrium Modeling SET, Vols. 1A and 1B. Elsevier, 2013, (Handbook of Computable General Equilibrium Modeling, v. 1). p. 1069-1131. Available at: https://www.sciencedirect.com/science/article/pii/B978044459568300016X
» https://www.sciencedirect.com/science/article/pii/B978044459568300016X -
NORDHAUS, W. Climate change: The ultimate challenge for economics. American Economic Review, v. 109, n. 6, p. 1991-2014, 2019. Available at: https://www.aeaweb.org/articles?id=10.1257/aer.109.6.1991 .
» https://www.aeaweb.org/articles?id=10.1257/aer.109.6.1991 - PöRTNER, H.-O. et al. Overcoming the coupled climate and biodiversity crises and their societal impacts. Science, v. 380, n. 6642, p. eabl4881, 2023.
-
ROMEIRO, A. R. Desenvolvimento sustentável: uma perspectiva econômico-ecológica. Estudos Avançados, Instituto de Estudos Avançados da Universidade de São Paulo, v. 26, n. 74, p. 6592, 2012. ISSN 0103-4014. Available at: https://doi.org/10.1590/S0103-40142012000100006
» https://doi.org/10.1590/S0103-40142012000100006 - ROMER, D. Advanced Macroeconomics. 4th. ed. New York: McGraw-Hill Education, 2012. ISBN 978-0-07-351137-5.
- ROMER, P. M. Endogenous technological change. Journal of Political Economy, v. 98, n. 5, Part 2, p. S71-S102, 1989.
-
SAFI, A.; CHEN, Y.; ZHENG, L. The impact of energy productivity and eco-innovation on sustainable environment in emerging seven (E-7) countries: Does institutional quality matter? Frontiers in Public Health, v. 10, 2022. ISSN 2296-2565. Available at: https://www.frontiersin.org/journals/public-health/articles/10.3389/fpubh.2022.878243
» https://www.frontiersin.org/journals/public-health/articles/10.3389/fpubh.2022.878243 -
SCIMAGO; SCOPUS. Scimago Journal and Country Rank. 2024. Accessed on: May 12, 2024. Available at : https://www.scimagojr.com/journalrank.php
» https://www.scimagojr.com/journalrank.php -
SHAHBAZ, M. et al. Does renewable energy consumption add in economic growth? an application of auto-regressive distributed lag model in Pakistan. Renewable and Sustainable Energy Reviews, v. 44, p. 576-585, 2015. ISSN 1364-0321. Available at: https://www.sciencedirect.com/science/article/pii/S1364032115000271
» https://www.sciencedirect.com/science/article/pii/S1364032115000271 -
SHAHBAZ, M. et al. Trade opennesscarbon emissions nexus: The importance of turning points of trade openness for country panels. Energy Economics, v. 61, p. 221-232, 2017. ISSN 0140-9883. Available at: https://www.sciencedirect.com/science/article/pii/S0140988316303292
» https://www.sciencedirect.com/science/article/pii/S0140988316303292 -
SU, H.-N.; MOANIBA, I. M. Does innovation respond to climate change? empirical evidence from patents and greenhouse gas emissions. Technological Forecasting and Social Change, v. 122, p. 49-62, 2017. ISSN 0040-1625. Available at: https://www.sciencedirect.com/science/article/pii/S0040162516302542 .
» https://www.sciencedirect.com/science/article/pii/S0040162516302542 -
WANG, S. et al. The relationship between economic growth, energy consumption, and CO2 emissions: Empirical evidence from China. Science of The Total Environment, v. 542, p. 360-371, 2016. ISSN 0048-9697. Available at: https://www.sciencedirect.com/science/article/pii/S0048969715308433
» https://www.sciencedirect.com/science/article/pii/S0048969715308433 -
YOO, C. et al. Unequal impacts of urban industrial land expansion on economic growth and carbon dioxide emissions. Communications Earth & Environment, v. 5, n. 1, p. 203, 2024. ISSN 2662-4435. Available at: https://doi.org/10.1038/s43247-024-01375-x
» https://doi.org/10.1038/s43247-024-01375-x -
ZHOU, J.; SAWYER, L.; SAFI, A. Institutional pressure, and green product success: The role of green transformational leadership, green innovation, and green brand image. Frontiers in Psychology, v. 12, 2021. ISSN 1664-1078. Available at: https://www.frontiersin.org/journals/psychology/articles/10.3389/fpsyg.2021.704855 .
» https://www.frontiersin.org/journals/psychology/articles/10.3389/fpsyg.2021.704855
Edited by
-
Editors in Charge
Alexandra Maria OliveiraAlexandre Queiroz Pereira Eduardo Von Dentz