 Reframing vector control: land use and climate shape malaria risk in Amazonian communities
Abstract
BACKGROUND Malaria remains a major public health challenge in the Brazilian Amazon, where ecological heterogeneity and socio-economic vulnerability hinder the effectiveness of vector elimination. The primary vector, Nyssorhynchus darlingi, shows substantial spatiotemporal variation influenced by land-use changes and local microclimates.
OBJECTIVES Investigate how land cover and microclimatic factors affect Ny. darlingi human biting rate (HBR) across different Amazonian ecoregions.
METHODS HBR was measured through human landing catches at 70 sites in four ecoregions, with simultaneous temperature and humidity recordings. Landscape composition was quantified within 100-, 250-, and 500-m buffers. Data were analyzed using linear regressions, mixed-effects models, and principal component analysis.
FINDINGS We recorded 14,689 mosquito bites across 384 events. HBR was highest in areas with intermediate forest degradation and was positively associated with temperature and negatively with humidity. Floodable vegetation was the strongest land cover predictor, especially at the 500-m scale. Intrazonal variation exceeded interzonal differences.
MAIN CONCLUSIONS Local environmental conditions, particularly floodable vegetation near human settlements, strongly influence Ny. darlingi activity. Vector elimination in the Amazon should adopt climate-sensitive, spatially targeted strategies informed by land cover and microclimate data.
Key words:
Nyssorhynchus darlingi
; malaria/prevention & control; vector behavior; human biting rate; microclimate; land cover; Amazon ecoregions
INTRODUTION
Malaria remains a major threat to public health, particularly in tropical and subtropical regions worldwide. In 2023, there were an estimated 263 million cases globally, an increase of approximately 11 million cases compared with 2022. The estimated number of deaths was 597,000, similar to the number reported in 2022.1 In 2023, Brazil, the Bolivarian Republic of Venezuela, and Colombia combined accounted for 77% of all malaria cases in the Americas. That year, Brazil alone reported approximately 140,000 cases, representing a significant share of the roughly 500,000 cases registered across the region.1 In the Amazon basin, illegal gold mining, deforestation, and changes to the tropical forest landscape, particularly in remote areas with limited access to health care, malaria diagnosis, and treatment, continue to sustain malaria transmission.1 In Brazil, malaria transmission is largely confined to the Amazon. In other regions of the country, where the number of reported infections is low, approximately 80% of the cases originate from Amazonian areas or from sub-Saharan Africa.2,3 From 2011 to 2020, a total of 6,188 malaria cases were reported, of which 15% were autochthonous, 78.9% were imported, and 4.5% were classified as indeterminate. Among all cases, 67.5% were associated with Plasmodium vivax, while Plasmodium falciparum or mixed-species infections accounted for 31.5%.4
Climate change and deforestation have significantly modified mosquito community composition and the dominance of Nyssorhynchus darlingi (formerly Anopheles darlingi) across the Amazon River basin.5 In particular, forest loss and land-use change increase the availability of sunlit, human-made breeding sites (such as fish ponds, road ditches, and flooded pastures), while simultaneously reducing shaded natural habitats, thereby favoring Ny. darlingi proliferation.6 These processes also drive measurable alterations in local microclimatic conditions. Reduced canopy cover is associated with higher temperatures and lower humidity, and can indirectly influence local-to-regional precipitation patterns by modifying surface energy balance and convection, which further enhance vector survival and biting activity.7 In addition, a substantial burden of asymptomatic and frequently subpatent malaria infections persists in deforested Amazonian communities, providing a long-lived human reservoir that maintains transmission chains even when symptomatic cases decline. Within the frontier malaria framework, regions undergoing rapid deforestation and settlement, coupled with human mobility and limited access to timely diagnosis and care, generate malaria hotspots sustained by ecological disruption and undetected human reservoirs; transmission is driven by human settlement dynamics and limited public health infrastructure.8 Additionally, human mobility across these altered landscapes contributes to the persistence and spread of malaria in the Brazilian Amazon.9,10,11 These interconnected factors underscore the need for region-specific surveillance and vector elimination strategies that account for environmental changes and human mobility patterns.12
The human biting rate (HBR) is an entomological index that is useful for estimating human-mosquito vector interactions. Several studies have demonstrated that the HBR of Ny. darlingi is influenced by temperature, humidity, the percentage of forest cover, and forest fragmentation.13,14,15,16,17 In contrast, the effects of key HBR-modulating factors in relation to the unique ecological, demographic, and microclimatic characteristics of remote, malaria-affected settlements within the Brazilian Amazon is still not well understood. It is known that in Iquitos, the Peruvian Amazon, Ny. darlingi biting rates were over 278 times higher in deforested areas than in mostly forested areas after controlling for human presence.18 In rural settlements in the Brazilian Amazon, forest cover and land-use changes are associated with modifications in the dynamics of malaria transmission,19 which are linked to modifications in the mosquito community and increases in both anopheline larval habitats and human exposure to mosquito bites.5,16,17 In those areas, the highest rate of Plasmodium-infected mosquitoes was observed between midnight and 3 h a.m., with Nyssorhynchus rangeli, Nyssorhynchus benarrochi B, Nyssorhynchus konderi B, and Ny. darlingi as vectors in distinct landscapes.16
To examine and report the effects of environmental and climate factors influencing the human blood-feeding behavior of Ny. darlingi across four distinct ecological zones in the Amazon Forest, an in-depth statistical analysis of the spatial and temporal dynamics of HBR was conducted. The present study focused on data collected in five Amazonian municipalities in Brazil. Malaria was continuous, either high or moderate in the localities sampled by anopheline mosquitoes, environmental and climate data. The aim of this investigation was to demonstrate the differential effects of key factors influencing the HBR of Ny. darlingi in human settlements across four distinct ecological zones of the Amazon Rainforest. In addition, the relationships among temperature, humidity, and forest cover changes were statistically analyzed. This study is expected to disentangle regional patterns of mosquito HBR and demonstrate the need for improvements in data collection and analysis to support efforts for malaria elimination in the Amazon basin.
MATERIALS AND METHODS
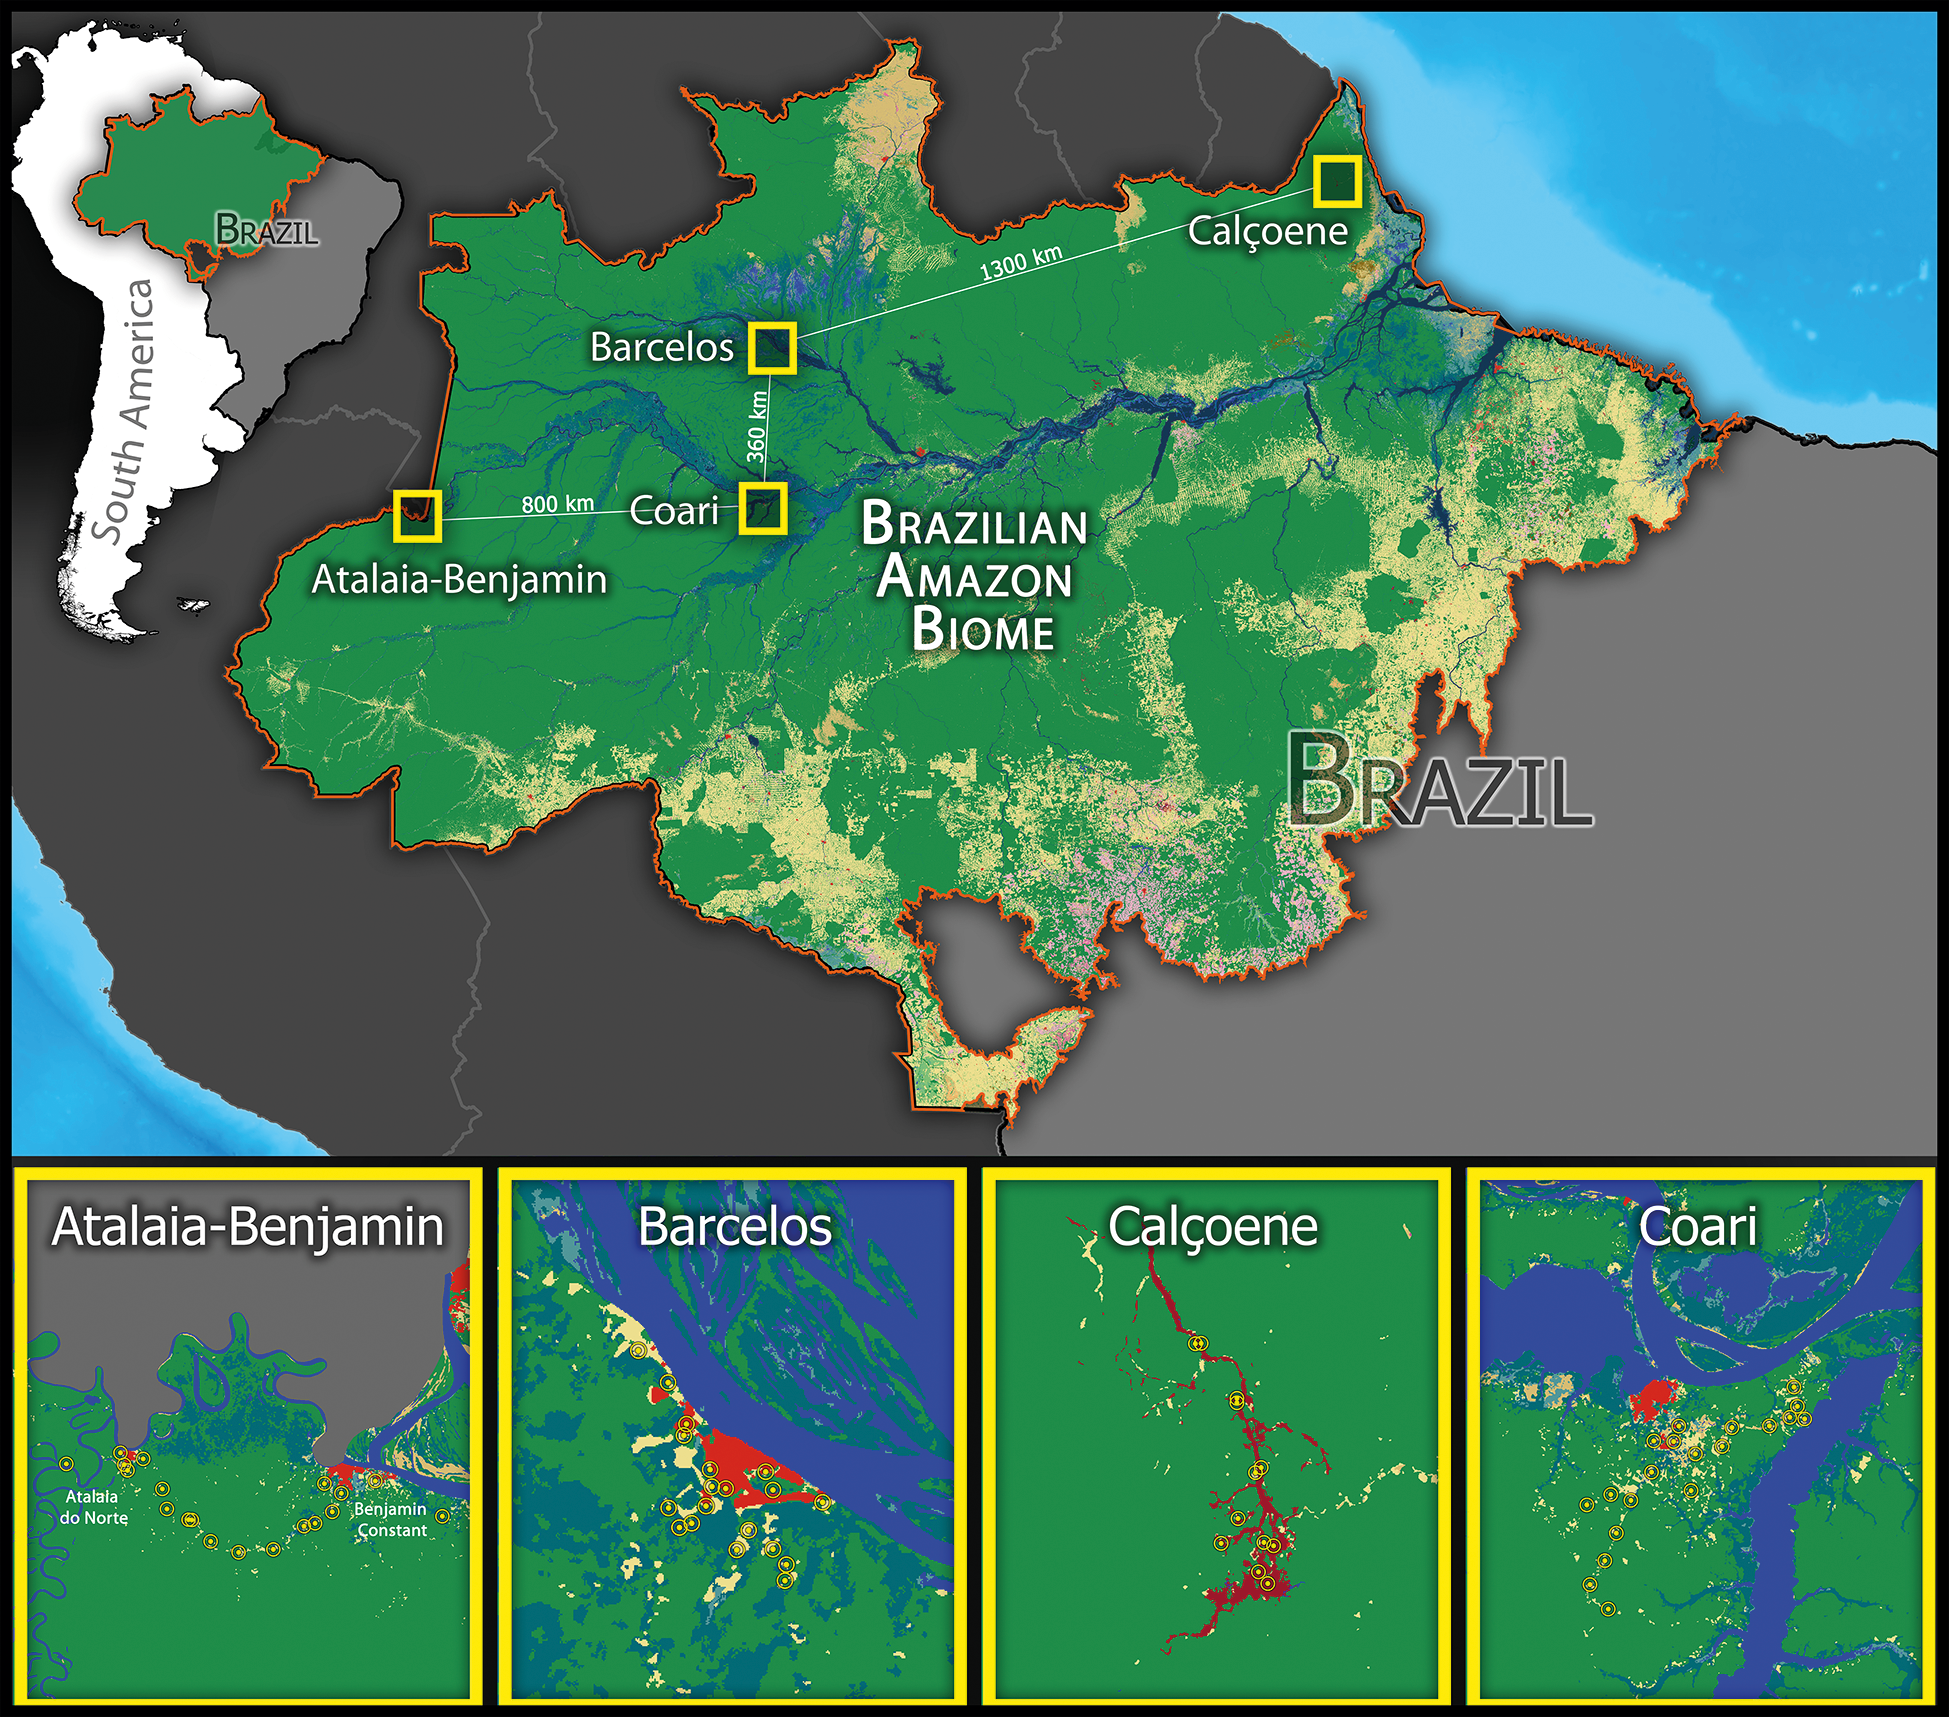
Study area - The investigation was conducted at 70 sampling sites distributed across four distinct ecological zones of the Amazon Rainforest (Fig. 1), defined into ecoregions by Olson and Dinerstein.20 (Table I). The western Amazon (e.g., Alto Solimões) features fertile Andean-derived soils, high above-ground biomass, and extensive evergreen rainforest with relatively lower structural degradation. The central Amazon, characterized by dynamic igapó and várzea floodplains interspersed with terra-firme forest, is increasingly impacted by fragmentation and land-use change near urban centers. The eastern Amazon (e.g., Amapá) is distinguished by seasonal rainfall regimes, forest-savanna ecotones, and higher deforestation rates tied to agricultural expansion and infrastructure development. This ecological heterogeneity translates into distinct microclimatic environments, land cover types, and anthropogenic pressures, all of which modulate Ny. darlingi host-seeking behavior in different ways.
These ecological zones were selected for their distinct environmental characteristics and high malaria burden. The maximum distance between the study sites is approximately 2,200 km (Atalaia do Norte - Benjamin Constant, Amazonas State to Calçoene, Amapá State), whereas the minimum distance is 360 km (Barcelos, middle Negro River to Coari, southern Solimões River, Amazonas State) (Fig. 1). These zones represent the main territorial subdivisions of the Amazon - western, central, and eastern Amazon — showcasing the region’s ecosystem heterogeneity extensive.
map of the Brazilian Amazon Biome highlighting the four ecological zones under study. Dark gray indicates South American countries, while light gray represents Brazilian states outside the Amazon biome. The biome boundary is outlined in orange. Internal colors depict land cover classes according to MapBiomas (2022)23 reclassified as follows: green areas represent forest formation class; bluish-green areas correspond to floodable vegetation class; red indicates urban areas, which, together with yellow-toned areas, comprise the human-changed class. Deep blue and light blue distinguish between continental and oceanic water bodies, respectively. Yellow squares denote the four study regions, with detailed insets for Atalaia-Benjamin, Barcelos, Calçoene, and Coari. Yellow circles mark the 70 sampling sites.
Human landing catch collection - Specific criteria and timeframes ensured consistent sampling of Ny. darlingi human blood-feeding behavior and specimen collection. The sampling locations were spaced at least 500 m apart, each with at least one inhabited dwelling within 100 m of a freshwater source (Fig. 2). Each sampling site was georeferenced using GPS and assigned to named zones according to their respective municipal boundaries.21 Human landing catch (HLC) collections were used to capture Ny. darlingi females in the peridomestic setting approximately 10 m from a dwelling and water edges, following the procedures described by Sallum et al.22 Collections were conducted from 18 h to midnight, yielding 6 h of sampling per site per day. Subsequent identification and storage of the samples were carried out in the laboratory. Each hour, female mosquitoes were euthanized in the field via ethyl acetate (C₄H₈O₂) vapors and stored in silica gel. The samples were separated by date, location, household, and hour of collection. Mosquitoes were morphologically identified to the species level by MAMS, labelled, and individually stored with silica gel at room temperature for subsequent analysis.

spatial design of human landing catch (HLC) sampling sites and surrounding land cover assessment criteria. Sampling points were placed at a minimum distance of 500 meters from one another to minimize spatial autocorrelation. Land cover composition was quantified within concentric buffer zones of 100 m, 250 m, and 500 m radii around each site, with the sampling centroid positioned between residential structures (in red) and water bodies (in blue). This diagram is illustrative and does not reflect actual study data.
Sampling and analysis databases - Data from the field sampling were organized into a database provided in Supplementary data (Table IA-B), with records structured both “per event” (temporal) and “per site” (spatial). Each unit represents the number of human bites recorded during a one-hour sampling period at a single geographic point, synchronized with hourly temperature and humidity measurements obtained via uniformly calibrated data loggers. Total biting rate (TBR) represents the TBR for each collection event per site. Each sampling involved one to four collectors per event. To standardize effort across events, the HBR was calculated as the average number of bites per collector per event (HBR = TBR per event / number of collectors). This method minimizes potential biases related to differences in collector attractiveness and/or effectiveness. For landscape analyses, land cover raster data from MapBiomas were used, providing national coverage at high resolution (30 m) and classifying the Brazilian landscapes into 21 categories (at level 2 classification of MapBiomas) for the year 2022.23 Only Amazonian land cover classes present within the sampling zones (buffers of 500-m radius per site) were retained. These buffer-specific land cover classes were cross-referenced with Google Earth24 imagery and reclassified into four new classes: forest formation, floodable vegetation, human-changed, and water bodies.
“Forest formation” class follows MapBiomas level-2 original class forest formation without reclassification. It comprises native, closed-canopy terra-firme forest, explicitly excluding areas subject to seasonal or permanent inundation. “Floodable vegetation” corresponds to the combined MapBiomas level-2 classes of floodable forest and wetlands, i.e., forested areas that are permanently or temporarily flooded (see details in MapBiomas collection 823). “Human-changed” class encompasses areas with evident human alteration or occupation, combining the MapBiomas level-2 classes pasture, mining, urban-area and grassland; within buffers, the grasslands polygons were visually identified via Google Earth as cropland, and were therefore treated as anthropogenic features. “Water bodies” class includes open-water surfaces without vegetation cover, represented by the MapBiomas level-2 class river-lake-ocean, and comprises both natural (rivers, lakes) and artificial sources (dams, fishponds). These clearly distinct land cover classes allow us to assess how each type modulates HBR alongside microclimatic covariates among zones, with variation potentially driven more by land cover features/habitat than by microclimate variation itself. We expect HBR to be lowest in closed-canopy forest formation, where both vector and human presence tend to be reduced; intermediate to high in floodable vegetation, given persistent larval habitats and human use of riparian zones; and highest in human-changed areas, where domestic water storage, livestock, and peri-urban settings increase human-vector contact. By contrast, HBR should be generally low near open water bodies exposed to sunlight, which limits oviposition and larval survival.
Landscape analyses were conducted by extracting MapBiomas land cover data via circular buffers with radii of 100, 250, and 500 m centered at each sampling site. Buffer creation and data extraction were performed using the raster and terra packages in R platform.25,26,27 This multiscale approach allows for the assessment of the spatial extent of landscape composition influences on environmental variables, potentially affecting the HBR, offering a comprehensive perspective on the ecological factors involved. MapBiomas was selected as the primary data source because of its broad geographic coverage, high spatial resolution (30 m), and detailed classification of vegetation and land cover types. This method provides a reliable proxy for assessing species-habitat associations across different ecological zones.28 To support spatial analyses, the initial event-level dataset [Supplementary data (Table IA)] was aggregated into a newly structured per-site database [Supplementary data (Table IB)]. In this per-site database, the original data, which contained multiple hourly sampling events per site, were aggregated by each sampling locality. For each site, maximum, minimum, and mean values of key variables (e.g., temperature, humidity) were calculated, resulting in a single summarized record per site. This restructuring enabled site-level comparisons across ecological zones and integration with land cover data.
Statistical analysis - To investigate and quantify the relationships between the environmental factors and HBR of Ny. darlingi, we followed a sequential analytic workflow:
(1) Data screening: The representativeness of the collected data was first evaluated by identifying potential HBR outliers across ecological zones via the interquartile range rule (IQR), and data distributions were assessed for normality. To reduce scale-related biases and ensure comparability with land cover metrics (%), HBR, temperature, and humidity were normalized using a min-max transformation [(x-xmin)/(xmax-xmin)], rescaling each variable to a 0-100 range [Supplementary data (Table II)]. This procedure allowed us to directly compare variables with different units of measurement and integrate them consistently with land cover metrics.
(2) Exploratory analyses: To characterize temporal dynamics, Pearson correlation coefficients and linear regressions were applied to examine event-level associations between HBR, sampling hour, and microclimatic variables (temperature and humidity). Differences in microclimatic conditions among zones were tested using one-way ANOVA and the nonparametric Kruskal-Wallis test [Supplementary data (Tables III-IV, Fig. 1)]. These event-level procedures were used for exploratory-descriptive purposes, given the repeated hourly measurements within sites. Formal inference was based on the site-level aggregated dataset and linear mixed-effects models with ecological zones as random intercepts [Supplementary data (Table V)].
(3) Multicollinearity testing and variable selection: To avoid redundancy, we tested thermal and hygrometric predictors (minimum, maximum, and average values) for multicollinearity using the variance inflation factor (VIF; usdm package29). Variables showing high collinearity were excluded, whereas those with low collinearity were retained as the most informative predictors for subsequent models [Supplementary data (Table VI)].
(4) Scale testing of land cover: Landscape composition was extracted from MapBiomas land cover data at three spatial scales (100, 250, and 500 m buffers). Multiple linear regressions combining the selected microclimatic variables with each land cover class were used to determine the buffer size with the greatest explanatory power [Supplementary data (Tables VII-VIII)].
(5) Modelling: Multiple regression analyses were conducted using the selected predictors to test alternative spatial scales of land cover variables and to evaluate the independent effects of microclimatic and land cover factors. The optimal spatial scale was determined based on statistical significance (p-values) and explanatory power (R²). Subsequently, a linear mixed-effects model (LMM) was employed as the final integrative framework, incorporating the selected predictors while accounting for the hierarchical sampling structure and interzonal variability. The LMM was used to estimate the effects of temperature, humidity, and land cover on HBR, with ecological zones included as random effects to account for the nested sampling design and spatial heterogeneity [Supplementary data (Table V)]. Degrees of freedom were estimated using Satterthwaite’s method. The model was specified as: HBR_ij = β0 + β1(TempMax_ij) + β2(HumidMin_ij) + β3(ForestFormation_ij) + β4(FloodableVegetation_ij) + u_j + ε_ij; where β0 is the intercept, β1–β4 are fixed-effect coefficients for the selected predictors, u_j is the random intercept for ecological zone j, and ε_ij is the residual error term.
(6) Dimensionality reduction: Principal component analysis (PCA) was applied to reduce variable dimensionality and highlight the most explanatory factors driving HBR across and within zones [Supplementary data (Fig. 2)]. All analyses and visualizations, except LMMs, were performed in STATISTICA.30 LMMs were implemented in R,27 and spatial analyses and mapping were carried out in ArcGIS Desktop 10.5 (Esri, Redlands, CA, USA31).
In Supplementary data (Table IX), a table was included to illustrate the sequential workflow of the analyses, summarizing how temporal, microclimatic, and land cover predictors were integrated across spatial scales and analytical steps. This visual summary helps clarify the logical progression from variable selection to the final hierarchical modelling framework.
Ethics - This study did not involve experiments on human subjects.
RESULTS
Human biting rate - Across four ecozones of the Amazon biome, 384 collection events were conducted over 47 days in 70 sites, totaling 14,689 recorded bites. Sampling effort varied among zones (Table II), ranging from 57 events in Calçoene to 121 in Coari. Barcelos presented the highest biting rate (TBR = 11,070; ≈ 75% of total). Temperature (t = 0.193, p = 0.8477; F = 0.037, p = 0.8484) and humidity (t = 0.104, p = 0.9176; F = 0.011, p = 0.9174) did not differ significantly between Atalaia do Norte and Benjamin Constant, supporting their aggregation for analysis.
HBR frequencies varied widely among zones [Supplementary data (Fig. 3)]. Calçoene had 97% of events < 10 HBR (max = 11), Atalaia-Benjamin 98% < 10 (max = 12), and Coari 65% < 10 (max = 39). Barcelos exhibited the widest range (~30% < 10; max = 195), with recurrent high peaks. One extreme Barcelos event (HBR = 195) was identified as an outlier [Supplementary data (Fig. 4)] and excluded because it fell far outside the overall distribution and could distort the models; although such extreme values may occur, their rarity prevents robust modelling in the present framework.
Cumulative analyses showed strong negative correlations between biting rate and sampling hour (Fig. 3A). HBR declined ≈ 154 bites per hour (r = -0.9617, p = 0.0022), and TBR ≈ 343 bites per hour (r = -0.9374, p = 0.0057). Both indices decreased nearly linearly from 18 h to 20 h, then more slowly between 20-21 h, followed by a sharper decline after 21 h. Differences between the two curves reflect small variations in the number of simultaneous collectors. The inset in Fig. 3A (black dots) shows that 20-22 h had more multi-collector events, evidenced by a larger HBR-TBR separation. Collector numbers were otherwise stable (2.31-2.36), indicating consistent sampling effort.

scatterplots showing the variation in the human biting rate (HBR) and total biting rate (TBR) of Nyssorhynchus darlingi per collection event. In both panels (A and B), HBR is plotted on the left Y-axis (blue dots and lines), and TBR is plotted on the right Y-axis (red dots and lines). Panel A shows the cumulative distributions of HBR and TBR per hour across all events. The inset plot in A (black dots and dashed line) represents the average number of collectors per collection event over time. Panel B displays noncumulative, hourly HBR and TBR values, illustrating the frequency distribution per event. All trend lines were fitted via the Distance Weighted Least Squares (DWLS) method.
Noncumulative analyses (Fig. 3B) clarified within-event dynamics: HBR decreased by 2.13 bites per hour (r = -0.1114; p = 0.0290) and TBR by 4.73 bites (r = -0.1044; p = 0.0408). Although statistically significant, these weak correlations indicate that additional factors account for most biting-rate variation.
Temperature and humidity patterns - A per-event database analysis [Supplementary data (Table IA)] revealed a moderate inverse relationship between temperature and humidity (r = -0.5433; p < 0.0001; r² = 0.2952), with temperature explaining ~30% of humidity variation. This intrinsic relationship indicates joint but nonredundant contributions of both variables to HBR, shaped by extrinsic zone-specific conditions.
Figure 4 shows that humidity and temperature vary markedly across zones. Although all sites lie within the tropical Amazon, their geographic settings and the season of sampling [Supplementary data (Fig. 3)] produce distinct microclimates: austral spring in Calçoene (23 Nov-1 Dec 2021) and Coari (23 Nov-9 Dec 2022), and austral winter in Barcelos (22 Jun-4 Jul 2022) and Atalaia-Benjamin (10-26 Jul 2023). Calçoene showed the highest humidity, greatest hygrometric amplitude (13%), and lowest median temperature, consistent with proximity to the Atlantic Ocean (~100 km) and early rainy-season conditions.32 Barcelos exhibited the highest median temperature (amplitude 6.2ºC; maxima ≈ 29ºC) and lowest humidity (< 72%), reflecting peak dry-season conditions. Coari and Atalaia-Benjamin had similar thermal profiles, with Atalaia-Benjamin being more humid due to seasonal timing.

boxplots showing hygrometric variation (blue; left Y-axis) and thermal variation (red; right Y-axis) across zones (X-axis). Square symbols indicate medians; boxes represent the interquartile range (25th-75th percentiles); and whiskers show the full range (minimum to maximum).
The bivariate plot in [Supplementary data (Fig. 5)] further highlights these contrasts, distinguishing the cooler, more humid profile of Calçoene from the hotter, drier conditions in Barcelos.
Figure 5 shows hourly temperature (A) and relative humidity (B) variation across zones. Temperature decreased and humidity increased through the evening in all zones. Barcelos consistently maintained the warmest and driest conditions. Atalaia-Benjamin became the coolest after 21 h while retaining the second-highest humidity. Coari ranked third in humidity and temperature early in the evening, becoming the second hottest after 22 h. Calçoene displayed the highest humidity and lowest early-evening temperatures, later surpassed by Atalaia-Benjamin; its humid and thermally stable conditions reflect strong maritime buffering.33

boxplots showing the temperature and humidity variation per sampling hour (event) across the four study zones.
Microclimatic factors influencing HBR variation - Fig. 6 shows that humidity was negatively associated with HBR (r = -0.3539; p < 0.0001; r² = 0.1252), with each 1% humidity increase corresponding to a 2.5-unit HBR decrease. Temperature showed a positive association (r = 0.2583; p < 0.0001), with each 1ºC increase linked to ~7 additional HBR units (r² = 0.0667). The curves show a reversal around HBR ≈ 18 and convergence near HBR ≈ 100 and > 120, reflecting zone-specific drivers.

scatterplot showing the variation in hygrometric (in blue; left Y-axis) and thermal (in red; right Y-axis) values per event (across all zones) against human biting rate (HBR; X-axis). All curves were fitted using Distance Weighted Least Squares (DWLS) method.
Microclimatic variables (maximum, minimum, and average temperature and humidity) were derived from the six sampling hours of each event and aggregated by site (70 locations). The VIF test29 indicated multicollinearity in average humidity, which was excluded [Supplementary data (Table VI)]. Site-level regression (Fig. 7, Table III) showed that all variables except minimum temperature significantly explained HBR; maximum temperature and minimum humidity had the strongest effects and were selected for further analyses. Because all collections occurred between 18 h and 00 h, the inverse temperature-humidity pattern partly reflects dusk-related covariation, but model inference was based on site-level aggregated data and mixed-effects models that are not influenced by within-night temporal structure.

scatterplot for selection of most explicative variables derived from temperature and humidity (minima, means, maximums) in explaining the human biting rate (HBR) variation. Humidity average was excluded after the variance inflation factor (VIF) test.
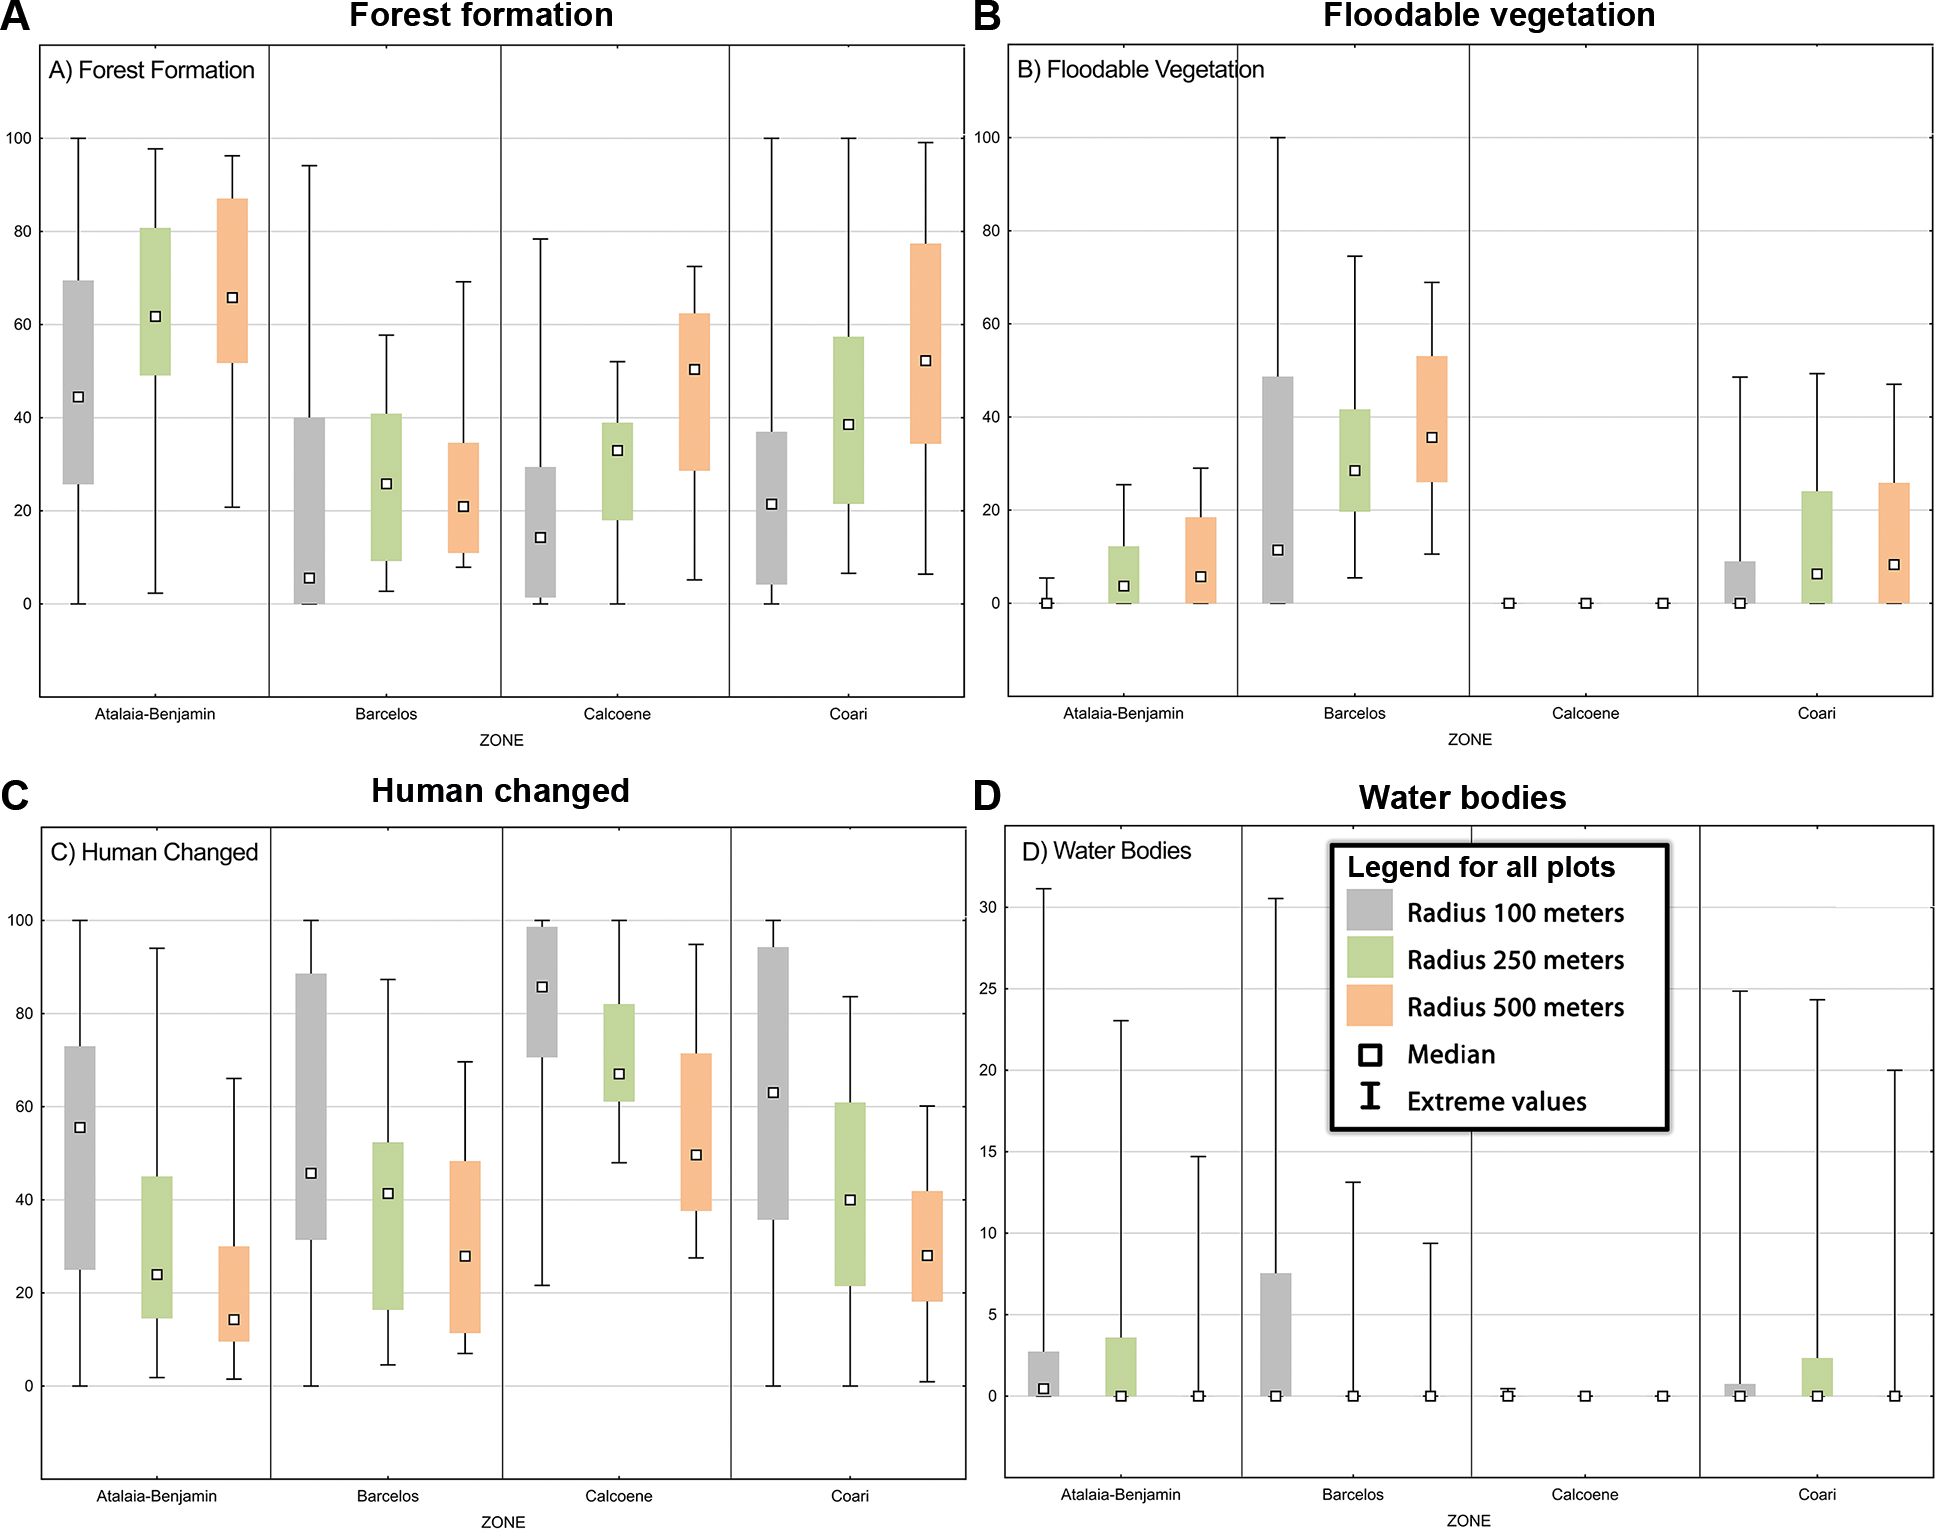
HBR land cover scales - Fig. 8 shows that forest formation generally increases with buffer size in all zones except Barcelos, where it increases from 100 to 250 m and decreases at 500 m. Human changed areas decrease with scale in all zones, especially Atalaia-Benjamin. Calçoene shows minimal floodable vegetation and water bodies across all scales but exhibits the highest median human changed cover. Water bodies are scarce overall, declining with scale in all zones except Calçoene.

boxplots showing the distribution of land cover classes percentages by zone: A: forest formation; B: floodable vegetation; C: human changed; D: water bodies.
Analyses of buffer radius variation [Supplementary data (Fig. 6)] reveal an inverse relationship between forest formation and human changed cover across scales. Smaller buffers capture more human-altered surroundings, whereas larger buffers capture more forest, floodable vegetation, and water bodies.
Regression results (Table IV) show that floodable vegetation is positively associated with HBR at all scales, strongest at 250 and 500 m. Humidity shows the strongest negative relationship; temperature shows a moderate positive effect. Forest formation has a moderate negative effect. Human changed and water bodies show no significant associations after microclimatic adjustment. Floodable vegetation and forest formation at 500 m, together with humidity and temperature, are the strongest predictors of HBR. Interzonal variation, however, remains more influential than spatial scale [Supplementary data (Tables VII-VIII)].
Mixed effects with zones as random effects - The mixed model converged successfully (REML = 592.6) [Supplementary data (Table V)]. Scaled residuals (-2.04 to 3.99; median = -0.033) were symmetrical, with extreme values suggesting unmeasured influences. Random effects captured substantial interzonal variance (variance = 62.06; SD = 7.878). Residual variance (252.73; SD = 15.898) remained high, consistent with PCA evidence of strong intrazonal variability.
The intercept was not significant (estimate = -12.987; p = 0.316). Among fixed effects, only floodable vegetation was significant (estimate = 0.509; p = 0.00219; analysis of variance (ANOVA) F = 10.21). Minimum humidity (p = 0.999), maximum temperature (p = 0.237), and forest formation (p = 0.101) were not significant; forest formation showed a marginal positive trend. Floodable vegetation remained the key interzonal predictor, consistent with known ecological mechanisms linking flooded environments to Ny. darlingi breeding, mating, oviposition, and larval development; proximity of human dwellings sustains high blood-meal availability.
Interzonal and intrazonal variability - The mixed model (ANOVA with Satterthwaite’s method) identified factors influencing HBR variation both between and within zones [Supplementary data (Table V)]. PCA was used to reduce dimensionality and examine interactions among microclimate, land cover, and HBR. PC1 and PC2 explained nearly 62% of total variance [Supplementary data (Figs 7-11)].
Across all zones, PC1 captured the main temperature-humidity-floodable vegetation gradient [Supplementary data (Fig. 7)]: maximum temperature loaded positively, minimum humidity strongly negatively, and floodable vegetation positively. Forest formation contributed moderately (negative on PC1, positive on PC2), whereas human changed and water bodies contributed weakly. PC1 (≈ 34%) was driven by minimum humidity, floodable vegetation, and HBR; PC2 (≈ 25%) reflected forest-formation versus human-modified gradients.
In PC space, HBR aligned positively with floodable vegetation and maximum temperature and negatively with minimum humidity. Forest formation and human changed areas were nearly orthogonal to HBR when zones were pooled. These patterns reflect ecological mechanisms whereby floodable areas enhance breeding conditions, temperature and humidity covary inversely, and highly forested or heavily modified landscapes depress biting activity.
Zone-specific PCAs revealed distinct drivers - (i) Atalaia-Benjamin [Supplementary data (Fig. 8)]: HBR aligned with PC1 but in the opposite direction of most variables, indicating lower HBR where floodable vegetation and human changed areas were more prevalent; (ii) Barcelos [Supplementary data (Fig. 9)]: HBR aligned with PC2 and floodable vegetation; water bodies showed a negative relationship; (iii) Calçoene [Supplementary data (Fig. 10)]: HBR followed the overall pattern; forest formation was positively associated and human changed negatively; floodable vegetation was absent; (iv) Coari [Supplementary data (Fig. 11)]: HBR aligned with maximum temperature; minimum humidity had the strongest negative effect; floodable vegetation contributed modestly.
The PC1-PC2 scatterplot [Supplementary data (Fig. 2)] shows most localities clustering near intermediate values, with Calçoene and Barcelos occupying opposite extremes and Atalaia-Benjamin and Coari in central positions, mirroring the temperature-humidity gradients shown in [Supplementary data (Fig. 5)].
DISCUSSION
Our findings reveal a coherent set of spatial, temporal, microclimatic, and landscape-driven patterns that jointly structure the human biting rate of Ny. darlingi across the Amazon. Barcelos exhibited the highest HBR and Calçoene and Atalaia-Benjamin the lowest, with all zones showing a consistent evening decline. Higher maximum temperatures and lower minimum humidity were associated with increased HBR, and zones differed markedly in their thermal and hygrometric profiles. At the landscape scale, floodable vegetation within 250-500 m emerged as the strongest predictor of elevated HBR, while forest formation showed generally negative associations. Multiscale analyses and PCA demonstrated that intrazonal variability exceeded interzonal differences, reflecting locally distinct combinations of microclimate, land cover, and settlement structure. Altogether, these results indicate that Ny. darlingi biting risk is shaped by fine-scale microclimatic conditions and by the habitat mosaic surrounding households, with flood-prone vegetation playing a key role across the region.
Spatial patterns further highlighted these processes. Barcelos recorded the highest HBR per sampling event, exceeding the combined totals of the other zones, likely reflecting hydrological conditions during sampling in July, when peak river levels and early dry-season flooding increased contact between people and mosquitoes. In contrast, Calçoene and Atalaia-Benjamin had the lowest HBR values. Differences in temperature profiles, with Barcelos and Atalaia-Benjamin being warmer than Calçoene and Coari, were consistent with regional seasonality in which wetter months tend to be cooler.
The temporal decline in HBR after 21 h corresponded to decreasing temperature and rising humidity. Humidity was the strongest microclimatic determinant of mosquito activity, while higher maximum temperatures also contributed to increased biting. Temperature explained only 30% of humidity variability, indicating that their effects on HBR reflect additional environmental factors that differ among zones and through the evening.
These patterns align with previous findings linking microclimate to anopheline activity. For example, biting rates of Anopheles stephensi increased sharply between 25-32ºC and then declined under heat stress.34 High humidity promotes mosquito survival and flight activity,35,36 whereas low humidity reduces longevity and host-seeking behavior. Similar seasonal effects have been documented in Anopheles funestus37 and in Kenya, where rainy-season conditions favor mosquito survival and Plasmodium transmission.38 Thermal conditions also influence life-history traits of Ny. darlingi, with higher developmental temperatures producing adults of reduced longevity and potentially lower transmission capacity.35,36 Mosquitoes bite most efficiently within an optimal temperature range. However, high temperatures can increase dryness stress, and under low humidity mosquitoes may feed more frequently to compensate for water loss, although extreme heat combined with low humidity can reduce survival and ultimately limit transmission potential.39
Landscape configuration added another layer of influence. Floodable vegetation within 250-500 m of households was the strongest land cover predictor of higher HBR, while forest formation showed weaker or negative associations. These findings are consistent with evidence from the Peruvian Amazon, where deforested areas exhibit higher biting rates,18 and with results from Chaves et al.,17 who demonstrated that forest-cover gradients shape not only biting activity but also infection status. In their study, uninfected mosquitoes peaked at dusk (18 h to 19 h) in degraded areas with less than 30% forest cover, P. vivax infected females peaked later (21 h to 23 h) in intermediate forest with 30% to 70% cover, and P. falciparum infected females peaked earlier (19 h to 20 h) in preserved forests with more than 70% cover. By resolving effects across concentric buffers of 100, 250, and 500 m, our study identifies the neighborhood scale at which landscape mosaics amplify vector–host encounter rates, complementing these forest-cover-mediated temporal shifts.
Zone-specific contrasts reinforce the importance of local environmental context. In Atalaia-Benjamin and Calçoene, higher forest cover within 250-500 m was associated with lower HBR. In Calçoene, natural floodable vegetation was absent and replaced by temporary mining-associated water bodies, often misclassified in land cover datasets and less likely to sustain stable Ny. darlingi populations. Barcelos exhibited the highest biting rates, consistent with seasonal flooding, proximity of breeding sites to dwellings, and heightened socioeconomic vulnerability. In Coari, despite greater urbanization and lower poverty, microclimatic variables explained most HBR variation, with anthropogenic land cover exerting limited influence. Across all zones, intrazonal variability exceeded interzonal differences, underscoring the importance of fine-scale environmental heterogeneity.
These findings align with the frontier malaria hypothesis, which anticipates a non-linear relationship between forest conversion and malaria risk, with risk peaking at approximately 50% forest cover and declining as landscapes and social systems stabilize.40,41 Empirical and modelling studies link deforestation dynamics to transmission and document feedbacks whereby disease burden can dampen subsequent clearing.42 Our results clarify a proximal mechanism: transitional mosaics near households that combine intermediate forest cover with flood-prone vegetation within 250-500 m create microclimatic conditions of warmer maximum temperatures and lower relative humidity that favor vector activity and breeding. Sustained transmission also depends on persistent asymptomatic and subpatent infections, which in frontier settings maintain transmission even as reported cases fall. This interpretation is consistent with evidence that weather and climate variability modulate transmission in the Brazilian Amazon43 and with WHO guidance emphasizing integration of environmental management with vector control.44
Operationally, effective malaria control and elimination in the Amazon require frontier-aware and scale-explicit strategies. High-resolution land cover monitoring through platforms such as MapBiomas,23 combined with site-specific microclimate measurements, can help identify flood-prone vegetation within 250-500 m of households and guide the timing of interventions to warmer, drier evening periods. Embedding these landscape-microclimate triggers into Brazil’s malaria elimination strategy, alongside vector control, focal habitat management, enhanced detection of asymptomatic carriers, and radical cure, targets the environmental and temporal windows in which risk peaks and can accelerate progress toward elimination.40,41,42,43,44,45
In conclusion - This study offers a detailed examination of the ecological, microclimatic, and socio-economic determinants of Ny. darlingi HBR across distinct Amazonian regions. A consistent temporal pattern in the HBR was observed, characterized by a progressive evening decline aligned with decreasing temperature and increasing humidity. Maximum temperature was positively associated with HBR, likely due to increased host acid lactic acid emissions, whereas minimum humidity was negatively associated with mosquito activity. However, elevated humidity later in the evening may suppress host-seeking efficiency by limiting the dispersion of olfactory attractants, underscoring a nonlinear relationship.
At the landscape level, floodable vegetation within a 500-metre radius around the sampling sites was the most influential land cover class, reflecting the presence of larval habitat. Spatial variation in HBR across zones was influenced by environmental and demographic factors, including the extent of urbanization and socio-economic vulnerability. Notably, transitional zone areas experiencing recent habitat degradation near human settlements presented the highest HBR, whereas both highly preserved and heavily degraded regions presented comparatively lower biting activity.
These findings emphasize the necessity of localized, ecologically grounded strategies for malaria control in the Amazon. A nuanced understanding of these interrelated factors is essential for designing effective vector control policies tailored to the specific conditions of each Amazonian locality.
SUPPLEMENTARY MATERIALS
Supplementary material
ACKNOWLEDGEMENTS
To Caio Cesar Moreira and Denise Cristina Sant'Ana for their help arranging material for field trips to the Amazon, and to the staff of the municipalities responsible for malaria control for providing useful information that guided field collections.
-
Financial support: NIH (grant R01 AI110112 to JEC, MAMS; this grant also supported ALA’s postdoctoral fellowship), CNPq (grant 303382/2022-8 to MAMS), Leverhulme Trust (grant RPG-2024-342 supporting ALA’s current postdoctoral position).
-
How to cite
Acosta AL, Bergo ES, Figueira EAG, Conn JE, Sallum MAM. Reframing vector control: land use and climate shape malaria risk in Amazonian communities. Mem Inst Oswaldo Cruz. 2026; 121: e250171.
DATA AVAILABILITY
The contents underlying the research text are included in the manuscript.
REFERENCES
-
1 WHO - World Health Organization. World malaria report 2024. Addressing inequity in the global malaria response. 2024. Available from: https://www.who.int/teams/global-malaria-programme/reports/world-malaria-report-2024
» https://www.who.int/teams/global-malaria-programme/reports/world-malaria-report-2024 -
2 Carlos BC, Rona LDP, Christophides GK, Souza-Neto JA. A comprehensive analysis of malaria transmission in Brazil. Pathog Glob Health. 2019; 113(1): 1-13. doi: https://doi.org/10.1080/20477724.2019.1581463.
» https://doi.org/10.1080/20477724.2019.1581463 -
3 Martins-Filho PR, Araújo FWC, Lima SVMA, Santiago BM, Damascena NP, Araújo APD, et al. Imported cases of malaria in Brazil from South American countries: a retrospective ecological study from 2009 to 2022. J Travel Med. 2023; 30(7): taad078. doi: https://doi.org/10.1093/jtm/taad078.
» https://doi.org/10.1093/jtm/taad078 -
4 Garcia KKS, Abrahão AA, Oliveira AF, Dos Santos JD, Barcellos C, Laporta GZ, et al. Malaria time series in the extra-Amazon region of Brazil: epidemiological scenario and a two-year prediction model. Malar J. 2022; 21: 157. doi: https://doi.org/10.1186/s12936-022-04162-1.
» https://doi.org/10.1186/s12936-022-04162-1 -
5 Chaves LSM, Bergo ES, Conn JE, Laporta GZ, Prist PR, Sallum MAM. Anthropogenic landscape decreases mosquito biodiversity and drives malaria vector proliferation in the Amazon rainforest. PLoS One. 2021; 16(1): e0245087. doi: https://doi.org/10.1371/journal.pone.0245087.
» https://doi.org/10.1371/journal.pone.0245087 -
6 Arcos AN, Valente-Neto F, da Silva Ferreira FA, Leite GR, Lima DC, Monteiro WM, et al. Seasonality modulates the direct and indirect influences of forest cover on larval anopheline assemblages in western Amazônia. Sci Rep. 2021; 11: 12721. doi: https://doi.org/10.1038/s41598-021-92217-9.
» https://doi.org/10.1038/s41598-021-92217-9 - 7 Afrane YA, Zhou G, Lawson BW, Githeko AK, Yan G. Effects of microclimatic changes caused by deforestation on the survivorship and reproductive fitness of Anopheles gambiae in western Kenya highlands. Am J Trop Med Hyg. 2006; 74: 772-8.
-
8 Castro MC, Baeza A, Codeço CT, Cucunubá ZM, Dal'Asta AP, De Leo GA, et al. Development, environmental degradation, and disease spread in the Brazilian Amazon. PLoS Biol. 2019; 17(11): e3000526. doi: https://doi.org/10.1371/journal.pbio.3000526.
» https://doi.org/10.1371/journal.pbio.3000526 -
9 Angelo JR, Katsuragawa TH, Sabroza PC, de Carvalho LA, Silva LH, Nobre CA. The role of spatial mobility in malaria transmission in the Brazilian Amazon: the case of Porto Velho municipality, Rondônia, Brazil (2010-2012). PLoS One. 2017; 12: e0172330. doi: https://doi.org/10.1371/journal.pone.0172330.
» https://doi.org/10.1371/journal.pone.0172330 -
10 Arisco NJ, Peterka C, Diniz C, Singer BH, Castro MC. Ecological change increases malaria risk in the Brazilian Amazon. Proc Natl Acad Sci USA. 2024; 121: e2409583121. doi: https://doi.org/10.1073/pnas.2409583121.
» https://doi.org/10.1073/pnas.2409583121 -
11 Gomez J, Grosso A, Guzman-Guzman M, Garcia Castillo S, Castro MC, Torres K, et al. Human mobility and malaria risk in peri-urban and rural communities in the Peruvian Amazon. PLoS Negl Trop Dis. 2025; 19: e0012058. doi: https://doi.org/10.1371/journal.pntd.0012058.
» https://doi.org/10.1371/journal.pntd.0012058 -
12 Pizzitutti F, Pan W, Feingold B, Zaitchik B, Álvarez CA, Mena CF. Out of the net: An agent-based model to study human movements influence on local-scale malaria transmission. PLoS One. 2018; 13: e0193493. doi: https://doi.org/10.1371/journal.pone.0193493.
» https://doi.org/10.1371/journal.pone.0193493 -
13 Girod R, Roux E, Berger F, Stefani A, Gaborit P, Carinci R, et al. Unravelling the relationships between Anopheles darlingi densities, environmental factors and malaria incidence in French Guiana. Ann Trop Med Parasitol. 2011; 105(2): 107-22. doi: https://doi.org/10.1179/136485911x12899838683322.
» https://doi.org/10.1179/136485911x12899838683322 -
14 Vezenegho SB, Carinci R, Gaborit P, Issaly J, Dusfour I, Briolant S, et al. Anopheles darlingi dynamics in relation to meteorological data in a cattle farm in coastal French Guiana. Environ Entomol. 2015; 44(3): 454-62. doi: https://doi.org/10.1093/ee/nvv053.
» https://doi.org/10.1093/ee/nvv053 -
15 Ngowo HS, Kaindoa EW, Matthiopoulos J, Ferguson HM, Okumu FO. Variations in household microclimate affect outdoor-biting behaviour of malaria vectors. Wellcome Open Res. 2017; 2: 102. doi: https://doi.org/10.12688/wellcomeopenres.12928.1.
» https://doi.org/10.12688/wellcomeopenres.12928.1 -
16 Oliveira TMP, Laporta GZ, Bergo ES, Chaves LSM, Antunes JLF, Bickersmith SA, et al. Vector role and human biting activity of Anophelinae mosquitoes in different landscapes in the Brazilian Amazon. Parasit Vectors. 2021; 14(1): 236. doi: https://doi.org/10.1186/s13071-021-04725-2.
» https://doi.org/10.1186/s13071-021-04725-2 -
17 Chaves LSM, Bergo ES, Bickersmith SA, Laporta GZ, Conn JE, Sallum MAM. Forest cover percentage drives the peak biting time of Nyssorhynchus darlingi in the Brazilian Amazon. Malar J. 2024; 23(166). doi: https://doi.org/10.1186/s12936-024-04984-1.
» https://doi.org/10.1186/s12936-024-04984-1 - 18 Vittor AY, Pan W, Gilman RH, Tielsch J, Glass G, Shields T, et al. The effect of deforestation on the human-biting rate of Anopheles darlingi in the Peruvian Amazon. Am J Trop Med Hyg. 2006; 74: 3-11.
-
19 Castro MC. Malaria transmission and prospects for malaria eradication: the role of the environment. Cold Spring Harb Perspect Med. 2017; 7(10): a025601. doi: https://doi.org/10.1101/cshperspect.a025601.
» https://doi.org/10.1101/cshperspect.a025601 -
20 Olson DM, Dinerstein E. The Global 200: a representation approach to conserving the Earth's most biologically valuable ecoregions. Conserv Biol. 1998; 12(3): 502-15. doi: https://doi.org/10.1046/j.1523-1739.1998.012003502.x.
» https://doi.org/10.1046/j.1523-1739.1998.012003502.x -
21 IBGE - Instituto Brasileiro de Geografia e Estatística. Censo Demográfico 2022. [Cited 15 June 2024]. Available from: https://www.ibge.gov.br/estatisticas/sociais/trabalho/22827-censo-demografico-2022.html
» https://www.ibge.gov.br/estatisticas/sociais/trabalho/22827-censo-demografico-2022.html -
22 Sallum MAM, Conn JE, Bergo ES, Laporta GZ, Chaves LSM, Bickersmith SA, et al. Vector competence and vectorial capacity of Nyssorhynchus darlingi for Plasmodium vivax in agricultural settlements in the Brazilian Amazon. Malar J. 2019; 18(1): 117. doi: https://doi.org/10.1186/s12936-019-2753-7.
» https://doi.org/10.1186/s12936-019-2753-7 -
23 MapBiomas Project. Collection 8 of Brazilian Land Cover & Use Map Series. 2022 [Cited 20 June 2024]. Available from: https://brasil.mapbiomas.org/en/map/colecao-8/
» https://brasil.mapbiomas.org/en/map/colecao-8/ -
24 Google LLC. Google Earth (Version 7.3) [Software]. 2024 [Cited 12 January 2024]. Available from: https://earth.google.com
» https://earth.google.com -
25 Hijmans RJ. raster: Geographic data analysis and modeling. R package version 3.5-15. 2023. Available from: https://CRAN.R-project.org/package=raster
» https://CRAN.R-project.org/package=raster -
26 Hijmans RJ. terra: spatial data analysis. R package version 1.7-3. 2023. Available from: https://CRAN.R-project.org/package=terra
» https://CRAN.R-project.org/package=terra -
27 R Core Team. R: A language and environment for statistical computing [Software]. R Foundation for Statistical Computing, Vienna, Austria. 2024. Available from: https://www.R-project.org/
» https://www.R-project.org/ -
28 Gonzalez Daza W, Muylaert RL, Sobral-Souza T, Landeiro VL. Malaria risk drivers in the Brazilian Amazon: land use-land cover interactions and biological diversity. Int J Environ Res Public Health. 2023; 20(15): 6497. doi: https://doi.org/10.3390/ijerph20156497.
» https://doi.org/10.3390/ijerph20156497 -
29 Naimi B. USDM: Uncertainty Analysis for Species Distribution Models. R package version 2.1-7. 2023. Available from: https://cran.r-project.org/web/packages/usdm/usdm.pdf
» https://cran.r-project.org/web/packages/usdm/usdm.pdf -
30 StatSoft Inc. STATISTICA (Version 12) [Computer software]. Tulsa, StatSoft, Inc.; 2013 [Cited 5 April 2022]. Available from: http://www.statsoft.com
» http://www.statsoft.com -
31 Esri. ArcGIS Desktop: Release 10.5. Redlands, CA: Environmental Systems Research Institute; 2016. Available from: https://www.esri.com
» https://www.esri.com -
32 Nobre P, Malagutti M, Urbano DF, de Almeida RAF, Giarolla E. Amazon deforestation and climate change in a coupled model simulation. J Clim. 2009; 22: 5686-97. doi: https://doi.org/10.1175/2009JCLI2757.1.
» https://doi.org/10.1175/2009JCLI2757.1 -
33 NOAA - National Oceanic and Atmospheric Administration. Climatological data and ocean-atmosphere interactions in the western Atlantic region. U.S. Department of Commerce; 2024. Available from: https://www.noaa.gov/
» https://www.noaa.gov/ -
34 Agyekum TP, Botwe PK, Arko-Mensah J, Issah I, Acquah AA, Hogarh JN, et al. Effects of temperature on Anopheles mosquito development: implications for malaria control. Int J Environ Res Public Health. 2021; 18: 7255. doi: https://doi.org/10.3390/ijerph18147255.
» https://doi.org/10.3390/ijerph18147255 -
35 Chu VM, Sallum MAM, Moore TE, Lainhart W, Schlichting CD, Conn JE. Regional variation in life history traits of Nyssorhynchus darlingi in Brazil. Sci Rep. 2019; 9(1): 5356. doi: https://doi.org/10.1038/s41598-019-41651-x.
» https://doi.org/10.1038/s41598-019-41651-x -
36 Chu VM, Sallum MAM, Moore TE, Emerson KJ, Schlichting CD, Conn JE. Evidence for family-level variation of phenotypic traits in response to temperature of Brazilian Nyssorhynchus darlingi. Parasit Vectors. 2020; 13(1): 55. doi: https://doi.org/10.1186/s13071-020-3924-7.
» https://doi.org/10.1186/s13071-020-3924-7 -
37 Komba EB, Balan RT, Ismail A. Time, temperature and humidity on Anopheles funestus biting behavior. Acta Entomol Zool. 2024; 5: 47-53. doi: https://doi.org/10.33545/27080013.2024.v5.i2a.155.
» https://doi.org/10.33545/27080013.2024.v5.i2a.155 -
38 Patz JA, Hulme M, Rosenzweig C, Mitchell TD, Goldberg RA, Githeko AK, et al. Predicting malaria transmission factors using modeled soil moisture in Kenya. Trop Med Int Health. 1998; 3: 818-27. doi: https://doi.org/10.1046/j.1365-3156.1998.00309.x.
» https://doi.org/10.1046/j.1365-3156.1998.00309.x -
39 Brown JJ, Pascual M, Wimberly MC, Johnson LR, Murdock CC. Humidity: the overlooked variable in mosquito-borne disease. Ecol Lett. 2023; 26(7): 1029-49. doi: https://doi.org/10.1111/ele.14228.
» https://doi.org/10.1111/ele.14228 -
40 Castro MC, Monte-Mor RL, Sawyer DO, Singer BH. Malaria risk on the Amazon frontier. Proc Natl Acad Sci USA. 2006; 103(7): 2452-7. doi: https://doi.org/10.1073/pnas.0510576103.
» https://doi.org/10.1073/pnas.0510576103 -
41 Laporta GZ, Valle D, Prist PR, Ilacqua RC, Santos TC, Madeira FP, et al. Intermediate forest cover and malaria risk in an Amazon deforestation frontier. Acta Trop. 2025; 269: 107757. doi: https://doi.org/10.1016/j.actatropica.2025.107757.
» https://doi.org/10.1016/j.actatropica.2025.107757 -
42 MacDonald AJ, Mordecai EA. Amazon deforestation drives malaria transmission, and malaria burden reduces forest clearing. Proc Natl Acad Sci USA. 2019; 116(44): 22212-8. doi: https://doi.org/10.1073/pnas.1905315116.
» https://doi.org/10.1073/pnas.1905315116 -
43 Bauch SC, Birkenbach AM, Pattanayak SK, Sills EO. Public health impacts of ecosystem change in the Brazilian Amazon. Proc Natl Acad Sci USA. 2015; 112(24): 7414-9. doi: https://doi.org/10.1073/pnas.1406495111.
» https://doi.org/10.1073/pnas.1406495111 - 44 Vittor AY, Gilman RH, Tielsch J, Glass G, Shields T, Lozano WS, et al. The effect of deforestation on the human-biting rate of Anopheles darlingi in the Peruvian Amazon. Am J Trop Med Hyg. 2006; 74(1): 3-11.
-
45 Laporta GZ, Conn JE, Bergo ES, Oliveira TMP, Sallum MAM. Vector ecology and malaria transmission in the Brazilian Amazon: environmental drivers and epidemiological implications. Mem Inst Oswaldo Cruz. 2023; 118: e220456. doi: https://doi.org/10.1590/0074-02760220456.
» https://doi.org/10.1590/0074-02760220456
Edited by
-
Handling editor: Ricardo Lourenço-de-Oliveira | https://orcid.org/0000-0003-0423-5694
FIRST REVIEW ROUND - REVIEWERS COMMENTS
About the reviewerREVIEWER #1
The authors provide an interesting appraisal of the landscape and meteorological variables affecting the human biting rate (HBR) of the dominant malaria vector in the Amazon. I have noted several parts of the manuscript that require clarification. However, I could not complete my review because approximately 90% of the figures could not be converted and, therefore, were not available for evaluation.
Lines 63–65: I agree that the spatial mobility of humans exposed to malaria infection is, naturally, a factor that can further increase transmission. However, the most important point here, which has not been explored, is the burden of asymptomatic malaria carriers who serve as reservoirs, sustaining long-term chains of transmission. This point should be discussed further, in line with the section on how to better identify and treat these individuals.
Lines 138–139: This sentence on relevant land cover is important because it relates to the hypothesis regarding the relationship between HBR and landscape features. However, it lacks references and an appropriate rationale explaining what variation in HBR might be expected for each type of landscape composition. In Lines 142–148, where I expected further elaboration, there is still no clear explanation of the selected landscape types in relation to the specific hypothesis of this work.
Lines 140–141: Please provide more detail, as it seems challenging, even with higher-resolution imagery, to differentiate between “Forest Formation” and “Floodable Vegetation.”
Lines 69, 133, and 154: Avoid repeatedly defining HBR as “Human Biting Rate.” Define it once, then use the abbreviation consistently throughout the text.
Lines 158–159: Please include a reference.
Line 159: Clarify what you mean by “structured” in this context.
Lines 160–162: Explain the rationale for this operation, why it was done and what it contributes to the analysis.
Line 170: Does “SI-1” refer to “SM-1”? Please clarify.
Line 171: Explain how normalization was performed and for which variables.
Lines 172–176: Clarify whether repeated measures (e.g., hourly values) were controlled for using appropriate parameters in the model (e.g., random intercepts in mixed models).
Line 178: In the site-level “structured” dataset, did you use average, minimum, or maximum values?
Lines 186–187: Clarify whether “model significance” refers to the lowest p-values and whether “explanatory power” refers to the highest R squared.
Line 196: Specify “via what” method, tool, or process.
Line 216: In “SI 3-A,” please verify the order of the supporting material.
Lines 220–222: If the outlier is genuinely part of the phenomenon, it should not be removed.
I stopped my review at this point because the figures were unavailable. Please provide the figures in lower resolution so the system can successfully convert them for review.
REVIEWER #2
Introduction
• Lines 60-68: More detail is needed here. The authors describe relationships between environmental variables and malaria in terms like “shift” and “alterations” which do not adequately describe the direction, strength, and location of the phenomena. For instance, I think it would be valuable for the authors to discuss how loss of forest cover is linked to vector habitat, and to discuss the Frontier Malaria framework that is relevant here.
Methods
• Lines 103-111: Please include specifics on the distinct ecological characteristics that define each side. Individuals not familiar with the region may need more context as to what makes these sites different from one another.
• General comments on methods (Lines 163-196):
The statistical methods are difficult to follow because the analytic steps (screening, exploratory analyses, variable selection, scale testing, and modeling) are interleaved without a clear sequential logic (at least to me). For instance, shouldn’t the multicollinearity test have occurred prior to modelling the effects of microclimatic parameters on HBR?
Furthermore, the authors move from two linear models, to describing a multiple regression, to then describing a mixed-effects model. Why not just look at multicollinearity, select climate variables, and run the mixed-effects model?
I am unsure what the authors mean by “performed in blocks”. Clarification would be helpful.
If the authors do determine that all modelling steps are necessary, including a table in the supplement with the analytical steps taken, the model outcomes, their predictors, and their structures would be helpful.
Furthermore, at least for the multilevel model, including the model equation would help clarify how terms were specified.
Is ecological zone included as a random slope or random intercept?
Lines 191-196: The PCA seems redundant to the multilevel model. If the goal is to understand the relative influence of covariates on the outcome, why not just compare the betas?
Results
General comments:
• The results are far too long and cumbersome. I suggest that the authors revisit this section, streamline the text, and select results that are most important for the message of the manuscript. As a reader, this section was very difficult to wade through and distill the important points.
• The authors should adopt a more consistent and simplified reporting style for their effect estimates. For instance, it is unnecessary to include the slope equations from a regression output in the results section. The estimate and confidence interval are really the most important.
• Anywhere that the authors recount steps such as normalization/standardization choices, outlier handling, buffer radius selection, or sampling-effort standardization, please relocate the procedural details to methods or supplement. The results section should only include objective, uninterpreted text on outcomes of statistical tests, etc.
• The authors use descriptive terms, such as “consistent”, “few”, “high”, etc., to describe results. Please be more explicit and use numerical descriptors.
Line 206: Total Biting Rate is introduced for the first time in the results section, and not defined as a metric analyzed in the methods section.
Discussion:
• The authors should focus more on what their study contributes to the extant body of literature on this topic. For example, Lines 543-552 give an in-depth description of the Chaves et al findings, but there is no subsequent explanation as to how these findings are extended by the results of the authors analysis (which they are).
• Lines 567-568: Do you mean forest preservation, or existing forest cover?
• Lines 575-579: There is ample evidence via the frontier malaria hypothesis of this non-linear relationship. Please consider citing the articles below, and I recommend taking a deeper look at the literature on this topic for more nuanced interpretation.
De Castro, M. C., Monte-Mor, R. L., Sawyer, D. O., & Singer, B. H. (2006). Malaria risk on the Amazon frontier. Proceedings of the National Academy of Sciences, 103(7), 2452-2457.
Laporta, G. Z., Valle, D., Prist, P. R., Ilacqua, R. C., Santos, T. C., Madeira, F. P., ... & Sperança, M. A. (2025). Intermediate forest cover and malaria risk in an Amazon deforestation frontier. Acta Tropica, 107757.
Other citations to consider:
MacDonald, A. J., & Mordecai, E. A. (2019). Amazon deforestation drives malaria transmission, and malaria burden reduces forest clearing. Proceedings of the National Academy of Sciences, 116(44), 22212-22218.
Arisco, N. J., Peterka, C., Schwartz, J., & Castro, M. C. (2025). The impact of weather and extreme events on malaria transmission in the Brazilian Amazon: a case-crossover and population-based study. The Lancet Regional Health–Americas, 49.
World Health Organization. (2015). Global technical strategy for malaria 2016-2030. World Health Organization.
The authors should include a more in-depth discussion of how these results will help inform malaria intervention stratification and surveillance in the Amazon, and what they mean for malaria elimination. The authors do not discuss Brazil’s malaria elimination plan.
Figures & Tables
Figures 1, 3, 4, 5, 6, 8, 9, and 10 are not visible. I think there was an upload issue.
Tables 3 & 4: Regression equations should be replaced with beta and confidence intervals.
AUTHORS’ RESPONSE TO THE REVIEWERS
We sincerely thank the Handling Editor, Prof. Ricardo Lourenço-de-Oliveira, and both reviewers for their thorough evaluation and constructive feedback, which greatly improved the quality and clarity of this study. The editor’s careful guidance throughout the review process and the reviewers’ detailed comments were invaluable in refining the manuscript’s structure, analytical rigor, and interpretative depth.
Their contributions strengthened the conceptual framing within the Frontier Malaria context, improved methodological transparency, and enhanced the linkage between our findings and the operational pillars of Brazil’s Plano Nacional de Eliminação da Malária.
We revised the text, figures, tables, and supplementary materials to address every point raised, ensuring greater coherence and applied relevance. We are deeply grateful for the time, expertise, and commitment of the editor and reviewers, whose efforts have significantly advanced the scientific and practical value of our work.
REVIEWER COMMENTS:
Reviewer: 1
Q0) The authors provide an interesting appraisal of the landscape and meteorological variables affecting the human biting rate (HBR) of the dominant malaria vector in the Amazon. I have noted several parts of the manuscript that require clarification. However, I could not complete my review because approximately 90% of the figures could not be converted and, therefore, were not available for evaluation.
R0) We apologize for the issue. Our figures were generated at very high resolution, apparently exceeding the review system’s capacity. We have now reduced their resolution to prevent further problems.
Q1) Lines 63–65: I agree that the spatial mobility of humans exposed to malaria infection is, naturally, a factor that can further increase transmission. However, the most important point here, which has not been explored, is the burden of asymptomatic malaria carriers who serve as reservoirs, sustaining long-term chains of transmission. This point should be discussed further, in line with the section on how to better identify and treat these individuals.
R1) Thank you for this important point. We agree that asymptomatic and subpatent Plasmodium infections constitute a substantial human reservoir that sustains transmission, particularly in frontier-malaria settings. Our current paragraph emphasizes land-use, microclimate, and mobility, but it did not explicitly foreground asymptomatic carriers. We have revised the Introduction to add this mechanism and expanded the Discussion to outline implications for surveillance and treatment of asymptomatic infections. As our study is entomological and does not include parasitological screening, we frame this as an essential context that interacts with the environmental drivers we quantify.
SECTION ADJUSTED IN INTRODUCTION: Climate change and deforestation have significantly modified mosquito community composition and the dominance of Nyssorhynchus darlingi (formerly Anopheles darlingi) across the Amazon River basin [5]. In particular, forest loss and land-use change increase the availability of sunlit, human-made breeding sites (such as fish ponds, road ditches, and flooded pastures), while simultaneously reducing shaded natural habitats, thereby favoring Ny. darlingi proliferation [6]. These processes also drive measurable alterations in local microclimatic conditions. Reduced canopy cover is associated with higher temperatures, lower humidity, and altered precipitation regimes, which further enhance vector survival and biting activity [7]. In addition, a substantial burden of asymptomatic and frequently subpatent malaria infections persists in many Amazonian communities, providing a long-lived human reservoir that maintains transmission chains even when symptomatic cases decline. Within the Frontier Malaria framework, regions undergoing rapid deforestation and settlement, coupled with human mobility and limited access to timely diagnosis and care, generate malaria hotspots sustained by ecological disruption and undetected human reservoirs; transmission is driven by human settlement dynamics and limited public health infrastructure [8]. Additionally, sustained human mobility across these altered landscapes contributes to the persistence and spread of malaria in the Brazilian Amazon [9–11].
SECTION ADJUSTED IN DISCUSSION: These findings are consistent with the frontier malaria hypothesis, which anticipates a non-linear relationship between land-use change and malaria risk along settlement frontiers: risk peaks at intermediate forest conversion (≈50% forest cover) and declines as landscapes and social systems stabilize [40,41]. Empirical and modeling studies links deforestation dynamics to transmission and documents feedbacks whereby disease burden can dampen subsequent clearing [42]. We extend this literature by specifying a proximal pathway: transitional mosaics near households that combine intermediate forest cover and flood-prone vegetation within 250–500 m exhibit higher HBR, consistent with warmer maximum temperatures and lower relative humidity that favor vector activity and breeding. Sustained transmission also depends on the prevalence and duration of asymptomatic and subpatent infections, which in frontier settings can maintain transmission even as reported cases fall. Programmatically, this supports integrated strategies that pair environmental risk targeting with enhanced detection of low-density infections (e.g., more sensitive diagnostics in foci investigations) and tailored case management, aligning with evidence that weather/climate variability and extremes modulate transmission in the Brazilian Amazon [43] and with operational guidance to integrate environmental management with vector control as emphasized by the Global Technical Strategy for Malaria (WHO 2015 [44]). Together, these insights reconcile the observed intermediate-peak non-linearity with a testable mechanism, landscape-driven microclimate and floodable vegetation around households, while incorporating the human reservoir component, thereby clarifying where and when local interventions are most effective.
Effective control and elimination in the Amazon should be frontier-aware and scale-explicit. Annual, high-resolution land-cover surveillance (e.g., MapBiomas [23]) coupled with site-specific microclimate monitoring can prioritize flood-prone vegetation within 250–500 m of households and time interventions to warmer, drier evening periods. Embedding these landscape–microclimate triggers into Brazil’s malaria elimination strategy, alongside vector control, focal habitat management, enhanced case detection for asymptomatic carriers, and radical cure, targets the window in which risk peaks in transitional landscapes and can accelerate progress toward elimination [40-45].
Q2) Lines 138–139: This sentence on relevant land cover is important because it relates to the hypothesis regarding the relationship between HBR and landscape features. However, it lacks references and an appropriate rationale explaining what variation in HBR might be expected for each type of landscape composition. In Lines 142–148, where I expected further elaboration, there is still no clear explanation of the selected landscape types in relation to the specific hypothesis of this work.
R2) Thank you for raising these very important points.
You are right that the wording was not precise, and the term “relevant” could lead to misinterpretation. What we intended to convey is that only the land cover classes actually present within the buffer areas were considered in the study, since MapBiomas includes several categories that do not naturally occur in the Amazon forest. To avoid ambiguity, we have revised the text to clarify this point, providing more detail on the selected classes, and reducing the risk of misinterpretation To clarify, we now detail the MapBiomas classes definitions and the decision rule that separates/aggregates each analysed class (see ADJUSTED below).
Although our study is exploratory rather than driven by specific a priori hypotheses, we agree that the link between landscape composition and HBR required clearer operational detail. We have added a sentence to make our directional expectations explicit (see INCLUDED below).
ADJUSTED: For landscape analyses, land cover raster data from MapBiomas were used, providing national coverage at high resolution (30 m) and classifying the Brazilian landscapes into 21 categories (at level 2 classification of Mapbiomas) for the year 2022 [23]. Only Amazonian land cover classes present within the sampling zones (buffers of 500-m radius per site) were retained. These buffer-specific land cover classes were cross-referenced with Google Earth [24] imagery and reclassified into new four classes: Forest Formation, Floodable Vegetation, Human-Changed, and Water Bodies.
“Forest Formation” class follows MapBiomas level-2 original class Forest Formation without reclassification. It comprises native, closed-canopy terra-firme forest, explicitly excluding areas subject to seasonal or permanent inundation. “Floodable Vegetation” corresponds to the combined MapBiomas level-2 classes of Floodable Forest and Wetlands, i.e., forested areas that are permanently or temporarily flooded (see details in MapBiomas Collection 8 [23]). “Human-Changed” class encompasses areas with evident human alteration or occupation, combining the Mapbiomas level-2 classes Pasture, Mining, Urban-Area, and Grassland; within buffers, the grasslands polygons were visually identified via Google Earth as cropland, and were therefore treated as anthropogenic features. “Water Bodies” class includes open-water surfaces without vegetation cover, represented by the Mapbiomas level-2 class River-Lake-Ocean, and comprises both natural (rivers, lakes) and artificial sources (dams, fishponds).
INCLUDED: These clearly distinct land-cover classes allow us to assess how each type modulates HBR alongside microclimatic covariates among zones, with variation potentially driven more by land cover features/habitat than by microclimate variation itself. We expect HBR to be lowest in closed-canopy Forest Formation, where both vector and human presence tend to be reduced; intermediate to high in Floodable Vegetation, given persistent larval habitats and human use of riparian zones; and highest in Human-Changed areas, where domestic water storage, livestock, and peri-urban settings increase human–vector contact. By contrast, HBR should be generally low near open Water Bodies exposed to sunlight, which limits oviposition and larval survival.
Q3) Lines 140–141: Please provide more detail, as it seems challenging, even with higher-resolution imagery, to differentiate between “Forest Formation” and “Floodable Vegetation.”
Thank you for the comment. As revised, the preceding section already addresses this request for clarification. The distinction between the two classes was not produced by us; it is operationalized by MapBiomas under its published methodology. We used those classes as defined, without reclassification, and have updated the text to state this explicitly.
ADJUSTED: “Forest Formation” class follows MapBiomas level-2 original class Forest Formation without reclassification. It comprises native, closed-canopy terra-firme forest, explicitly excluding areas subject to seasonal or permanent inundation. “Floodable Vegetation” corresponds to the combined MapBiomas level-2 classes of Floodable Forest and Wetlands, i.e., forested areas that are permanently or temporarily flooded (see details in MapBiomas Collection 8 [23]).
Q4) Lines 69, 133, and 154: Avoid repeatedly defining HBR as “Human Biting Rate.” Define it once, then use the abbreviation consistently throughout the text.
R4) Thank you for pointing this out. We agree with your suggestion. We have retained the full description of Human Biting Rate (HBR) only at its first appearance and removed the repeated definitions in subsequent mentions. The abbreviation HBR is now used consistently throughout the manuscript.
Q5) Lines 158–159: Please include a reference.
Gonzalez Daza, W., Muylaert, R. L., Sobral-Souza, T., & Lemes Landeiro, V. (2023). Malaria Risk Drivers in the Brazilian Amazon: Land Use - Land Cover Interactions and Biological Diversity. International Journal of Environmental Research and Public Health, 20(15), 6497. https://doi.org/10.3390/ijerph20156497
R5) Thank you for the helpful recommendation. We have now included the reference at the specified point in the manuscript: line 192 ref 28.
Q6) Line 159: Clarify what you mean by “structured” in this context.
Lines 160–162: Explain the rationale for this operation, why it was done and what it contributes to the analysis.
R6) Thank you for this observation. We have clarified the text accordingly. The revised sentence now specifies that the original event-level dataset, which contained multiple hourly sampling events per site, was aggregated by locality. In this structured “per-site” database, event-level records were summarized into a single entry per site by extracting maximum, minimum, and mean values of the measured variables. This restructuring allowed us to use sites as the unit of analysis, facilitating ecological comparisons and integration with land cover data.
ADJUSTED: To support spatial analyses, the initial event-level dataset was aggregated into a newly structured per-site database (SM-1). In this per-site database, the original data, which contained multiple hourly sampling events per site, were aggregated by each sampling locality. For each site, maximum, minimum, and mean values of key variables (e.g., temperature, humidity) were calculated, resulting in a single summarized record per site. This restructuring enabled site-level comparisons across ecological zones and integration with land cover data.
Q7) Line 170: Does “SI-1” refer to “SM-1”? Please clarify.
R7) Thank you for catching this mistake. Yes, “SI-1” was a typographical error and should refer to “SM-1.” We have corrected the text accordingly.
Q8) Line 171: Explain how normalization was performed and for which variables.
R8) Thank you for this comment. We have clarified the procedure in the text. Normalization was performed by rescaling the values of Human Biting Rate (HBR), temperature, and humidity to a 0–100 range using min–max transformation. This step ensured comparability among variables measured on different scales and facilitated their integration with land cover metrics (%).
ADJUSTED: To reduce scale-related biases and ensure comparability with land cover metrics (%), HBR, temperature, and humidity were normalized using a min–max transformation [(x-xmin)/(xmax-xmin)], rescaling each variable to a 0–100 range (Non-normalized values are retained in the database provided in Supporting Material SM-1, and a per-site normalized values database in Supporting Material SM-2. This procedure allowed us to directly compare variables with different units of measurement and integrate them consistently with land cover metrics.
Q9) Lines 172–176: Clarify whether repeated measures (e.g., hourly values) were controlled for using appropriate parameters in the model (e.g., random intercepts in mixed models).
R9) Thank you for the observation. Lines 172–176 (original version) report event-level exploratory tests (Pearson correlations, simple linear regressions, one-way ANOVA, Kruskal–Wallis) to visualize pairwise associations and between-zone differences. Because hourly observations within sites constitute repeated measures, we did not base inference on these tests. Formal inference used the site-level aggregated dataset and linear mixed-effects models with ecological zones as random intercepts, which account for the nested design and non-independence (see SI3-F). We have added a clarifying sentence to the Methods accordingly.
ADJUSTED:2) Exploratory analyses: To characterize temporal dynamics, Pearson correlation coefficients and linear regressions were applied to examine event-level associations between HBR, sampling hour, and microclimatic variables (temperature and humidity). Differences in microclimatic conditions among zones were tested using one-way ANOVA and the nonparametric Kruskal–Wallis test (SM3-A). These event-level procedures were used for exploratory-descriptive purposes, given the repeated hourly measurements within sites. Formal inference was based on the site-level aggregated dataset and linear mixed-effects models with ecological zones as random intercepts (SM3-B)
Q10) Line 178: In the site-level “structured” dataset, did you use average, minimum, or maximum values?
R10) Thank you for this comment. In the site-level “structured” dataset we used all three summary statistics - average, minimum, and maximum values - for temperature, humidity, and HBR. This approach allowed us to capture both central tendencies and extremes in microclimatic conditions and biting activity, while ensuring comparability with land cover data. We have revised the Methods to clarify this point.
ADJUSTED: To support spatial analyses, the initial event-level dataset was aggregated into a newly structured per-site database (SM-1). In this per-site database, the original data, which contained multiple hourly sampling events per site, were aggregated by each sampling locality. For each site, maximum, minimum, and mean values of key variables (e.g., temperature, humidity) were calculated, resulting in a single summarized record per site. This restructuring enabled site-level comparisons across ecological zones and integration with land cover data.
Q11) Lines 186–187: Clarify whether “model significance” refers to the lowest p-values and whether “explanatory power” refers to the highest R squared.
R11) Thank you for this observation. Yes, “model significance” refers to the statistical significance of the regression models (p-values), while “explanatory power” refers to the coefficient of determination (R²), which indicates the proportion of variance explained by the model. We have clarified this wording in the text.
ADJUSTED: Modeling: Multiple regression analyses were conducted using the selected predictors to test alternative spatial scales of land-cover variables and to evaluate the independent effects of microclimatic and land-cover factors. The optimal spatial scale was determined based on statistical significance (p-values) and explanatory power (R²). Subsequently, a linear mixed-effects model (LMM) was employed as the final integrative framework, incorporating the selected predictors while accounting for the hierarchical sampling structure and interzonal variability.
Q12) Line 196: Specify “via what” method, tool, or process.
R12) Thank you for this comment. We clarified the method used. Spatial analysis and mapping were performed using ArcGIS Desktop 10.5 (Esri, Redlands, CA, USA), which was previously cited as reference [29].
ADJUSTED: All analyses and visualizations, except LMMs, were performed in STATISTICA [30]. LMMs were implemented in R [27], and spatial analyses and mapping were carried out in ArcGIS Desktop 10.5 (Esri, Redlands, CA, USA [31]).
Q13) Line 216: In “SI 3-A,” please verify the order of the supporting material.
R13) Thank you for this comment. We have verified the order of the supporting material and confirm that the SM files are cited sequentially and correctly throughout the manuscript, consistent with the content of the supplementary material.
Q14) Lines 220–222: If the outlier is genuinely part of the phenomenon, it should not be removed.
R14) Thank you for this important observation. The potential outlier (event 195 in Barcelos) showed an exceptionally high HBR value, far beyond the range of the remaining distribution. Since our aim was to analyze general patterns rather than singular anomalies, we considered it not representative of the dataset as a whole. To prevent disproportionate leverage on regression outcomes and model fitting, we excluded this record from the analyses. We acknowledge, however, that rare extreme values may indeed reflect real ecological phenomena, and we have revised the text to clarify the rationale for this exclusion.
ADJUSTED: A single extreme event (HBR = 195) was identified as an outlier (Figure 3) and excluded. This event in Barcelos was judged not representative of the broader dataset, as it lay far beyond the overall distribution. To reduce risks of statistical distortion and undue influence on the models, we excluded this potential outlier from the analyses. We acknowledge that such extreme values may occasionally occur, but their rarity prevents robust modeling in the current framework.
Reviewer: 2
Introduction
Q15) Lines 60-68: More detail is needed here. The authors describe relationships between environmental variables and malaria in terms like “shift” and “alterations” which do not adequately describe the direction, strength, and location of the phenomena. For instance, I think it would be valuable for the authors to discuss how loss of forest cover is linked to vector habitat, and to discuss the Frontier Malaria framework that is relevant here.
R15) Thank you for suggesting improvement. We have expanded the text to include mechanistic detail, specifically, how forest loss creates favorable vector habitats, alters microclimatic conditions, and is interpreted within the Frontier Malaria framework, highlighting the interactions between environmental disruption, human settlement, and malaria transmission in frontier regions, as discussed in Castro et al. (2019).
ADJUSTED: Within the Frontier Malaria framework, regions undergoing rapid deforestation and settlement, coupled with human mobility and limited access to timely diagnosis and care, generate malaria hotspots sustained by ecological disruption and undetected human reservoirs; transmission is driven by human settlement dynamics and limited public health infrastructure [8 = Castro et al., 2019]. Additionally, sustained human mobility across these altered landscapes contributes to the persistence and spread of malaria in the Brazilian Amazon [9–11]. These interconnected factors underscore the need for region-specific surveillance and vector control strategies that account for environmental changes and human mobility patterns [12].
Castro MC, Baeza A, Codeço CT, Cucunubá ZM, Dal’Asta AP, et al. (2019) Development, environmental degradation, and disease spread in the Brazilian Amazon. PLOS Biology 17(11): e3000526. https://doi.org/10.1371/journal.pbio.3000526
Methods
Q16) Lines 103-111: Please include specifics on the distinct ecological characteristics that define each side. Individuals not familiar with the region may need more context as to what makes these sites different from one another.
Thank you for this insightful suggestion. We have enriched the manuscript to specify the ecological characteristics of each zone:
INCLUDED: The western Amazon (e.g., Alto Solimões) features fertile Andean-derived soils, high above-ground biomass, and extensive evergreen rainforest with relatively lower structural degradation. The central Amazon, characterized by dynamic igapó and várzea floodplains interspersed with terra-firme forest, is increasingly impacted by fragmentation and land-use change near urban centers. The eastern Amazon (e.g. Amapá) is distinguished by seasonal rainfall regimes, forest–savanna ecotones, and higher deforestation rates tied to agricultural expansion and infrastructure development. This ecological heterogeneity translates into distinct microclimatic environments, land-cover types, and anthropogenic pressures, all of which modulate Ny. darlingi host-seeking behavior in different ways.
General comments on methods (Lines 163-196):
Q17) The statistical methods are difficult to follow because the analytic steps (screening, exploratory analyses, variable selection, scale testing, and modeling) are interleaved without a clear sequential logic (at least to me). For instance, shouldn’t the multicollinearity test have occurred prior to modelling the effects of microclimatic parameters on HBR?
R17) Thank you for this valuable comment. We acknowledge that the initial description of our statistical workflow may have appeared fragmented. To address this, we have revised and rewritten the entire Statistical Analysis section in the Methods to present the analytical sequence more clearly, with a logical progression from data selection to model integration.
Q18) Furthermore, the authors move from two linear models, to describing a multiple regression, to then describing a mixed-effects model. Why not just look at multicollinearity, select climate variables, and run the mixed-effects model?
R18) We appreciate this observation. The rationale for applying multiple regression analyses before fitting the mixed-effects model was twofold. First, the blockwise multiple regressions served as an intermediate step to identify the most informative spatial scale of land cover predictors (100, 250, and 500 m). This step was necessary because the effect of land cover composition on HBR varies with buffer size, and not selecting the most explanatory scale a priori could bias the mixed-effects modeling. Second, the regression analyses allowed us to evaluate the independent contribution of microclimatic and land cover variables, helping to interpret subsequent model outcomes and ensuring that the mixed-effects model was based on a reduced, non-collinear set of predictors.
The linear mixed-effects model (LMM) was then used as the final modeling framework because it accounts for the nested sampling design and interzonal variability, as recommended for hierarchical ecological data. In short, while the LMM provided the most integrative results, the intermediate regression steps were essential for scale testing, predictor selection, and interpretation of variable-specific relationships. We have clarified this rationale in the revised Methods section: Statistical analysis.
INCLUDED IN THE END OF SECTION Statistical analysis: Multiple regression analyses were conducted using the selected predictors to test alternative spatial scales of land-cover variables and to evaluate the independent effects of microclimatic and land-cover factors. The optimal spatial scale was determined based on statistical significance (p-values) and explanatory power (R²). Subsequently, a linear mixed-effects model (LMM) was employed as the final integrative framework, incorporating the selected predictors while accounting for the hierarchical sampling structure and interzonal variability. The LMM was used to estimate the effects of temperature, humidity, and land cover on HBR, with ecological zones included as random effects to account for the nested sampling design and spatial heterogeneity (SM3-B). Degrees of freedom were estimated using Satterthwaite’s method. The model was specified as: HBRᵢⱼ = β₀ + β₁(TempMaxᵢⱼ) + β₂(HumidMinᵢⱼ) + β₃(ForestFormationᵢⱼ) + β₄(FloodableVegetationᵢⱼ) + uⱼ + εᵢⱼ; where β₀ is the intercept, β₁–β₄ are fixed-effect coefficients for the selected predictors, uⱼ is the random intercept for ecological zone j, and εᵢⱼ is the residual error term.
Q19) I am unsure what the authors mean by “performed in blocks”. Clarification would be helpful.
R19) Thank you for pointing out this lack of clarity. By “performed in blocks” we meant that the multiple regressions were run in successive sets, where the selected microclimatic predictors (temperature and humidity) were combined with each individual land cover class (Forest Formation, Floodable Vegetation, Human Changed, and Water Bodies) at three spatial scales (100, 250, and 500 m). This approach allowed us to test the effect of each land cover type independently across scales, avoiding unnecessary collinearity and guiding the selection of the most explanatory predictors for the mixed-effects model. To improve clarity, we have revised the text to replace “performed in blocks” with “Multiple regression analyses were conducted using the selected predictors to test alternative spatial scales of land-cover variables and to evaluate the independent effects of microclimatic and land-cover factors.”
Q20) If the authors do determine that all modelling steps are necessary, including a table in the supplement with the analytical steps taken, the model outcomes, their predictors, and their structures would be helpful.
R20) We appreciate this constructive suggestion. Indeed, each modeling step was necessary for (1) screening and exploring temporal associations, (2) testing multicollinearity and selecting microclimatic variables, (3) evaluating land cover predictors across spatial scales, and (4) integrating the selected predictors in a hierarchical framework. To improve transparency, we have now included an additional summary table in the Supplementary Material SM3-F that outlines the sequence of analytical steps, the predictors used, the model structures, and the corresponding outcomes. This table complements the detailed results already provided in Supporting Information 3 (SM3) and facilitates a clearer overview of the full analytical workflow. We also included this text in the end of Statistical analysis section:
INCLUDED: In SM3-F, a figure was included to illustrate the sequential workflow of the analyses, summarizing how temporal, microclimatic, and land-cover predictors were integrated across spatial scales and analytical steps. This visual summary helps clarify the logical progression from variable selection to the final hierarchical modeling framework.
Q21) Furthermore, at least for the multilevel model, including the model equation would help clarify how terms were specified.
R21) Thank you for this helpful suggestion. To improve clarity, we have now included the explicit equation of the linear mixed-effects model in the revised Statistical analysis section.
INCLUDED: The model was specified as: HBRᵢⱼ = β₀ + β₁(TempMaxᵢⱼ) + β₂(HumidMinᵢⱼ) + β₃(ForestFormationᵢⱼ) + β₄(FloodableVegetationᵢⱼ) + uⱼ + εᵢⱼ; where β₀ is the intercept, β₁–β₄ are fixed-effect coefficients for the selected predictors, uⱼ is the random intercept for ecological zone j, and εᵢⱼ is the residual error term.
Q22) Is ecological zone included as a random slope or random intercept?
R22) Thank you for raising this point. In our linear mixed-effects model, ecological zone was specified as a random intercept, not as a random slope. This specification accounts for baseline differences in HBR across zones while assuming that the effects of the fixed predictors (temperature, humidity, and land cover) are consistent among them. We have clarified this explicitly in the revised Statistical analysis section (last lines of topic 5 Modeling).
Q23) Lines 191-196: The PCA seems redundant to the multilevel model. If the goal is to understand the relative influence of covariates on the outcome, why not just compare the betas?
R23) We thank the reviewer for this important observation. We agree that the linear mixed-effects model (LMM) provides direct estimates of the effect sizes (β coefficients) of each predictor on HBR. However, the purpose of the Principal Component Analysis (PCA) was different: rather than serving as an alternative to the LMM, it was used as an exploratory tool to (i) reduce dimensionality, (ii) visualize multivariate relationships among predictors, and (iii) disentangle interzonal versus intrazonal variability. Specifically, PCA allowed us to highlight how covariates clustered and interacted across zones (e.g., the alignment of floodable vegetation with HBR in Barcelos, but not in Atalaia-Benjamin), which is not evident from fixed-effect coefficients alone. Thus, PCA complements the LMM by providing a graphical, zone-specific view of the environmental gradients structuring HBR variation, whereas the LMM quantifies the average effects of predictors across all zones.
Results - General comments:
Q24) The results are far too long and cumbersome. I suggest that the authors revisit this section, streamline the text, and select results that are most important for the message of the manuscript. As a reader, this section was very difficult to wade through and distill the important points.
R24) Thank you for this valuable suggestion. We fully agree that the Results section in the original version was overly detailed. In the revised manuscript, we thoroughly streamlined this section to enhance clarity and focus on the key findings that directly support the study’s central message.
We condensed redundant descriptions, removed procedural details already covered in the Methods or Supplementary Material, and summarized numerical outputs in concise sentences, referring readers to tables and figures for detailed values. The section now highlights only the most relevant outcomes: (i) interzonal and intrazonal variability in human biting rate (HBR), (ii) the key predictors identified by the mixed-effects model, and (iii) the main spatial and climatic gradients visualized by the PCA. These revisions make the Results section more direct and accessible while preserving analytical rigor and interpretive accuracy, in line with the reviewer’s recommendation.
Q25) The authors should adopt a more consistent and simplified reporting style for their effect estimates. For instance, it is unnecessary to include the slope equations from a regression output in the results section. The estimate and confidence interval are really the most important.
R25) Yes, we agree, and we have already made the changes to the tables and text. Thank you!
Q26) Anywhere that the authors recount steps such as normalization/standardization choices, outlier handling, buffer radius selection, or sampling-effort standardization, please relocate the procedural details to methods or supplement. The results section should only include objective, uninterpreted text on outcomes of statistical tests, etc.
R26) Thank you for this helpful suggestion. We have revised the manuscript accordingly, fully rewriting and condensing the Results section to remove redundancies and procedural details already covered in tables and figures. The authors agree with this recommendation and with the resulting version, which is now more concise and direct.
Q27) The authors use descriptive terms, such as “consistent”, “few”, “high”, etc., to describe results. Please be more explicit and use numerical descriptors.
R27) Thank you for pointing this out. We had avoided repeating numerical values already presented in figures and tables, although the upload issue with the figures may have limited the access to those data. To ensure clarity, we have now added explicit numerical values in the text where descriptive terms were previously used.
Q28) Line 206: Total Biting Rate is introduced for the first time in the results section, and not defined as a metric analyzed in the methods section.
R28) Thank you for pointing this out. We use both metrics in the study. The Total Biting Rate (TBR) refers to the total number of mosquito bites recorded by all collectors at a given site during a collection event (i.e., the sum across collectors at that event and site). The Human Biting Rate (HBR) is then derived from TBR and expresses the average number of bites per collector per event, computed as: HBR = TBR / number of collectors. We have revised the Methods to make this explicit by adding a sentence immediately before the HBR definition clarifying what TBR represents.
Discussion:
Q29) The authors should focus more on what their study contributes to the extant body of literature on this topic. For example, Lines 543-552 give an in-depth description of the Chaves et al findings, but there is no subsequent explanation as to how these findings are extended by the results of the authors analysis (which they are).
R29) Thanks for noticing and bringing this to our attention. We agree. We revised the paragraph to state explicitly how our findings extend the literature. Specifically, our results show that floodable vegetation within 250–500 m is the strongest land-cover predictor of higher HBR, and that warmer maximum temperature and lower relative humidity are independently associated with higher HBR, indicating a microclimatic mechanism through which land-use change intensifies biting risk. This integrates landscape composition with measured microclimate, complementing the time-of-evening shifts in biting activity reported by Chaves et al. [16].
REWRITTEN: Deforestation further amplifies transmission risk by altering local microclimates and increasing breeding-site availability. In the Peruvian Amazon, biting rates are dramatically higher in deforested areas [18]. Forest cover also shapes Ny. darlingi behavior: Chaves et al. (2024) [17] showed that biting activity and infection status vary with landscape context: uninfected mosquitoes peak at dusk (18:00–19:00) in degraded areas (<30% forest cover), P. vivax infected females peak later (21:00–23:00) in intermediate forest (30–70%), and P. falciparum infected females peak earlier (19:00–20:00) in preserved forests (>70%). These findings imply that forest-related microclimates influence not only vector abundance but also biting times, with implications for the timing and impact of interventions (e.g., insecticide-treated nets).
INCLUDED: Our contribution extends this literature by quantifying the landscape–microclimate pathway and identifying the operative spatial scale. First, we show that floodable vegetation within 250–500 m of households is the strongest land-cover predictor of increased HBR, whereas forest formation shows weaker or negative associations. Second, we demonstrate that warmer maximum temperatures and lower relative humidity are independently associated with higher HBR, indicating a microclimatic mechanism through which land-use change intensifies biting risk. Third, by resolving effects across concentric buffers (100/250/500 m), we pinpoint the neighborhood scale at which habitat mosaics elevate vector–host encounter rates, complementing the temporal shifts in biting activity reported by Chaves et al. [17]. Taken together, our results move beyond description to provide a testable, integrative mechanism—deforestation and habitat conversion restructure local microclimates and increase surrounding flood-prone vegetation, thereby raising biting risk (and likely shifting biting periods) within a few hundred meters of households. Because mosquitoes bite most efficiently within an optimal temperature range, targeting floodable vegetation at 250–500 m and prioritizing control during warmer, drier evening conditions should enhance intervention effectiveness in Amazonian communities. Physiological and ecological mechanisms likely underlie these associations. Elevated temperatures can increase human perspiration and the emission of volatile compounds such as lactic acid, thereby increasing mosquito attraction. However, high humidity may reduce the range of dispersion of these attractants and gases, such as carbon dioxide, reducing mosquito host-seeking efficiency.
Q30) Lines 567-568: Do you mean forest preservation, or existing forest cover?
R30) Thank you for pointing out the lack of clarity. We meant existing forest cover, not preservation status/history. In the manuscript we quantify forest as the percentage of MapBiomas “Forest Formation” around each site (100/250/500 m buffers); we do not infer management or historical protection. We revised the sentence accordingly.
REWRITTEN: In Atalaia-Benjamin and Calçoene, higher existing forest cover (Forest Formation, MapBiomas) within 250–500 m was associated with lower human biting rates (HBR). In Calçoene, natural floodable habitats were absent and replaced by temporary water bodies from mining activities, which are often misclassified in land cover datasets. In contrast, Barcelos recorded the highest biting rates, likely driven by a combination of seasonal flooding, proximity of breeding sites to human dwellings, and heightened socioeconomic vulnerability. In Coari, despite high levels of urbanization and lower poverty rates, variation in biting rates was explained primarily by microclimatic conditions, with limited influence from anthropogenic land cover.
Q31-32) Lines 575-579: There is ample evidence via the frontier malaria hypothesis of this non-linear relationship. Please consider citing the articles below, and I recommend taking a deeper look at the literature on this topic for more nuanced interpretation.
De Castro, M. C., Monte-Mor, R. L., Sawyer, D. O., & Singer, B. H. (2006). Malaria risk on the Amazon frontier. Proceedings of the National Academy of Sciences, 103(7), 2452-2457.
Laporta, G. Z., Valle, D., Prist, P. R., Ilacqua, R. C., Santos, T. C., Madeira, F. P., ... & Sperança, M. A. (2025). Intermediate forest cover and malaria risk in an Amazon deforestation frontier. Acta Tropica, 107757.
MacDonald, A. J., & Mordecai, E. A. (2019). Amazon deforestation drives malaria transmission, and malaria burden reduces forest clearing. Proceedings of the National Academy of Sciences, 116(44), 22212-22218.
Arisco, N. J., Peterka, C., Schwartz, J., & Castro, M. C. (2025). The impact of weather and extreme events on malaria transmission in the Brazilian Amazon: a case-crossover and population-based study. The Lancet Regional Health–Americas, 49.
World Health Organization. (2015). Global technical strategy for malaria 2016-2030. World Health Organization.
R31-32) Thank you for this helpful suggestion. We have revised the manuscript to explicitly situate our non-linear pattern within the frontier malaria framework and to clarify how our results extend that literature. In the new text fragment, we acknowledge that malaria risk often peaks at intermediate stages of forest conversion, consistent with the frontier hypothesis and recent empirical evidence from Amazonian deforestation frontiers (de Castro 2006; Laporta 2025), and we note the bidirectional coupling between deforestation and transmission (MacDonald & Mordecai 2019). We then explain our specific contribution: by linking land-cover composition to measured microclimate and to human biting rate (HBR) at well-defined spatial scales, we identify a proximal mechanism-transitional mosaics near households that combine intermediate forest cover and nearby flood-prone vegetation (within 250–500 m) generate warmer maximum temperatures and lower relative humidity, conditions under which vectors bite more intensely. This interpretation is coherent with evidence that weather variability and extremes modulate malaria risk in the Brazilian Amazon (Arisco 2025) and aligns with operational guidance emphasizing integration of environmental management with vector control (WHO 2015). The revised paragraph makes these links explicit with the suggested citations.
REWRITTEN: These findings are consistent with the frontier malaria hypothesis, which anticipates a non-linear relationship between land-use change and malaria risk along settlement frontiers: risk peaks at intermediate forest conversion (≈50% forest cover) and declines as landscapes and social systems stabilize [40,41]. Empirical and modeling studies links deforestation dynamics to transmission and documents feedbacks whereby disease burden can dampen subsequent clearing [42]. We extend this literature by specifying a proximal pathway: transitional mosaics near households that combine intermediate forest cover and flood-prone vegetation within 250–500 m exhibit higher HBR, consistent with warmer maximum temperatures and lower relative humidity that favor vector activity and breeding. Sustained transmission also depends on the prevalence and duration of asymptomatic and subpatent infections, which in frontier settings can maintain transmission even as reported cases fall. Programmatically, this supports integrated strategies that pair environmental risk targeting with enhanced detection of low-density infections (e.g., more sensitive diagnostics in foci investigations) and tailored case management, aligning with evidence that weather/climate variability and extremes modulate transmission in the Brazilian Amazon [43] and with operational guidance to integrate environmental management with vector control as emphasized by the Global Technical Strategy for Malaria (WHO 2015 [44]). Together, these insights reconcile the observed intermediate-peak non-linearity with a testable mechanism, landscape-driven microclimate and floodable vegetation around households, while incorporating the human reservoir component, thereby clarifying where and when local interventions are most effective.
Effective control and elimination in the Amazon should be frontier-aware and scale-explicit. Annual, high-resolution land-cover surveillance (e.g., MapBiomas [23]) coupled with site-specific microclimate monitoring can prioritize flood-prone vegetation within 250–500 m of households and time interventions to warmer, drier evening periods. Embedding these landscape–microclimate triggers into Brazil’s malaria elimination strategy, alongside vector control, focal habitat management, enhanced case detection for asymptomatic carriers, and radical cure, targets the window in which risk peaks in transitional landscapes and can accelerate progress toward elimination [40-45].
Q33) The authors should include a more in-depth discussion of how these results will help inform malaria intervention stratification and surveillance in the Amazon, and what they mean for malaria elimination. The authors do not discuss Brazil’s malaria elimination plan.
R33) Thank you for this valuable comment. We have expanded the Discussion to explicitly explain how our findings inform malaria intervention stratification and surveillance in the Amazon and how they align with Brazil’s Plano Nacional de Eliminação da Malária. Our analyses revealed a consistent and actionable signal: floodable vegetation within 250–500 m of households—through its effects on higher maximum temperature and lower relative humidity—predicts increased Nyssorhynchus darlingi biting rates. This defines an operational environmental unit for vector control.
We now specify that programs can:
(i) Risk-stratify communities by annually updating high-resolution land-cover data (e.g., MapBiomas) to identify transitional frontier areas and households bordered by floodable vegetation;
(ii) Time vector control to warmer, drier evening periods when biting activity intensifies;
(iii) Prioritize environmental management and larval habitat suppression in floodable patches near dwellings; and
(iv) Integrate case-based surveillance and radical cure for P. vivax where transitional landscapes sustain residual transmission (de Castro 2006; MacDonald & Mordecai 2019; Laporta 2025; Arisco 2025).
We further emphasize that these findings operationalize key pillars of Brazil’s Malaria Elimination Plan—fine-scale risk stratification, foci investigation and rapid response, strengthened vector control, and P. vivax radical cure—by identifying where (250–500 m buffers around floodable vegetation) and when (warmer, drier evening periods) interventions should be targeted. This addition clarifies how landscape–microclimate indicators can be integrated into municipal surveillance dashboards to trigger localized IRS/LLIN operations, focal larval source management, and intensified case detection in frontier municipalities, thereby supporting Brazil’s national progress toward malaria elimination (WHO 2015; Brasil 2022).
Q34) Figures & Tables
• Figures 1, 3, 4, 5, 6, 8, 9, and 10 are not visible. I think there was an upload issue.
R34A) Sorry for this issue. The figures were generated in high resolution, and it appears that the submission system could not support their file sizes. We have now reduced the image sizes to prevent any upload issues in future submissions.
• Tables 3 & 4: Regression equations should be replaced with beta and confidence intervals.
R34B) Thank you. We have revised both Tables 3 and 4 to include effect sizes as requested. The table captions and Methods section were updated to explicitly describe the model specification and reporting format (β with 95% CI and p). The previous regression equations were removed, and effect sizes are now presented in a standard epidemiological/ecological format to improve interpretability and facilitate cross-study comparison.
Changes implemented:
Tables 3 and 4: Regression equations replaced with β coefficients, 95% confidence intervals, and p-values.
Table 3 (Land cover): For each buffer radius (100, 250, 500 m), separate linear models were fit with the land-cover class as the focal predictor and temperature and relative humidity as covariates. Results are now reported as β (95% CI), p for each class × buffer combination.
Table 4 (Microclimate): Site-level linear models were fit for each microclimatic predictor (temperature min/mean/max; humidity min/mean/max), reporting β (95% CI), p.
These revisions standardize the reporting format and enhance clarity and comparability of the results
- peer review recommendation: accept
REVIEWERS COMMENTS
About the reviewerREVIEWER #1
No comments
REVIEWER #2
Thank you for the correction, which improved the initial text. However, some issues remain.
First, the figures are all interesting and well done; however, several are redundant or incremental. Please consider moving some of them to the Supporting Material.
There are also remaining issues of consistency and coherence throughout the text that need revision. The Results section, in particular, still has a poor flow of ideas and should be reorganized. I started reading the Discussion section, but the first paragraph made it difficult to proceed further.
Specific comments:
Lines 53–58: The paragraph ends by referring to the extra-Amazonian region, while your study area is in the Amazon. Please revise this paragraph for coherence with the actual study area.
Line 60: Nyssorhynchus darlingi should be italicized, as it is a species name.
Lines 65–66: The statement “reduced canopy cover is associated with… altered precipitation regimes” is unclear. Altered precipitation regimes are generally related to the movement of wet air masses rather than canopy cover. Please revise.
Line 68: Consider adding “deforested Amazonian communities” to maintain coherence with the paragraph’s focus.
Line 74: The term “sustained human mobility” is ambiguous. Consider simplifying to “human mobility.”
Lines 81–83: The phrase “Few studies” must be followed by appropriate citations. Which studies are you referring to?
Line 108: Replace “control” with “elimination.”
Line 207: Close the open bracket.
Lines 208–209: Do not cite the Supporting Material again here. Also, ensure consistency in terminology (use either SM1 or SM-1, not both).
Line 238: The equations contain illegible symbols. Please revise.
Line 241: Remove the bold formatting from “06 dimensionality reduction.”
Line 313: The word “astronomical” is not appropriate in this context. Please revise.
Figure 8: The legend for spatial scales is not visible. Please revise.
Figure 10: The inverse relationship between temperature/humidity and HBR may be confounded by the timing of dusk when collections started.
Figures 11–15: Panels A and B are visually appealing but redundant. Consider clarifying or simplifying.
Lines 411–452: The argument here is unclear. Consider simplifying to something like: “Zones differ, as shown by how the same analysis identifies different key predictors across zones.”
Lines 455–464: This section does not provide a good synthesis of the Results. Please revise.
AUTHORS’ RESPONSE TO THE REVIEWERS
We are deeply grateful to the editor and reviewer for the highly detailed and constructive feedback provided. Their effort, care, and thoroughness have greatly strengthened and refined our study. We sincerely appreciate the time and expertise dedicated to improving the quality of this work.
Point by Point REVIEWER COMMENTS:
Reviewer: 2
Q1) Thank you for the correction, which improved the initial text. However, some issues remain. First, the figures are all interesting and well done; however, several are redundant or incremental. Please consider moving some of them to the Supporting Material.
R1) Thank you for the observation. Indeed, some figures do not need to appear in the main text, and we have moved them to the supplementary material. Specifically, (old version) Figures 3, 9, and Figures 11 to 15 have been transferred to SM3.
Q2) There are also remaining issues of consistency and coherence throughout the text that need revision. The Results section, in particular, still has a poor flow of ideas and should be reorganized. I started reading the Discussion section, but the first paragraph made it difficult to proceed further.
R2) Thank you for this. We agree that the Results section was fragmented, and we have revised it to provide a clearer and coherent flow of ideas. We also reduced the text where possible without omitting or altering the description of any results. In addition, we removed figures whose contribution was incremental, retaining only those necessary to support the main findings.
Specific comments:
Q3) Lines 53–58: The paragraph ends by referring to the extra-Amazonian region, while your study area is in the Amazon. Please revise this paragraph for coherence with the actual study area.
R3) Thank you for raising this point. In this paragraph, the reference to the extra-Amazon region is meant to contextualize the national malaria burden by indicating that, outside the Amazon, the majority of reported cases in Brazil are imported from Amazonian areas or from sub-Saharan Africa. We adjusted the text to ensure coherence with the study’s Amazonian focus and to avoid potential ambiguity.
REWRITTEN: In Brazil, malaria transmission is largely confined to the Amazon. In other regions of the country, where the number of reported infections is low, approximately 80% of the cases originate from Amazonian areas or from sub-Saharan Africa
Q4) Line 60: Nyssorhynchus darlingi should be italicized, as it is a species name.
R4) Thank you for noting this. The species name has now been italicized.
Q5) Lines 65–66: The statement “reduced canopy cover is associated with… altered precipitation regimes” is unclear. Altered precipitation regimes are generally related to the movement of wet air masses rather than canopy cover. Please revise.
R5) Thank you for the observation. We agree that the original fragment could lead to misinterpretation. We revised the sentence to clarify that reduced canopy does not directly alter precipitation regimes. The text now states that reduced canopy cover increases temperature and decreases humidity, and may indirectly influence local-to-regional precipitation patterns through changes in surface energy balance and convection.
Q6) Line 68: Consider adding “deforested Amazonian communities” to maintain coherence with the paragraph’s focus.
R6) Thank you for the suggestion. We have revised the sentence to include ‘deforested Amazonian communities’ to improve coherence with the paragraph’s focus.
Q7) Line 74: The term “sustained human mobility” is ambiguous. Consider simplifying to “human mobility.”
R7) Thank you for the comment. We have revised the text by replacing ‘sustained human mobility’ with ‘human mobility’ to improve clarity.
Q8) Lines 81–83: The phrase “Few studies” must be followed by appropriate citations. Which studies are you referring to?
R8) Thank you for highlighting this point. We have revised the sentence to remove the need for additional citations.
ADJUSTED: In contrast, the effects of key HBR-modulating factors in relation to the unique ecological, demographic, and microclimatic characteristics of remote, malaria-affected settlements within the Brazilian Amazon is still not well understood.
Q9) Line 108: Replace “control” with “elimination.”
R9) Thank you for this suggestion. We agree that ‘elimination’ is more appropriate than ‘control’. We have therefore implemented this change at line 105, as well as in lines 21, 34, 77, and where the same wording appeared and the revision remained contextually appropriate.
Q10) Line 207: Close the open bracket.
R10) Done! Thank you for drawing our attention to this detail.
Q11) Lines 208–209: Do not cite the Supporting Material again here. Also, ensure consistency in terminology (use either SM1 or SM-1, not both).
R11) Thank you for the observation. We have removed the repeated citation of the Supporting Material and standardized the terminology consistently throughout the manuscript.
Q12) Line 238: The equations contain illegible symbols. Please revise.
R12) Thank you for noting this. The equation has been reformatted to ensure full legibility across the submission system. The revised version uses standard subscript notation to avoid rendering issues.
ADJUSTED: The model was specified as: HBR_ij = β0 + β1(TempMax_ij) + β2(HumidMin_ij) + β3(ForestFormation_ij) + β4(FloodableVegetation_ij) + u_j + ε_ij; where β0 is the intercept, β1–β4 are fixed-effect coefficients for the selected predictors, u_j is the random intercept for ecological zone j, and ε_ij is the residual error term.
Q13) Line 241: Remove the bold formatting from “06 dimensionality reduction.”
R13) Done! Thanks!
Q14) Line 313: The word “astronomical” is not appropriate in this context. Please revise.
R14) Thank you for the comment. We have removed the term ‘astronomical’ and revised the sentence to use appropriate terminology (austral spring and winter).
ADJUSTED Although all sites lie within the tropical Amazon, their geographic settings and the season of sampling (SM3-G) produce distinct microclimates: austral spring in Calçoene (23 Nov–1 Dec 2021) and Coari (23 Nov–9 Dec 2022), and austral winter in Barcelos (22 Jun–4 Jul 2022) and Atalaia-Benjamin (10–26 Jul 2023).
Q15) Figure 8: The legend for spatial scales is not visible. Please revise.
R15) Thanks! We revised Figure 8 to ensure full visibility of the legend indicating the spatial scales.
Q16) Figure 10: The inverse relationship between temperature/humidity and HBR may be confounded by the timing of dusk when collections started.
R16) Thank you for this observation. We have clarified in the Results section that the inverse temperature/humidity–HBR relationship may partly reflect dusk-related temporal covariation due to the fixed sampling period (18:00–00:00). We also note that this does not affect the inferential results, which were based on site-level aggregated data and mixed-effects models, and are therefore not influenced by within-night temporal patterns.
INCLUDED:Because all collections occurred between 18:00 and 00:00, the inverse temperature–humidity pattern partly reflects dusk-related covariation, but model inference was based on site-level aggregated data and mixed-effects models that are not influenced by within-night temporal structure.
Q17) Figures 11–15: Panels A and B are visually appealing but redundant. Consider clarifying or simplifying.
R17) Thank you for this observation. We agree that Panels A and B conveyed overlapping information. To improve clarity and reduce redundancy, we have removed Panel B from Figures 11–15 and transferred it to the Supplementary Material.
Q18) Lines 411–452: The argument here is unclear. Consider simplifying to something like: “Zones differ, as shown by how the same analysis identifies different key predictors across zones.”
R18) We thank the reviewer for this helpful comment. We have revised the section to clarify the overall argument and provide a more streamlined interpretation. The text was reorganized to (i) succinctly describe the global PCA pattern, (ii) identify the key ecological gradient underlying HBR variation, and (iii) explicitly highlight that each zone exhibits different dominant predictors despite the use of the same variables and analytical structure. We also simplified the zone-by-zone descriptions to emphasise these contrasts more clearly. In addition, we have adjusted the figures (removing the redundant Panel B) and moved Figures 11–15 to the Supplementary Material, following earlier recommendations.
Q19) Lines 455–464: This section does not provide a good synthesis of the Results. Please revise.
R19) Thank you for highlighting this point. We have fully revised this section to provide a clearer and more concise synthesis of the main results and to avoid redundancy with subsequent paragraphs.
EXTRA:Additionally, we revised the SM1 spreadsheet (per-event tab) by replacing the collectors’ names in the COLLECTORS (old version) column with the number of simultaneous collectors for each event (renamed as SIMCOLLECTORS). This preserves the privacy of field personnel while maintaining analytical integrity, as the analysis used the number of simultaneous collectors rather than their identities.
- peer review recommendation: accept
REVIEWERS COMMENTS
About the reviewerREVIEWER #1
No comments
REVIEWER #2
The Results and Discussion sections are now more appropriate. However, I’ve noticed that a Limitations subsection is still needed.
- peer review recommendation: accept