Effect of Cooling Rate on the Secondary Dendritic Spacing of a Horizontally Solidified 6xxx Series Aluminum Alloy
Abstract
The 6xxx series alloys [Al-Mg-Si] are valued for their excellent mechanical and electrical properties, making them suitable for power conductors in non-steel core transmission and distribution lines. This study investigates the growth of the dendritic microstructure in the Al-0.6wt%Mg-0.8wt%Si-0.2wt%Fe alloy, specifically under horizontally solidified conditions. We employ both experimental techniques and mathematical modeling to predict the growth of the secondary dendritic arm spacing (SDAS). Samples of the as-cast alloy were obtained using a water-cooled horizontal solidification device. Our research starts with a mathematical model that was originally developed for solidification conditions close to thermodynamic equilibrium (low cooling rates - TR). We extend this model to address non-equilibrium conditions (high TR) by incorporating the reverse diffusion parameter β into our analysis. The experimental relationships for SDAS as functions of TR and local solidification time (tSL) are expressed with the equations: SDAS = constant × (TR)(-1/3) and SDAS = constant × (tSL)(1/3). We found a good agreement between the results from our iterative method and the experimental values. Additionally, we utilized a recently developed theoretical formulation for nonequilibrium nucleation to predict the Gibbs-Thomson coefficient under these conditions.
Keywords:
Multicomponent alloys; Unsteady-state horizontal solidification; Dendritic growth models
1. Introduction
Although the development of computational models based on methods such as phase-field to simulate solidification, including the prediction of the growth of dendrite arms in multicomponent alloys, is continuing to rise, there is still a need to develop simpler models that are less computation-intensive and that furnish reasonable predictions of the key microstructure features1-12. Easton et al.13 compared experimental SDAS values of six different multicomponent Al-alloys with RB model predictions and reported that the general agreement was shown to vary from 20 to 70%. Due to the complexity of dendritic growth14-17, most of the theoretical SDAS formulas in the literature have been developed for binary alloys18-21. An extension of the model proposed by Rappaz and Thévoz22,23, which is based on dendrite ripening as the main coarsening mechanism, to multicomponent alloys has been proposed by Rappaz and Boettinger (RB)24. On the other hand, it has been observed that RB calculations overestimate the experimental scatter of Al-Si-Cu25 and Al-Si-Mg (356)26 alloys.
The predictions of an expression proposed by Ferreira et al.27,28 for the growth of SDAS in multicomponent alloys encompassing the back diffusion parameter are shown to fit quite well with the experimental results of Al-based multicomponent alloys. Necessary thermophysical parameters, such as the surface energy and the Gibbs-Thomson coefficient, are calculated using a technique based on Butler’s formulation and thermodynamic databases. A horizontal solidification setup is used to promote a large spectrum of cooling rates along the length of the same alloy casting, allowing, consequently, a wide range of SDAS to be characterized.
2. Mathematical Approaches
2.1. Predictive theoretical models
Assuming that dendrite ripening is the most important coarsening mechanism, several models were developed to predict the growth of the dendrites during solidification19-23. The well-accepted coarsening model proposed by Feurer and Wunderlin19 for relating SDAS to the local solidification time () can be written as:
where M is defined as follows
where is the Gibbs-Thomson coefficient, is the diffusion coefficient in the liquid, is the redistribution coefficient, is the liquidus slope, is the nominal composition, and is the final liquid composition at base of the dendrite (generally assumed to be the eutectic composition, ).
Rappaz and Boettinger (RB)24 proposed a similar analysis for multicomponent alloys, but while Eq. (1) remains valid, the expression for M becomes:
where the sums extend over all of the solute elements in the multicomponent alloy.
On the other hand, Ferreira et al.27, Ferreira28 and Ferreira et al.29 have proposed a new approach incorporating back diffusion effects from the RB model. An iterative solution scheme encompassing simple steps to correct the SDAS taking in account both the effective partition coefficient30, , and a general solution for the back diffusion parameter derived by Voller31:
where and are given by:
where is the tip growth rate, is the diffusion length scale for the solid phase, and is the solute fraction which is given by the following expression:
2.2. Calculation of Gibbs-Thomson coefficient
In this paper, high thermal gradients are under consideration. Consequently, the equilibrium dislocated Gibbs-Thomson coefficient can only be calculated through the thermal field tensor for a given thermal gradient by considering the nucleation model recently deduced by Ferreira28,29. To solve the thermal field tensor, a simultaneous solution of the non-equilibrium surface tension , surface stress tensor 32, surface energy , nucleation angle and the derivatives with respect to the nucleation radius of primitive variables, such as surface energy , bulk entropy , and nucleation angle needed to be determined33-37. The thermal field tensor28 can be expressed as
and.
where , , , and are the internal, kinetic, potential energies and work, respectively.
And the nucleation formulation,
The theoretical prediction of nucleation variables in terms of the thermal gradient for the phase can be found in Table 1.
3. Materials and Methods
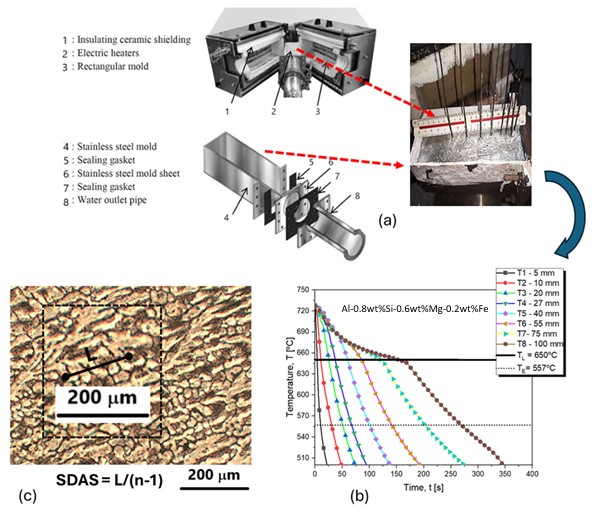
A horizontal solidification experiment was performed with the Al-0.8wt%Si-0.6wt%Mg-0.2wt%Fe alloy using a water-cooled device that promotes solidification in the horizontal direction25,26. It was designed to operate with 220 V voltage, 6000 W power, 27 A current and maximum temperature (peak) of 1300 ºC, consisting of an external stainless-steel housing with dimensions of approximately 320 x 288 mm and pre-molded ceramic fiber insulation. Internally, the heating elements are embedded in the fiber through electrical resistances with power controlled by temperature sensors that allow the stabilization of different levels of superheating in the liquid metal, as well as providing adequate thermal insulation, avoiding heat loss through the non-cooled sides and the base of the mold, thus allowing solidification to occur in one direction (horizontal).
To produce the studied alloy, ingots of pure elements (Al and Si) and the base Mg-7%Al alloy were sectioned in small quantities, following a rigorous stoichiometric calculation that considered the volume of the ingot mold and the capacity of the crucible. These quantities were then weighed on an analytical electronic balance with a precision of 0.01 g. The aluminum was placed in a silicon carbide crucible coated internally with of alumina-based paint layer to prevent contamination and then taken to a muffle furnace. After the aluminum had completely melted, the crucible was removed from the furnace and the Si was added to the liquid metal, and the previous step was repeated to add the calculated amount of Mg through the base alloy that was wrapped in aluminum foil.
Once the alloy was produced, it was poured into the horizontal ingot mold of the solidification device, as shown in Figure 1a, whose internal lateral surfaces were coated with layers of alumina, already containing 8 type K thermocouples properly positioned at 5, 10, 15, 20, 30, 50, 70 and 90 mm in relation to the cooling chamber. In turn, temperature profiles (Figure 1b) were obtained using a FieldLogger recorder, configured to record a point every two tenths of a second, through the 8 thermocouples. The generated thermal data were used to calculate the solidification thermal parameters, such as VL, TR and tSL. It is worth noting that after obtaining the ingot, the positions of the thermocouples were checked again, as shown in Figure 1a. The resulting ingot was subjected to metallographic examinations.
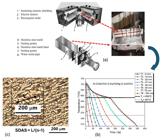
(a) Horizontal solidification device with details of thermocouple positioning, (b) and (c) temperature profiles and typical solidification microstructure showing the SDAS measurement technique, respectively.
To reveal the typical solidification structures, the as-cast ingot was sectioned longitudinally and then subjected to metallographic techniques. Subsequently, a chemical attack was carried out on its surface by immersing the surface of the piece in Poulton (60 ml of HCl, 30 ml of HNO3, 5 ml of HF and 5 ml of H2O) and Keller (15 ml of HNO3, 10 ml HCl, 5 ml of HF and 70 ml H2O) solutions to reveal the macrostructure and microstructure, respectively. The SDAS was measured as proposed by McCartney and Hunt38. It was carried out by calculating the SDAS values by averaging the distances between adjacent secondary dendritic arms over the longitudinal section of a primary dendrite, as shown in Fig.1c, and about 20 measurements were performed for each of the analyzed positions. SDAS measurements were performed using image processing software Image. The measured SDAS values were correlated with tSL.
4. Results and Discussion
The thermal data obtained and shown in Figure 1b were used to determine the solidification thermal variables (VL, TR and tSL). It was noted that based on the liquidus temperature (TL=650°C) of the investigated alloy, a horizontal line was drawn at y = TL in this graph of T = f(t). The intersection points represent the moment at which the liquidus isotherm reached a given position, which, in this case, is the position at which the thermocouple was inserted into the horizontal ingot mold. Eight experimental ordered pairs (P, t) were generated, corresponding to each of the eight thermocouples, which allowed the generation of a power-type fitting curve in the form P(t) = 1.94(t)0.77, with the best possible fit to the points obtained experimentally, as determined by the software and the Levenberg Marquardt Algorithm for fitting nonlinear curves.
The growth rate was calculated by applying the first derivative in P=f(t), trat is, VL= d(1.94(t)0.77)/dt, which after a mathematical adjustment resulted in the expression given by VL=1.82(P)-0.30. Similarly, the cooling rate was determined by the application of the first derivative in each cooling curve (t x t) generated by the eight thermocouples, i.e., dT/dt, selecting small time intervals, whose lower and higher limits were points immediately previous and posterior, respectively, to the point of intersection between the cooling curve and the line TL. It was found an equation given by TR=305.7(P)-1.46.
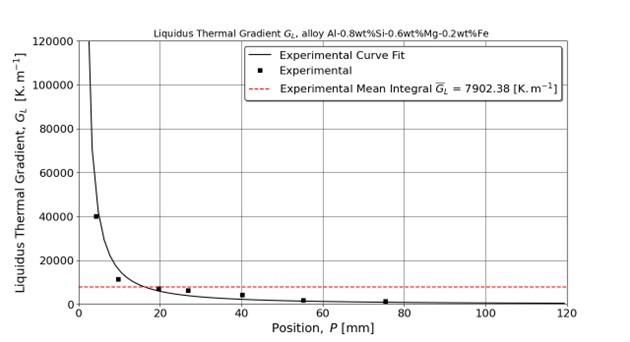
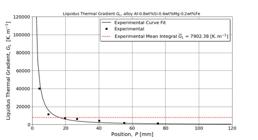
Figure 2 illustrates the experimental thermal gradients for horizontal solidification at various positions from the chill, with a focus on calculating the mean thermal gradient to determine the mean Gibbs-Thomson coefficient.
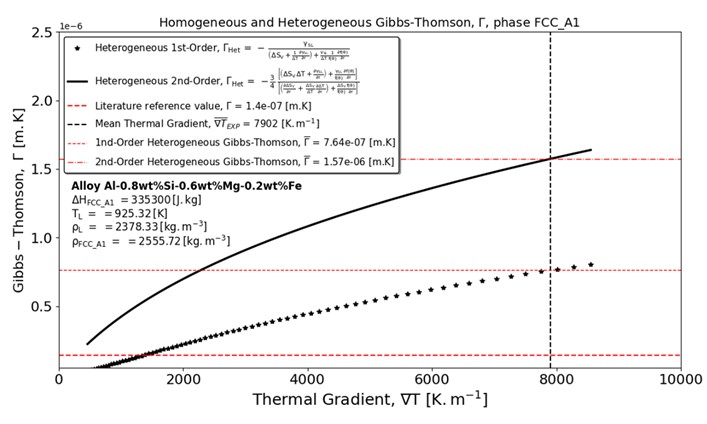
In Figure 3, 1st- and 2nd-order heterogeneous nucleation Gibbs-Thomson coefficients are calculated as a function of the thermal gradient for Al -Phase. The exact phase nucleation formulation is a 2nd-order dependence on nucleation radius, as recently reported in28. By taking a monocrystal as an example, the author has stated that thermodynamically, grain and nucleus are the same physical entities, as thermodynamics predicts the grain size for equilibrium or any non-equilibrium conditions. In contrast, polycrystalline solids exhibit nuclei concurrent growth. The surface tension, stress, energy and Gibbs-Thomson coefficient increase with the increase in the thermal gradient, leading to more refined and deformed nuclei and, subsequently grains positioned near the chill benefit from high thermal gradients. Conversely, lower values are observed in regions far from the chill, where low thermal gradients prevail. The effects of thermal gradient on these properties are presented in Table 1.
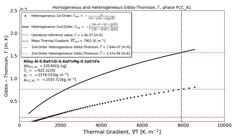
Heterogeneous first- and second-order Gibbs–Thomson Γ against microscopic thermal gradient.
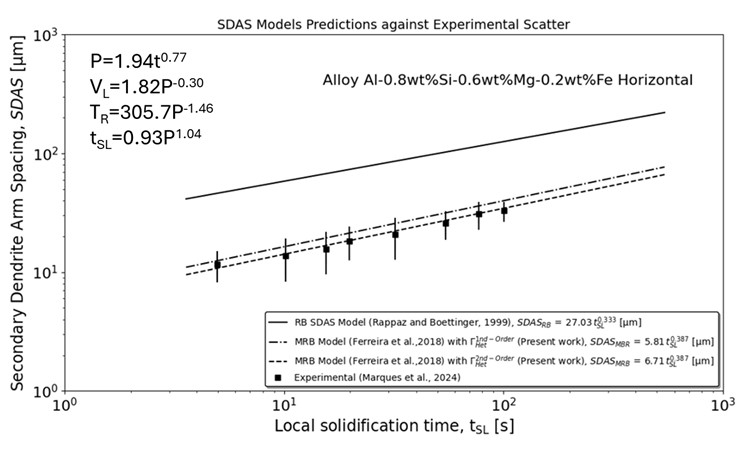
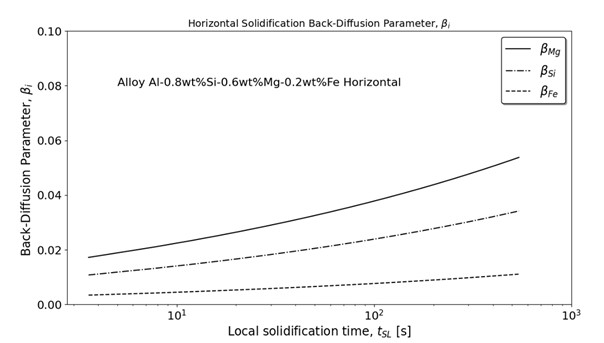
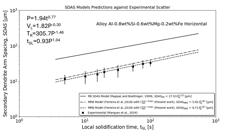
The local solidification time (tSL) was determined experimentally by the difference between the passage times of the solidus and liquidus isotherms through a given position of the thermocouple. Figures 4 and 5 present the variation of SDAS and the back-diffusion parameter as a function of tSL, respectively. Thermophysical properties, phase diagram data and diffusion coefficients can be found in Table 2. As noted, an experimental theoretical analysis was conducted between the experimentally obtained SDAS values and those simulated by the RB24 and Ferreira et al.27,28 mathematical approaches of and 1st and 2nd order nucleation radius Gibbs-Thomson. This was evidenced with an excellent agreement with the mathematical approach of Ferreira et al.27,29. It is important to highlight that the mathematical approach of Ferreira et al. was developed for non-equilibrium solidification conditions, that is, for high cooling rates, and unsteady-state solidification conditions. The back-diffusion parameter depends on the kinetics and can assume, the Lever Rule , no back-diffusion in the solid phase, Scheil equation , and finite diffusion for 0. In the present study, as demonstrated in Figure 5. The results are close to those predicted by Scheil equation for all solutes.
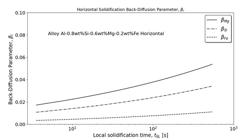
The back-diffusion parameter , which governs the diffusional coupling between the solid phase and the melt, exhibits dependence on kinetic factors. It can assume a Lever Rule value of , implying infinite diffusion in the solid phase, a Scheil equation scenario where , indicating no back-diffusion and finite diffusion in solid for 0. Notably, this study's results concur with the Scheil equation predictions for all solutes examined, as demonstrated in Figure 5. For all solutes, back-diffusion coefficients increase as solidification times increase, i.e., for low thermal gradient.
5. Conclusions
The following conclusions have been derived from the present investigation:
-
A transient solidification experiment was carried out on a multicomponent alloy to determine its liquidus tip cooling and growth rates, as well as thermal gradients. From this experimental data, a mean integral thermal gradient was calculated;
-
The SDAS measurement was performed on the solidified sample, and both the experimental and literature theoretical M-values were found to be equal;
-
The equilibrium of the Al- phase was dislocated by solving the thermal field tensor for several thermal gradients until the mean experimental value was achieved, when the surface tension, stress, energy, and Gibbs-Thomson coefficient were subsequently calculated and applied to SDAS models.
-
SDAS model predictions matched experimental scatter, especially notable in the case of the 2nd-order Gibbs-Thomson coefficient. In contrast, results were similarly accurate for the 1st-order Gibbs-Thomson coefficient in the present study.
6. Acknowledgement
The authors are grateful the IFPA - Federal Institute of Education, Science and Technology of Pará (EDITAL 04_2024_DPPI_PROPECT SERVIDOR/Campus Belém and EDITAL 07/2023-PIBIC-PQ/IFPA/PROPPG/CNPq), PPGEMAT-IFPA, UFPA - Federal University of Pará, and CAPES – Coordenação de Aperfeiçoamento de Pessoal de Nível Superior- Brasil (PDPG/CAPES (Processo: 88881.707312/2022-01) and CNPq - Conselho Nacional de Desenvolvimento Científico e Tecnológico ( Processo: 301502/2022-6).
7. References
- 1 Guan R-G, Tie D. A review on grain refinement of aluminum alloys: progresses, challenges and prospects. Acta Metall Engl Lett. 2017;30:409-32.
- 2 Cochard A, Zhu K, Joulié S, Douin J, Huez J, Robbiola L, et al. Natural aging on Al-Cu-Mg structural hardening alloys–Investigation of two historical duralumins for aeronautics. Mater Sci Eng A. 2017;690:259-69.
- 3 Zaeem MA. Advances in modeling of solidification microstructures. JOM. 2015;67:1774-5.
- 4 Qi Z, Cong B, Qi B, Sun H, Zhao G, Ding J. Microstructure and mechanical properties of double-wire+ arc additively manufactured Al-Cu-Mg alloys. J Mater Process Technol. 2018;255:347-53.
- 5 Barros A, Cruz C, Silva AP, Cheung N, Garcia A, Rocha O, et al. Horizontally solidified Al–3 wt% Cu–(0.5 wt% Mg) alloys: tailoring thermal parameters, microstructure, microhardness, and corrosion behavior. Acta Metall Engl Lett. 2019;32:695-709.
- 6 Chen R, Xu Q-Y, Liu B-C. Simulation of the dendrite morphology and microsegregation in solidification of Al–Cu–Mg aluminum alloys. Acta Metall Engl Lett. 2015;28:173-81.
- 7 Kurz W, Fisher DJ, Trivedi R. Progress in modelling solidification microstructures in metals and alloys: dendrites and cells from 1700 to 2000. Int Mater Rev. 2019;64:311-54.
- 8 Spittle JA, Brown SGR. Numerical modelling of permeability variation with composition in aluminium alloy systems and its relationship to hot tearing susceptibility. Mater Sci Technol. 2005;21:1071-7.
- 9 Easton MA, Wang H, Grandfield J, Davidson CJ, StJohn DH, Sweet LD, et al. Observation and prediction of the hot tear susceptibility of ternary Al-Si-Mg alloys. Metall Mater Trans, A Phys Metall Mater Sci. 2012;43:3227-38.
- 10 Ghassemali E, Riestra M, Bogdanoff T, Kumar BS, Seifeddine S. Hall-Petch equation in a hypoeutectic Al-Si cast alloy: grain size vs. secondary dendrite arm spacing. Procedia Eng. 2017;207:19-24.
- 11 Donadoni B, de Gouveia GL, Garcia A, Spinelli JE. A comparison of experimental time-secondary dendritic spacing and coarsening models for Al-Si-Cu alloys. J Manuf Process. 2020;54:14-8.
- 12 Ogata CT, Reyes RV, Garcia A, Spinelli JE. Length scale of the dendritic array tailoring strength of a 5052 aluminum alloy. Mater Res. 2019;22:e20180561.
- 13 Easton M, Davidson C, St John D. Effect of alloy composition on the dendrite arm spacing of multicomponent aluminum alloys. Metall Mater Trans, A Phys Metall Mater Sci. 2010;41:1528-38.
- 14 Chen R, Shi Y, Xu Q, Liu B. Effect of cooling rate on solidification parameters and microstructure of Al- 7Si- 0.3 Mg- 0.15 Fe alloy. Trans Nonferrous Met Soc China. 2014;24:1645-52.
- 15 da Silva C, Soares T, Cheung N, Garcia A, Reis DA, Brito C. Dendritic spacing and macrosegregation affecting microhardness of an Al-Si-Mg alloy solidified under unsteady state conditions. Mater Res. 2019;22:e20190390.
- 16 Canté MV, Lima TS, Brito C, Garcia A, Cheung N, Spinelli JE. An alternative to the recycling of Fe-contaminated Al. J. Sustain. Metall. 2018;4:412-26.
- 17 Costa M, Souza F, Magno I, Loayza C, Nascimento J, Barros A, et al. Interrelation of solidification processing variables and microstructure of a horizontally solidified Al-based 319.1 alloy. Mater Sci. 2017;23:124-8.
- 18 Bouchard D, Kirkaldy JS. Prediction of dendrite arm spacings in unsteady-and steady-state heat flow of unidirectionally solidified binary alloys. Metall Mater Trans, B, Process Metall Mater Proc Sci. 1997;28:651-63.
- 19 Feurer U, Wunderlin R. Appendix 8. In: Kurz W, Fisher DJ, editors. Fundamentals of Solidification. Switzerland: Trans Tech Public; 1986.
- 20 Kirkwood DH. A simple model for dendrite arm coarsening during solidification. Mater Sci Eng. 1985;73:L1-4.
- 21 Mortensen A. On the rate of dendrite arm coarsening. Metall Trans, A, Phys Metall Mater Sci. 1991;22:569-74.
- 22 Rappaz M, Thevoz P. Solute diffusion model for equiaxed dendritic growth. Acta Metall. 1987;35:1487-97.
- 23 Rappaz M, Thévoz P. Solute diffusion model for equiaxed dendritic growth: analytical solution. Acta Metall. 1987;35:2929-33.
- 24 Rappaz M, Boettinger WJ. On dendritic solidification of multicomponent alloys with unequal liquid diffusion coefficients. Acta Mater. 1999;47:3205-19.
- 25 Costa TA, Moreira AL, Moutinho DJ, Dias M, Ferreira IL, Spinelli JE, et al. Growth direction and Si alloying affecting directionally solidified structures of Al–Cu–Si alloys. Mater Sci Technol. 2015;31:1103-12.
- 26 Lima JO, Barbosa CR, Magno IAB, Nascimento JM, Barros AS, Oliveira MC, et al. Microstructural evolution during unsteady-state horizontal solidification of Al-Si-Mg (356) alloy. Trans Nonferrous Met Soc China. 2018;28:1073-83.
- 27 Ferreira IL, Moreira AL, Aviz JA, Costa TA, Rocha OL, Barros AS, et al. On an expression for the growth of secondary dendrite arm spacing during non-equilibrium solidification of multicomponent alloys: validation against ternary aluminum-based alloys. J Manuf Process. 2018;35:634-50.
- 28 Ferreira IL. Assessment of Thermodynamic variables affecting phase nucleation. Physica B, Condensed Matter. 2024;695(416494)
- 29 Ferreira IL, Costaa NCA, Júniora GEMS, Gonzagaa FS, Moreiraa ALS. Computational analysis of transient solidification kinetics in aluminum-based multicomponent alloys for graphical LHTES modelling. Journal of Materials. 2025;3(1):40-51.
- 30 Wang CY, Beckermann C. A multiphase solute diffusion model for dendritic alloy solidification. Metall Mater Trans, A Phys Metall Mater Sci. 1993;24:2787-802.
- 31 Voller VR. On a general back-diffusion parameter. J Cryst Growth. 2001;226:562-8.
- 32 Gurtin MR, Murdoch AI. Surface stress in solids. Int J Solids Struct. 1978;14:431-40.
- 33 Ferreira DJS, Bezerra BN, Collyer MN, Garcia A, Ferreira IL. The use of computational thermodynamics for the determination of surface tension and Gibbs–Thomson coefficient of multicomponent alloys. Contin Mech Thermodyn. 2018;30:1145-54.
- 34 Jácome PA, Landim MC, Garcia A, Furtado AF, Ferreira IL. The application of computational thermodynamics and a numerical model for the determination of surface tension and Gibbs–Thomson coefficient of aluminum based alloys. Thermochim Acta. 2011;523:142-9.
- 35 Jácome PA, Fernandes MT, Garcia A, Ferreira AF, de Castro JA, Ferreira IL. Application of computational thermodynamics to the evolution of surface tension and Gibbs-Thomson coefficient during multicomponent aluminum alloy solidification. Materials Science Forum. 2016;869:416-422.
- 36 Hoar TP, Melford DA. The surface tension of binary liquid mixtures: lead+ tin and lead+ indium alloys. Trans Faraday Soc. 1957;53:315-26.
- 37 Gasior W, Pstruś J, Moser Z, Krzyżak A, Fitzner K. Surface tension and thermodynamic properties of liquid Ag-Bi solutions. J Phase Equilibria. 2003;24:40-9.
- 38 McCartney DG, Hunt JD. Measurements of cell and primary dendrite arm spacing in directionally solidifed aluminium alloys. Acta Metall. 1981;29:1851-63.
-
DATA AVAILABILITY
All the data discussed are directly presented in the paper and therefore they are automatically accessible.
All the data discussed are directly presented in the paper and therefore they are automatically accessible.