Computational Study of Amorphous Phase Formation in Ti53Cu39Ni8 and Ti50Cu42Ni8 Alloys
Abstract
Ti-based amorphous alloys are promising for biomedical applications due to their high mechanical strength, low modulus of elasticity, corrosion resistance, and biocompatibility. This study primarily utilized molecular dynamics simulations to investigate the glass-forming behavior of Ti53Cu39Ni8 and Ti50Cu42Ni8 alloys, using the LAMMPS code with a hybrid potential composed of the modified embedded atom method and Lennard-Jones potentials. Structural properties were analyzed using X-ray diffraction, pair distribution functions, and Voronoi polyhedra. The variation in viscosity with temperature in the supercooled liquid during cooling was calculated using the Green-Kubo method. Liquidus (TL) and solidus (TS) temperatures were determined from heating curves obtained at a rate of 1 K/ps. The glass transition temperatures (Tg) were obtained from cooling curves and compared with experimental measurements. Simulated and experimental XRD results confirmed that both alloys are fully amorphous, with TL, TS, and Tg increasing with higher titanium content. The reduced glass transition temperatures (Trg = Tg/Tₗ) were 0.437 for Ti53Cu39Ni8 and 0.430 for Ti50Cu42Ni8. The viscosity change was more pronounced in the Ti50Cu42Ni8 alloy, indicating greater thermal stability of the supercooled liquid near Tg, attributed to an increase in icosahedral clusters, reaching a 6% volume fraction at 300 K. Additionally, the predicted values of Tg from the simulations are in good agreement with experimental measurements.
Keywords:
Molecular dynamics; metallic glasses; shear viscosity; X-rays diffraction
1. Introduction
Over the years, titanium-based alloys have been used in various sectors of industry due to their wide range of properties and characteristics, including low density, high mechanical strength, and corrosion resistance, as well as their high biocompatibility. This last characteristic enables them to be widely used in biomedical applications.
In the crystalline state, titanium has two phases: α and β. At low temperatures, including room temperature, the α-phase with a hexagonal close-packed (HCP) lattice is the stable phase. At higher temperatures (above 883 °C), an allotropic transformation occurs, and the β-phase stabilizes under a body-centered cubic (BCC) lattice.
Although these important allotropic phenomena occur in pure titanium, several alloying elements can influence the phase transformation temperatures and are known as stabilizers. Elements that increase the phase transformation temperature are called α-stabilizers, while those that reduce it are known as β-stabilizers1. β-stabilizers can be classified into two types: β-isomorphs and β-eutectoids, both of which favor the formation of the β phase at lower temperatures. When relatively high cooling rates are imposed during processing, the β-phase can be retained, resulting in a metastable β-structure at room temperature. β-isomorph elements have total solubility in β-titanium; the higher the concentration of the β-stabilizing element, the lower the phase transformation temperature. In contrast, β-eutectoid elements have restricted solubility in titanium and usually form intermetallic compounds through eutectoid decomposition of the β phase.
In general, Ti-based alloys are prone to forming crystalline materials. However, in systems where the β-phase becomes unstable, an amorphous phase can be formed2 under proper processing conditions and specific chemical compositions. Although specific alloys have achieved a critical amorphous thickness greater than 10 mm3-11, Ti-based amorphous alloys processed by traditional routes exhibit only moderate glass-forming ability (GFA)12. Nevertheless, rapid advances in processing routes, such as additive manufacturing, overcome this drawback, allowing for the production of bulk parts13. Moreover, it has been found that amorphous alloys possess superior mechanical properties, ductility, and corrosion resistance compared to their crystalline counterparts14. Furthermore, Ti-based amorphous alloys feature a low elastic modulus, excellent biocompatibility, and high corrosion resistance15.
To date, various Ti-based amorphous forming systems have been identified13,15-25, demonstrating significant industrial and technological interest in these materials, especially in biomedical applications. When selecting a material for biomedical systems, biocompatibility is one of the most important criteria, alongside good mechanical and chemical properties. The current challenge is to create alloys that converge the previously mentioned characteristics, including low density, high toughness, wear resistance, and elevated thermodynamic stability. In this context, alloys should be composed primarily of elements that do not pose risks to the human body, utilizing systems with three or more elements to achieve stability. Structurally, these alloys can be formed by mixtures of structures that optimize their chemical and mechanical responses.
The search for new alloys can be conducted mainly through two different routes: experimental methods and computer simulations. Although the experimental method is relatively expensive, both economically and in terms of time, it is the best way to verify that a material meets the various requirements. On the other hand, computer simulations are relatively low-cost tools that can offer interesting predictions. One of the most widely used methods in the study of engineering materials is classical molecular dynamics (MD)26. MD is a well-established tool capable of providing information on various material properties at the atomic scale. It is based on Newton’s laws of motion, and its powerful predictive capacity strongly depends on the interatomic potential, which are mathematical functions that govern atomic interactions. In metals and alloys, some type of embedded atom method potentials is commonly used27. However, in special cases, other types can be employed, including hybrid potentials.
Choosing specific compositions that enable the production of bulk amorphous or glassy alloys is a significant challenge in the field of materials science and engineering.
Among the different tools used to select alloys with high GFA are computer simulations of shear viscosity (η), which is a fundamental property of fluids that describes their resistance to flow. In metallic alloys, η plays an important role at high temperatures, influencing the melting and solidification of materials. Generally, studying η in materials is essential for optimizing industrial processes and developing new materials with enhanced properties. In the liquid state, metallic materials exhibit remarkable viscous behavior, depending on several factors such as temperature, chemical composition, and the presence of impurities, among others. Overall, η decreases with increasing temperature28 and is lower in pure elements than in alloys due to differences in the physical and chemical properties of the various elements present in the alloys29.
In MD, the shear viscosity of a liquid is primarily determined using the direct method, commonly known as the Green-Kubo (GK) method30. This method involves calculating the viscosity in a homogeneous equilibrium system. The determination of η can be achieved by integrating the autocorrelation functions of the fluctuations in the stress tensor31.
where V represents the volume, kB the Boltzmann constant and T the temperature. Pαβ(t) denotes the element of the off-diagonal stress tensor at time t, and the operator <...> indicates the mean of the considered ensemble. Furthermore, α and β represent the spatial directions in the Cartesian system. The stress tensor is given by:
where, N is the number of particles in the system, mi is the mass of particle i, vi is the velocity of particle i, rij is the position vector between particles i and j, fij is the force between particles i and j, and the symbol x denotes the tensor product.
Considering the predictive capacity of MD in materials development, the goal of this paper is to study the formation of the amorphous phase in the Ti53Cu39Ni8 and Ti50Cu42Ni8 alloys. This study takes into account that both copper and nickel are β-stabilizing elements for titanium, utilizing the shear viscosity obtained through the Green-Kubo method.
2. Computer Methodology
Classical MD simulations were performed using the open-source LAMMPS code32. Both glass models were prepared using the melt-and-quench method: first, virtual samples with the proper stoichiometry were configured in a face-centered cubic lattice. These were then subjected to minimization at 0 K, followed by equilibration at room temperature (300 K) for 50 ps. After that, the samples were continuously heated at a rate of 1 K/ps until they reached a temperature sufficiently above the melting temperature of the alloys. At this temperature, the systems were stabilized for 50 ps, and the glass structures were obtained by rapidly quenching the liquids at a cooling rate of 1 K/ps until room temperature.
The starting configurations for each sample were obtained by randomly placing 32,000 atoms of the appropriate composition into a cubic simulation box. Periodic boundary conditions were applied in the three main directions to allow the box size to change throughout the simulation. All MD simulations were carried out with a timestep of 0.001 ps, and the pressure was set to zero. To obtain a realistic model during heating, the isothermal-isobaric (NPT) ensemble was used. During cooling, the cell size was adjusted to maintain zero pressure, and the structural configurations at different temperatures were collected. After adequate relaxation at each temperature of interest, the ensemble was switched to the NVT (constant number of particles, constant volume, and constant temperature) ensemble. At high temperatures, the model system was relaxed for 1 ns, and 1,000 atomic configurations were collected for structural and dynamics analysis then the shear viscosity was obtained. Additionally, as the temperature decreased, the relaxation time was increased by 0.01 ns at each 100 K. The shear viscosity was determined at different temperatures within the range of 1550 K to 650 K.
X-ray diffraction (XRD) patterns of the simulated amorphous alloys were computed based on the atomic configurations generated by the previously simulated alloys. The X-ray scattering intensities were calculated using a typical wavelength of Cu-Kα, λ = 1.54 Å, under the NVT ensemble at a temperature of 300 K.
It is worth noting that in all the runs of the MD simulations, a hybrid potential composed of the MEAM potential parametrized by33 and the LJ potential was used. The pair interaction parameters of the LJ potential are displayed in Table 1.
The Lennard-Jones potential parameters for a pair of unlike species (a and b) were determined from the known potentials of the individual species by employing the Lorentz Berthelot rules mixing rules36. These involve the arithmetic mean of the σ parameter and the geometric mean for the ε parameter. Post-processing was realized using Ovito37 and own codes in python.
In addition to the MD simulations, alloy samples in the form of melt-spun ribbons were produced by melt spinning technique and structurally characterized using XRD measurements, as well as thermally analyzed by differential scanning calorimetry (DSC) at a heating rate of 20 K/min (0.333 K/s). Details of the experimental procedure will be published in a future study as a continuation of this work.
3. Results and Discussion
Figure 1 displays the volume-temperature curves generated during heating at a rate of 1 K/ps for the Ti53Cu39Ni8 and Ti50Cu42Ni8 alloys, allowing for the determination of the solidus (TS) and liquidus (TL) temperatures of the alloys. Also shown in Figure 1b are snapshots of the atomic structures at three stages of the simulation: the initial sample with an ideal crystalline structure, the stabilized sample at 0 K, and the liquid state at 2000 K.

a) Volume vs. Temperature curves of the Ti53Cu39Ni8 and Ti50Cu42Ni8 alloys on heating stage and, b) Snapshots of the atomic structures of the alloy in the ideal crystalline solid state, crystalline state stabilized at 0 K and, liquid state. (yellow cooper, blue titanium, red nickel).
The values of TS and TL for the Ti53Cu39Ni8 alloy are 1498 K and 1605 K, respectively, while for the Ti50Cu42Ni8 alloy, they are 1487 K and 1580 K. The temperature intervals TL – TS for both alloys are 107 K and 93 K, respectively. This large temperature range could be related to off-eutectic compositions. Furthermore, it is observed that the increase in copper content reduces the phase transition temperature, which may be related to the fact that copper acts as a stabilizing element for β-titanium.
In general, the solidus and liquidus temperatures obtained by MD simulations are of a higher magnitude than those obtained in real experiments38. This is due to the influence of heating rates in MD, which are several orders of magnitude higher than those used in experiments. Thus, the temperatures obtained by MD are in good agreement with the experimental values. For instance, the reported TL of the Ti58Cu35.7Ni6.3 alloy is 1259 K. The difference in TL values for the Ti53Cu39Ni8 and Ti50Cu42Ni8 alloys obtained by MD is about 300 K higher than that of the Ti58Cu35.7Ni6.3 alloy. However, it should be noted that in many cases, the chemical composition can significantly influence the phase transition temperatures of the alloys. For instance, an increase of 2% in Ni content resulted in an approximately 70 K increase in the liquidus temperature of Ti-rich alloys39.
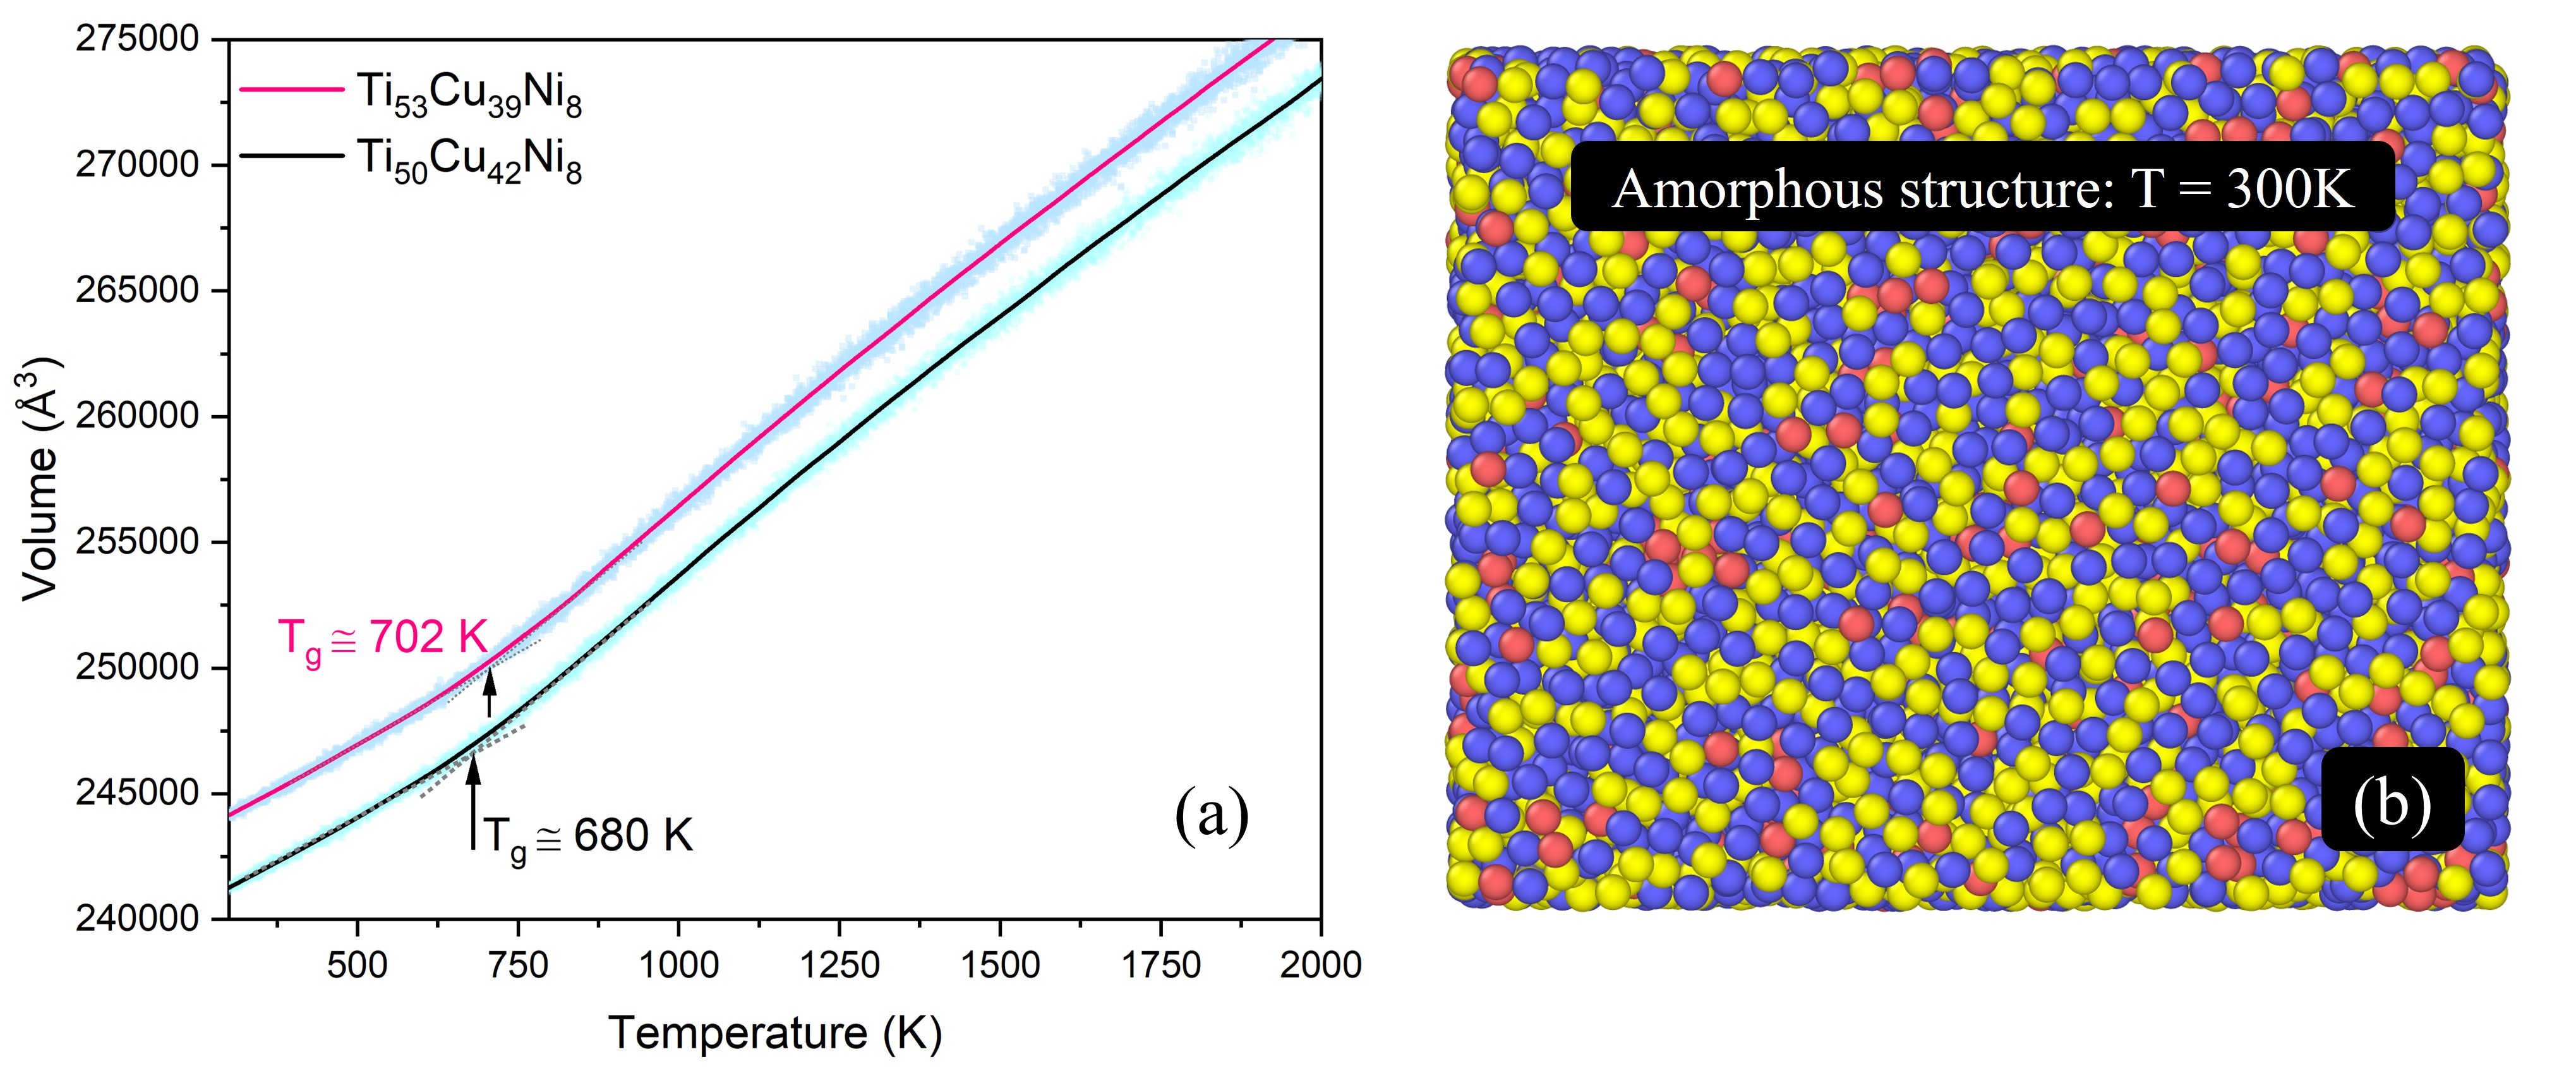
Figure 2 displays curves of V vs T obtained during the cooling stages at a rate of 1 K/ps, along with a snapshot of the amorphous structure at 300 K. Starting from high temperatures, it is possible to observe a continuous decrease in volume without any evidence of phase transformation. However, over a short range of temperatures, there is a slight variation in the slope of the curves. This change is due to a significant alteration in the atomic kinetics of the supercooled liquid, which transforms into a solid amorphous state. Thus, based on the variation in the slope of the curves, it is possible to determine the glass transition temperature (Tg), which is 702 K for the Ti53Cu39Ni8 alloy and 680 K for the Ti50Cu42Ni8 alloy.

a) Volume vs. Temperature curves of Ti53Cu39Ni8 and Ti50Cu42Ni8 alloys during cooling stage. B) snapshots of the amorphous structure at 300 K.
To evaluate the ability of MD simulations to predict the thermal behavior of amorphous phases in comparison to real experiments, differential scanning calorimetry (DSC) tests were performed on melt-spun ribbons of both alloys. Figure 3 shows the DSC curves obtained at a heating rate of 20 K/min (0.333 K/s). Although this rate is significantly lower than the heating and cooling rates used in MD simulations, it still provides valuable information regarding the validity of the simulation predictions.
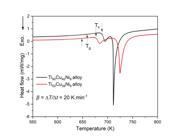
Curves of DSC measurements at heating rate of 0.333 K.s-1 in melt-spun ribbons of Ti50Cu42Ni8 and Ti53Cu39Ni8 alloys.
Table 2 presents a summary of the thermal parameters for both alloys, obtained from molecular dynamics simulations (Sim.) and experimental (Exp.) measurements. It can be observed that the differences in Tg between simulation and experiment are 21 K and 50 K, respectively. Furthermore, considering that Tg increases with higher heating rates, one can conclude that the MD simulation predictions are in good agreement with the experimental results.
Summary of thermal parameters for Ti53Cu39Ni8 and Ti50Cu42Ni8 alloys obtained by MD simulations and experimental measurements.
One of the most commonly used tools to analyze the structure of disordered materials is the total pair distribution function (PDF), g(r)40. The PDF describes the probability of finding two atoms separated by a distance, r, within a certain spherical shell of the material. Figures 4a and 4b display the total PDF for both studied alloys. One can observe the evolution of both the intensity and base width of the peaks as a function of temperature. Initially, at high temperatures (red curves), the peaks exhibit low intensities and broad base widths. As the temperature decreases and the supercooled liquid reaches the Tg (blue curves), the material transforms into a solid. The intensities of the first peaks increase, and their base widths shorten. Additionally, the second peaks, initially broad and weak, begin to separate into two peaks of similar intensity, with the difference between them becoming clearer as the material reaches room temperature (black curves). It should be noted that the splitting of the second peak is considered a fundamental indicator of amorphous phase formation41-43.

Evolution of pair distribution functions g(r), as function of temperature: a) Ti50Cu42Ni8 alloy and, b) Ti53Cu39Ni8 alloy. The red color indicates temperatures close upper to liquidus temperature, while black color indicates temperatures close to room temperature, considered as 300 K.
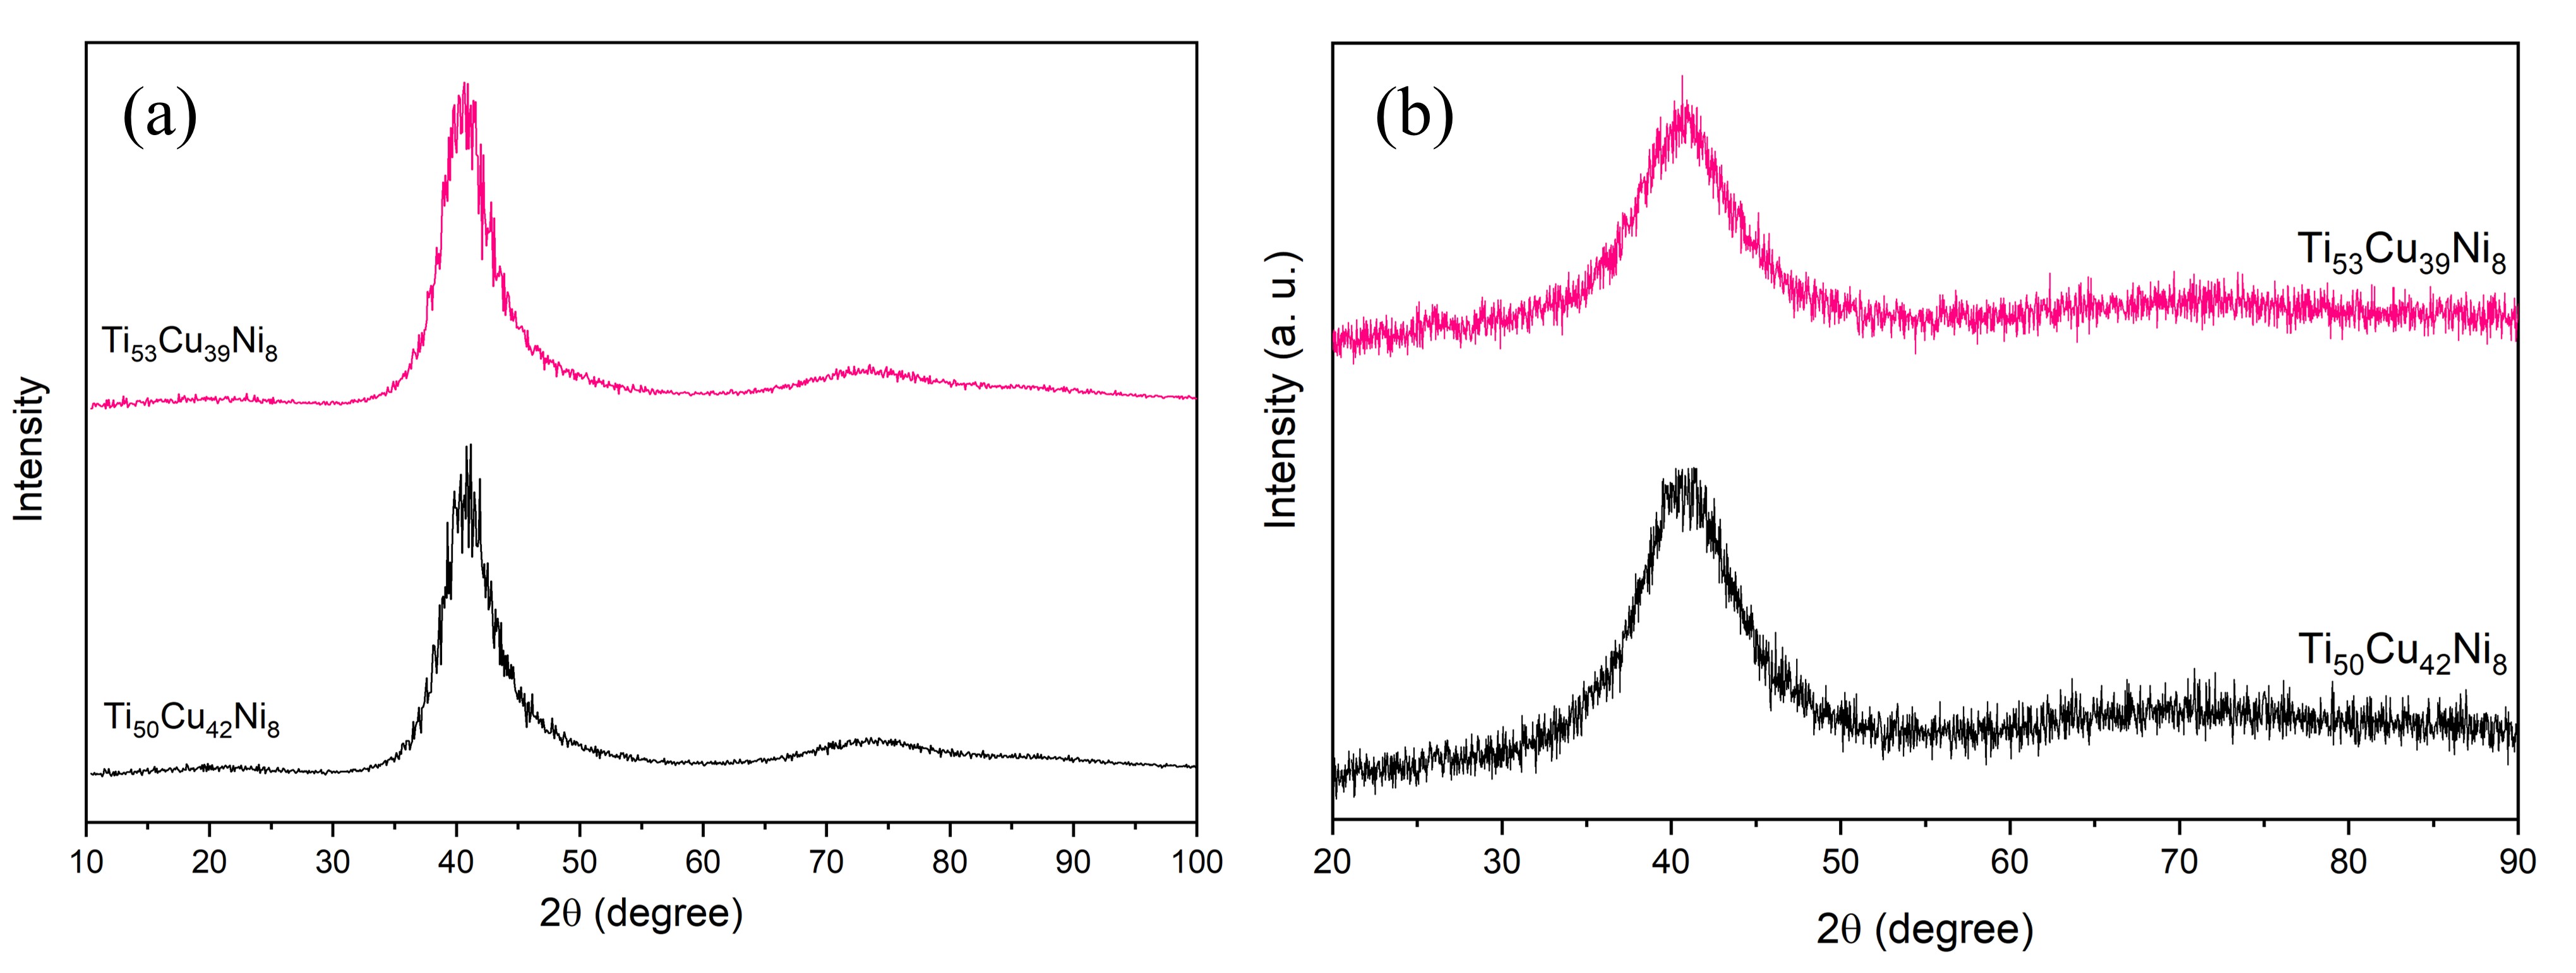
In experimental studies, XRD is one of the most commonly used techniques for material characterization. Although this study is primarily based on computer simulations, it is possible to generate simulated XRD diffractograms to enable comparison with experimental results. Figure 5 presents the simulated (Figure 5a) and experimental (Figure 5b) diffractograms of the Ti50Cu42Ni8 and Ti53Cu39Ni8 alloys at a temperature of 300 K. Both alloys are composed of fully amorphous structures, as indicated by broad diffraction halos with a 2θ range of 35 to 50 degrees for the Ti50Cu42Ni8 alloy and 37 to 48 degrees for the Ti53Cu39Ni8 alloy. Furthermore, the simulated diffractograms show slightly smaller diffraction halos in both alloys that are not visible in the experimental measurements. On the other hand, although there is some dispersion in the intensity values superimposed on the main halo, these variations are not significant enough to suggest the presence of secondary phases. Therefore, it can be concluded that both the simulated and experimental XRD diffractograms are in good agreement. This agreement supports the reliability of the MD simulations in capturing the structural features of metallic glasses. As amorphous materials lack long-range order, their XRD patterns typically exhibit broad halos rather than sharp Bragg peaks, reflecting the presence of short-range structural correlations.
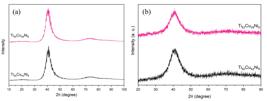
XRD diffractograms of the Ti53Cu39Ni8 and Ti50Cu42Ni8 alloys at temperature of 300 K. a) simulated diffractograms and, b) experimental measurement diffractograms.
It is worth noting that over the years, the search for systems and compositions with good glass-forming ability (GFA) has primarily been conducted through real experiments in laboratories. However, over the past five decades, methods based on computer simulations have gained prominence, allowing predictions about the structures and properties of materials before they are processed in laboratories. It is also worth noting that the use of computer simulations saves time and money in various research fields.
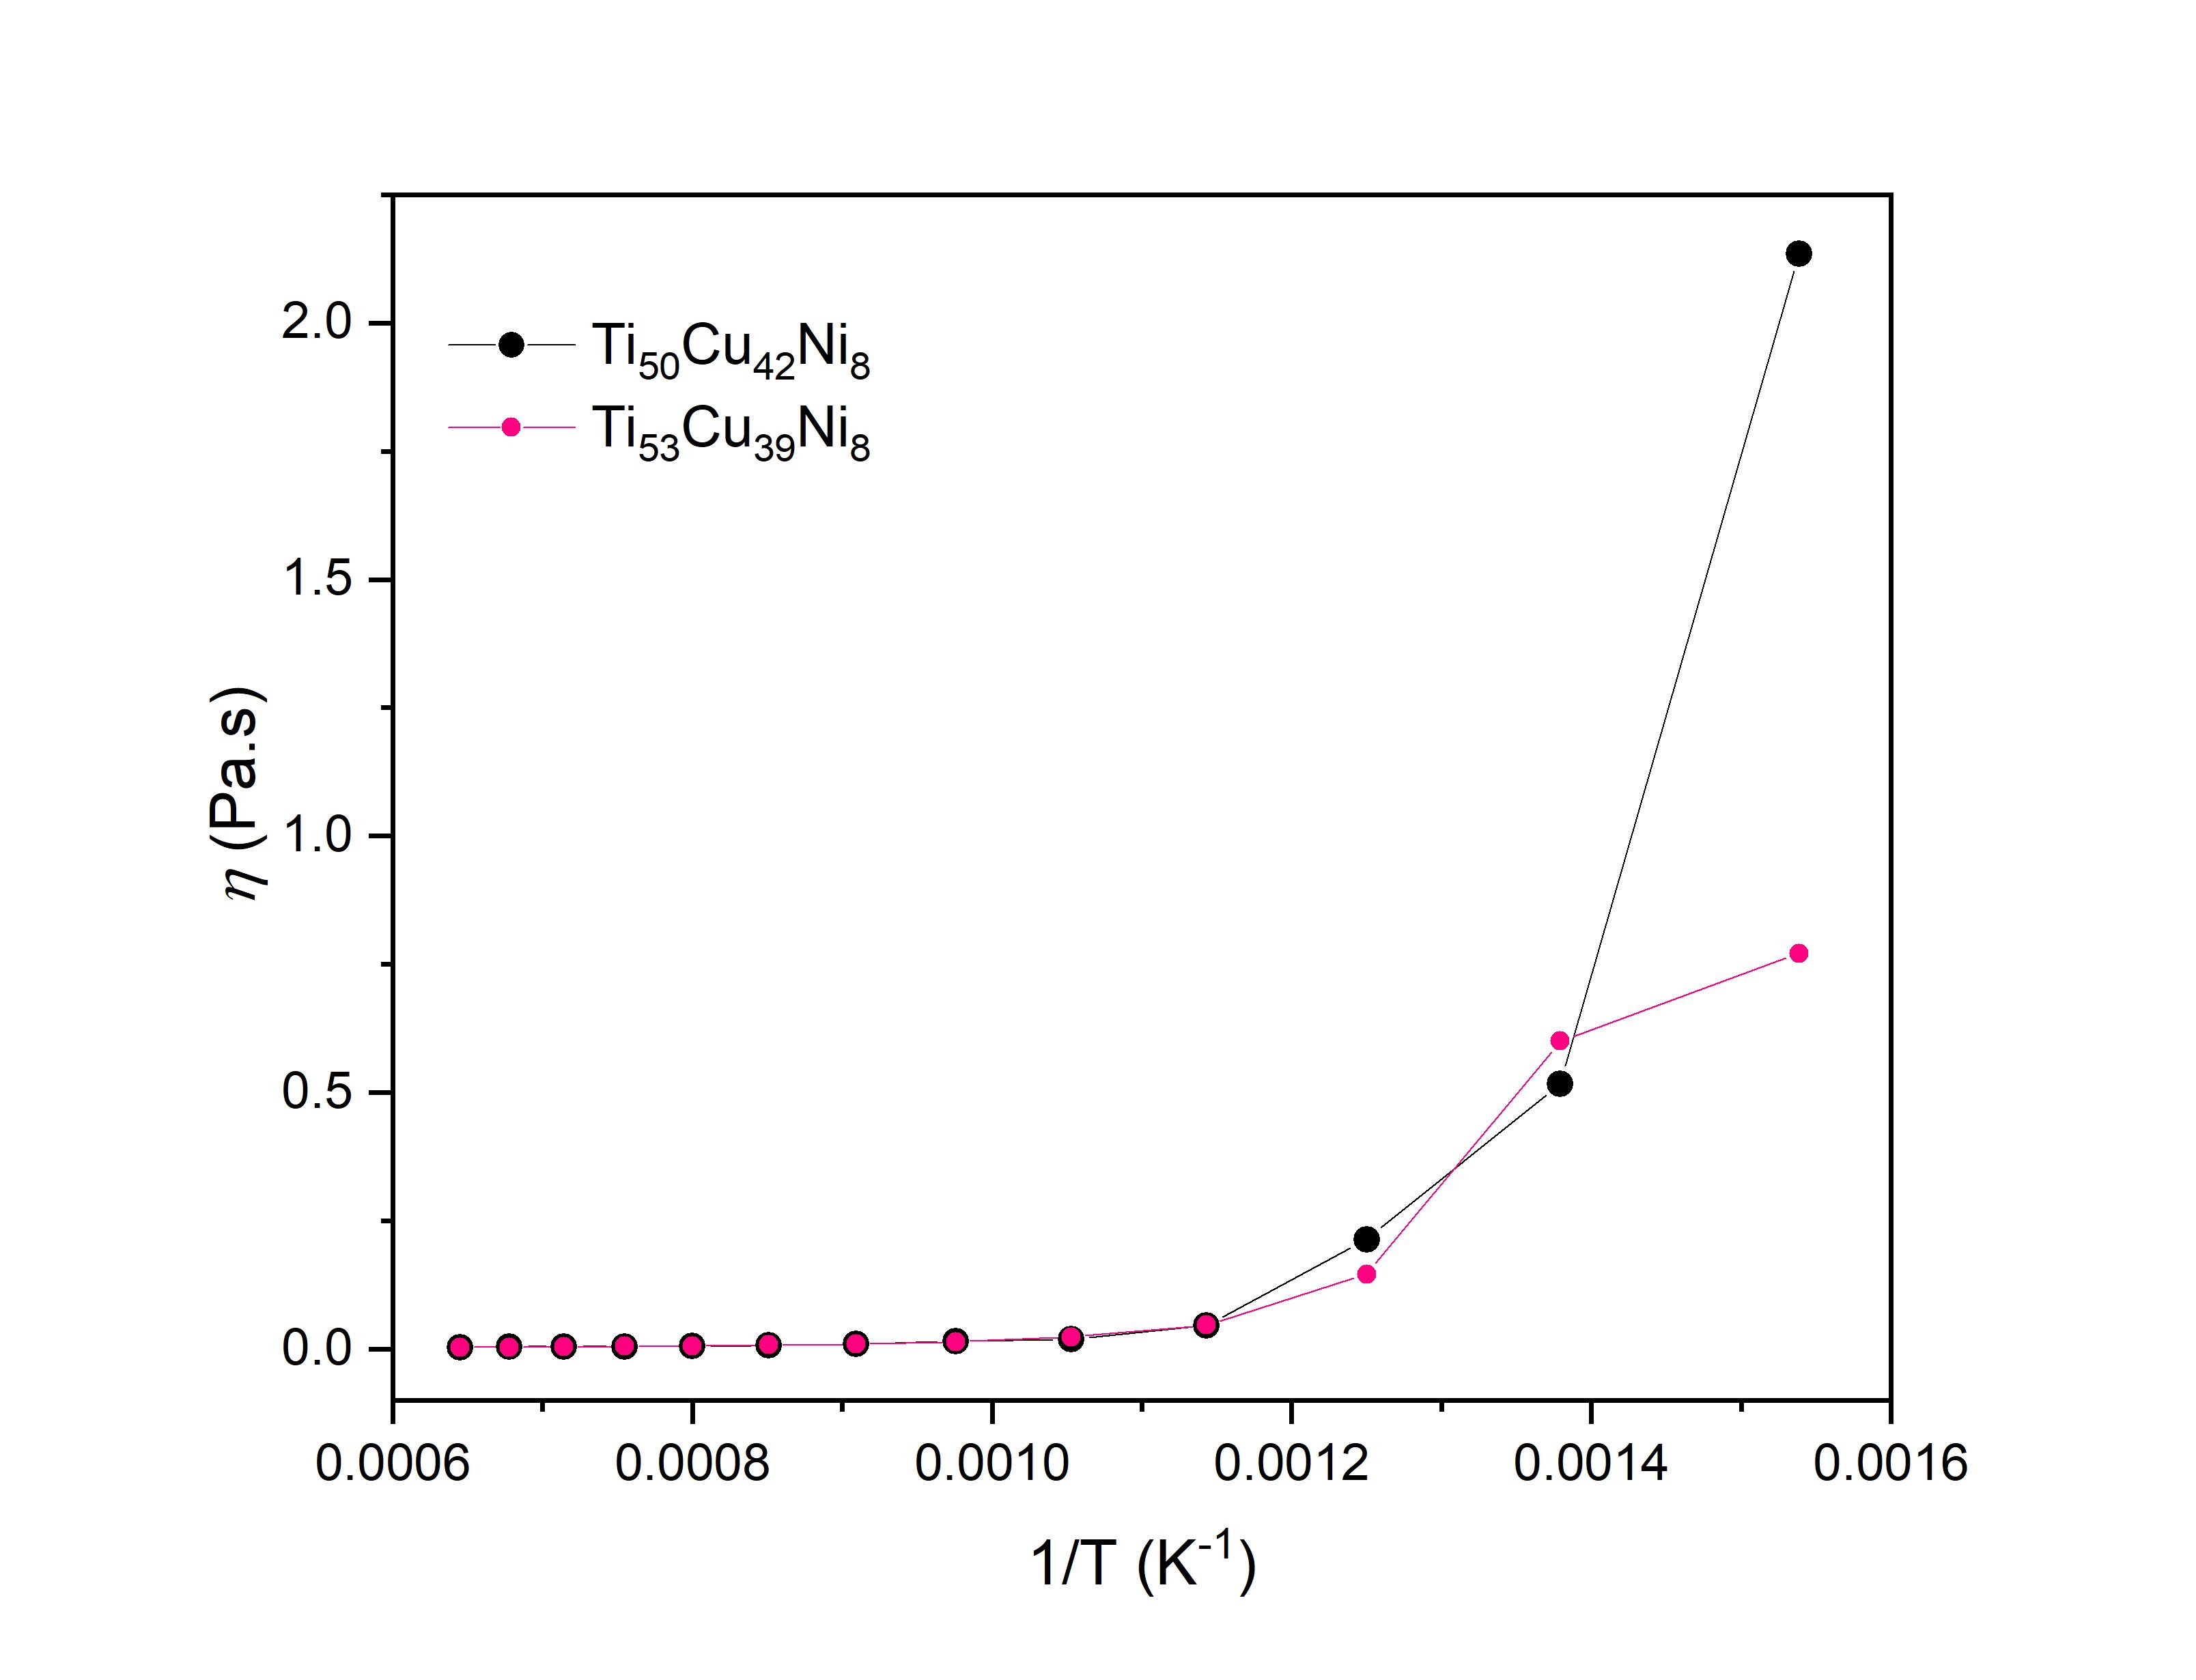
Different studies have pointed out that shear viscosity (η) is a relevant kinetic parameter in determining the GFA of alloys44,45. In general, η measures a fluid's resistance to flow when shear stress is applied. Thus, supercooled liquids with higher values of η are more likely to exhibit better GFA due to their higher ability to inhibit the nucleation of new crystals. Figure 6 shows the η as a function of the inverse of temperature for both alloys under study. These curves were obtained during the cooling stage in a temperature range between Tg and TL, using the Green-Kubo method based on the shear autocorrelation function, according to the relation (1)31,46.
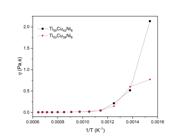
Curves of the evolution of η as a function of the inverse of temperature (1/T) of the Ti53Cu39Ni8 and Ti50Cu42Ni8 alloys. Curves obtained during the cooling stage to form amorphous structure.
Figure 6 shows that at high temperatures, the viscosity in both alloys exhibits only a slight variation. However, the values increase significantly when the temperature is about 100 K above Tg and rise even faster at lower temperatures, as seen around 625 K. Furthermore, the change in η for the Ti50Cu42Ni8 alloy is more pronounced than for the Ti53Cu39Ni8 alloy. Thus, it is possible to infer that the first alloy has a higher GFA than the second one. The energy released during the crystallization of the amorphous phases, as shown in the DSC curves in Figure 3, is approximately 125 J/g for the Ti50Cu42Ni8 and 110 J/g for the Ti53Cu39Ni8 alloy, respectively.
On the other hand, unlike crystalline materials, amorphous materials do not have long-range atomic order. However, they do exhibit topological short-range order (TSRO) and medium-range order (MRO). TSRO and MRO are focuses on how atoms are arranged geometrically and their atomic structure cannot be inferred using conventional characterization techniques. To analyze the local atomic structure of amorphous alloys and other non-crystalline materials, the Voronoi polyhedron (VP) method is widely used47,48. A VP is represented by a set of indices (n3, n4, n5, n6). For each value in this vector, ni corresponds to the number of edges on the face of the polyhedron, which makes it possible to predict the coordination number of the central atom. For example, the (0, 0, 12, 0) index describes a polyhedron with 12 faces, each consisting of 5 edges.
Amorphous alloys are composed of different types of clusters associated with TSRO, which, in turn, can be joined by sharing faces, edges, or vertices to form MRO structures49. Among the various atomic clusters found in amorphous alloys are: perfect icosahedra, distorted icosahedra, face-centered cubic type (FCC), body-centered cubic type (BCC), and others. It is believed that the fraction of these different types of clusters plays an important role in the properties of the material, and their volume fraction generally depends on the alloy system and composition. It has been reported that amorphous alloys with a high fraction of icosahedral clusters50 exhibit high glass-forming ability (GFA). Moreover, VPs with high indices have a higher level of free volume51, which can influence the physical properties of amorphous alloys.
Figure 7 shows a comparison of the different types of Voronoi polyhedra (VPs) with fractions greater than 2% present in the Ti50Cu42Ni8 and Ti53Cu39Ni8 amorphous alloys at a temperature of 300 K. It can be seen that both alloys are primarily composed of distorted icosahedral polyhedra, including ⟨0,1,10,2⟩, ⟨0,1,10,3⟩, ⟨0,1,10,4⟩, ⟨0,2,8,5⟩, ⟨0,2,8,4⟩, ⟨0,2,8,3⟩, and ⟨0,2,8,2⟩, which maintain some aspects of icosahedral symmetry while featuring variations in face types and arrangements. In addition to the perfect icosahedron ⟨0,0,12,0⟩ polyhedron there are ⟨0,1,10,2⟩, along with the ⟨0,3,6,4⟩, ⟨0,3,6,5⟩, ⟨0,4,4,6⟩, and ⟨0,4,4,7⟩ polyhedra that correspond to FCC-type structures. Also, presents are Archimedean polyhedra, including ⟨0,3,6,6⟩, ⟨1,3,4,5⟩, ⟨1,1,8,3⟩, and ⟨1,2,6,3⟩.

Comparison of the different types of Voronoi polyhedra in the Ti53Cu39Ni8 and Ti50Cu42Ni8 amorphous alloys, at the temperature of 300 K.
Among the main structural differences between the alloys, a slightly higher concentration of both perfect and distorted icosahedral polyhedra is observed in the Ti50Cu42Ni8 alloy, while the Ti53Cu39Ni8 alloy shows a higher concentration of FCC-type polyhedra. Thus, the cluster distribution in the amorphous materials agrees well with the viscosity evolution predictions, which suggest a better GFA for the Ti50Cu42Ni8 alloy. This behavior is related to the higher concentration of copper, which mainly acts as a center for the formation of icosahedral polyhedra.
On the other hand, instead of considering only the fraction of icosahedral clusters, other studies have taken into account the average five-fold local symmetry (w) of the VPs to analyze the GFA52. Also, have been shown that the degree of five-fold local symmetry can be used as structural indicator of plastic deformation behavior in metallic glasses53. Applying the w parameter to different alloy systems has shown interesting correlations; however, in Ti-Cu-Ni amorphous alloys, this parameter shows only a slight variation in its values, ranging from 0.59 for Ti50Cu42Ni8 to 0.58 for Ti53Cu39Ni8. Although Ti50Cu42Ni8 has a slightly higher value than Ti53Cu39Ni8, this small difference does not allow for a conclusive prediction of the GFA of the studied alloys.
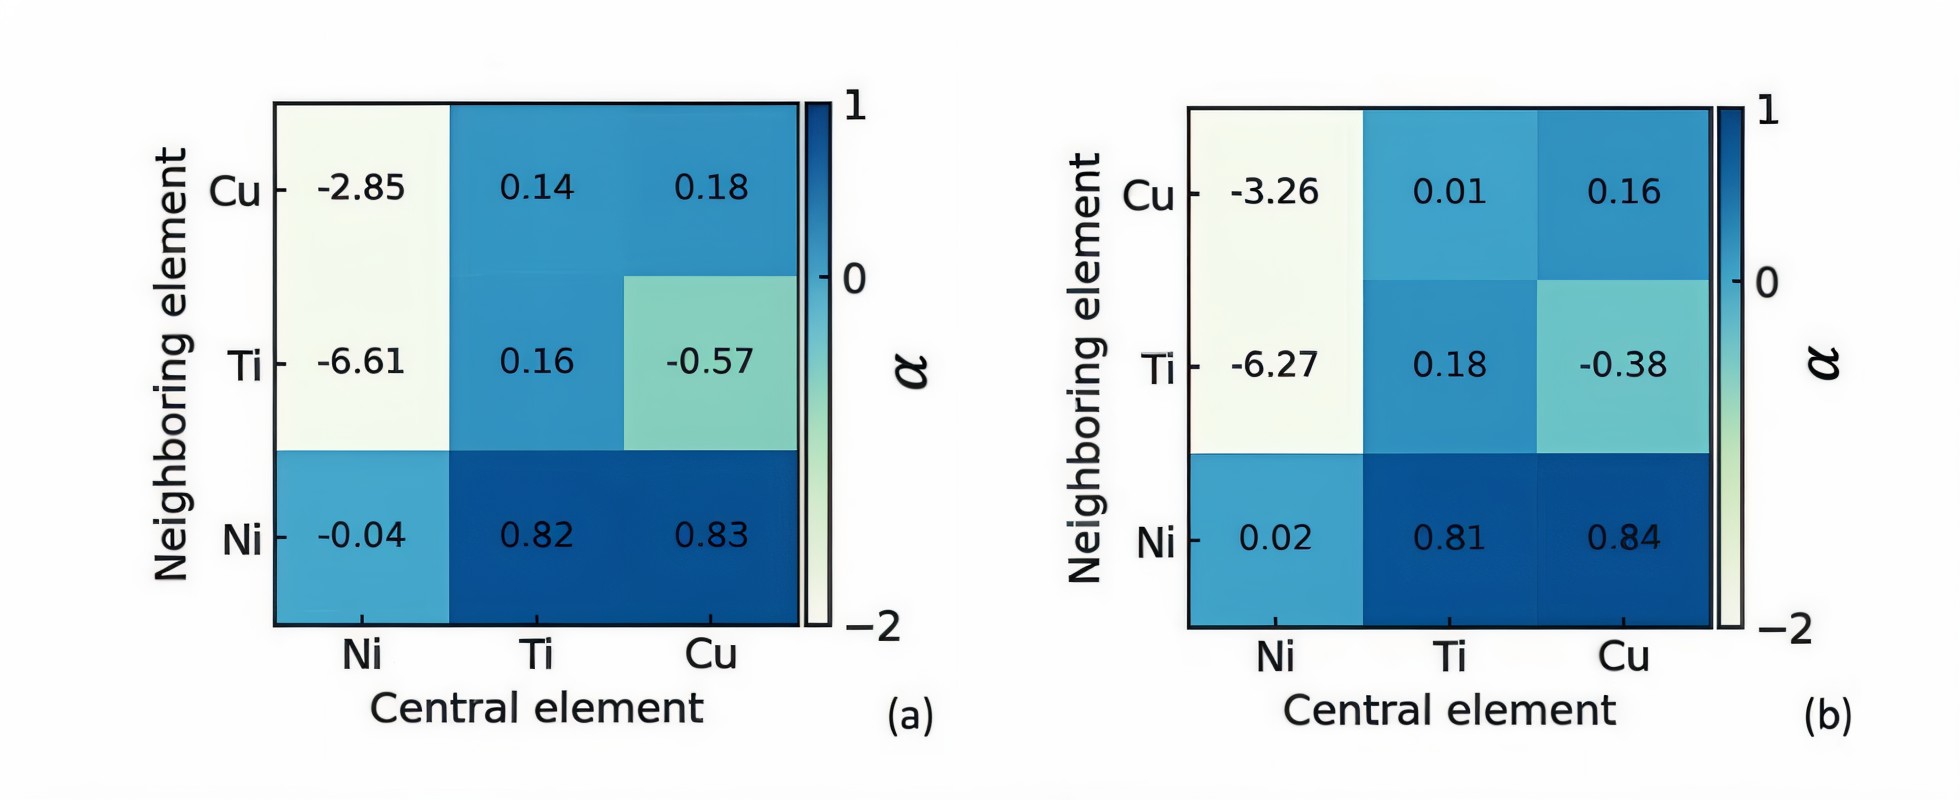
Besides the TSRO, in amorphous alloys is interesting to analyze chemical short-range order (CSRO) which focuses on how different species of atoms tend to cluster or segregate at short ranges, based on their chemical interactions54. In other words, CSRO refers to the preferential arrangement of different types of atoms, influencing the overall composition of the material at small scales. CSRO is related to chemical interactions and the mixing behavior of the constituent atoms, such as whether atoms of different types prefer to be neighbors or avoid each other. CSRO is commonly determined by applying the Warren-Cowley (α) parameter55-57 that measures how the atoms are locally arranged within the structure, specifically in terms of the tendency for like or unlike atoms to cluster together. Figure 8 display the α parameter corresponding to the different pairs of atoms for Ti50Cu42Ni8 and Ti53Cu39Ni8 alloys at temperature of 300 K.
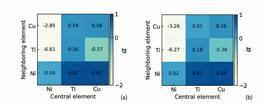
Warren-Cowley (α) parameter for the different pairs of atoms in (a) Ti53Cu39Ni8 and (b) Ti50Cu42Ni8 amorphous alloys.
In Ti-Cu-Ni ternary alloys there are different types of atom pairs interactions and the CSRO describes whether Ti atoms tend to cluster with Ti atoms, or if Ti atoms tend to bond with Cu or Ni atoms, based on their chemical affinities. If two elements have a positive CSRO (α < 0), it means that those elements tend to cluster together at short ranges, rather than being randomly distributed. However, if the CSRO is negative (α > 0), it means that both elements are less likely to be neighbors and tend to avoid each other, possibly leading to phase separation or segregated regions. If α = 0, the probability of forming AB pairs is relatively small.
According to the values of the α parameter in Figure 8, there is a slight difference in the local atomic structural organization as a function of the chemical composition in the amorphous alloys. In the Ti53Cu39Ni8 alloy (Figure 8a), the α parameter indicates a strong tendency to form Ni-Cu (α = -2.85) and Ni-Ti (α = -6.61) clusters centered around the Ni atom, as well as Cu-Ti (α = -0.57) clusters centered around the Cu atom but not the Ti atom (α = +0.14). Additionally, the Ni-Ni pair (α = -0.04) shows a weaker tendency for bond formation. Furthermore, Ti and Cu exhibit a tendency to cluster along the amorphous structure. On the other hand, the Ti50Cu42Ni8 alloy shows slight differences compared to the Ti53Cu39Ni8 alloy. As shown in Figure 8b, the same tendencies to form Ni-Cu (α = -3.26) and Ni-Ti (α = -6.27) clusters centered around Ni, and Cu-Ti (α = -0.38), are present. However, in this alloy, there is no tendency for Ni-Ni (α = +0.02) pairs to bond. Instead, a random distribution of Ni atoms is inferred within the atomic structure. Additionally, Ti and Cu show an overall tendency to cluster along the amorphous structure.
4. Conclusions
In summary, we performed MD simulations on Ti50Cu42Ni8 and Ti53Cu39Ni8 alloys under similar conditions to compute the shear viscosity and estimate the glass-forming ability. Both alloys were processed under the same conditions using the NPT ensemble during cooling to obtain the amorphous structure at 300 K. The collection of atomic configurations at different temperatures within the liquidus and glass transition temperature ranges to compute the shear viscosity was carried out under the NVT ensemble. The structural characterization by XRD and PDF shows similar structural behavior; however, the topological short-range order, as determined by Voronoi polyhedra, indicates significant differences between the two alloys which is reflected as in the chemical short-range order that depends of the chemical composition of the alloys. The Ti50Cu42Ni8 alloy has a slightly higher fraction of perfect and distorted icosahedral Voronoi polyhedra, whereas the Ti53Cu39Ni8 alloy has a greater concentration of FCC-type Voronoi polyhedra. Therefore, the glass-forming ability of Ti50Cu42Ni8 is superior to that of the Ti53Cu39Ni8 alloy. These results are consistent with the shear viscosity predictions, which show a greater change in its values when the temperature is slightly above and below Tg in the Ti50Cu42Ni8 alloy compared to the Ti53Cu39Ni8 alloy. Furthermore, the glass transition temperatures predicted by molecular dynamics simulations are in good agreement with experimental measurements, showing discrepancies of no more than 50 K. Finally, the results indicate that five-fold local atomic symmetry has a weak correlation with the glass-forming ability in Ti-Cu-Ni alloys.
5. Acknowledgments
The authors are grateful to CNPq (Grant 402751/2023-0) and Rio de Janeiro research foundation FAPERJ (Grant E-26/210.052/2018). Also, this study was sponsored in part by the Coordination of Superior Level Staff Improvement – Brazil (CAPES) – Finance Code 001.
6. References
- 1 Oshida Y. Bioscience and bioengineering of titanium materials. Amsterdam: Elsevier; 2013.
-
2 Zhang L, Zhang H, Ren X, Eckert J, Wang Y, Zhu Z, et al. Amorphous martensite in β-Ti alloys. Nat Commun. 2018;9(1):506. http://doi.org/10.1038/s41467-018-02961-2
» http://doi.org/10.1038/s41467-018-02961-2 -
3 Gong P, Yao KF, Wang X, Shao Y. A new centimeter-sized Ti-based quaternary bulk metallic glass with good mechanical properties. Adv Eng Mater. 2013;15(8):691-6. http://doi.org/10.1002/adem.201200391
» http://doi.org/10.1002/adem.201200391 -
4 Zhao SF, Shao Y, Gong P, Yao KF. A centimeter-sized quaternary Ti–Zr–Be–Ag bulk metallic glass. Adv Mater Sci Eng. 2014;5:92187. http://doi.org/10.1155/2014/192187
» http://doi.org/10.1155/2014/192187 -
5 Zhu SL, Wang XM, Inoue A. Glass-forming ability and mechanical properties of Ti-based bulk glassy alloys with large diameters of up to 1 cm. Intermetallics. 2008;16(8):1031-5. http://doi.org/10.1016/j.intermet.2008.05.006
» http://doi.org/10.1016/j.intermet.2008.05.006 -
6 Guo FQ, Wang HJ, Poon SJ, Shiflet GJ. Ductile titanium-based glassy alloy ingots. Appl Phys Lett. 2005;86(9):091907. http://doi.org/10.1063/1.1872214
» http://doi.org/10.1063/1.1872214 -
7 Gong P, Wang X, Shao Y, Chen N, Liu NX, Yao KF. A Ti–Zr–Be–Fe–Cu bulk metallic glass with superior glass-forming ability and high specific strength. Intermetallics. 2013;43:177-81. http://doi.org/10.1016/j.intermet.2013.08.003
» http://doi.org/10.1016/j.intermet.2013.08.003 -
8 Tang MQ, Zhang HF, Zhu ZW, Fu HM, Wang AM, Li H, et al. TiZr-base bulk metallic glass with over 50 mm in diameter. J Mater Sci Technol. 2010;26(6):481-6. http://doi.org/10.1016/S1005-0302(10)60077-1
» http://doi.org/10.1016/S1005-0302(10)60077-1 -
9 Duan G, Wiest GA, Lind ML, Li J, Rhim WK, Johnson WL. Bulk metallic glass with benchmark thermoplastic processability. Adv Mater. 2007;19(23):4272-5. http://doi.org/10.1002/adma.200700969
» http://doi.org/10.1002/adma.200700969 -
10 Gong P, Yao KF, Wang X, Shao Y. Centimeter-sized Ti-based bulk metallic glass with high specific strength. Prog Nat Sci. 2012;22(5):401-6. http://doi.org/10.1016/j.pnsc.2012.10.007
» http://doi.org/10.1016/j.pnsc.2012.10.007 -
11 Zhao SF, Gong P, Li JF, Chen N, Yao KF. Quaternary Ti–Zr–Be–Ni bulk metallic glasses with large glass-forming ability. Mater Des. 2015;85:564-73. http://doi.org/10.1016/j.matdes.2015.07.032
» http://doi.org/10.1016/j.matdes.2015.07.032 -
12 Cai Z, Du P, Li K, Chen L, Xie G. A review of the development of Titanium-based and Magnesium-based metallic glasses in the field of biomedical materials. Materials. 2024;17(18):4587. http://doi.org/10.3390/ma17184587
» http://doi.org/10.3390/ma17184587 -
13 Wu W, Li X, Liu Q, Ying J, Fuh JH, Zheng A, et al. Additive manufacturing of bulk metallic glass: Principles, materials and prospects. Mater Today Adv. 2022;16:100319. http://doi.org/10.1016/j.mtadv.2022.100319
» http://doi.org/10.1016/j.mtadv.2022.100319 -
14 Li X, Zhang L, Shi T, Yu W, Shao J, Zhou X, et al. Preparation and electrochemical characterization of Ti‐based amorphous metallic glass with high strength. Mater Corros. 2021;72(5):951-9. http://doi.org/10.1002/maco.202012136
» http://doi.org/10.1002/maco.202012136 -
15 Bai L, Ding Z, Zhang H, Cui C. Glass-forming ability and corrosion behavior of Ti-based amorphous alloy Ti-Zr-Si-Fe. Materials. 2022;15(20):7229. http://doi.org/10.3390/ma15207229
» http://doi.org/10.3390/ma15207229 -
16 Cui C, Bai L, Liu S, Qi Y, Zhao L. Ti5Si3/β-Ti nano-core-shell structure toughened glassy Ti alloy matrix biocomposites. RSC Adv. 2015;5(11):8355-61. http://doi.org/10.1039/C4RA10738A
» http://doi.org/10.1039/C4RA10738A -
17 Jin ZS, Yang YJ, Zhang ZP, Ma XZ, Lv JW, Wang FL, et al. Effect of Hf substitution Cu on glass-forming ability, mechanical properties and corrosion resistance of Ni-free Zr–Ti–Cu–Al bulk metallic glasses. J Alloys Compd. 2019;806:668-75. http://doi.org/10.1016/j.jallcom.2019.07.240
» http://doi.org/10.1016/j.jallcom.2019.07.240 -
18 Shan F, Sun T, Song W, Peng C, Sun H, Gong J, et al. A bridge from metallic glasses to medium-entropy alloys in Ti-Cu-Zr-Pd-Co system: design, microstructure, and deformation-induced-martensitic transformation. J Non-Cryst Solids. 2022;587:121608. http://doi.org/10.1016/j.jnoncrysol.2022.121608
» http://doi.org/10.1016/j.jnoncrysol.2022.121608 -
19 Lee SY, Lee HJ, Baek JH, Park SS, Lee JG. Microstructural and corrosion properties of Ti-to-Zr dissimilar alloy joints brazed with a Zr-Ti-Cu-Ni amorphous filler alloy. Metals. 2021;11(2):192. http://doi.org/10.3390/met11020192
» http://doi.org/10.3390/met11020192 -
20 Yue X, Hu R, Qi J, He Y, Meng Q, Wei F, et al. Fabrication and degradation properties of nanoporous copper with tunable pores by dealloying amorphous Ti-Cu Alloys with minor Co addition. J Mater Eng Perform. 2021;30(3):1759-67. http://doi.org/10.1007/s11665-021-05491-z
» http://doi.org/10.1007/s11665-021-05491-z -
21 Chen FC, Dai FP, Yang XY, Ruan Y, Wei BB. Effect of Sn and Al additions on the microstructure and mechanical properties of amorphous Ti–Cu–Zr–Ni alloys. Chin Phys B. 2020;29(6):066401. http://doi.org/10.1088/1674-1056/ab8628
» http://doi.org/10.1088/1674-1056/ab8628 -
22 Kang Y, Feng K, Zhang W, Mao Y. Microstructural and mechanical properties of CFC composite/Ti6Al4V joints brazed with Ag–Cu–Ti and refractory metal foils. Arch Civ Mech Eng. 2021;21(3):113. http://doi.org/10.1007/s43452-021-00268-6
» http://doi.org/10.1007/s43452-021-00268-6 -
23 Prabhu Y, Vincent S, Bhatt J. Thermodynamic modelling to optimize glass forming composition in multicomponent Zr-Cu-Co-Al system. Mater Today Proc. 2020;28:1239-44. http://doi.org/10.1016/j.matpr.2020.02.169
» http://doi.org/10.1016/j.matpr.2020.02.169 -
24 Louzguine-Luzgin DV. High-strength Ti-based alloys containing Fe as one of the main alloying elements. Mater Trans. 2018;59(10):1537-44. http://doi.org/10.2320/matertrans.M2018114
» http://doi.org/10.2320/matertrans.M2018114 -
25 Park HJ, Lee HJ, Kim TK, Hong SH, Wang WM, Choi TJ, et al. Formation of photo-reactive heterostructure from a multicomponent amorphous alloy with atomically random distribution. J Mater Sci Technol. 2022;109:245-53. http://doi.org/10.1016/j.jmst.2021.08.029
» http://doi.org/10.1016/j.jmst.2021.08.029 -
26 Pal S, Ray BC. Molecular dynamics simulation of nanostructured materials: an understanding of mechanical behavior. Boca Raton: CRC Press; 2020. http://doi.org/10.1201/9780429019845
» http://doi.org/10.1201/9780429019845 -
27 Abdelrazik AS, Sayed MAM, Omar AMA, Fatma Ayman FM, Alshima HE, Oulguidoum A, et al. Potential of molecular dynamics in the simulation of nanofluids properties and stability. J Mol Liq. 2023;381:121757. http://doi.org/10.1016/j.molliq.2023.121757
» http://doi.org/10.1016/j.molliq.2023.121757 -
28 Battezzati L, Greer AL. The viscosity of liquid metals and alloys. Acta Metall. 1989;37(7):1791-802. http://doi.org/10.1016/0001-6160(89)90064-3
» http://doi.org/10.1016/0001-6160(89)90064-3 -
29 Gąsior W. Viscosity modeling of binary alloys: comparative studies. Calphad. 2014;44:119-28. http://doi.org/10.1016/j.calphad.2013.10.007
» http://doi.org/10.1016/j.calphad.2013.10.007 -
30 Dongre B, Wang T, Madsen GKH. Comparison of the Green-Kubo and homogeneous non-equilibrium molecular dynamics methods for calculating thermal conductivity. Model Simul Mater Sci Eng. 2017;25(5):054001. http://doi.org/10.1088/1361-651X/aa6f57
» http://doi.org/10.1088/1361-651X/aa6f57 -
31 Mathas D, Holweger W, Wolf M, Bohnert C, Bakolas V, Procelewska J, et al. Evaluation of methods for viscosity simulations of lubricants at different temperatures and pressures: a case study on PAO-2. Tribol Trans. 2021;64(6):1138-48. http://doi.org/10.1080/10402004.2021.1922790
» http://doi.org/10.1080/10402004.2021.1922790 -
32 Thompson AP, Aktulga HM, Berger R, Bolintineanu DS, Brown WM, Crozier PS, et al. LAMMPS - a flexible simulation tool for particle-based materials modeling at the atomic, meso, and continuum scales. Comput Phys Commun. 2022;271:108171. http://doi.org/10.1016/j.cpc.2021.108171
» http://doi.org/10.1016/j.cpc.2021.108171 -
33 Ko WS, Grabowski B, Neugebauer J. Development and application of a Ni-Ti interatomic potential with high predictive accuracy of the martensitic phase transition. Phys Rev B Condens Matter Mater Phys. 2015;92(13):134107. http://doi.org/10.1103/PhysRevB.92.134107
» http://doi.org/10.1103/PhysRevB.92.134107 -
34 Jacobson DW, Thompson GB. Revisting Lennard Jones, Morse, and N-M potentials for metals. Comput Mater Sci. 2022;205:111206. http://doi.org/10.1016/j.commatsci.2022.111206
» http://doi.org/10.1016/j.commatsci.2022.111206 -
35 Haliciolu T, Pound GM. Calculation of potential energy parameters from crystalline state properties. Phys Status Solidi, A Appl Res. 1975;30:619. http://doi.org/10.1002/pssa.2210300223
» http://doi.org/10.1002/pssa.2210300223 -
36 Allen MP, Tildesley DJ. Computer simulation of liquids. 2nd ed. New York: Oxford University Press; 2017. http://doi.org/10.1093/oso/9780198803195.001.0001
» http://doi.org/10.1093/oso/9780198803195.001.0001 -
37 Stukowski A. Visualization and analysis of atomistic simulation data with OVITO–the Open Visualization Tool. Model Simul Mater Sci Eng. 2010;18(1):015012. http://doi.org/10.1088/0965-0393/18/1/015012
» http://doi.org/10.1088/0965-0393/18/1/015012 -
38 Zhu WJ, Duarte LI, Leinenbach C. Experimental study and thermodynamic assessment of the Cu–Ni–Ti system. Calphad. 2014;47:9-22. http://doi.org/10.1016/j.calphad.2014.06.002
» http://doi.org/10.1016/j.calphad.2014.06.002 -
39 Bouchareb N, Fellah M, Hezil N, Hamadi F, Montagne A, Aleksei O, et al. Efect of milling time on structural, physical and photocatalytical properties of Ti‑Ni alloy for biomedical applications. Int J Adv Manuf Technol. 2024;131(7-8):3539-53. http://doi.org/10.1007/s00170-024-13207-5
» http://doi.org/10.1007/s00170-024-13207-5 -
40 Billinge SJL. The rise of the X-ray atomic pair distribution function method: a series of fortunate events. Philos Trans- Royal Soc, Math Phys Eng Sci. 2019;377(2147):20180413. http://doi.org/10.1098/rsta.2018.0413
» http://doi.org/10.1098/rsta.2018.0413 -
41 Khmich A, Sbiaai K, Hasnaoui A. Structural behavior of Tantalum monatomic metallic glass. J Non-Cryst Solids. 2019;510:81-92. http://doi.org/10.1016/j.jnoncrysol.2019.01.024
» http://doi.org/10.1016/j.jnoncrysol.2019.01.024 -
42 Kbirou M, Trady S, Hasnaoui A, Mazroui M. Cooling rate dependence and local structure in aluminum monatomic metallic glass. Philos Mag. 2017;97(30):2753-71. http://doi.org/10.1080/14786435.2017.1352107
» http://doi.org/10.1080/14786435.2017.1352107 -
43 Trady S, Hasnaoui A, Mazroui M. Atomic packing and medium-range order in Ni3Al metallic glass. J Non-Cryst Solids. 2017;468:27-33. http://doi.org/10.1016/j.jnoncrysol.2017.04.026
» http://doi.org/10.1016/j.jnoncrysol.2017.04.026 -
44 Makarov AS, Cui JB, Qiao JC, Afonin GV, Kobelev NP, Khonik VA. Relationship between the entropy of mixing, excess entropy and the shear viscosity of metallic glasses near the glass transition. Intermetallics. 2024;175:108478. http://doi.org/10.1016/j.intermet.2024.108478
» http://doi.org/10.1016/j.intermet.2024.108478 -
45 Aliaga LCR, Schimidt CS, Lima LVPC, Bastos IN, Botta WJ. Study of glass forming on Cu60.0Zr32.5Ti7.5 alloy by molecular dynamics simulation. Mater Res. 2017;21(2):e20170555. http://doi.org/10.1590/1980-5373-mr-2017-0555
» http://doi.org/10.1590/1980-5373-mr-2017-0555 -
46 Kirova EM, Norman GE. Viscosity calculations at molecular dynamics simulations. J Phys Conf Ser. 2015;653:012106. http://doi.org/10.1088/1742-6596/653/1/012106
» http://doi.org/10.1088/1742-6596/653/1/012106 -
47 Wei YD, Peng P, Yan ZZ, Kong LT, Tian ZA, Dong KJ, et al. A comparative study on local atomic configurations characterized by cluster-type-index method and Voronoi polyhedron method. Comput Mater Sci. 2016;123:214-23. http://doi.org/10.1016/j.commatsci.2016.06.030
» http://doi.org/10.1016/j.commatsci.2016.06.030 -
48 Muscas G, Johansson R, George S, Ahlberg M, Arvanitis D, Ahuja R, et al. Unveiling the local structure of the amorphous metal Fe(1−x)Zrx combining frst‑principles‑based simulations and modelling of EXAFS spectra. Sci Rep. 2023;13(1):4983. http://doi.org/10.1038/s41598-023-32051-3
» http://doi.org/10.1038/s41598-023-32051-3 -
49 Sheng HW, Luo WK, Alamgir FM, Bai JM, Ma E. Atomic packing and short-to-medium range order in metallic glasses. Nature. 2006;439(7075):419-25. http://doi.org/10.1038/nature04421
» http://doi.org/10.1038/nature04421 -
50 Wu SY, Wei SH, Guo GQ, Wang JG, Yang L. Structural mechanism of the enhanced glass-forming ability in multicomponent alloys with positive heat of mixing. Sci Rep. 2016;6(1):38098. http://doi.org/10.1038/srep38098
» http://doi.org/10.1038/srep38098 -
51 Adibi S, Branicio PS, Zhang YW, Joshi SP. Composition and grain size effects on the structural and mechanical properties of CuZr nanoglasses. J Appl Phys. 2014;116(4):043522. http://doi.org/10.1063/1.4891450
» http://doi.org/10.1063/1.4891450 -
52 Hu YC, Li FX, Li MZ, Bai HY, Wang WH. Five-fold symmetry as indicator of dynamic arrest in metallic glass-forming liquids. Nat Commun. 2015;6(1):8310. http://doi.org/10.1038/ncomms9310
» http://doi.org/10.1038/ncomms9310 -
53 Li MZ. Correlation between local atomic symmetry and mechanical properties in metallic glasses. J Mater Sci Technol. 2014;30(6):551-9. http://doi.org/10.1016/j.jmst.2014.05.001
» http://doi.org/10.1016/j.jmst.2014.05.001 -
54 Sheriff K, Cao Y, Smidt T, Freitas R. Quantifying chemical short-range order in metallic alloys. Proc Natl Acad Sci USA. 2024;121(25):e2322962121. http://doi.org/10.1073/pnas.2322962121
» http://doi.org/10.1073/pnas.2322962121 -
55 Cowley JM. An approximate theory of order in alloys. Phys Rev. 1950;77(5):669-75. http://doi.org/10.1103/PhysRev.77.669
» http://doi.org/10.1103/PhysRev.77.669 - 56 Warren BE. X-ray diffraction. New York: Dover Publications; 1990.
-
57 Wu YC, Shao JL. MDAPY: a flexible and efficient analysis software for molecular dynamics simulations. Comput Phys Commun. 2023;290:108764. http://doi.org/10.1016/j.cpc.2023.108764
» http://doi.org/10.1016/j.cpc.2023.108764
-
Data Availability
The raw processed data required to reproduce these findings cannot be shared at this time as the data also forms part of ongoing study.