Effect of Spheroidizing and Normalizing Treatments on the Electromagnetic Behavior and Microstructural Transformations of Ferritic-Pearlitic Steel Wire for Flexible Marine Pipelines
Abstract
The tensile armor of flexible marine pipelines, responsible for the flow of oil and gas, is composed of the helical arrangement of steel wires subjected to complex stress modes that can cause unpredictable failures. Electromagnetic non-destructive testing (NDT) techniques are suitable for monitoring microstructural, morphological, and mechanical properties changes in deformed or heat-treated steels. In this study, a steel used in the manufacture of flexible Risers subjected to different heat treatments, with time and temperature variation, was investigated by SEM, XRD, and DSC, and related to the behavior of MBN, Magnetic Hysteresis, and Electrical Resistivity signals. The results indicate that the recovery process occurs in the spheroidizing at 600 and 700 °C; however, the behavior of the MBN envelope and the DSC curves suggest that the recrystallization only occurs in the treatments at 700 and 800 °C. The MBN peak has greater amplitude and lower energy to reach saturation due to the increased mobility of domain walls in spheroidized microstructure. In normalizing, the MBN peak was lower and the electrical resistivity higher, as the pearlitic microstructure and the multiplication of grain boundaries in recrystallization cause greater impediment to the movement of domain walls and the flow of free electrons.
Keywords:
Heat Treatment; Microstructural Characterization; Non-Destructive Testing; Magnetic Barkhausen Noise
1. Introduction
Due to the good mechanical properties of medium and high carbon pearlitic steel wires, such as high strength and adequate ductility, they are used in different applications, such as in the tensile armor of flexible pipelines used in the oil and gas industries. The manufacture of wires involves plastic deformation processes, such as hot rolling, drawing, and cold rolling, which induce significant changes in the microstructure of a metal, generating dislocations, residual stresses, reduction in interlamellar spacing, changes in grain morphology, and other defects1. Depending on the application, obtaining a specific structure and properties is necessary to bring better performance to this material. For this, heat treatment cycles must be optimized.
One of the main failure mechanisms in flexible pipelines is breaking the traction armor wires. Therefore, there is a need to develop techniques for continuous monitoring of equipment in order to detect possible defects and prevent catastrophic failures. Electromagnetic techniques in engineering components have proven to be a good option for non-destructive assessment of stress states and microstructural transformations, such as morphological alterations and grain recovery and recrystallization processes2,3.
When an alternating magnetic field is applied to polycrystalline ferromagnetic materials, the domain walls, interfaces between regions with different spontaneous polarization directions, move favorably to the field. Structural heterogeneities act as barriers to wall movement4. With the presence of these heterogeneities, such as voids5, inclusions6, dislocations7,8, residual stresses9,10, grain boundaries11,12, among others, the movement of domains ceases to occur smoothly and starts to be performed by jumps, producing the phenomenon known as the “Barkhausen Effect”13. The hysteresis loop is the characteristic magnetization curve obtained by the relationship between the magnetic induction B and the external magnetic field H. The region with the highest slope of the magnetization curve is also where the peaks of the Barkhausen signal can be seen14.
Some factors influence the electromagnetic behavior of materials. Gur and Davut2 observed that morphological changes from lamellar to spheroidized cementite cause an increase in the MBN signal as the distance between the carbides, which function as fixation sites, grows, allowing the domain walls to move more freely. Furthermore, MBN helps differentiate phases such as ferrite, cementite, and martensite15,16. When the material is subjected to tensile stresses, the magnetic domains tend to align in the direction of stress application, increasing the MBN signal and generating a narrower loop with greater inclination. On the other hand, compressive stresses align the domains in the perpendicular direction, generating lower signal levels and a wide hysteresis loop17,18. The amplitude of the MBN signal tends to decrease for intense plastic deformations, as the multiplication of dislocation "tangles" creates strong anchoring points that the domain walls can no longer overcome19,20. Work hardening makes the material harder, producing wider hysteresis curves21. Electromagnetic signals are also influenced by the hardness and carbon content of the material, as they are related to the density of anchorage points present in the microstructure10.
Electrical resistivity (ρ) is an intrinsic physical property of each material. It is related to an impediment suffered by charge carriers subjected to the action of an electric field excited by direct current (DC)22. Studies carried out by Oliveira and Padilha23 state that resistivity is very sensitive to the concentration of point defects, solute in solid solution, grain boundaries and crystalline defects such as dislocations.
This study aims to clarify the understanding between the behavior of different electromagnetic signals and the microstructural transformations caused by the variation in temperature and time in the heat treatments of spheroidizing and normalizing in pearlitic/ferritic steel wires used in the manufacture of flexible risers. For this, the techniques of Magnetic Barkhausen Noise (MBN), magnetic hysteresis and electrical resistivity measurements were used. The obtained signals were investigated regarding microstructural changes by Scanning Electron Microscopy (SEM), X-ray diffraction (XRD), Differential Scanning Calorimetry (DSC), and hardness tests. The knowledge about the microstructural correlations with the electromagnetic signals opens new possibilities to use the investigated methods in quality control applications of flexible pipes.
2. Material and Methods
The material studied was a pearlitic/ferritic steel wire, previously rolled and cold drawn during its manufacture to achieve high mechanical resistance for use in tensile armor of flexible pipelines in the oil and gas industry. The hardness and yield strength of the material were 341.8 HV and 714.6 MPa respectively. The chemical composition of the steel, presented in Table 1, was obtained by the Shimadzu Optical Emission Spectrometer model PDA-7000. The wire, supplied as received and untwisted, was cut into samples of 55 mm in length each, having dimensions of 6 x 15 mm in cross-section.
Heat treatments were carried out in an inert atmosphere of an argon furnace to avoid oxidation of the surface of the parts. The surface sanding process would cause the introduction of residual stresses that interfere with the MBN results. Three treatment temperatures (600, 700 and 800 °C) were adopted, varying the time (30, 60, and 90 min), and the initial condition of the samples (as received or cold rolled with a 35% reduction in the cross-section thickness). Cold rolling was carried out on the wire in the as received condition. All samples were air-cooled. The aim was to analyze the influence of these variables on the morphological changes of cementite, as well as on the recovery and recrystallization processes of the grains. Table 2 summarizes the eight treatments performed.
2.1. Microstructural characterization
The samples were prepared by the standard metallographic preparation method, sanded to 1200 mesh, and polished on cotton cloth using diamond paste with a granulometry of up to 1 µm. The pieces were cleaned in an ultrasonic bath and then attacked with 5% Nital for 5 seconds to reveal the microstructure in the cross-section. The Scanning Electron Microscope (SEM) of field emission Quanta 450 FEG – FEI® was used to acquire images.
2.2. X-Ray Diffraction (XRD)
X-ray diffraction analyses were carried out on the longitudinal plane surface of the samples. An X'Pert Pro diffractometer (PANalytical®) was used with an angular scan range of 45° to 105°, a step size of 0.02°, and a time between each step of 1.5 seconds. This was equipped with Co Kα radiation (λ = 1.7890 Å), operating with a voltage of 40 kV and a current of 45 mA. The refining of the diffractograms was performed using the GSAS-II software, based on the Rietveld method24.
To estimate the dislocation density (δ) and crystallite size (D), the Scherrer25 relations were used through Equations 1 and 2:
where k = 0.92 is the form factor associated with the steels, λ is the ray's wavelength, β is the full width at half maximum (FWHM) and θ is the X-ray diffraction angle given in degrees. The microstrain (ε) was calculated using the Stoke – Wilson formula26 given by Equation 3:
2.3. Differential Scanning Calorimetry (DSC)
The differential scanning calorimetry analyses were carried out in the TG-DSC STA F3 Jupiter® Netzsch equipment, using an inert argon atmosphere to avoid oxidation, and heated to 800 °C, with a heating rate of 10 °C/min. Circular samples with a diameter of 2.5 mm were prepared and inserted in an alumina crucible.
2.4. Hardness test
Vickers hardness (HV) tests were performed in accordance with ABNT NBR ISO 6507-1. The samples were sanded on both surfaces, with 6 measurements being taken per sample, discarding the 2 extreme measurements with greater dispersion.
2.5. Magnetic Barkhausen Noise (MBN)
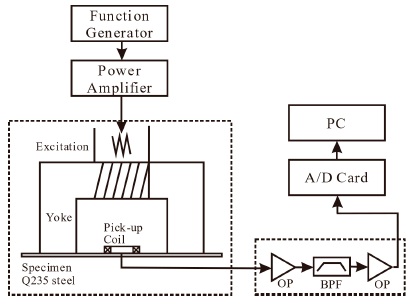
The Barkhausen Noise signals were captured by experimental equipment developed at the Laboratory of Dynamics and Instrumentation at Poli/USP, coupled to a probe with Fe-Si Yoke measuring 23 x 25 x 12 mm. This probe consisted of two excitation coils in parallel, responsible for applying the magnetic field, and an inductive sensor that detects the noise. Each excitation coil had 70 turns of 22 AWG enameled copper wire with a nominal diameter of 0.6438 mm, while the sensor consisted of a coil with 2000 turns of 44 AWG enameled wire with a nominal diameter of 0.0503 mm. The probe was positioned perpendicular to the surface of the samples in the rolling direction, as shown inFigure 1. Two excitation frequencies were used, 10 and 50 Hz, with a sinusoidal magnetic excitation signal, excitation amplitude of 2 V, and sampling frequency of 350 kHz, with 20 repetitions for each measurement. The frequency band and total amplification of the signal conditioner were from 0 to 100 Hz and up to 2000 amplifications respectively. The data acquisition board used was the National Instruments USB-6251 194929-03 OEM BNC 16-bit, 1.25 MS/s M series multifunctional DAQ. The equipment was coupled to a computer responsible for amplifying the signal, controlling the variables, and performing the data acquisition. By means of a bandpass filter, the signal amplification and filtering are done before it is digitized on the acquisition board.

2.6. Hysteresis loop
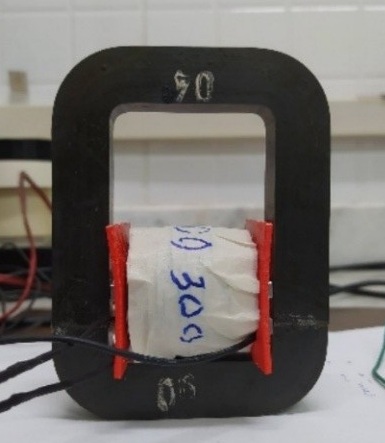
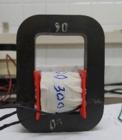
To obtain the magnetic hysteresis loop, a coil with two winding levels was constructed. The external coil, responsible for creating the excitation magnetic field, had 800 turns of 20 AWG copper wire, with a nominal diameter of 0.8119 mm. The internal coil, responsible for capturing the signal, had 300 turns of 44 AWG wire, whose nominal diameter is 0.0503 mm. As shown in Figure 2, the sample is positioned inside the coil, which is fitted inside a metal structure that closes the magnetic circuit, minimizing the demagnetizing field. The arrangement was connected to the Barktech source used for MBN measurement. Due to the low magnetization power of this source, a high-power Kepco® BOP amplifier was used so that the magnetization achieved would come as close as possible to magnetic saturation in the hysteresis loop measurements, taking into account the considerable samples size. A sampling frequency of 400 kHz, excitation current of 5 A, excitation amplitude of 5 V, and excitation frequency of 1 Hz were used.
2.7. Electrical resistivity
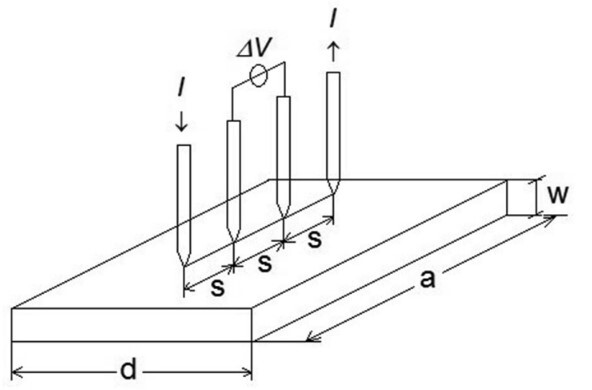
Two KEYSIGHT multimeters were used to measure resistivity coupled to a four-terminal probe arranged in line in the rolling direction and positioned on the sample's surface (Figure 3). The two inner needles, connected to the upper multimeter, measured the potential drop. The lower multimeter, connected to the two extremity needles, measured the supplied current. Samples were excited by direct current (DC) using an AFR DC power supply. Girotto and Santos22 describe appropriate equations for calculating resistivity and correction factors related to sample format.
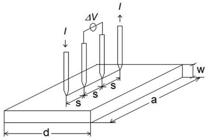
Arrangement for resistivity measurements on sample positioned under the four-terminal probe. Adapted from Girotto and Santos22.
3. Results and Discussion
3.1. Microstructural analysis
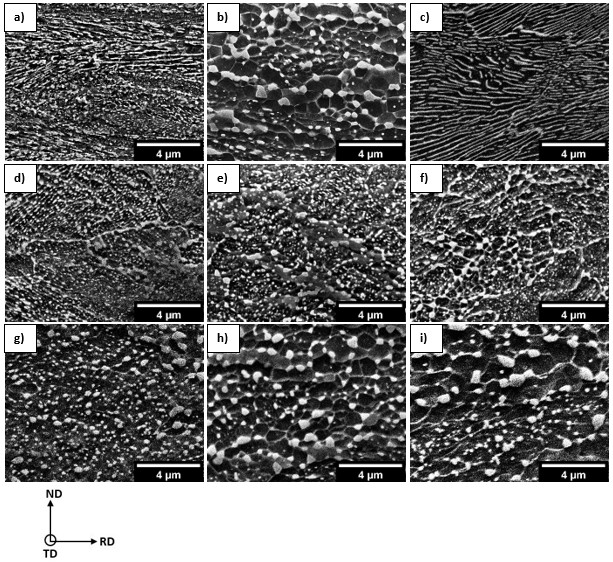
Figure 4presents the micrographs obtained by SEM of the cross-section of the samples. As a result of the thermomechanical processing used to manufacture the wires, it is observed that the microstructure of the sample as received (a) has discontinuous and brittle lamellae, in addition to small globular particles, indicating non-uniformity in the morphology of the cementite.
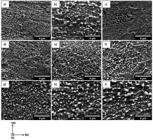
Scanning Electron Microscopy (SEM) of the cross-section of the sample (a) as-received (AR), (b) cold-rolled with 35% reduction followed by treatment at 700 °C for 60 min, (c) treated at 800 °C for 60 min, (d) spheroidized at 600 °C for 30 min, (e) 60 min and (f) 90 min, and (g) spheroidized at 700 °C for 30 min, (h) 60 min and (i) 90 min.
The treatments carried out at 600 °C, (d), (e), and (f) produced a microstructure formed by partially or spheroidized carbides disposed of in the ferritic matrix. The ease of diffusion favors the growth of particles in the grain boundaries due to the more significant number of defects and the greater free energy available in this region.
InFigure 4(g), (h), and (i), the evolution of spheroidizing at 700 °C is observed with treatment times of 30, 60, and 90 min, respectively. For both temperatures (600 and 700 °C), a growth in cementite particles is observed with increasing heat treatment time. The prolonged time spent at high temperatures favors carbon diffusion and the formation of concentrated carbides in a spherical shape. This phenomenon is driven by reduced interfacial and accumulated energy due to the previous deformation suffered by the wire in manufacturing. However, it is noted that for temperatures closer to the austenitic transformation (700°C), the degree of spheroidizing becomes more expressive, and the growth of the particles is more accelerated due to the greater energy available for the diffusion and coalescence of the carbides. Figure 4(b) shows the microstructure of the initially
cold-rolled sample with a 35% reduction in cross-section followed by heat treatment at 700 °C for 60 min. Depending on the degree of deformation applied, a previous deformation process can facilitate the spheroidizing of the microstructure due to the initial breakage of the cementite with an unfavorable orientation to the rolling direction, causing an increase in the number of carbides dispersed in the ferritic matrix. In (c), the sample's microstructure normalized at 800 °C for 60 min is observed. As the treatment was carried out at a temperature in the austenitic field, there was a phase transformation, obtaining a final microstructure of fine pearlite.
3.2. XRD investigation
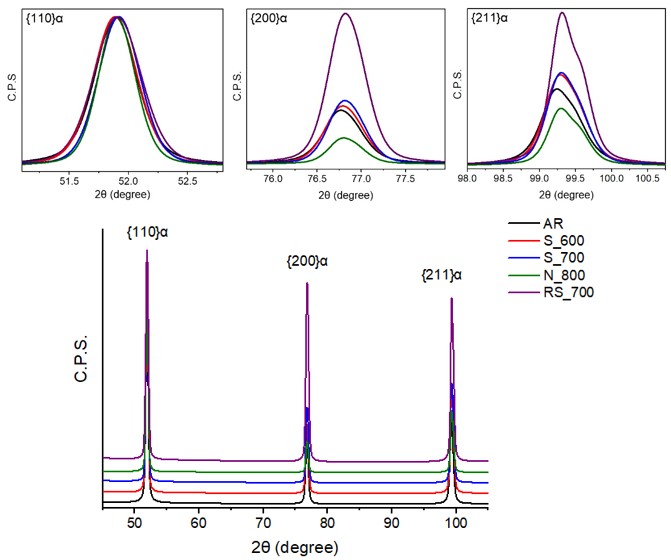
Figure 5shows the diffraction patterns for as-received (AR) and heat-treated conditions for 60 min. Three diffraction peaks associated with the planes {110}, {200}, and {211}, corresponding to the ferritic matrix, were identified.

The spheroidizing treatments at 600 and 700 °C cause a slight increase in the intensity of the peaks, while in the normalizing at 800 °C there is a reduction in the intensity relative to the plane families {200} and {211}, compared to the sample peaks AR. The intensity increased considerably in the RS_700 sample, and the peaks became wider with cold rolling. The greater the intensity of the peaks, the greater the texture influence. The fragmentation of cementite and the increase in the density of dislocations caused by deformation generate more significant distortion in the crystalline lattice and cause an increase in stored energy, which can lead to an intensification of the crystallographic texture28.
The diffraction peaks were refined based on the Rietveld method, where the dislocation density (δ), microstrains (ε), and lattice parameter (a) were calculated, in addition to the interplanar distance (d), width (FWHM) and position (2θ) of the peaks. InFigure 6, it is observed that increasing the heat treatment temperature causes a reduction in both the dislocation density and microstrains. The sample N_800 showed a dislocation density of 4.45 x 10¹⁴ m-2, compared to the sample AR, with 7.30 x 10¹⁴ m-2. The microstrain reduced from 1.9 x 10⁻³ (AR) to 1.5 x 10⁻³ (N_800). This behavior indicates the occurrence of recovery processes, recrystallization, stress relief, annihilation of dislocations, and reduction of crystalline defects in the steel subjected to normalizing heat treatment.

Dislocation Density (δ) and Microstrains (ε) calculated for conditions as received and heat treated for 60 min.
The previous cold rolling process on the RS_700 sample caused a considerable increase in the dislocation density (39.9 x 10¹⁴ m-2) and microstrains (4.54 x 10⁻³) due to the multiplication of crystallographic defects. The spheroidizing treatment applied caused some microstructure recovery, but restoring the material to its initial conditions was insufficient.
3.3. Differential Scanning Calorimetry (DSC)
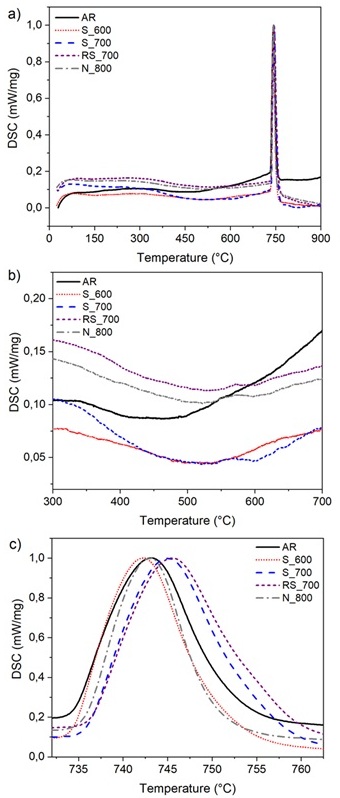
Differential Scanning Calorimetry (DSC) tests were performed on samples as received (AR) and treated for 60 min (Figure 7). The tests made it possible to identify the temperature ranges of occurrence of the phenomena of most significant interest in the material. It is possible to notice an exothermic region at lower temperatures (b), and an endothermic peak at higher temperatures (c).
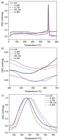
(a) DSC curves of as-received (AR) and heat treated for 60 min conditions. (b) Exothermic and (c) endothermic reactions from DSC curves.
According to Nath et al.29, the endothermic reaction corresponds to the phase transformation of ferrite (α) into austenite (γ), including austenite nucleation and growth. On the other hand, the exothermic reaction is influenced by changes in the microstructure. The wide temperature range of the peak may result from the spheroidizing of the cementite present in the pearlitic steel30, with consequent minimization of the surface energy that occurs due to the morphological changes; the annihilation of dislocations by the defect recovery process31; or even by the recrystallization of new grains, with a reduction in the internal energy accumulated as a result of the previously performed cold deformation.
When observing the exothermic reactions (Figure 7(b)), it is noted that the curves of the spheroidized samples at 600 and 700 °C are lower than the AR sample, while the curves of the samples N_800 and RS_700 are higher. The factors that may be involved in the exothermic reaction are morphological transformations of the microstructure, recovery, and recrystallization.
When analyzing the endothermic reaction (Figure 7(c)), it is observed that the sample RS_700 showed the highest temperatures at the beginning, peak, and end of the phase transformation process. This shows that a previous cold rolling process delays the transformation of the austenitic phase since the microstructure recovery takes longer in deformed samples. The sample S_600 showed the lowest temperature values in the reaction, showing that the phase transformation occurs more easily for a material with initially spheroidized and recovered microstructure.
It is concluded that only in the sample treated at 800 °C was an austenitic phase transformation completed at a maximum temperature of 760 °C (Figure 7(c)). The exothermic reaction occurs entirely in all heat treatments analyzed, except in the spheroidizing at 600 °C, as the reaction is completed in a temperature range that varies from 570 to 643 °C, as indicated by the test. Therefore, recovery and recrystallization, associated with the exothermic reaction (Figure 7 (b)), processes may have occurred more effectively in samples treated at 700 and 800 °C.
3.4. Magnetic Barkhausen Noise (MBN)
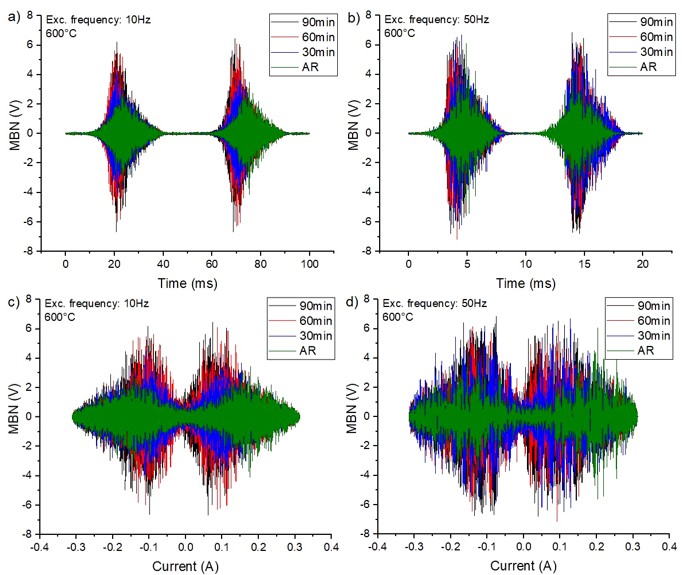
Different variables influence the MBN signal, so it is necessary to make an adequate selection of the parameters used to obtain a correct reading of the signal concerning the transformations that occurred in the material. In this work, noise was measured in the time and current domains, with excitation frequencies of 10 and 50 Hz.Figure 8shows the first two MBN excitation signals for samples heat treated at 600 °C compared to the sample as received. It is observed that, for both time and current, the peak of the signal tends to grow with increasing heat treatment time, in addition to having its position shifted to the left with respect to time (a) and (b) and towards the center tending to zero current (c) and (d).
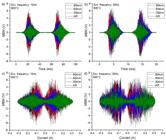
Variation of the MBN signal as a function of heat treatment time at 600 °C in the time (a) and (b), and current (c) and (d) domain, with excitation frequencies of 10 and 50 Hz, respectively.
The response with 50 Hz frequency is more discontinuous and dispersed than the signal obtained with 10 Hz. This effect occurs because
the increase in frequency produces increments in eddy currents, responsible for generating magnetic fields in reaction to the applied external field. As the frequency increases, the penetration of the MBN signal decreases, and the current distribution becomes denser on the surface, causing a growth in the superposition of pulses in the system32,33.
To analyze the influence of microstructural transformations on the MBN,Figure 9will consider the noise envelope curves referring to the signals inFigure 8(a). In the samples treated at 600 °C (a), as the spheroidizing time duration increases, the peaks' amplitude grows. The position of the peak tends to shift towards a lower magnetic field strength, reaching an MBNmax of 2.83 V in the specimen treated at 600oC for 90 min, in contrast to 1.32 V in the AR condition. This occurs due to the reduction in the area of attachment sites of domain walls as a consequence of the morphological changes in the microstructure. The average distance between cementite particles increases, allowing the domain walls to move more freely3, resulting in a lower magnetic field and higher Barkhausen activity.
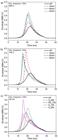
MBN envelopes under the conditions: (a) spheroidized at 600 °C, (b) treated at 700 °C and (c) heat treated for 60 min.
The spheroidizing at 700 °C (b) showed an MBNmax peak of 3.69 V in the sample with the shortest treatment time (30 min). As time increases, the peak decreases, reaching the MBNmax of 3.18 V in the sample with 90 min of treatment. This effect may be related to the microstructural transformations produced by the recovery and recrystallization of the grains. On the one hand, the reduction in dislocation density (Figure 6) caused by recrystallization decreases the number of sites for pinning the domain walls. However, during recrystallization there is an increase in the area of grain boundaries, becoming the predominant microstructural characteristic. The contours act as a barrier to the movement of the domain walls, which can cause a reduction in the MBN signal with the gradual increase in the heat treatment time.
Observing the envelopes of treated samples for 60 min (c), it is noted that the amplitude of peaks of treated samples is higher than the sample as received. The peaks tend to shift towards a lower magnetic field strength. The sample S_700 showed the highest MBNmax (3.51 V) and the shortest time to reach saturation (15.5 ms). However, the sample RS_700 showed a lower peak (2.14 V) and a saturation time of 18.0 ms. This effect is a consequence of the increase in the density of dislocations caused by previous deformation (Figure 6), which act as attachment points, reducing the signal. The sample N_800 showed the lowest MBNmax (1.99 V) among the treated samples. The pearlitic microstructure has a larger cementite-ferrite interface area than the spheroidized one, which acts as a barrier to the movement of the domain walls. The treatment above the austenitization temperature facilitates the recrystallization process. With the increase in the area of grain boundaries, the movement of magnetic domains is hampered3.
3.5. Magnetic hysteresis
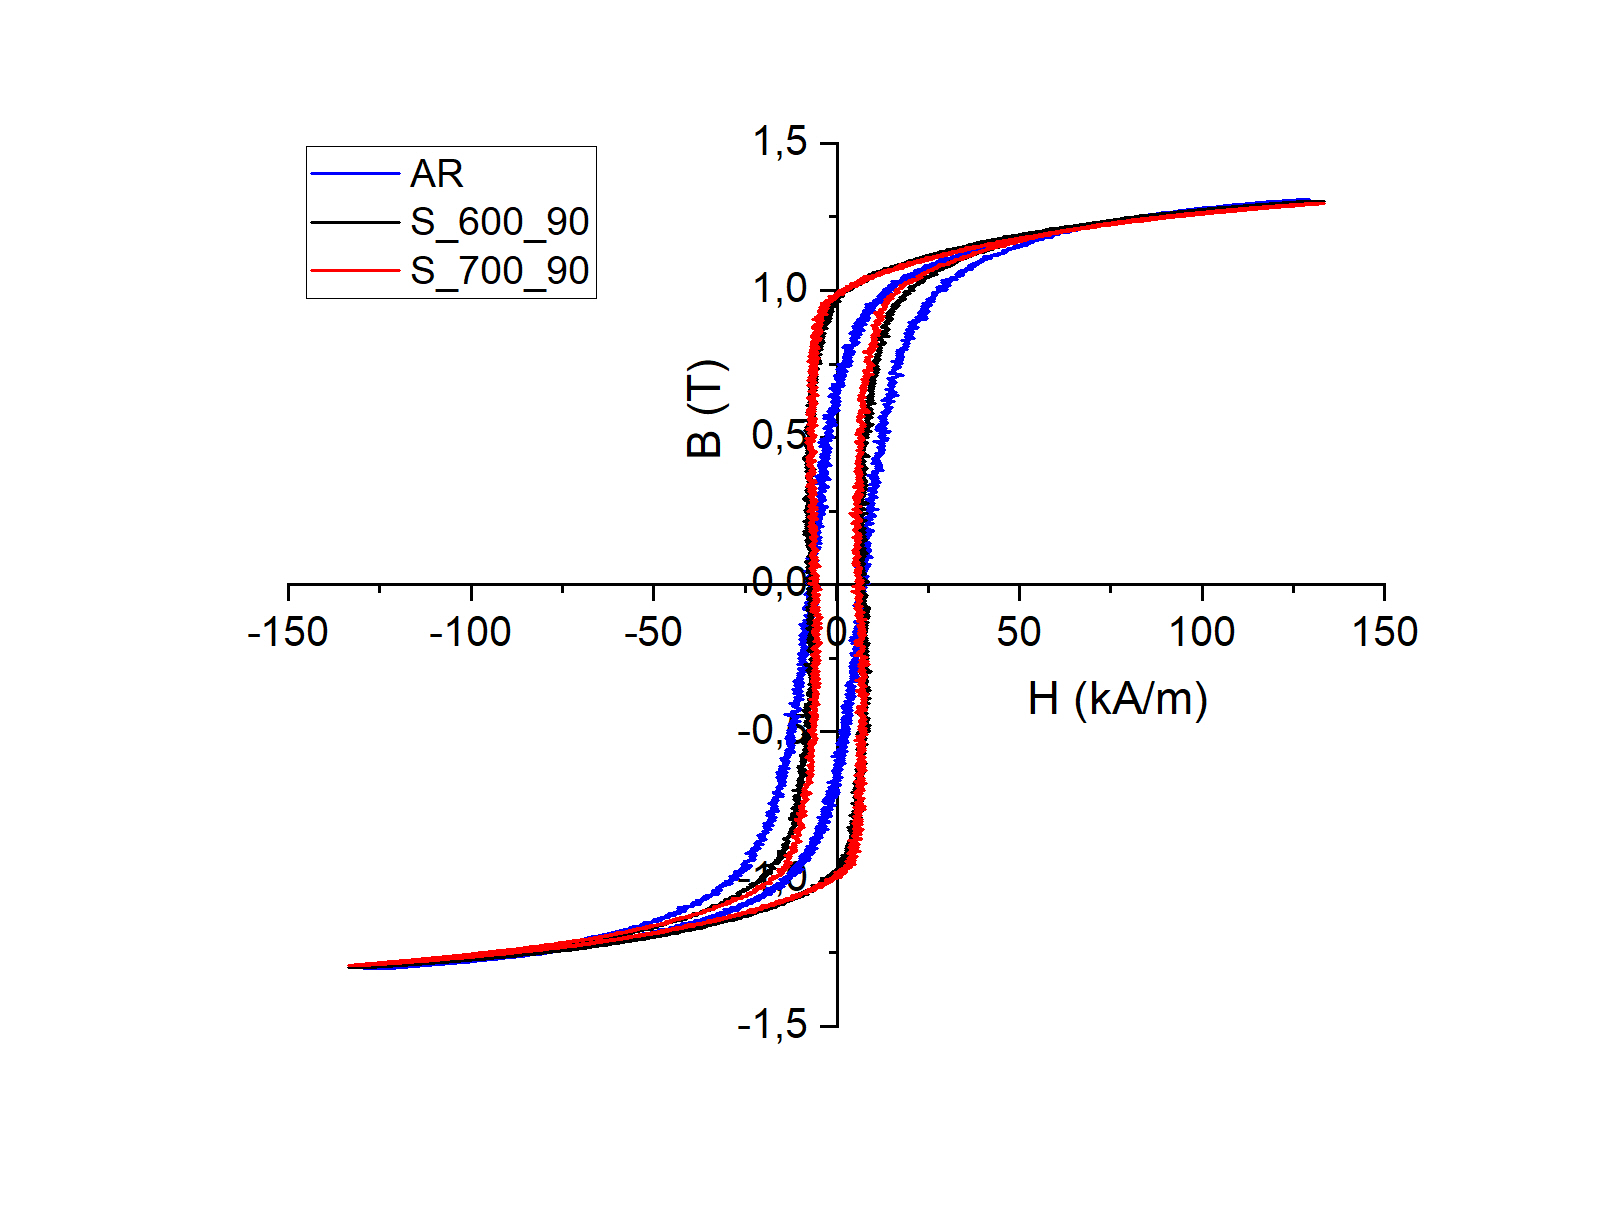
The hysteresis loop (Figure 10) was constructed for the as-received condition and spheroidized for 90 min at 600 °C and 700 °C. Despite the difference between the curves not being so significant, it can be noted that the heat-treated samples presented thinner loops and with a greater inclination compared to the sample AR; that is, there was a reduction in the coercive force (Hc) and an increase in the induction of remanence (Br) with the heat treatments. This behavior is typical of soft materials, which are easier to magnetize and demagnetize. This effect is related to stress relief and reduction of discontinuities and crystalline defects that decrease during recovery and recrystallization in heat treatment.
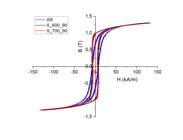
Hysteresis curves for as received (AR) and spheroidized samples at 600 °C and 700 °C for 90 min.
Table 3 exposes the quantitative data extracted from the hysteresis curves. With decreasing anchorage points in the treated samples, the energy required to move the domains in the magnetization process decreases. The area inside the loop represents this energy loss caused by the irreversible movement of the domain walls34.
Quantitative data of the maximum induction (Bmax), maximum magnetic field (Hmax), remanence induction (Br), coercive field (Hc), slope (θ) and Curve Area for conditions as received and spheroidized over 90 min.
3.6. Electrical resistivity
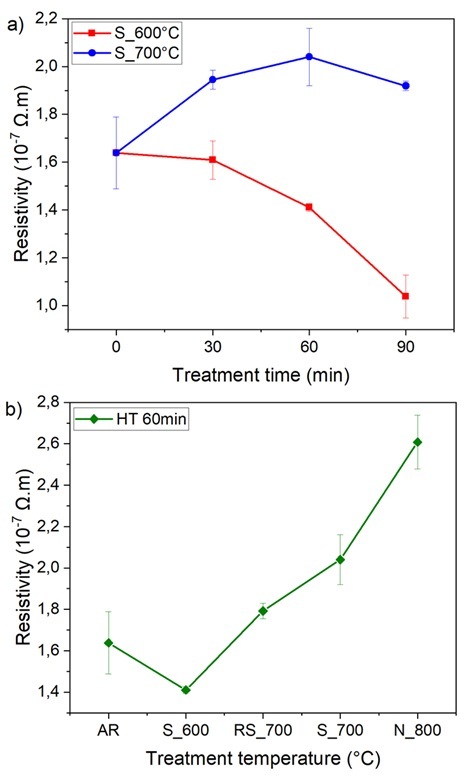
The electrical resistivity (ρ) indicates the degree of difficulty to the passage of an electric current flow in the material, representing the inverse of the electrical conductivity (σ).Figure 11shows the resistivity results for the different heat treatment conditions.
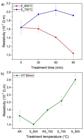
Behavior of electrical resistivity (ρ) in samples (a) spheroidized at 600 °C and 700 °C with time variation and (b) heat treated for 60 min.
In the treatment at 600 °C (a), a decrease in resistivity can be seen with increasing heat treatment time. Such behavior may be related to the growth of the spheroidizing degree or to the microstructure's recovery, which increases with time. In the treatment at 700 °C, the curve shows a tendency for resistivity to increase with time. This effect may be associated with the multiplication of grain boundaries in recrystallization, which act as barriers to the flow of free electrons, influencing the material's conductivity.
In treatments carried out for 60 min (b), it is noted that, with the increase in temperature, there is a growth in electrical resistivity, except for the S_600 condition. The sample RS_700 has a resistivity of 1.79 x 10⁻⁷ Ω.m, lower than the sample that was not previously deformed (S_700), which has a resistivity of 2.04 x 10⁻⁷ Ω.m. Due to the cold plastic deformation suffered, the RS_700 sample has a higher density of dislocations and vacancies, which should increase the electrical resistivity. However, during the heat treatment, there was a more significant expense of deformation energy in the recovery process. In contrast, in the sample that was not previously cold rolled, the energy was spent in the recrystallization process, increasing the area of grain boundaries.
3.7. Relationship between hardness and magnetic parameter RMSMBN
Figure 12 presents graphs comparing the RMSMBN parameter's evolution to hardness. The RMSMBN is a statistical parameter, given in volts, which characterizes the power of the MBN signal over time, given by Eq. 4:
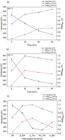
Relationship between the HV hardness and the RMSMBN parameter at the excitation frequencies of 10 and 50 Hz for the samples (a) spheroidized at 600 °C and (b) 700 °C with time variation and (c) treated for 60 min with temperature variation.
where Vi is the voltage measured at a given time, Vm is the mean value of the signal and n is the number of observations of the signal.
It can be seen that the RMS behavior of the excitation frequencies of 10 and 50 Hz is similar, being higher for 50 Hz due to the larger measured voltage values. In the samples treated at 600 °C (a) and 700 °C (b), the increase in treatment time causes a decrease in hardness, indicating a continuous reduction in the density of crystalline defects. For 90 min of treatment, at 600 °C, a 13.0% reduction in HV hardness was obtained. At 700 °C, there was a reduction of 34.5%, indicating a more pronounced softening due to recovery and recrystallization.
The increase in RMSMBN at 600 °C is related to the reduction of the anchoring points of the domain walls, which occurs as a consequence of the recovery and increase in the degree of spheroidizing of the microstructure. At 700 °C, the RMSMBN had a growth peak and began to decrease with increasing time. This effect may be related to the onset of recrystallization.
In (c), it is noted that the rolled sample followed by treatment at 700 °C presented the lowest hardness (226.9 HV) among the samples treated for 60 min. The application of cold deformation prior to annealing can accelerate the spheroidizing process, since new sites with greater diffusivity are inserted into the crystal lattice. However, the multiplication of defects during deformation gives rise to new anchoring points, leading to a reduction in the signal. In the specimen treated at 800 °C and normalized (N_800) the hardness increased again (263.4 HV) and the RMS continued to decrease. This behavior is consistent with the pearlitic microstructure obtained and with the recrystallization process mentioned above.
4. Conclusions
The effect of temperature and heat treatment time on a steel used in flexible marine pipelines was investigated to understand the microstructural and morphological transformations by means of electromagnetic techniques. These techniques can be effectively used to monitor the condition of a mechanical component in a non-destructive manner, identifying the microstructure and preventing failures.
It is worth noting that the MBN signal is very sensitive, being influenced by the combination of factors such as surface finish, non-uniform pre-manufacturing processing, distribution of surface stresses and crystalline defects throughout the material. Therefore, it is important that the signal analysis be performed carefully and in combination with other analyses, such as SEM, XRD and DSC, to confirm its effectiveness in evaluating microstructural and morphological transformations.
The increase in temperature causes a more significant growth in cementite particles than the increase in spheroidizing time due to diffusional processes.
DSC analyses indicate that there is a greater probability of effective recovery and recrystallization processes occurring for the treatments at 700 and 800 °C and only recovery for the treatment at 600 °C.
The reduction in cementite surface area upon spheroidizing produces a MBN signal with a higher peak amplitude and a hysteresis loop with a smaller internal area, indicating a lower energy loss to reach magnetic saturation.
The multiplication of dislocations in the previous cold rolling, the increase in the cementite/ferrite interface area in the pearlitic microstructure in the normalizing treatment, and the increase of the grain boundary area in the recrystallization provoke a reduction in the amplitude of the MBN signal compared to the spheroidizing treatments. This is attributed to the multiplication of barriers to the movement of magnetic domains.
The growth in the area of grain boundaries in recrystallization causes an increase in electrical resistivity, indicating a significant impediment to the flow of free electrons.
5. Acknowledgments
The authors acknowledge the financial support of the National Council for Scientific and Technological Development (CNPq), the Coordination for the Improvement of Higher Education Personnel (CAPES), and the Foundation for Supporting Technical Services, Teaching and Fostering Research (ASTEF). Experimental support was provided by the Non-Destructive Testing Laboratory (LEND), Mechanical Testing Laboratory (LEM) at UFF/Niterói, Materials Characterization Laboratory (LACAM) and Central Analítica-CT-INFRA/MCTI-SISANO/ Pró-Equipamentos CAPES at UFC/Fortaleza.
-
Data Availability
Data supporting the findings of this study will be provided upon request. Please contact [samillekc@gmail.com] for more information.
6. References
-
1 Toribio J. Relationship between microstructure and strength in eutectoid steels. Mater Sci Eng A. 2004;227–30:227-30. http://doi.org/10.1016/j.msea.2004.01.084
» http://doi.org/10.1016/j.msea.2004.01.084 -
2 Gur CH, Davut K. Non-destructive characterization of pearlite spheroidisation by magnetic barkhausen noise method. In: 17th World Conference on Nondestructive Testing; 2008 Oct 25-28; Shanghai, China. Proceedings. Vienna: International Committee for Non-Destructive Testing; 2008 [cited 2022 Oct 13]. Available from: https://www.researchgate.net/publication/237333051
» https://www.researchgate.net/publication/237333051 -
3 Gurruchaga K, Martinez-de-Guerenu A, Soto M, Arizti F. Magnetic Barkhausen noise for characterization of recovery and recrystallization. IEEE Trans Magn. 2010;46(2):513-6. http://doi.org/10.1109/TMAG.2009.2029069
» http://doi.org/10.1109/TMAG.2009.2029069 -
4 Lindgren M, Lepisto T. Effect of cyclic deformation on Barkhausen noise in a mild steel. NDT Int. 2003;36(6):401-9. http://doi.org/10.1016/S0963-8695(03)00031-8
» http://doi.org/10.1016/S0963-8695(03)00031-8 -
5 Blachnio J, Dutkiewicz J, Salamon A. The effect of cyclic deformation in a 13% Cr ferritic steel on structure and Barkhausen noise level. Mater Sci Eng A. 2002;323(1-2):83-90. http://doi.org/10.1016/S0921-5093(01)01368-5
» http://doi.org/10.1016/S0921-5093(01)01368-5 -
6 Honkanen M, Santa-aho S, Laurson L, Eslahi N, Foi A, Vippola M. Mimicking Barkhausen noise measurement by in-situ transmission electron microscopy: effect of microstructural steel features on Barkhausen noise. Acta Mater. 2021;221:117378. http://doi.org/10.1016/j.actamat.2021.117378
» http://doi.org/10.1016/j.actamat.2021.117378 -
7 Buttle DJ, Scruby CB, Jakubovics JP, Briggs GAD. Magneto-acoustic and Barkhausen emission: their dependence on dislocations in iron. Philos Mag A Phys Condens Matter Defects Mech Prop. 1987;55(6):717-34. http://doi.org/10.1080/01418618708214379
» http://doi.org/10.1080/01418618708214379 -
8 Neslusan M, Pitonak M, Capek J, Kejzlar P, Trsko L, Zgútová K, et al. Measurement of the rate of transformation induced plasticity in TRIP steel by the use of Barkhausen noise emission as a function of plastic straining. ISA Trans. 2022;125:318-29. http://doi.org/10.1016/j.isatra.2021.07.015
» http://doi.org/10.1016/j.isatra.2021.07.015 -
9 Mandal K, Loukas ME, Corey A, Atherton DL. Magnetic Barkhausen noise indications of stress concentrations near pits of various depths. J Magn Magn Mater. 1997;175(3):255-62. http://doi.org/10.1016/S0304-8853(97)00278-3
» http://doi.org/10.1016/S0304-8853(97)00278-3 -
10 Vourna P, Ktena A, Tsakiridis PE, Hristoforou E. A novel approach of accurately evaluating residual stress and microstructure of welded electrical steels. NDT Int. 2015;71:33-42. http://doi.org/10.1016/j.ndteint.2014.09.011
» http://doi.org/10.1016/j.ndteint.2014.09.011 -
11 Yamaura S, Furuya Y, Watanabe T. The effect of grain boundary microstructure on Barkhausen noise in ferromagnetic materials. Acta Mater. 2001;49(15):3019-27. http://doi.org/10.1016/S1359-6454(01)00189-6
» http://doi.org/10.1016/S1359-6454(01)00189-6 -
12 Anglada-Rivera J, Padovese LR, Capó-Sanchez J. Magnetic Barkhausen Noise and hysteresis loopin comercial carbon steel: influence of applied tensile stress and grain size. J Magn Magn Mater. 2001;231(2-3):299-306. http://doi.org/10.1016/S0304-8853(01)00066-X
» http://doi.org/10.1016/S0304-8853(01)00066-X -
13 Stefanita CG. From bulk to nano: the many sides of magnetism. Berlin: Springer; 2008. Chapter 2, Barkhausen noise as a magnetic nondestructive testing technique; p. 19-40. (vol. 117). http://doi.org/10.1007/978-3-540-70548-2_2
» http://doi.org/10.1007/978-3-540-70548-2_2 -
14 Jiles DC. The effect of stress on magnetic Barkhausen activity in ferromagnetic steels. IEEE Trans Magn. 1989;25(5):3455-7. http://doi.org/10.1109/20.42333
» http://doi.org/10.1109/20.42333 -
15 Astudillo MRN, Núñez NM, Pumarega MIL, Ferrari G, Ruzzante J, Gómez M. Study of martensite induced by deformation with Magnetic Barkhausen Noise technique. J Magn Magn Mater. 2022;556(15):169454. http://doi.org/10.1016/j.jmmm.2022.169454
» http://doi.org/10.1016/j.jmmm.2022.169454 -
16 Davut K, Gür CH. Monitoring the microstructural changes during tempering of quenched SAE 5140 steel by magnetic barkhausen noise. J Nondestr Eval. 2007;26(2-4):107-13. http://doi.org/10.1007/s10921-007-0025-x
» http://doi.org/10.1007/s10921-007-0025-x -
17 Capo-Sanchez J, Pérez-Benitez JA, Padovese LR. Analysis of the stress dependent magnetic easy axis in ASTM 36 steel by the magnetic Barkhausen noise. NDT Int. 2007;40(2):168-72. http://doi.org/10.1016/j.ndteint.2006.09.003
» http://doi.org/10.1016/j.ndteint.2006.09.003 -
18 Amiri MS, Thielen M, Rabung M, Marx M, Szielasko K, Boller C. On the role of crystal and stress anisotropy in magnetic Barkhausen noise. J Magn Magn Mater. 2014;372:16-22. http://doi.org/10.1016/j.jmmm.2014.07.038
» http://doi.org/10.1016/j.jmmm.2014.07.038 -
19 Campos MA, Capó-Sánchez J, Benítez JP, Padovese LR. Characterization of the elastic–plastic region in AISI/SAE 1070 steel by the magnetic barkhausen noise. NDT Int. 2008;41(8):656-9. http://doi.org/10.1016/j.ndteint.2008.03.003
» http://doi.org/10.1016/j.ndteint.2008.03.003 -
20 Stefanita CG, Atherton DL, Clapham L. Plastic versus elastic deformation effects on magnetic Barkhausen noise in steel. Acta Mater. 2000;48(13):3545-51. http://doi.org/10.1016/S1359-6454(00)00134-8
» http://doi.org/10.1016/S1359-6454(00)00134-8 -
21 Titto K. Use of Barkhausen effect in testing for residual stresses and material defects. NDT Int. 1991;24(1):36-41. http://doi.org/10.1016/0963-8695(91)90713-D
» http://doi.org/10.1016/0963-8695(91)90713-D -
22 Girotto EM, Santos IA. Medidas de resistividade elétrica DC em sólidos: como efetuá-las corretamente. Quim Nova. 2002;25(4):639-47. http://doi.org/10.1590/S0100-40422002000400019
» http://doi.org/10.1590/S0100-40422002000400019 -
23 Oliveira JCPT, Padilha AF. Caracterização microestrutural dos alumínios comerciais AA1100, AA1050 e AA1070 e do alumínio superpuro AA1199. Met Mater. 2009;62(3):373-8. http://doi.org/10.1590/S0370-44672009000300017
» http://doi.org/10.1590/S0370-44672009000300017 -
24 Rietveld HM. A profile refinement method for nuclear and magnetic structures. J Appl Cryst. 1969;2(2):65-71. http://doi.org/10.1107/S0021889869006558
» http://doi.org/10.1107/S0021889869006558 - 25 Muramba V, Mageto M, Gaitho F, Odari V, Musembi R, Mureramanzi S, et al. Structural and optical characterization of tin oxide codoped with aluminum and sulphur. American Journal of Materials Science. 2015;5(2):23-30. http://doi.org/10.5923/j.materials.20150502.01.
-
26 Parveen B, Hassan MU, Khalid Z, Riaz S, Naseem S. Room-temperature ferromagnetism in Ni-doped TiO2 diluted magnetic semiconductor thin films. J Appl Res Technol. 2017;15(2):132-9. http://doi.org/10.1016/j.jart.2017.01.009
» http://doi.org/10.1016/j.jart.2017.01.009 -
27 Hang C, Liu W, Wang P. A method of Barkhausen noise feature extraction based on an adaptive threshold. Appl Sci. 2019;9(15):2964. http://doi.org/10.3390/app9152964
» http://doi.org/10.3390/app9152964 -
28 Masoumi M, Loureiro RCP, Pinheiro P, Cardoso JL, Béres M, Abreu HFG. Effect of pre-strain on microstructure, texture, and strengthening of fully pearlitic steel. J Mater Eng Perform. 2022;31(6):4642-54. http://doi.org/10.1007/s11665-022-06579-w
» http://doi.org/10.1007/s11665-022-06579-w -
29 Nath SK, Ray S, Mathur VNS, Kapoor ML. Non-isothermal austenitisation kinetics and theoretical determination of intercritical annealing time for dual-phase steels. ISIJ Int. 1994;34(2):191-7. http://doi.org/10.2355/isijinternational.34.191
» http://doi.org/10.2355/isijinternational.34.191 -
30 Fang F, Hu X, Chen S, Xie Z, Jiang J. Revealing microstructural and mechanical characteristics of cold-drawn pearlitic steel wires undergoing simulated galvanization treatment. Mater Sci Eng A. 2012;547(15):51-4. http://doi.org/10.1016/j.msea.2012.03.075
» http://doi.org/10.1016/j.msea.2012.03.075 -
31 Borchers C, Lehmberg A, Deutges M, Cižek J, Kirchheim R. Effect of annealing on point defect population in cold-drawn pearlitic steel wires. Scr Mater. 2014;86:17-9. http://doi.org/10.1016/j.scriptamat.2014.04.016
» http://doi.org/10.1016/j.scriptamat.2014.04.016 -
32 Zou X, Wang L, Wang J, Liu J, Ma H, Bao Y. Nondestructive evaluation of carbon fiber reinforced polymer (CFRP)-steel interfacial debonding using eddy current thermography. Compos Struct. 2022;284(15):115133. http://doi.org/10.1016/j.compstruct.2021.115133
» http://doi.org/10.1016/j.compstruct.2021.115133 -
33 Jiles DC. Dynamics of domain magnetization and the Barkhausen effect. Czech J Phys. 2000;50(8):893-924. http://doi.org/10.1023/A:1022846128461
» http://doi.org/10.1023/A:1022846128461 -
34 Vashista M, Yusufzai MZK. Effect of magnetizing field strength and magnetizing frequency on hysteresis loop shape and its characteristics. IOP Conf Series Mater Sci Eng. 2018;346:012003. http://doi.org/10.1088/1757-899X/346/1/012003
» http://doi.org/10.1088/1757-899X/346/1/012003
Edited by
-
Associate Editor:
Jesualdo Rossi.
-
Editor-in-Chief:
Luiz Antonio Pessan.
Data supporting the findings of this study will be provided upon request. Please contact [samillekc@gmail.com] for more information.