 Mapping nitrogen-use responsiveness through image-based phenotyping in maize1
ABSTRACT
High-throughput phenotyping has emerged as a strategic tool in maize breeding, enabling the rapid and accurate assessment of agronomic traits. This study aimed to select vegetation indices derived from RGB imagery for the identification of high-yielding maize genotypes under contrasting nitrogen fertilization conditions at the plot level. A total of 35 maize genotypes were evaluated in a randomized complete block design with a split-plot arrangement and three replications, subjected to two nitrogen levels (20 and 140 kg ha-1). Four unmanned aerial vehicle flights were conducted at two altitudes (60 and 80 m), and genetic and spatial analyses were performed using mixed models (REML/BLUP). The flight conducted at 61 days after planting (V7/V8 stage) at 60 m of altitude exhibited the highest repeatability and accuracy. The blue green pigment index (BGI) demonstrated high sensitivity in discriminating nitrogen levels and in the indirect selection of high-yielding genotypes. The genotypes G42, G4, G34, G31, G20, G16, and G1 were identified as superior for grain yield. Vegetation indices based on the blue spectral band, such as BGI, are effective for the early selection of genotypes under nitrogen stress conditions prior to flowering.
KEYWORDS:
Zea mays L.; unmanned aerial vehicle; nitrogen stress; plant breeding.
RESUMO
A fenotipagem de alto rendimento é uma ferramenta estratégica para o melhoramento de milho, permitindo a avaliação rápida e acurada de caracteres agronômicos. Objetivou-se selecionar índices de vegetação baseados em imagens RGB para a identificação de genótipos de milho produtivos em situações distintas de adubação nitrogenada, em relação à parcela. Foram avaliados 35 genótipos de milho em delineamento de blocos casualizados, em esquema de parcelas subdivididas, com três repetições, submetidos a dois níveis de nitrogênio (20 e 140 kg ha-1). Realizaram-se quatro voos com veículo aéreo não tripulado, em duas alturas (60 e 80 m), utilizando-se modelos mistos (REML/BLUP) para análise genética e espacial. O voo realizado aos 61 dias após o plantio (V7/V8) a 60 m de altura apresentou a maior repetibilidade e acurácia. O blue green pigment index (BGI) demonstrou alta sensibilidade na discriminação dos níveis de nitrogênio e na seleção indireta de genótipos produtivos. Foram identificados os genótipos G42, G4, G34, G31, G20, G16 e G1 como superiores para produtividade de grãos. Índices baseados na banda do azul, como o BGI, são eficientes para a seleção de genótipos sob estresse de nitrogênio antes do florescimento.
PALAVRAS-CHAVE:
Zea mays L.; veículo aéreo não tripulado; estresse de nitrogênio; melhoramento vegetal.
INTRODUCTION
Maize (Zea mays L.) is one of the most widely cultivated cereals worldwide, and is characterized by its broad versatility of use, serving as a primary source of raw material across multiple sectors. Its high genetic variability enables adaptation to diverse climatic conditions, making it a crop of considerable socioeconomic importance (Erenstein et al. 2022).
In the 2024 growing season, the global maize production reached approximately 1.22 billion tons (FAO 2024). Within this context, Brazil maintained its relevance on the global stage, contributing with 115.7 million tons; whereas, at the regional level, the Sergipe state recorded 913.9 thousand tons (Conab 2024).
In regions such as the Brazilian Northeast, the maize production is constrained by edaphoclimatic factors, which are further exacerbated by the inefficient use of nitrogen fertilization, to which maize is highly responsive (Dantas et al. 2025). Therefore, early, rapid, and non-destructive monitoring becomes essential for decision-making aimed at minimizing nutrient stress and optimizing crop yield (Aslan et al. 2022). In this context, image-based monitoring methods, particularly using unmanned aerial vehicles (UAVs) equipped with RGB sensors, have emerged as valuable tools for agricultural management (Sarkar et al. 2021).
The use of UAVs integrated with high-resolution RGB sensors has increased substantially in agricultural applications. UAV-based image acquisition enables the extraction of crop-related information with high spatial and temporal resolution (Sarkar et al. 2021). These images provide precise and accurate data, and have been widely used for detecting pest and disease occurrence, identifying nutrient deficiencies, estimating plant stand, and predicting crop yield prior to physiological maturity (Liakos et al. 2018, Santos et al. 2023).
High-throughput phenotyping (HTP) has become a critical tool in plant breeding, allowing the rapid and precise quantification of plant phenotypes, with strong potential to accelerate the development of high-yielding and stress-tolerant cultivars (Bhandari et al. 2023, Silva et al. 2023, Zhang et al. 2023). Image-based phenotyping methods are efficient, non-destructive, and capable of large-scale data acquisition, making them particularly suitable for breeding programs (Gao et al. 2021).
Imaging sensors that capture reflectance in the red (R), green (G), and blue (B) spectral bands have been increasingly explored and developed to meet the growing demand for image analysis by integrating multiple optical properties, enabling the extraction of information not directly visible to the human eye (Miyata et al. 2026). These data are typically processed through vegetation indices, which are empirical formulations derived from reflectance values in RGB spectral bands (Loesdau et al. 2014). Such indices have been developed to assess vegetation characteristics using imaging sensors, and, among the 519 indices currently avaliable, 261 are specifically designed for agricultural applications (Henrich et al. 2012).
Studies have demonstrated that vegetation indices are widely applied in the diagnosis of physiological traits in crops (Xu et al. 2021, Cvetković et al. 2023). For instance, indices related to “greenness” are commonly used to estimate chlorophyll and nitrogen (N) content in leaves (Liu et al. 2021, Kior et al. 2024). Nitrogen plays a fundamental role in the synthesis of proteins, enzymes, and chlorophyll, directly influencing the green coloration of plants (Taiz et al. 2017). Nitrogen deficiency induces physiological changes such as foliar chlorosis, which can be detected through variations in RGB spectral reflectance (Colovic et al. 2024).
Despite advances in UAV-based remote sensing, most studies have focused on predicting average yield at the field scale. There remains a lack of methodological validation aimed at identifying selection efficiency at the experimental plot level (the fundamental unit in plant breeding), particularly for discriminating genotypes under nitrogen stress using low-cost RGB sensors. The hypothesis of this study is that vegetation indices based on specific spectral bands, particularly blue and green, can detect subtle reflectance variations associated with nitrogen-induced chlorosis prior to visual detection by the human eye.
MATERIAL AND METHODS
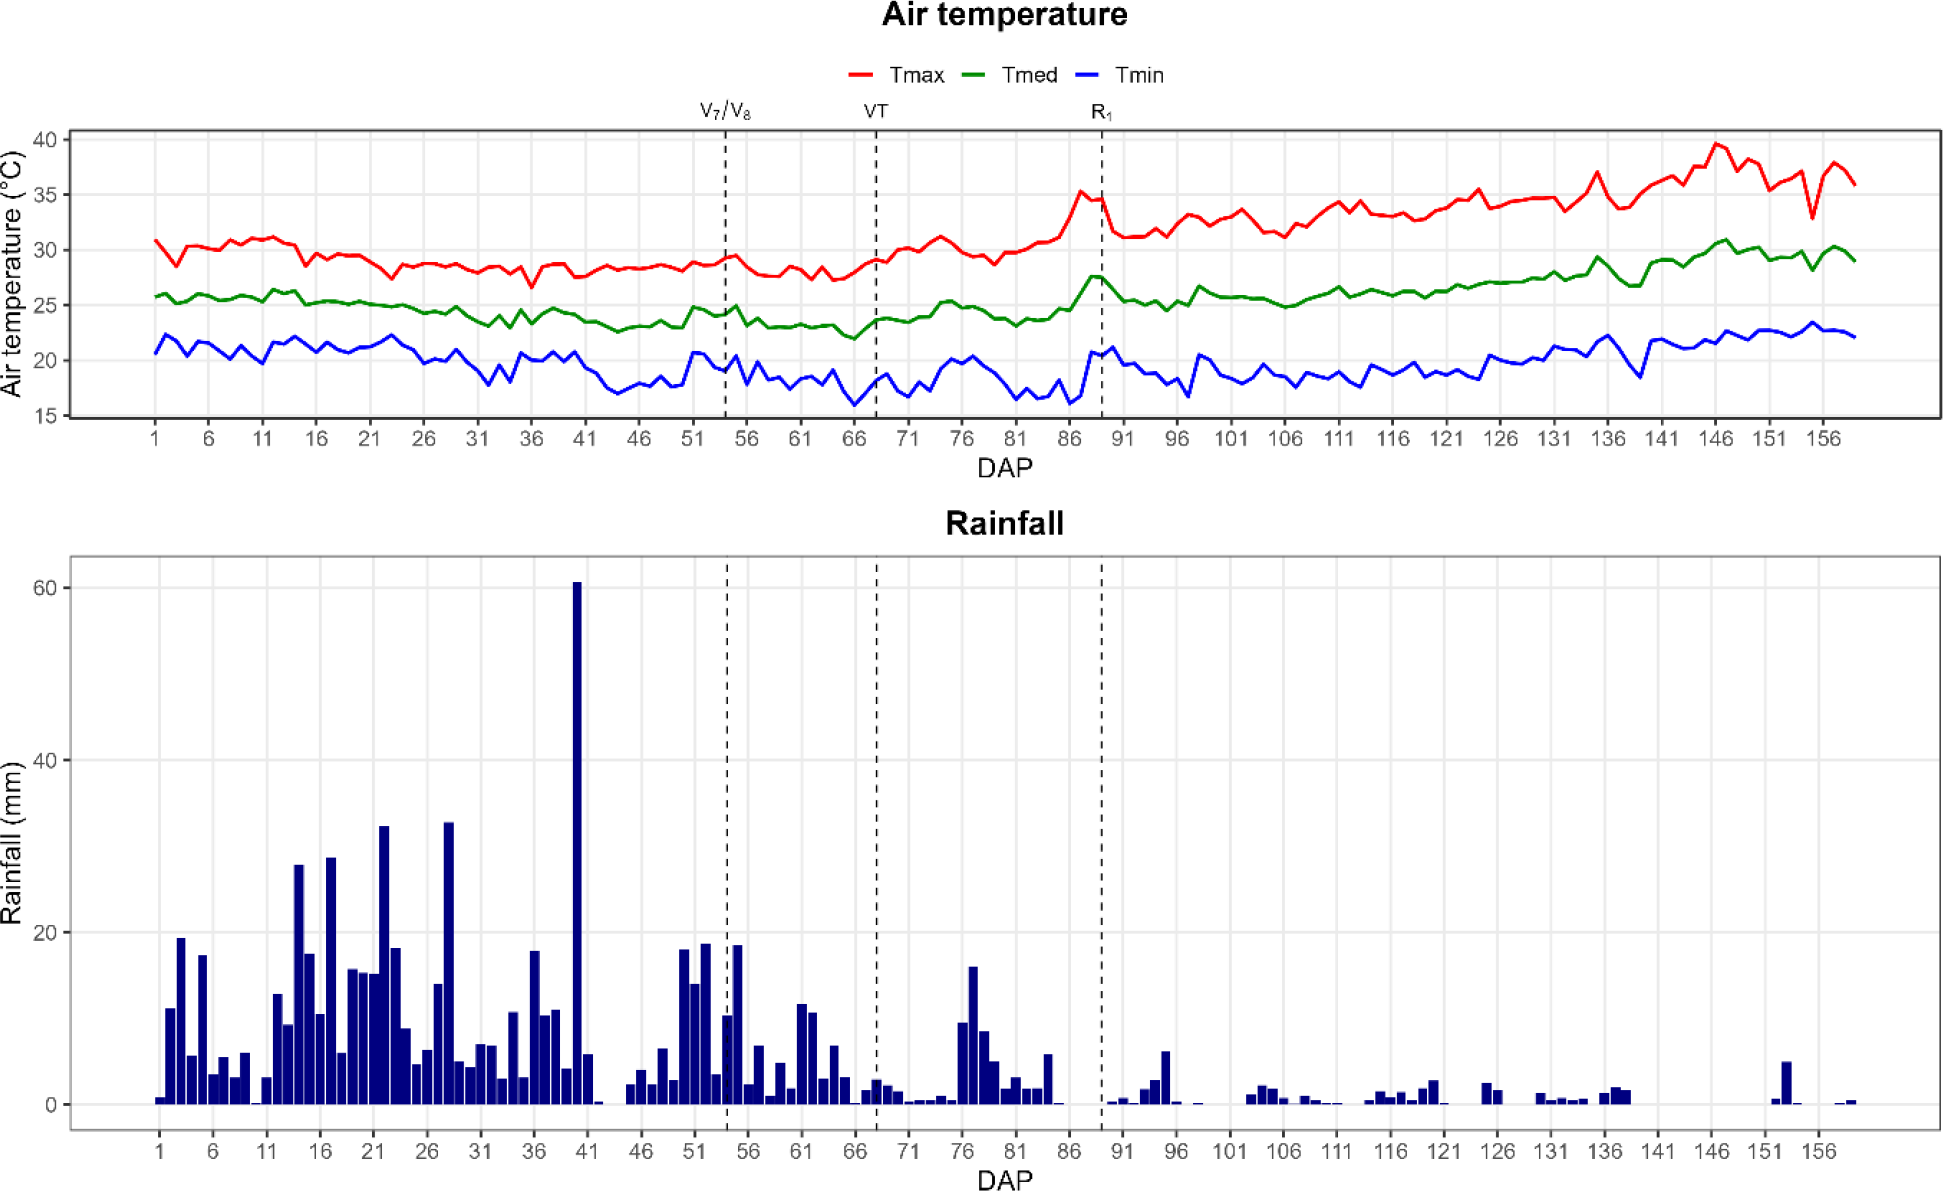
The experiment was conducted during the 2024 growing season at the experimental farm of the Universidade Federal de Sergipe, in Nossa Senhora da Glória, Sergipe state, Brazil (10º13′06″S, 37º25′13″W, and altitude of 291 m). The predominant climate in the region is classified as northeastern Brazilian semi-arid tropical (tr**neb), with annual rainfall of 506-1,301 mm and mean temperatures in the coldest month of 18-27.5 ºC (Novais & Machado 2023). Figure 1 presents the climatic conditions observed during the experimental period.
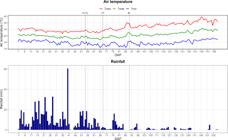
Monthly rainfall, and maximum, mean, and minimum air temperatures recorded during the 2024 growing season, obtained from the meteorological station located at the experimental farm. DAP: days after planting.
A total of 35 half-sib maize progenies were evaluated, derived from the selection of 2,000 plants from the PopTol2 population sown during the 2023 growing season. The experiment was arranged in a randomized complete block design with a split-plot structure and three replications. The main plots consisted of two nitrogen fertilization levels (20 and 140 kg ha-1), whereas the subplots corresponded to the maize genotypes, totaling six main plots and 210 subplots.
Each subplot consisted of two rows, 3 m in length, with a spacing of 0.20 m between plants and 0.70 m between rows, resulting in a population of 30 plants per subplot and an estimated density of 71,428 plants ha-1. The phenotypic trait grain weight was manually collected from the usable area of each subplot, adjusted to 13 % of moisture content, and converted to grain yield (kg ha-1), using the method proposed by Zuber (1942).
The experimental area was prepared using conventional tillage practices (Alvarenga et al. 2008). Planting rows were opened using a mechanized three-row furrower, and sowing was performed manually. Basal and topdressing fertilizations (Table 1) were applied manually, with the topdressing split into two applications (50 % each) at the V4 and V6 phenological stages.
Ground control points with diameter of 30 cm and painted yellow were installed across the experimental area to correct positional errors associated with the drone’s GNSS system. A total of 13 ground control points were deployed, and their coordinates were collected using an FOIF A60 GPS/RTK system.
A Mavic 2 Pro UAV equipped with a 20-megapixel RGB sensor was used for image acquisition. Flight planning was performed using the DroneDeploy® application, with flights conducted between 11:00 a.m. and 1:00 p.m., avoiding cloudy or rainy conditions. For each flight date, images were acquired at two altitudes (60 and 80 m) (Table 2).
The images were processed using the Agisoft Metashape Professional® (version 2.2.2, trial version) for each date and flight altitude. After image correction and processing, orthomosaics were generated. Vegetation indices were extracted using the FIELDimageR package (Matias et al. 2020), applying specific empirical formulas for each index (Table 3). All indices were calculated based on the reflectance values of the red (R), green (G), and blue (B) spectral bands.
Statistical analyses were performed using the R programming environment (R Core Team 2025). The lme4 package (version 1.1-35.2) (Bates et al. 2015) was used for model fitting and analysis of variance, whereas graphical visualizations were generated using the ggplot2 (version 3.5.0) (Wickham 2016).
Grain yield data were subjected to assumption tests to validate the analysis of variance. Residual normality was assessed using the Shapiro-Wilk test and homogeneity of variances with the Levene’s test, both implemented through the car package (Fox & Weisberg 2024).
For high-throughput phenotyping analysis, temporal best linear unbiased predictors (TBLUPs) were estimated for each vegetation index across time and flight altitudes.
To identify the most reliable vegetation indices, repeatability values obtained for the selected flight were classified as low (r < 0.40), moderate (0.40 < r < 0.60), and high (r > 0.60). This classification, adapted from Santos et al. (2023), allows the selection of indices with greater stability across the evaluated flight altitudes (60 and 80 m).
Vegetation index data were analyzed using mixed models based on REML/BLUP. The statistical model considered nitrogen levels as fixed effects, whereas genotype, flight, and interactions were treated as random effects. The model is described as follows: Yijkl = μ + nitrogeni + flightj + [nitrogen(flight)]ij + pedigreek + [pedigree(flight)]kj + rep(flight)(jl) + errorijkl, where: Yijkl is the observed vegetation index value for genotype k, nitrogen level i, flight j, and replication l; μ the overall mean; nitrogeni the fixed effect of the i-th nitrogen level; flightj the random effect of the j-th flight (flight date), where flightj ~ N (0, σj2); [nitrogen(flight)]ij the random interaction effect between nitrogen level and flight; pedigreek the random effect of genotype, where pedigreek ~ N (0, σk2); [pedigree(flight)]kj the random interaction effect between genotype and flight, capturing the G x E interaction, where [pedigree(flight)]kj ~ N (0, σ2kj); rep(flight)(jl) the random effect of replication l nested within flight j, where rep(flight)(jl) ~ N (0, σ2jl); and errorijkl the residual random error, where errorijkl ~ N (0, σ2ɛ).
Repeatability was calculated as: R = σ2pedigree /[σ2pedigree + (σ2error /nrep)], where: R is the repeatability coefficient (heritability based on genotype means); σ2pedigree the genetic variance (among genotypes); σ2error the residual error variance; and nrep the number of replications.
RESULTS AND DISCUSSION
The analysis of variance revealed a significant effect of nitrogen fertilization and the evaluated genotypes on grain yield at 0.1 % of probability, according to the F-test (Table 4). This result indicates that there was at least one significant difference among nitrogen levels and among genotypes, which is essential for plant breeding programs aimed at adapting genotypes to abiotic stress conditions.
The obtained coefficients of variation were 10.05 % (CV A) and 19.77 % (CV B), which are considered acceptable for maize experiments, indicating good experimental precision and reliability of the results, according to Gurgel et al. (2013).
In the evaluation of vegetation indices across flight dates, repeatability analysis is essential to ensure the reliability of temporal and spatial assessments. Repeatability values closer to 1 indicate a greater consistency of measurements and are influenced by the relationship between genotypic variance and residual error (Adak et al. 2023). Thus, higher repeatability values are obtained when the experimental error is minimized and properly controlled by the experimental design and blocking structure (Santos et al. 2023).
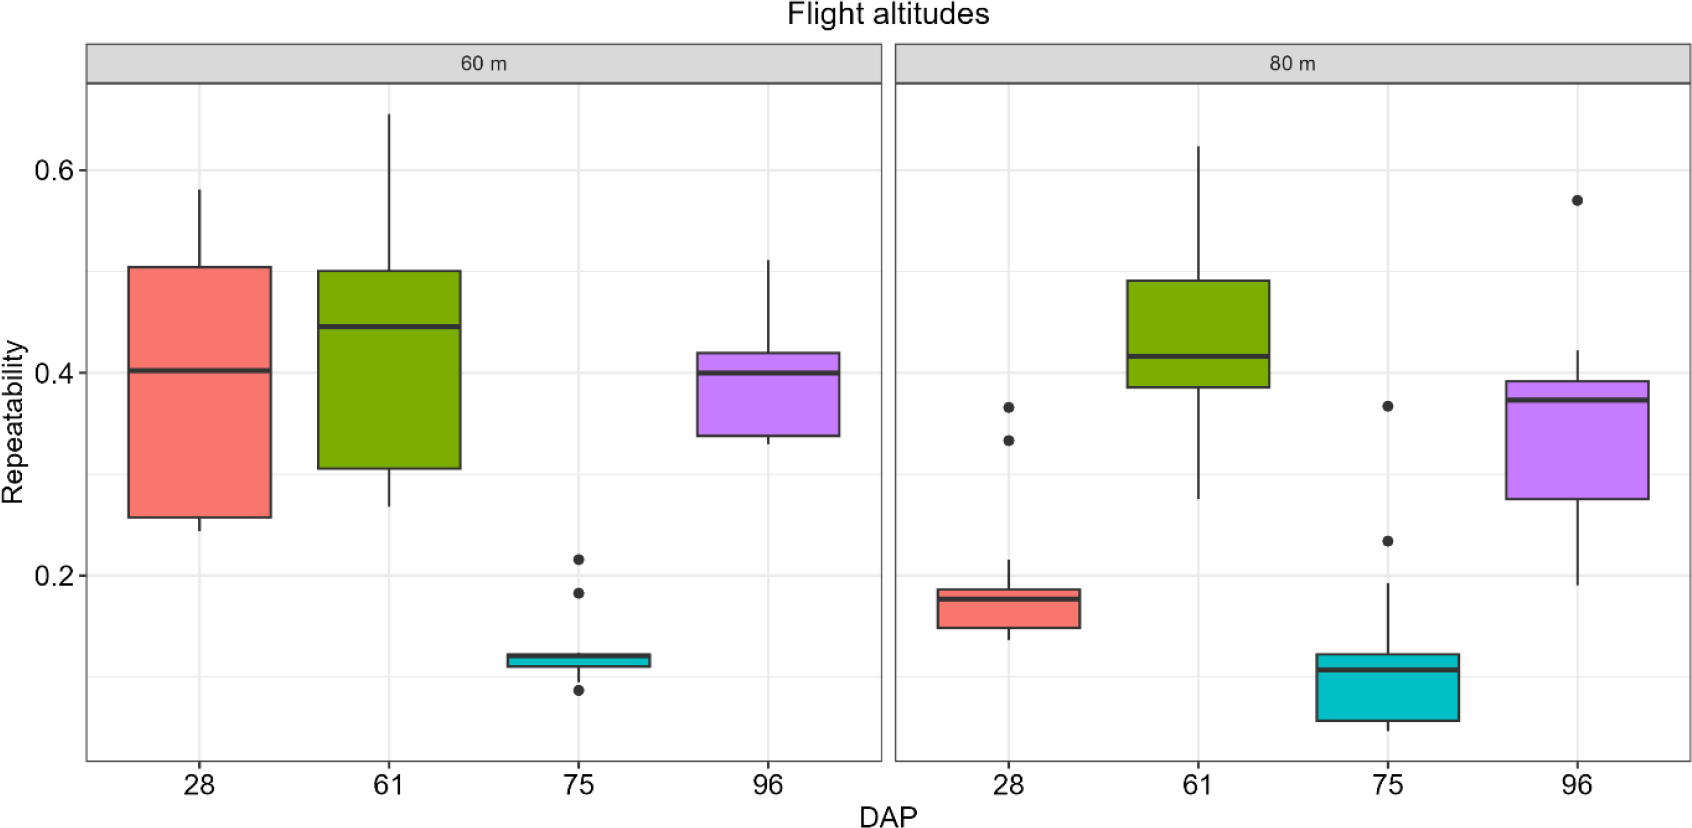
The flight conducted at 75 days after planting (DAP) exhibited the lowest repeatability values, regardless of flight altitude, indicating a low reliability of vegetation indices at this phenological stage (Figure 2). In contrast, flights conducted at 28, 61, and 96 DAP showed moderate to high repeatability values, with particular emphasis on flights at 61 DAP, which presented the highest values at both evaluated altitudes (60 and 80 m).
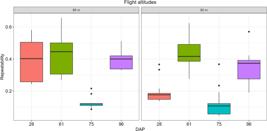
Identification of the optimal days after planting (DAP) for achieving high repeatability values of vegetation indices, in relation to flight altitudes.
The flights conducted at 28 and 61 DAP yielded the best repeatability results at 60 m; whereas, for the altitude of 80 m, only the flight at 61 DAP demonstrated a consistent performance. These periods coincide with critical stages of maize development, during which yield potential is defined.
The higher selection efficiency observed at 61 DAP (V7/V8 stage) corresponds to the maximum nitrogen demand in maize, when the number of kernel rows per ear is being determined. Vergara-Díaz et al. (2016), evaluating RGB indices in maize, also reported that the pre-flowering stage provides an optimal balance between canopy coverage and the expression of deficiency symptoms, allowing yield prediction with high genetic correlation. This finding supports the use of UAV-based phenotyping to eliminate inferior genotypes at early stages, thereby optimizing resources prior to harvest.
The superiority of the flight at 60 m over that at 80 m for repeatability estimation highlights the importance of adequate spatial resolution for microplot analysis. Lower flight altitudes improved the ground sampling distance, reducing border effects and spectral contamination from soil between planting rows. These findings are consistent with those reported by Zhu et al. (2019), who demonstrated that higher spatial resolution is critical for reducing errors in estimating biomass and structural traits in maize, as coarser resolutions (i.e., higher flight altitudes) tend to smooth genotypic variability within plots.
The results also indicated that the flights conducted after 61 DAP tended to present lower repeatability, suggesting a limited contribution to genotype discrimination. Therefore, prioritizing flights at earlier phenological stages may optimize high-throughput phenotyping processes by reducing operational costs without compromising selection efficiency. Similar findings were reported by Santos et al. (2023), who observed consistent repeatability values for flight altitudes of 60 and 80 m in evaluations conducted at 27 DAP.
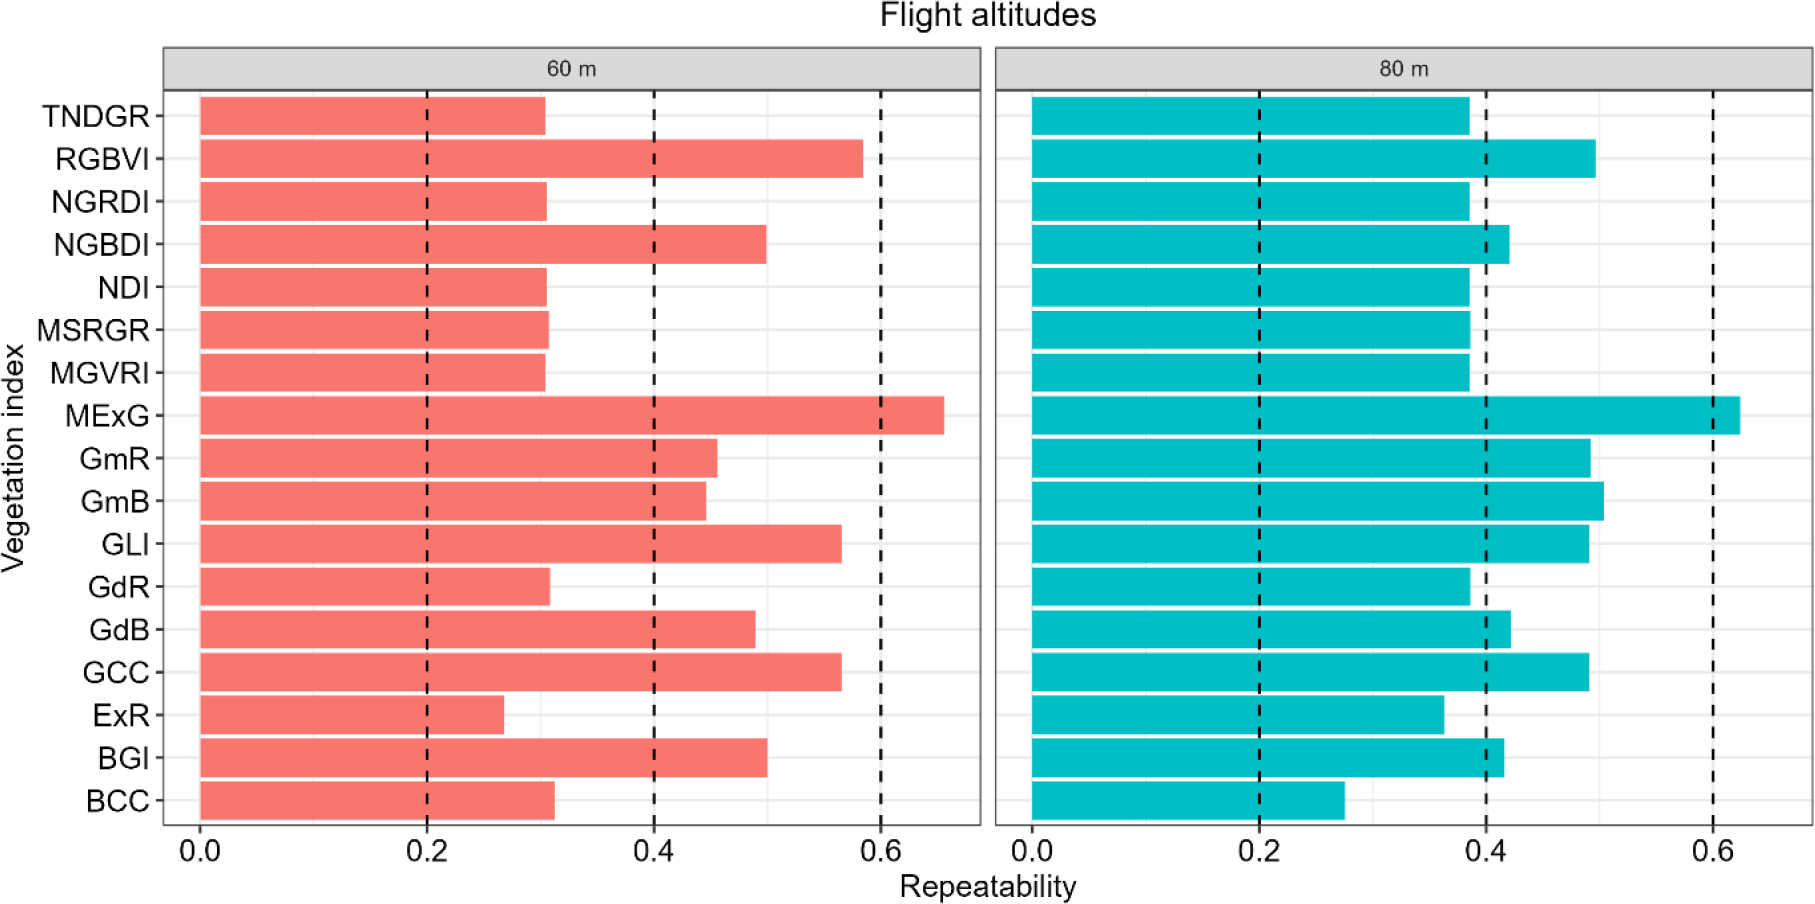
After identifying the optimal flight date based on repeatability values of vegetation indices at both 60 and 80 m altitudes (Figure 3), it was observed that the indices RGBVI, NGRDI, GmR, GmB, GLI, GdB, GCC, and BGI exhibited a moderate repeatability, whereas the MExG index was the only one classified as having high repeatability at both evaluated altitudes.
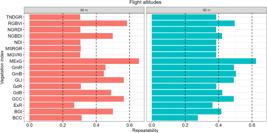
Identification of vegetation indices with the highest repeatability values for each flight altitude at 61 days after planting.
Similar results were reported by Santos et al. (2023), who selected vegetation indices with repeatability values above 50 % at a flight altitude of 60 m. At 80 m, the same indices exhibited repeatability values below 45 %, indicating that lower flight altitudes tend to provide greater stability in vegetation index measurements. These findings suggest that a flight altitude of 60 m is more efficient for maize phenotyping and may reduce the need for additional flights at 80 m without compromising data quality.
The selection of indices with high repeatability indicates a low proportion of residual error and a greater contribution of genotypic variance to the observed variation. Conversely, indices with moderate or low repeatability indicate moderate to high levels of residual variation, respectively. This selection step allows the prioritization of the most promising indices capable of effectively discriminating against maize genotypes and identifying nitrogen-related stress.
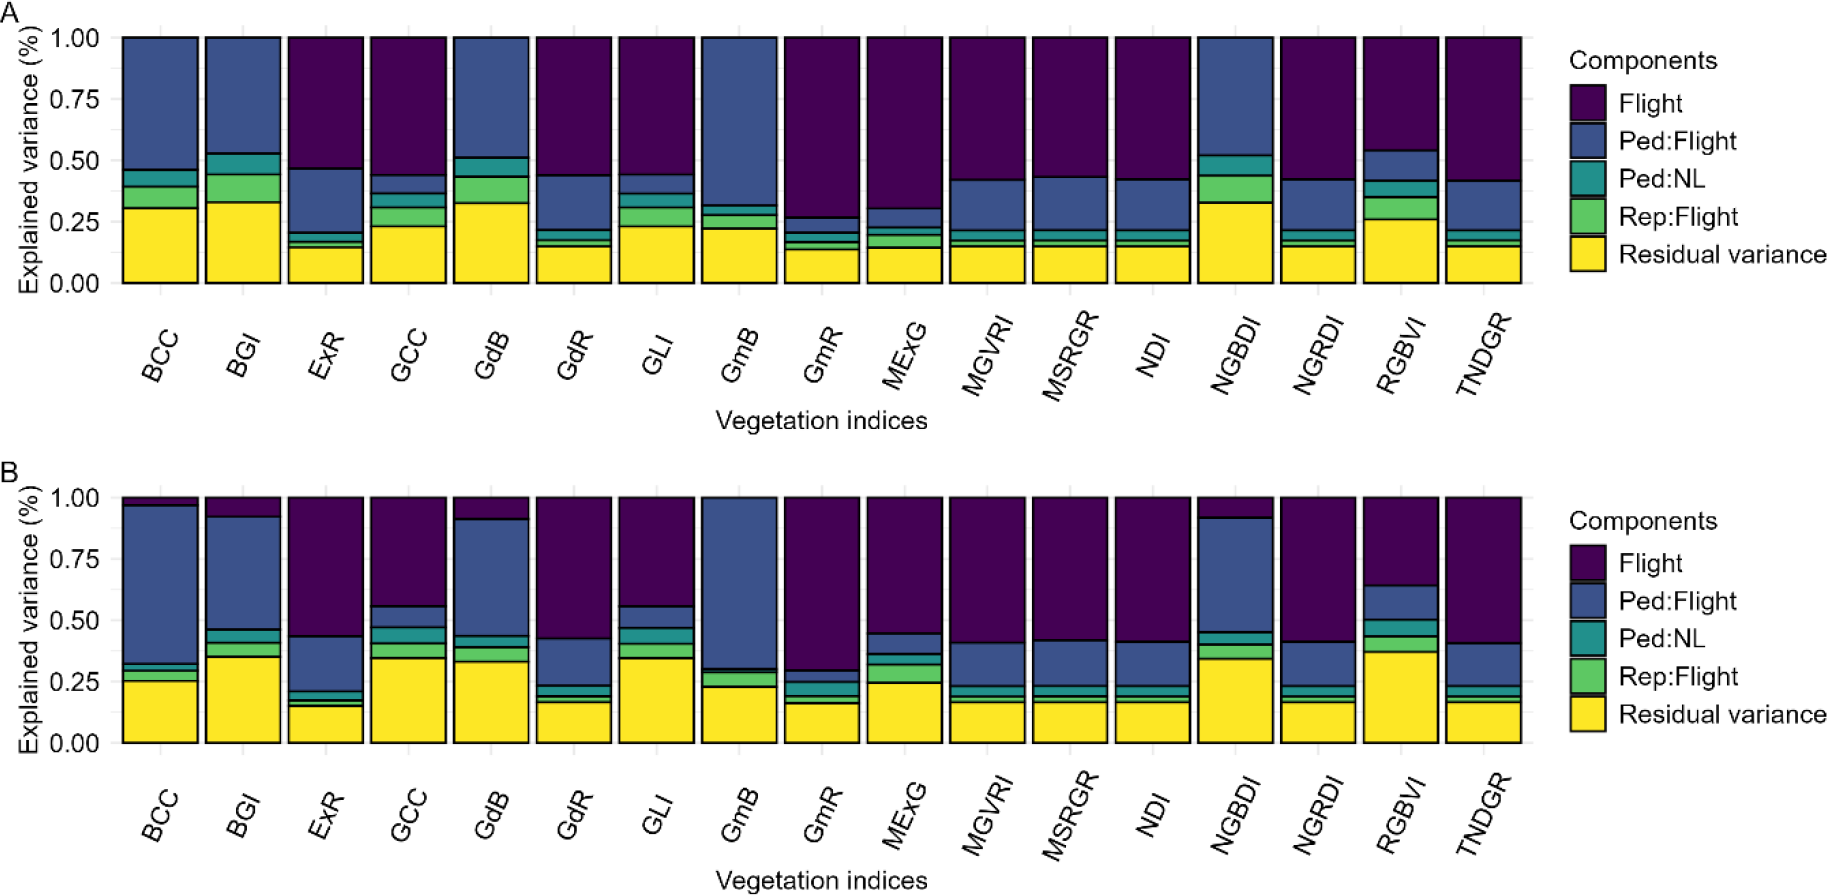
To further explain the observed experimental variability, all components of the experimental model were analyzed, including days after planting, flight altitude, vegetation indices, replication, nitrogen level, and interactions. For this purpose, temporal best linear unbiased predictors (TBLUPs) were estimated, allowing the decomposition of variance components associated with each factor (Figure 4).
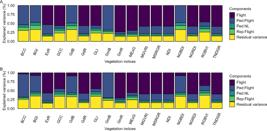
Proportion of variance components for each vegetation index at flight altitudes of 60 (A) and 80 m (B). Ped: pedigree; Rep: replication; NL: nitrogen level.
Figure 4 shows the variance component decomposition of vegetation indices evaluated at flight altitudes of 60 and 80 m. The indices GmB, BCC, GdB, NGBDI, and BGI exhibited a greater contribution of variability associated with the interaction between nitrogen level and flight, with values of 50.06-70.38 % at 60 m and 52.54-70.03 % at 80 m.
The flight component explained the largest proportion of experimental variability for the vegetation indices GmR, MExG, TNDGR, MGVRI, NDI, NGRDI, MSRGR, GdR, ExR, GLI, GCC, and RGBVI, ranging from 42.80 to 68.47 % at 60 m and from 31.41 to 64.16 % at 80 m. The presence of variability associated with flight and its interactions directly and indirectly influences the calculation of vegetation indices, and, consequently, their repeatability. Similar results were reported by Adak et al. (2021), with the flight component also explaining the largest proportion of variation in indices derived from RGB spectral bands.
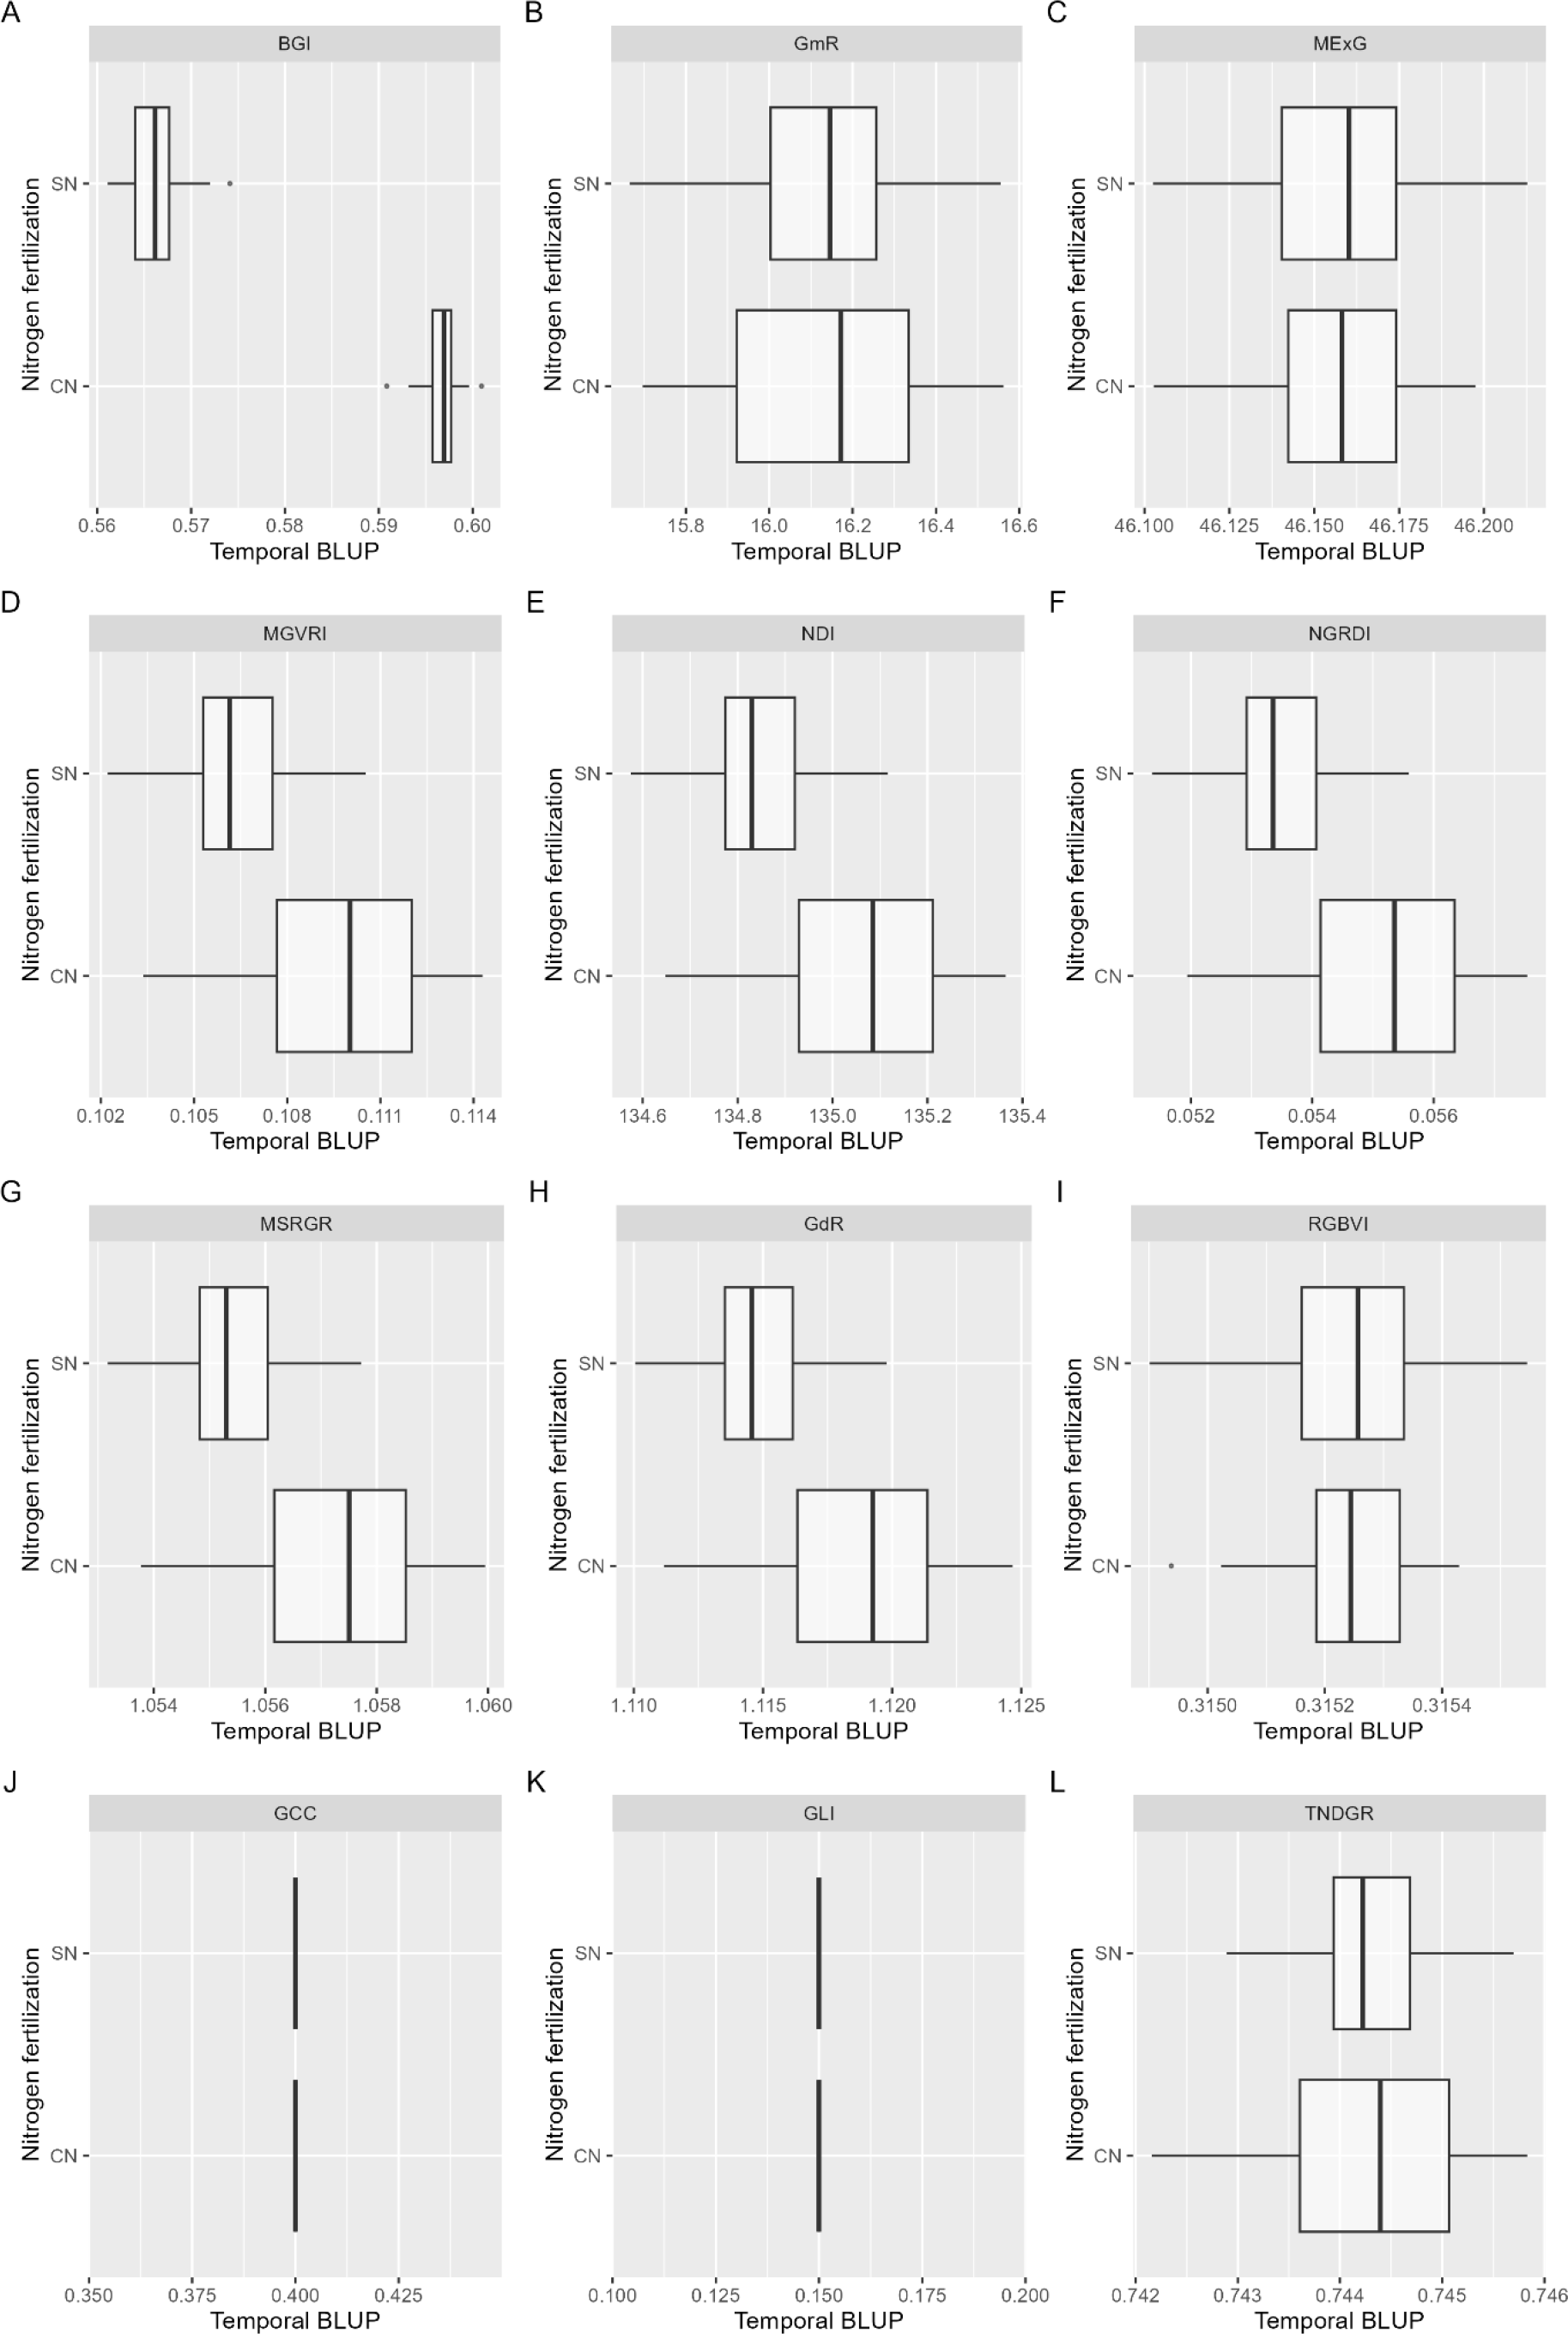
To assess the sensitivity of vegetation indices to nitrogen fertilization, temporal best linear unbiased predictors (TBLUPs) were extracted at the plot level for each vegetation index (Figure 5). It was observed that the indices GmR, MExG, TNDGR, MGVRI, NDI, NGRDI, MSRGR, ExR, GdR, GLI, GCC, and RGBVI did not exhibit sufficient sensitivity to discriminate between nitrogen fertilization levels in maize. In contrast, only the blue green pigment index (BGI) was able to effectively distinguish treatments, presenting distinct TBLUP values for each fertilization level.
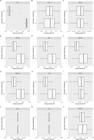
Sensitivity analysis of vegetation indices in discriminating nitrogen fertilization levels for the 60 m flight. SN: 20 kg ha-1 of N; CN: 140 kg ha-1 of N.
The superior performance of BGI in discriminating against nitrogen levels and selecting high-yielding genotypes can be explained by the physiological basis of leaf reflectance. Nitrogen is a structural component of chlorophyll molecules, and, under nitrogen deficiency, chlorophyll degradation occurs alongside a relative increase in carotenoids and xanthophylls (Sellaro et al. 2010).
While traditional indices based on the red spectral band (e.g., NGRDI) tend to saturate rapidly with canopy closure, the blue spectral band (used in the numerator of BGI = B/G) retains sensitivity to absorption by accessory pigments. According to Buchaillot et al. (2019), RGB-based indices derived from UAV imagery have proven effective in predicting maize yield under low nitrogen conditions, in some cases outperforming ground-based measurements. By contrasting the blue band (strongly absorbed by chlorophyll a and b) with the green band (reflectance peak), BGI can capture early-stage chlorosis more effectively than indices based solely on red-green relationships (Zarco-Tejada et al. 2005).
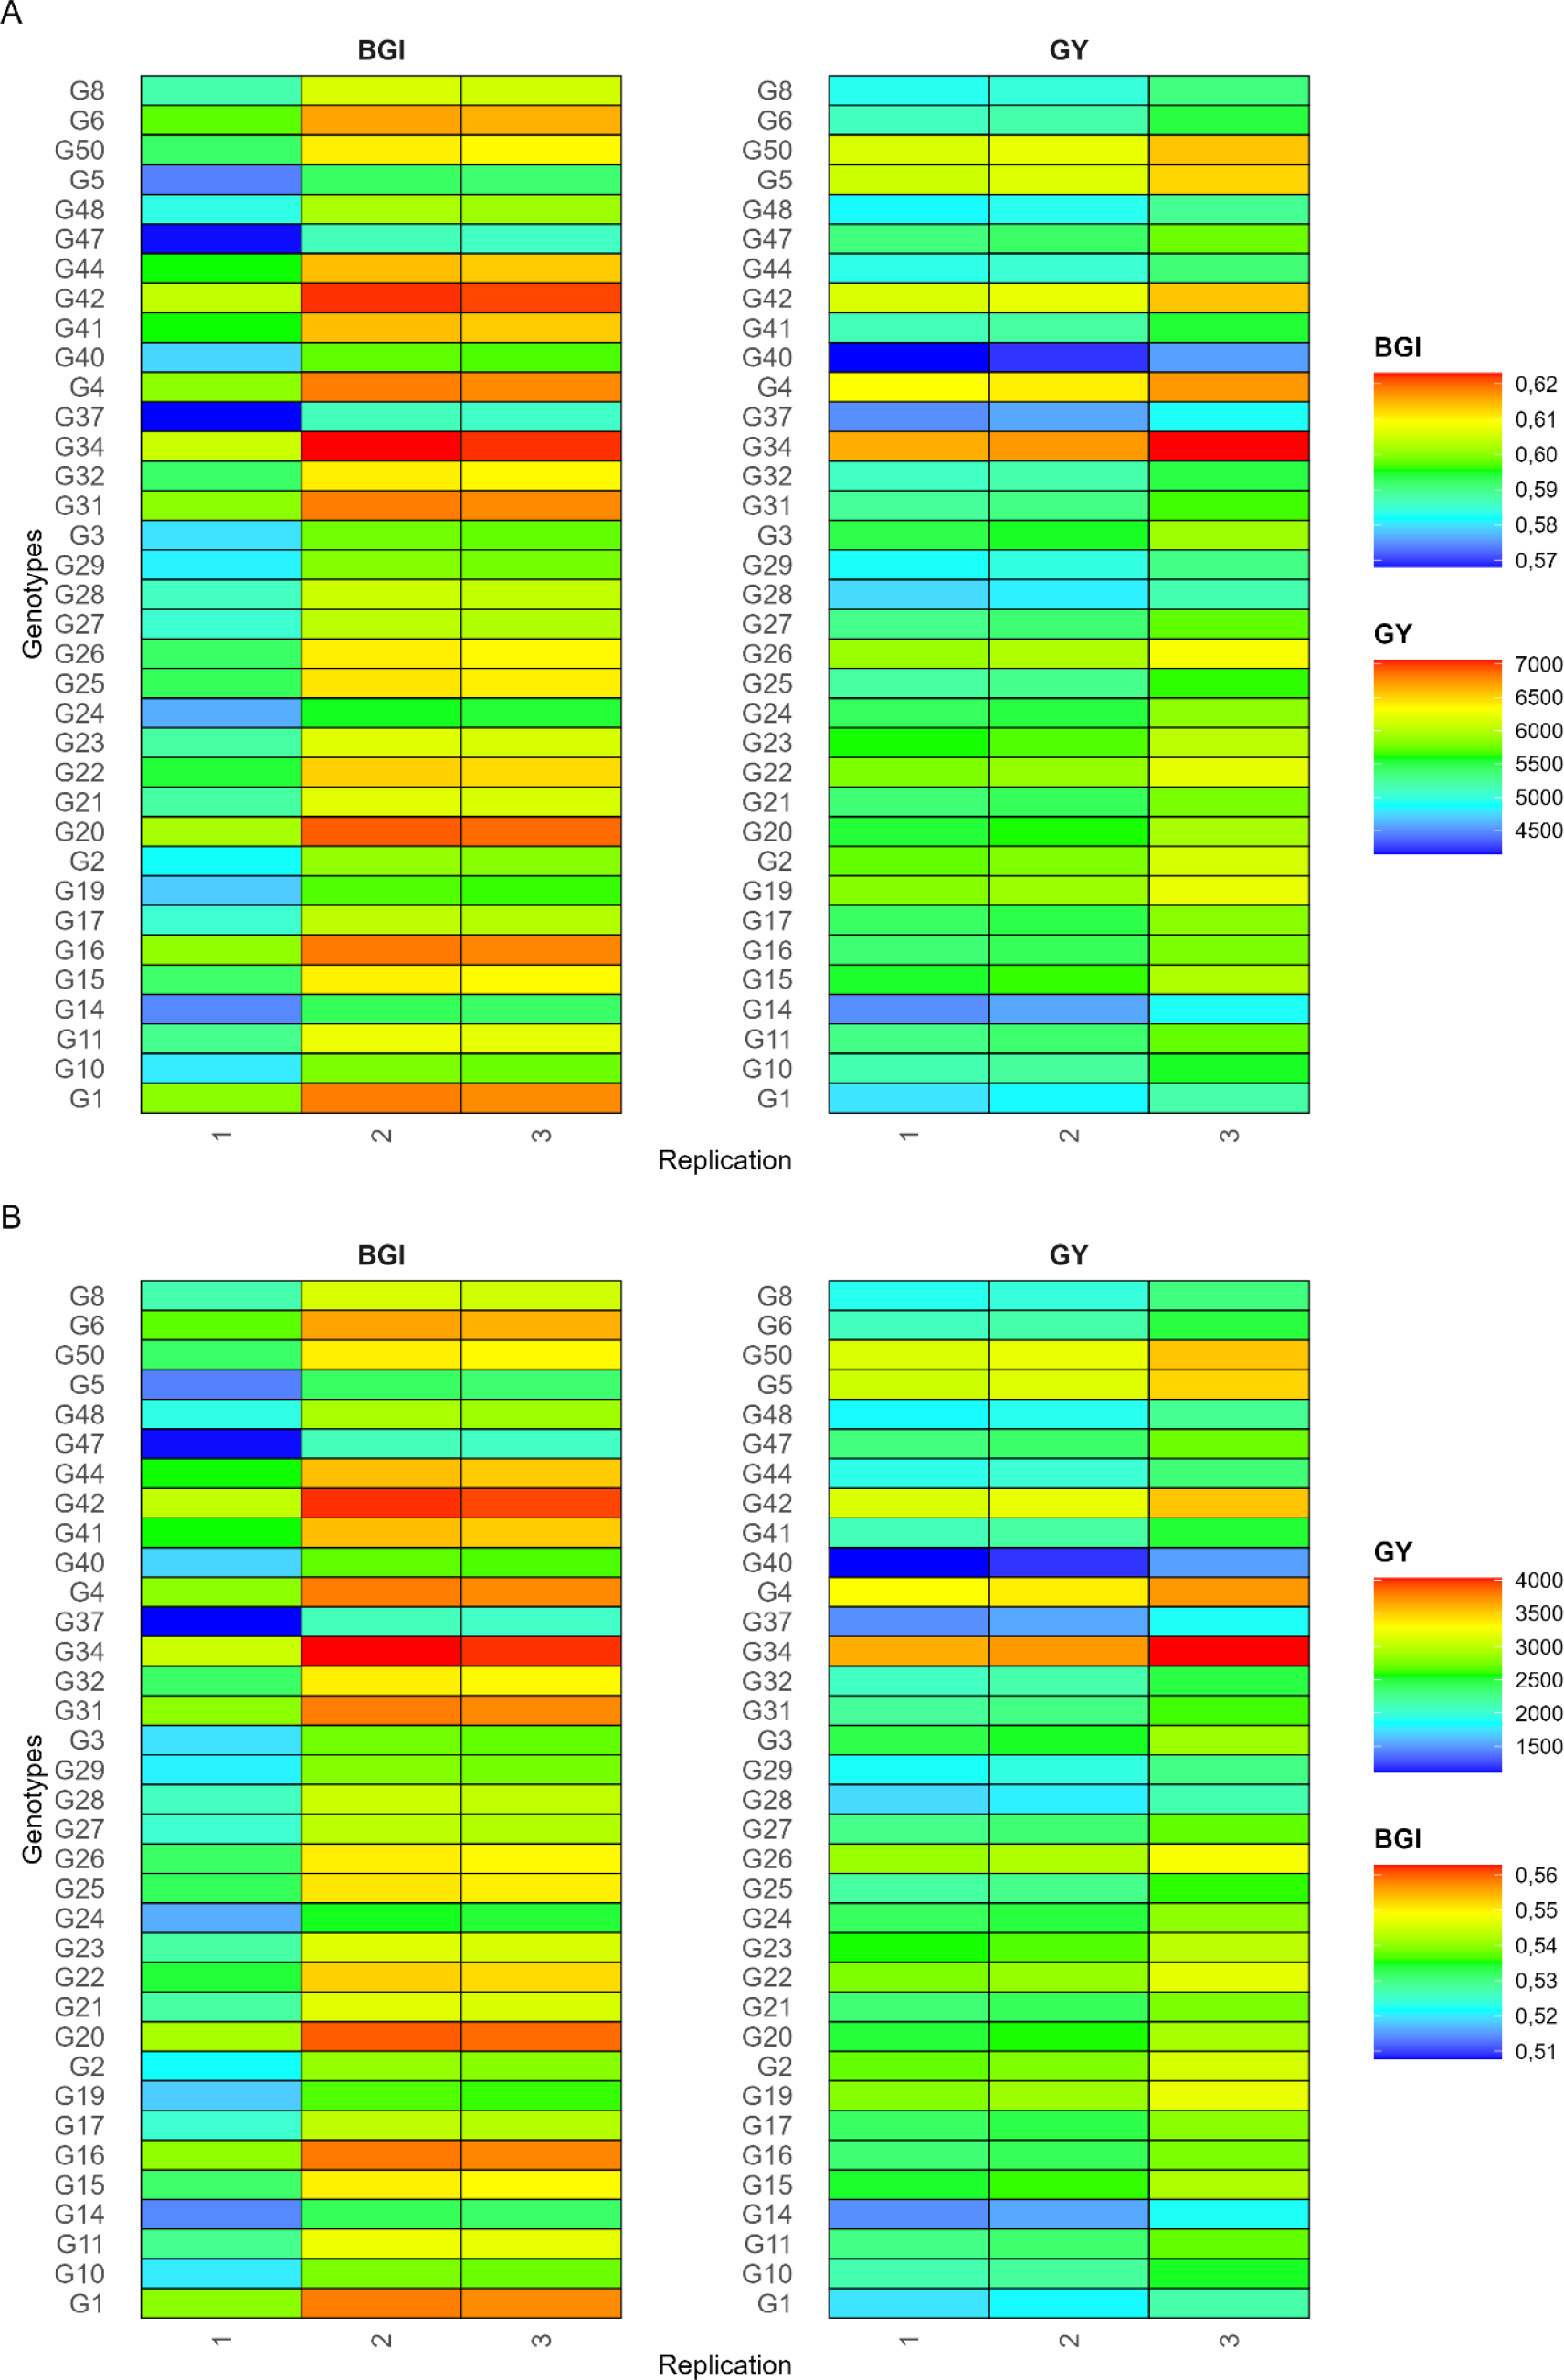
Following the selection of the most suitable vegetation index, BLUPs were evaluated at the subplot level to identify the most productive genotypes. The heatmap analysis (Figure 6A) indicated that the genotypes G34, G50, G5, G31, G26, G23, and G42 achieved higher grain yield, ranging from 6,068.42 to 7,417.48 kg ha-1 under nitrogen fertilization of 140 kg ha-1. Under the lower nitrogen level (20 kg ha-1; Figure 6B), the grain yield, for these same genotypes, ranged from 3,171.02 to 4,252.81 kg ha-1.
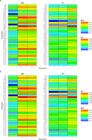
Heatmap of vegetation index values and grain yield for each evaluated experimental plot. A: nitrogen fertilization of 140 kg ha-1; B: nitrogen fertilization of 20 kg ha-1; GY: grain yield (kg ha-1); BGI: blue green pigment index.
The BGI index successfully identified the most productive plots under both nitrogen fertilization levels. The selected genotypes included G42, G4, G34, G31, G20, G16, and G1, which exhibited BLUP values greater than 0.61 in blocks 2 and 3 (Figure 6A). Similarly, the index identified the least productive genotypes, namely G37, G47, G5, G14, G24, G19, and G40, in block 1, with BLUP values below 0.58 (Figure 6B).
Overall, the BGI index demonstrated a strong potential for identifying both highand low-performing plots. Similar findings were reported by Adak et al. (2021), who observed high robustness of BGI in predicting grain yield, as well as by Sarkar et al. (2021), who highlighted this index as one of the most effective predictors of leaf area index.
CONCLUSIONS
-
1. The flight altitude of 60 m provides a greater repeatability of spectral data, when compared to 80 m;
-
2. The flight conducted at 61 days after planting (V7/V8 stage) represents the optimal time point for selection, rendering later evaluations at the R1 stage unnecessary;
-
3. The blue green pigment index (BGI) is the most robust among the evaluated RGB indices for discriminating genotypes responsive to nitrogen fertilization, enabling the accurate identification of elite genotypes such as G42, G4, and G34;
-
4. The implementation of the BGI index in unmanned aerial vehicles-assisted mass selection protocols is recommended to optimize the identification of genotypes tolerant to nitrogen stress conditions.
Data Availability Statement:
Research data are only made available by authors upon request.
REFERENCES
- ADAK, A.; MURRAY, S. C.; BOŽINOVIĆ, S.; LINDSEY, R.; NAKASAGGA, S.; CHATTERJEE, S.; ANDERSON, S. L.; WILDE, S. Temporal vegetation indices and plant height from remotely sensed imagery can predict grain yield and flowering time breeding value in maize via machine learning regression. Remote Sensing, v. 13, n. 11, e2141, 2021.
- ADAK, A.; ANDERSON, S. L.; MURRAY, S. C. Pedigree-management-flight interaction for temporal phenotype analysis and temporal phenomic prediction. The Plant Phenome Journal, v. 6, n. 1, e20057, 2023.
- ALVARENGA, R. C.; CRUZ, J. C.; VIANA, J. H. M. Manejo de solos: preparo convencional do solo. In: CRUZ, J. C. (ed.). Cultivo do milho 4. ed. Sete Lagoas: Embrapa Milho e Sorgo, 2008. p. 1-4.
- ASLAN, M. F.; DURDU, A.; SABANCI, K.; ROPELEWSKA, E.; GÜLTEKIN, S. S. A comprehensive survey of the recent studies with UAV for precision agriculture in open fields and greenhouses. Applied Sciences, v. 12, n. 3, e1047, 2022.
- BATES, D.; MÄCHLER, M.; BOLKER, B.; WALKER, S. Fitting linear mixed-effects models using lme4. Journal of Statistical Software, v. 67, n. 1, p. 1-48, 2015.
- BENDIG, J.; YU, K.; AASEN, H.; BOLTEN, A.; BENNERTZ, S.; BROSCHEIT, J.; GNYP, M. L.; BARETH, G. Combining UAV-based plant height from crop surface models, visible, and near infrared vegetation indices for biomass monitoring in barley. International Journal of Applied Earth Observation and Geoinformation, v. 39, n. 1, p. 79-87, 2015.
- BHANDARI, M.; CHANG, A.; JUNG, J.; IBRAHIM, A. M. H.; RUDD, J. C.; BAKER, S.; LANDIVAR, J.; LIU, S.; LANDIVAR, J. Unmanned aerial system-based high-throughput phenotyping for plant breeding. The Plant Phenome Journal, v. 6, n. 1, e20058, 2023.
- BUCHAILLOT, M. L.; GRACIA-ROMERO, A.; VERGARA-DIAZ, O.; ZAMAN-ALLAH, M. A.; TAREKEGNE, A.; CAIRNS, J. E.; PRASANNA, B. M.; ARAUS, J. L.; KEFAUVER, S. C. Evaluating maize genotype performance under low nitrogen conditions using RGB UAV phenotyping techniques. Sensors, v. 19, n. 8, e1815, 2019.
- BURGOS-ARTIZZU, X. P.; RIBEIRO, A.; GUIJARRO, M.; PAJARES, G. Real-time image processing for crop/weed discrimination in maize fields. Computers and Electronics in Agriculture, v. 75, n. 2, p. 337-346, 2011.
- COLOVIC, M.; STELLACCI, A. M.; MZID, N.; VENOSA, M. D.; TODOROVIC, M.; CANTORE, V.; ALBRIZIO, R. Comparative performance of aerial RGB vs ground hyperspectral indices for evaluating water and nitrogen status in sweet maize. Agronomy, v. 14, n. 3, e562, 2024.
- COMPANHIA NACIONAL DE ABASTECIMENTO (Conab). Acompanhamento da safra brasileira de grãos: safra 2023/24: décimo segundo levantamento. Brasília, DF: Conab, 2024.
- CVETKOVIĆ, N.; ĐOKOVIĆ, A.; DOBROTA, M.; RADOJIČIĆ, M. New methodology for corn stress detection using remote sensing and vegetation indices. Sustainability, v. 15, n. 6, e5487, 2023.
- DANTAS, S. de J.; SANTOS, R. A.; VIEIRA, I. C. de O. El niño-oscilação sul e produção de milho grão: análise dos principais municípios produtores do SEALBA. Revista Brasileira de Climatologia, v. 36, n. 21, p. 638-662, 2025.
- ERENSTEIN, O.; JALETA, M.; SONDER, K.; MOTTALEB, K.; PRASANNA, B. M. Global maize production, consumption and trade: trends and R&D implications. Food Security, v. 14, n. 5, p. 1295-1319, 2022.
- FOOD AND AGRICULTURE ORGANIZATION (FAO). Statistical yearbook 2024 Rome: FAO, 2024.
- FOX, J.; WEISBERG, S. An R companion to applied regression 3. ed. Thousand Oaks: Sage, 2019.
- GAO, T.; ZHU, F.; PAUL, P.; SANDHU, J.; DOKU, H. A.; SUN, J.; PAN, Y.; STASWICK, P.; WALIA, H.; YU, H. Novel 3D imaging systems for high-throughput phenotyping of plants. Remote Sensing, v. 13, n. 11, e2113, 2021.
- GURGEL, F. de L.; FERREIRA, D. F.; SOARES, A. C. S. e. O coeficiente de variação como critério de avaliação em experimentos de milho e feijão Aracaju: Embrapa Tabuleiros Costeiros, 2013. (Boletim de pesquisa e desenvolvimento, 75).
- HAMUDA, E.; GLAVIN, M.; JONES, E. A survey of image processing techniques for plant extraction and segmentation in the field. Computers and Electronics in Agriculture, v. 125, n. 1, p. 184-199, 2016.
- HENRICH, V.; KRAUSS, G.; GÖTZE, C.; SANDOW, C. IDB: index database. Version 2.2. Bochum: AK Fernerkundung, 2012.
- HUNT, E. R.; CAVIGELLI, M.; DAUGHTRY, C. S. T.; MCMURTREY, J. E.; WALTHALL, C. L. Evaluation of digital photography from model aircraft for remote sensing of crop biomass and nitrogen status. Precision Agriculture, v. 6, n. 4, p. 359-378, 2005.
- KARCHER, D. E.; RICHARDSON, M. D. Quantifying turfgrass color using digital image analysis. Crop Science, v. 43, n. 3, p. 943-951, 2003.
- KIOR, A.; YUDINA, L.; ZOLIN, Y.; SUKHOV, V.; SUKHOVA, E. RGB imaging as a tool for remote sensing of characteristics of terrestrial plants: a review. Plants, v. 13, n. 9, e1262, 2024.
- LIAKOS, K. G.; BUSATO, P.; MOSHOU, D.; PEARSON, S.; BOCHTIS, D. Machine learning in agriculture: a review. Sensors, v. 18, n. 8, e2674, 2018.
- LIU, Y.; HATOU, K.; AIHARA, T.; KUROSE, S.; AKIYAMA, T.; KOHNO, Y.; LU, S.; OMASA, K. A robust vegetation index based on different UAV RGB images to estimate SPAD values of naked barley leaves. Remote Sensing, v. 13, n. 4, e686, 2021.
- LOESDAU, M.; CHABRIER, S.; GABILLON, A. Hue and saturation in the RGB color space. In: ELMOATAZ, A.; LEZORAY, O.; NOUBOUD, F.; MAMMASS, D. (ed.). Image and signal processing Cham: Springer International, 2014. p. 203-212.
- LOUHAICHI, M.; BORMAN, M. M.; JOHNSON, D. E. Spatially located platform and aerial photography for documentation of grazing impacts on wheat. Geocarto International, v. 16, n. 1, p. 65-70, 2001.
- MATIAS, F. I.; CARAZA-HARTER, M. V.; ENDELMAN, J. B. FIELDimageR: an R package to analyze orthomosaic images from agricultural field trials. The Plant Phenome Journal, v. 3, n. 1, e20005, 2020.
- MEYER, G. E.; CAMARGO NETO, J. Verification of color vegetation indices for automated crop imaging applications. Computers and Electronics in Agriculture, v. 63, n. 2, p. 282-293, 2008.
- MIYATA, M.; SHIKAMA, K.; TAKEHARA, H.; OHTA, J.; HASHIMOTO, T. High-sensitivity RGB-NIR image sensor with dispersion-engineered meta-optics. ACS Photonics, v. 13, n. 3, p. 849-860, 2026.
- NOVAIS, G. T.; MACHADO, L. A. Os climas do Brasil: segundo a classificação climática de Novais. Revista Brasileira de Climatologia, v. 32, n. 19, p. 1-39, 2023.
- R CORE TEAM. R: a language and environment for statistical computing. Vienna: R Foundation for Statistical Computing, 2025.
- SANTOS, B. N.; ARAGÃO, N. S. C.; BARRETO, M. S. R.; SANTOS, H. R. A.; SANTOS, J. F. S.; CORDEIRO JUNIOR, J. J. F.; OLIVEIRA, G. H. F. de. Protocolo de processamento de imagens RGB aéreas para identificação de genótipos potenciais de milho em fase vegetativa. Revista Eletrônica Competências Digitais para Agricultura Familiar, v. 9, n. 2, p. 149-173, 2023.
- SARKAR, S.; CAZENAVE, A. B.; OAKES, J.; MCCALL, D.; THOMASON, W.; ABBOTT, L.; BALOTA, M. Aerial high-throughput phenotyping of peanut leaf area index and lateral growth. Scientific Reports, v. 11, n. 1, e21661, 2021.
- SELLARO, R.; CREPY, M.; TRUPKIN, S. A.; KARAYEKOV, E.; BUCHOVSKY, A. S.; ROSSI, C.; CASAL, J. J. Cryptochrome as a sensor of the blue/green ratio of natural radiation in arabidopsis. Plant Physiology, v. 154, n. 1, p. 401-409, 2010.
- SILVA, P. F. da; CASSA, N.; MELO, A. S. de; DANTAS NETO, J.; MENEGHETTI, L. A. M.; CUSTÓDIO, A. S. C.; OLIVEIRA, N. P. R. de; SILVA, T. J. A. da; BONFIM-SILVA, E. M.; ANDRADE, S. P.; DUARTE, T. F.; BERILLI, S. da S.; SOUZA, M. N.; OLIVEIRA, A. de F. M. de; MOULIN, M. M.; BERILLI, A. P. C. G. Advances in crop genetic improvement to overcome drought stress: bibliometric and meta-analysis. Agriculture, v. 13, n. 10, e1860, 2023.
- SWAEF, T.; MAES, W. H.; APER, J.; BAERT, J.; COUGNON, M.; REHEUL, D.; STEPPE, K.; ROLDÁN-RUIZ, I.; LOOTENS, P. Applying RGB- and thermal-based vegetation indices from UAVs for high-throughput field phenotyping of drought tolerance in forage grasses. Remote Sensing, v. 13, n. 1, e147, 2021.
- TAIZ, L.; ZEIGER, E.; MOLLER, I. M.; MURPHY, A. Fisiologia e desenvolvimento vegetal 6. ed. Porto Alegre: Artmed, 2017.
- TUCKER, C. J. Red and photographic infrared linear combinations for monitoring vegetation. Remote Sensing of Environment, v. 8, n. 2, p. 127-150, 1979.
- VERGARA-DÍAZ, O.; ZAMAN-ALLAH, M. A.; MASUKA, B.; HORNERO, A.; ZARCO-TEJADA, P.; PRASANNA, B. M.; CAIRNS, J. E.; ARAUS, J. L. A novel remote sensing approach for prediction of maize yield under different conditions of nitrogen fertilization. Frontiers in Plant Science, v. 7, e666, 2016.
- WICKHAM, H. ggplot2: elegant graphics for data analysis. 2. ed. Cham: Springer, 2016.
- XU, X.; FAN, L.; LI, Z.; MENG, Y.; FENG, H.; YANG, H.; XU, B. Estimating leaf nitrogen content in corn based on information fusion of multiple-sensor imagery from UAV. Remote Sensing, v. 13, n. 3, e340, 2021.
- ZARCO-TEJADA, P. J.; BERJÓN, A.; LÓPEZ-LOZANO, R.; MILLER, J. R.; MARTÍN, P.; CACHORRO, V.; GONZÁLEZ, M. R.; FRUTOS, A. de. Assessing vineyard condition with hyperspectral indices: leaf and canopy reflectance simulation in a row-structured discontinuous canopy. Remote Sensing Environment, v. 99, n. 3, p. 271-287, 2005.
- ZHANG, H.; WANG, L.; JIN, X.; BIAN, L.; GE, Y. High-throughput phenotyping of plant leaf morphological, physiological, and biochemical traits on multiple scales using optical sensing. The Crop Journal, v. 11, n. 5, p. 1303-1318, 2023.
- ZHU, W.; SUN, Z.; PENG, J.; HUANG, Y.; LI, J.; ZHANG, J.; YANG, B.; LIAO, X. Estimating maize above-ground biomass using 3D point clouds of multi-source unmanned aerial vehicle data at multi-spatial scales. Remote Sensing, v. 11, n. 22, e2678, 2019.
- ZUBER, M. S. Relative efficiency of incomplete block designs using corn uniformity trial data. Agronomy Journal, v. 34, n. 1, p. 30-47, 1942.
-
Editor:
Luis Carlos Cunha Junior