 MICROPLASTICS AND GEOTECHNICAL CHARACTERISTICS OF THE SAND AT PRAIA DO FUTURO, CEARÁ, BRAZIL
ABSTRACT
Microplastic pollution and its environmental impacts are under investigation in marine and coastal environments. However, in Ceará state, Brazil, the impacts of microplastic pollution in coastal areas have not been evaluated. This study assesses the quantity, composition, and physical forms of microplastics in sediment at Praia do Futuro and determines the sand’s geotechnical characteristics. Three study zones were defined, with 21 samples collected. Normality tests were conducted for statistical analyses, comparing results using ANOVA and Kruskal-Wallis tests. No significant differences were found between locations with and without tourist activity. The concentration of microplastics exceeded levels observed in other Brazilian studies, but it was lower than that typically registered in international studies. Additionally, geotechnical characteristics of Praia do Futuro’s sand indicated grain size with diameters under 600 µm and void ratios aligned with literature expectations. The porosity varied along the coast, as is typical of natural sandy soils.
Keywords:
soil characterization; beach sand; microplastic pollution
1 INTRODUCTION
In geotechnics, the characterization of different soil types is essential to understand environmental dynamics and to plan appropriate strategies for the sustainable use of natural resources. According to Oliveira Neto (2016), knowledge of the physical characteristics of a given location helps mitigate significant environmental impacts, such as soil and water degradation. In this context, understanding soil behavior becomes increasingly relevant, particularly as a foundation for studies aimed at minimizing impacts and promoting the sustainable management of natural resources (Goldbach, 2016).
Several studies worldwide have sought to characterize and determine the physical and hydraulic properties of different soils. Guia (2018), for example, analyzed the behavior of Coimbra sand in Portugal, comparing it with reference sands from other locations, such as Leighton Buzzard (England), Toyoura (Japan), Nevada (USA), and Hostun (France). In Brazil, similar research has been conducted, including Goldbach (2016), who characterized the sand of Copacabana Beach; Nunes (2014), who studied the sand of Itaipuaçu Beach; and Simões (2015), Costa (2020), and Soares (2021), who analyzed and compared the properties of the sand from Ipanema Beach, in the state of Rio de Janeiro.
A number of studies have addressed environmental problems related to soils and sediments. Sherman and Hotta (1990) and Wiggs, Baird, and Atherton (2004) investigated the influence of soil properties on sediment transport. Tuijnman et al. (2020) analyzed variables associated with coastal erosion, while Sassa et al. (2014) identified conditions influencing the development of species in coastal environments.
Other research has examined coastal sediments and their relationship with contaminants. Thompson et al. (2004), Hidalgo-Ruz et al. (2012), Stolte et al. (2015), Yu et al. (2016), and Besley et al. (2017) investigated the occurrence of microplastics in beach sands. Oliveira (2016) evaluated variations in oil permeability in sandy beaches, based on the Specifications and Technical Standards for the Preparation of Environmental Sensitivity Index Maps for Oil Spills (Brasil, 2007). Câmara et al. (2021), Campelo et al. (2021), and Nunes et al. (2023) examined the impacts of the oil spill that occurred along the Brazilian coast in 2020, which caused socioeconomic and environmental damage, affecting communities dependent on marine resources and disrupting coastal food webs. Despite the relevance of these works, many considered few, if any, parameters related to the physical properties of soils, which may limit a comprehensive understanding of the associated environmental impacts.
Studies on coastal sediments emphasize the importance of understanding their physical, chemical, and mineralogical properties in order to evaluate processes such as erosion, sediment transport, and microplastic contamination. Considering this relevance, this paper aims, through field and laboratory testing, to identify the form and quantity of microplastics, as well as to characterize the sand of Praia do Futuro, in Fortaleza (CE), with respect to its physical, mineralogical, and chemical properties.
2 LITERATURE REVIEW
2.1 Microplastics
According to Moore (2008), the durability of plastics, although industrially advantageous, contributes to their accumulation in the environment when improperly discarded, fragmenting into microplastics (MPs) through oxidation caused by UVB radiation, saline water, and abrasion by sand. It is estimated that since the 1970s, global plastic consumption has increased from 62 to 300 million tons, of which eight million tons reach the environment annually (Besley et al., 2017; JRC, 2017).
Microplastics are fragments smaller than 5 mm (Wright; Thompson; Galloway, 2013; Masura et al., 2015), which may be classified as primary, when produced in this dimension (e.g., pellets and microbeads used in cosmetics and personal care products), or secondary, resulting from the degradation of larger plastics. Their sources may be terrestrial, such as urban waste, industrial discharges, sewage, and stormwater, or oceanic, such as accidental or intentional releases and discarded fishing gear (Vegter et al., 2014).
Due to their size, MPs present a high risk, as they are ingested by organisms at lower trophic levels and bioaccumulate at higher levels (Eriksson; Burton, 2003; Carvalho; Baptista Neto, 2016).
MPs are composed of different types of polymers, with distinct densities and applications. Table 1 summarizes these polymers, their densities, and their applications.
MPs represent a global threat, with negative impacts on marine ecosystems, human health, and biodiversity. In the Brazilian context, it is necessary to expand beach quality indicators to include the presence of these contaminants through regular monitoring programs in water and sand, creating databases to support preventive measures. This approach should encompass ecological, environmental, and socio-economic aspects beyond bathing certification (Nunes; Soares; Mont’alverne, 2021).
The literature review on microplastic studies used the Methodi Ordinatio (Pagani; Kovaleski; Resende, 2015), considering studied locations, extraction and identification techniques, and the quantities found, presented in descending order of InOrdinatio for the 15 main studies.
Studies in ports and beaches of Belgium analyzed microplastic (MP) accumulation between 1993 and 2008, using Van Veen grab sampling, separation by saline solution (NaCl), and 38 µm sieving, with identification via binocular microscopy and FTIR. Concentrations reached 166.7 particles/kg, with a predominance of fibers (59%) and the presence of fragments, films, and spheres (Claessens et al., 2011).
In the Beijiang River (China), MPs and heavy metals were evaluated at eight sites, with surface collection (2 cm), flotation in NaCl, and vacuum filtration, followed by digital microscopy, FTIR, and SEM characterization. MPs were detected in all samples, totaling 544 items/kg, indicating potential for heavy metal accumulation on MP particles (Wang et al., 2017).
On Norderney Island (Germany), 36 surface sediment samples were processed by flotation in NaCl and sodium iodide (NaI), identified via visual inspection and pyrolysis-gas chromatography with thermal desorption. MPs (<1 mm) were found in 26 samples, with up to 213 fibers/kg, primarily composed of PP, PE, PS, PA, PET, and PVC (Dekiff et al., 2014).
Sediments from Mallorca and Cabrera (Mediterranean) were density-separated and analyzed microscopically, revealing 897.35 items/kg in protected areas and 163.68 items/kg in zones with anthropogenic influence. MPs were predominantly fibers in anthropogenic areas and fragments in protected areas, with blue and black colors (Alomar; Estarellas; Deudero, 2016).
On the German Baltic coast, beach sediments were analyzed after density separation and stereoscopic microscopy. MPs (55 µm-1 mm) ranged from 0 to 7 particles/kg and 2 to 11 fibers/kg, with sources linked to urban discharge, industry, fishing, and tourism (Stolte et al., 2015).
In South Korea, the fluorescent dye Nile Red (NR) was tested for MP identification in comparison with FTIR. Mean recovery was 98% for NR and 96% for FTIR, with the advantage of faster processing using NR. Water samples from three sites showed concentrations of up to 3.72 particles/m3 (Shim et al., 2016).
A European survey of 23 locations (13 countries) separated samples by density and chemically analyzed them, with concentrations of up to 1512 items/kg (Lido di Dante, Italy). MPs were mainly fibers (98.7%), composed of PES, PE, and PP (Lots et al., 2017).
In the Bohai Sea (China), sand samples were processed via NaCl flotation and filtration, analyzed by digital microscopy and FTIR. Concentrations ranged from 102.9 to 163.3 items/kg, predominantly fragments and films, with polymers including PE, PP, PET, PS, LDPE, HDPE, and PEVA (Yu et al., 2016).
In the North Yellow Sea (China), MPs were density-separated and sieved, identified using optical microscopy and FTIR. Concentrations reached 545 items/m3 in water and 37.1 items/kg in sediments, with 70% of particles smaller than 1 mm, mainly PE and PP (Zhu et al., 2018).
In Shenzhen and Hong Kong, plankton net and Ekman grab samples were processed by filtration and density separation, analyzed by stereomicroscopy and FTIR. Concentrations reached 458 items/kg in sediments and 35,642 items/100 m3 in water, predominantly pellets (96.8% in water) and fragments (63.6% in sediments) of PP, HDPE, and LDPE (Tsang et al., 2017).
In the South Yellow Sea, MPs were density-separated in sediments and acid-digested in benthic organisms (BO). Concentrations ranged from 560 to 4205 items/kg in sediments and 1.7 to 47 particles/g in BO, correlated with depth, mainly PP, PE, PA, and PET (Wang et al., 2019).
In the Nakdong River (South Korea), MPs were extracted via lithium metatungstate separation and 5 µm filtration, identified using FTIR. Concentrations reached 4760 items/m3 in water and 1971 items/kg in sediments, principally PP, PES, and PE, with an estimated annual load of 17 trillion particles (EO et al., 2019).
In Mobile Bay (USA), MPs were separated by sieving and density with a recovery device (97.25%), identified via FTIR. Average concentrations were 50.6 items/m2 in marine areas and 13.2 items/m2 in freshwater areas, predominantly PE and PP (Wessel et al., 2016).
On the coast of Tamil Nadu (India), MPs were extracted by density separation and sieving, characterized via FTIR. Concentrations reached 178 items/m2, predominantly fragments (48%) and fibers (24%), with MPs found in 10.1% of analyzed fish (Karthik et al., 2018).
In Gdansk Bay (Poland), extraction followed a modified NOAA protocol, including wet oxidation with peroxide, calcite digestion, and density separation. MPs were identified by stereomicroscopy, totaling 34-48.4 items/kg, with a predominance of fibers (Zobkov; Esiukova, 2017).
The reviewed studies demonstrate widespread occurrence and accumulation of MPs in marine and freshwater environments, highlighting the presence of heavy metals associated with MPs in Beijiang River sediments (Wang et al., 2017) and the Bohai Sea (Yu et al., 2016). The highest concentrations recorded were 35,642 items/100 m3 in water from Shenzhen and Hong Kong (Tsang et al., 2017), 4760 items/m3 in Nakdong River water (EO et al., 2019), and 4205 items/kg in sediments of the South Yellow Sea (Wang et al., 2019). The most common MP type was fiber, and the predominant polymers were polyethylene (PE) and polypropylene (PP). The most frequently employed extraction method was density separation, typically associated with saline solutions (NaCl, NaI, or lithium metatungstate) and characterization via FTIR and microscopy. Table 2 summarizes the data obtained from this review.
2.2 Sands
Beach sediments are fragments of geological formations that resist weathering and are transported by wind, rivers, and glaciers to the coast, and deposit them (Anjos et al., 2006), To address environmental issues related to the erosion of dunes, slopes, and sandy beaches, Almajed et al. (2020), Liu et al. (2020), and Miftah et al. (2022) conducted studies to identify sediment characteristics and evaluated treatments aimed at reducing erosion rates. Miftah et al. (2022) analyzed the use of enzyme-induced carbonate precipitation (EICP) to improve erodibility, mitigate erosion, and reduce water infiltration rates in poorly graded sand (SP) from Famagusta Bay Beach, Cyprus, composed of quartz and calcite. After treatment cycles, sand cohesion increased from zero to 62 kPa, infiltration decreased from 1.3 × 10⁻² cm/s to 9.4 × 10⁻⁴ cm/s, and erosion rates dropped from 31.66 mm/s to 1.14 mm/s.
Liu et al. (2020) studied calcareous sand from the Hawaiian coastal zone, classified as well-graded sand (SW), and found that both EICP and microbially induced carbonate precipitation (MICP) treatments were effective in mitigating erosion, though their efficiency decreased under higher slope and wave intensity conditions. Almajed et al. (2020) applied EICP and sodium alginate biopolymer to poorly graded sand (SP) from the Nafud Desert, Saudi Arabia, composed of quartz, achieving complete elimination of erosion in wind tunnel tests and increasing the unconfined surface strength to 300 kPa with calcite crystal formation.
Visconti et al. (2022) analyzed a volcanic beach on Linosa Island, Italy, evaluating granulometry, mineralogy, and moisture (ranging from 8.5% at the surface to 34.43% at 60 cm depth) on the hatching of loggerhead turtle eggs (Caretta caretta). Hatching rates were approximately 30%, influenced by factors such as temperature, mineralogy (plagioclase, clinopyroxene, and olivine), and sediment moisture content.
Characterization studies of coastal soils were also conducted by Dias and Alves (2009), Simões (2015), Costa (2020), and Polido et al. (2020). At Praia do Cassino (RS), Dias and Alves (2009) found fine sediments (>70%) at depths of 8.2-9.4 m, with moisture up to 150% and low natural density (˜14 kN/m3), contrasting with surface layers >90% sandy and specific weights of 18-20 kN/m3. At Ipanema Beach sand (RJ), studies (Ratton and Sayão, 1994; Simões, 2015; and Costa, 2020) identified predominantly quartz, sub-rounded to rounded grains, specific gravity ≈ 2.65, void ratios of 0.43-0.76, and permeability around 10-2 cm/s, indicating typical quartz sand behavior.
Anjos et al. (2006) and Carvalho et al. (2011) studied sands from beaches in São Paulo, Rio de Janeiro, and Espírito Santo, analyzing composition, provenance, and transport. Heavy minerals such as zircon, ilmenite, magnetite, garnet, monazite, and rutile, rich in thorium (Th) and uranium (U), were identified, while lighter minerals like quartz and feldspar showed elevated potassium (K) content. Darker sands with red or black hues exhibited high Th and U concentrations, whereas lighter sands presented higher K content.
Anjos et al. (2006) and Carvalho et al. (2011) used gamma-ray spectrometry to evaluate Th, U, and K concentrations and correlated Th/U and Th/K ratios to infer sediment origin and transport.
Potassium was interpreted as an indicator of source rock, remaining high from the disintegration of quartz- and feldspar-rich rocks. Uranium, susceptible to oxidation when exposed to air, indicated transport medium, showing lower concentrations with exposure. Thorium, being more stable, served as a reference in the correlations. Th/U above 7 indicated aeolian transport; between 2 and 7, shallow fluvial transport; and below 2, deep marine transport under low oxygen conditions. Low Th/K ratios indicated direct transport from rock to deposit, whereas high values suggested multiple reworking processes.
These studies, together with research on permeability (Pereira and Calliari, 2005; Oliveira, 2016) and anthropogenic impacts such as oils, greases, fecal coliforms, and microplastics (Torres-Bejarano, 2018; Carvalho and Baptista Neto, 2016), reinforce the importance of detailed sand characterization to understand environmental and geotechnical processes in coastal zones. Table 3 presents the geotechnical parameters verified by various researchers.
3 METHODOLOGY
3.1 Soil Sampling
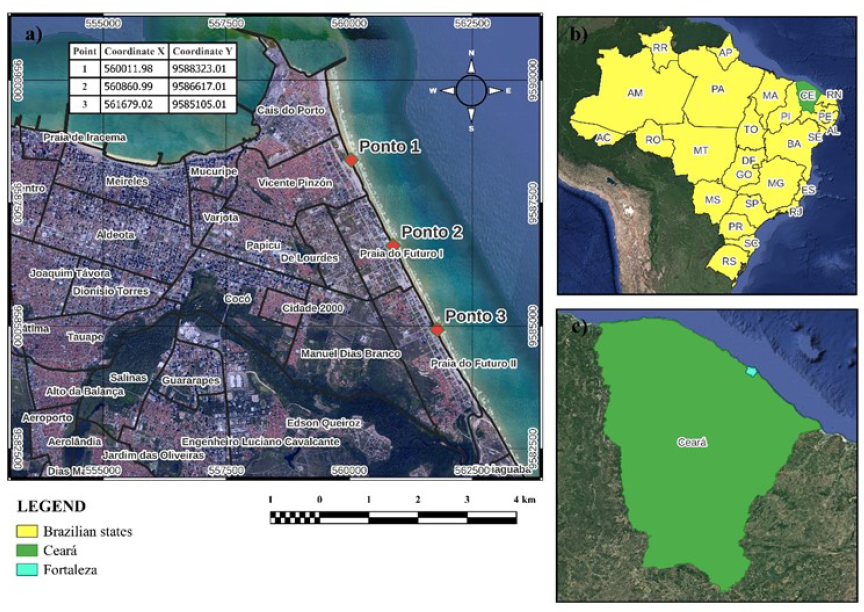
The study uses as analysis material the sand from Praia do Futuro, located in the municipality of Fortaleza/CE (3°43'6'' S, 38°32'36'' W), capital of Ceará, in northeastern Brazil (Figure 1). Fortaleza covers 312.4 km2 and has about 2.5 million inhabitants (IBGE, 2023), with 12 beaches, among which Praia do Futuro, Meireles, Mucuripe, Praia de Iracema, and Barra do Ceará stand out (Martinz; Anjos; Sohn, 2022; SEMACE, 2022). Praia do Futuro, located east of the city, extends for 8 km and receives approximately 660,000 visitors per year, attracted by its 60 beach huts distributed along the shoreline (Albuquerque et al., 2009; Lima, 2017; Prefeitura de Fortaleza, 2023). The Cocó River, which drains 80% of the city’s hydrographic surface and receives tributaries from other rivers, flows into the coastal region of this beach (Vasconcelos; Miossec, 2006).

Location of sampling points: (a) sampling points in Fortaleza; (b) location of the State of Ceará in Brazil; (c) location of the municipality of Fortaleza in Ceará.
The study area was chosen because Praia do Futuro has not undergone artificial nourishment processes with external sediments, as occurred at Praia de Iracema, ensuring the analysis of naturally deposited material. Sample collection followed methodologies described and recommended by Thompson et al. (2004), Hidalgo-Ruz et al. (2012), and Besley et al. (2017).
Considering the length of Praia do Futuro, sampling was distributed across three equidistant points along the shoreline. Point 1 was established in an area with lower tourist flow, while Points 2 and 3 were located near two beach bars with high tourist activity. The region exhibits typical features of coastal occupation, including beach bars, buildings near the waterfront, urban drainage systems discharging domestic effluents, and the presence of solid waste both in the surroundings and on the sand itself (Lemos; Ferreira; Arau´jo, 2002; Magini et al., 2007).
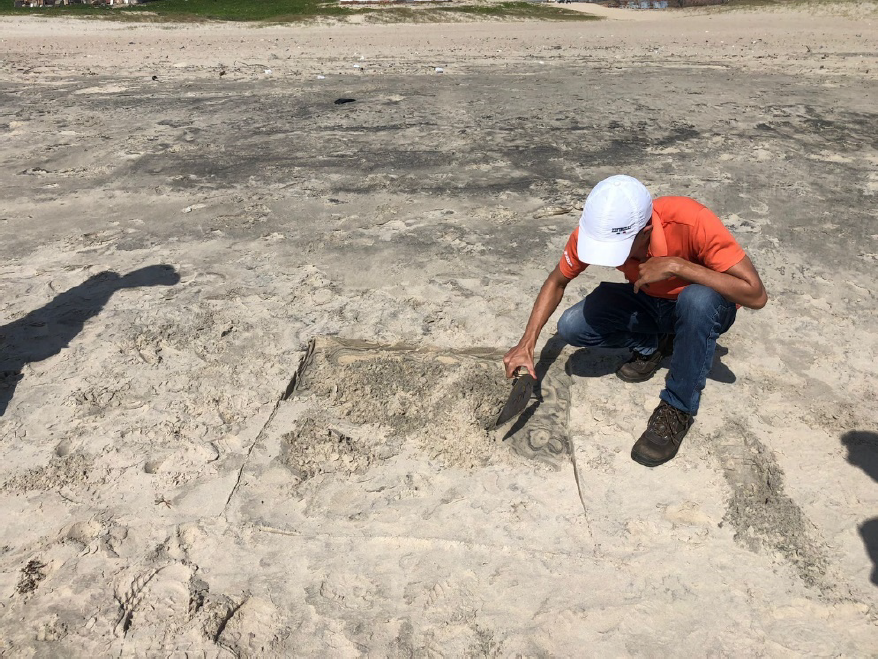
At each sampling point, seven samples were collected following the procedures described by Thompson et al. (2004), Hidalgo-Ruz et al. (2012), and Besley et al. (2017). Each sample was taken from a 1 m2 area, with a spacing of 10 m between points and a thickness of 3 cm, according to the method proposed by Besley et al. (2017) for the investigation of microplastics in surface sediments (Figure 2). Although Thompson et al. (2004), Hidalgo-Ruz et al. (2012), and Besley et al. (2017) reported no significant differences between samples collected from the intertidal zone, high tide line, or supralittoral zone, Besley et al. (2017) noted a higher frequency of microplastic occurrence at the high tide line. For this reason, sampling in this paper was conducted in this portion of the beach.

During sampling, each sample was taken from the center of the previously delineated area and transferred with a shovel to storage containers properly labeled both internally and externally, ensuring traceability and preventing contamination during transport and storage.
3.2 Methods
Brazilian standards (ABNT) were adopted for the execution of the tests. Where no applicable national standard existed, methods from the American Society for Testing and Materials (ASTM) and the Brazilian National Department of Transport Infrastructure (DNIT) were used, along with widely recognized protocols cited in the literature review. Table 4 presents the tests and characterizations performed in this study.
3.2.1 Microplastic Extraction
The extraction of microplastics followed the method of Masura et al. (2015), suitable for polymers with densities below 1.15 g/mL, including EPS, PP, LDPE, HDPE, ABS, PS, and PA (Table 1). Microplastics were defined as particles between 5 and 0.45 µm (filter pore size). The density separation solution was prepared with NaCl (358.9 g/L of distilled water) following Besley et al. (2017). Each sample (500 g) was sieved through a 4.75 mm mesh, oven-dried at 90 °C for 12 h or until constant mass, and 200 g of the dried sample were combined with 150 mL of saline solution in an Erlenmeyer flask. The mixture was agitated for 5 minutes and allowed to settle for 5 h to achieve density separation. The supernatant was then transferred to a beaker and vacuum-filtered using a 0.45 µm, 47 mm membrane. Filters were stored in Petri dishes to prevent contamination and subsequently examined under a Leica DM750P binocular polarization microscope.
3.2.2 Natural Moisture Content
The determination of natural moisture content (w), necessary for calculating the natural dry bulk density (ρd), followed ABNT (2016b). The soil was extracted using a drive cylinder, according to NBR 9813 (ABNT, 2016c). Three capsules per sample were weighed upon laboratory arrival, and the moisture content (w) was calculated using Equation 1.
Where: Pw - Water weight; Ps - Solids weight.
3.2.3 In Situ Bulk Density
The in situ bulk density was determined to evaluate the compaction state of the sand, which will be discussed in the results. The test followed ABNT (2016c), using a drive cylinder with a diameter of 104.5 mm and a height of 116 mm. The cylinders were driven according to the standard, around 50 cm from the sampling area of the other tests, maintaining 10 m spacing.
The natural bulk density (ρ) is calculated as the ratio between the total soil mass (m, in g), and the total volume (V, in cm3), according to Equation 2, expressed in g/cm3.
The dry bulk density (ρd), obtained by Equations 3 or 4, corresponds to the ratio between the mass of solids and the total volume, representing the density that the soil would have if dried without volume variation. Its determination is based on the natural bulk density (ρ) and the natural moisture content (w).
3.2.4 Particle Density
The determination of particle density was performed using pycnometers, according to the method described by DNER (1994a). The samples were prepared following DNER (1994b). The samples were oven-dried at 100 ± 5 °C, and for each sample, the required amount for five repetitions was separated, selecting values with variation lower than 0.009.
3.2.5 Grain Size Distribution
Grain size distribution was analyzed following ABNT (2016a), with sample preparation according to ABNT (2016b). No fractions larger than 2.0 mm or smaller than 75 µm were observed, allowing sieving-based analysis. From the grain size curve, D10, D30, and D60 were obtained, along with the Coefficient of Uniformity (CNU) (Equation 5) and Coefficient of Curvature (CC) (Equation 6). D10 represents the particle diameter at which 10% of the material passes through the sieve, with D30 and D60 determined similarly.
3.2.6 Void Ratios
The void ratio (e) is the ratio between the void volume (Vv) and the solid volume (Vs), as shown in Equation 7. It can be obtained through correlation with porosity (n) (Equation 8) or by the relationship between particle density (ρs) and dry bulk density (ρd) (Equation 9).
Void ratios were determined by measuring maximum and minimum dry bulk densities, which were then used to calculate the corresponding maximum and minimum void ratios.
3.2.6.1 Maximum Void Ratio
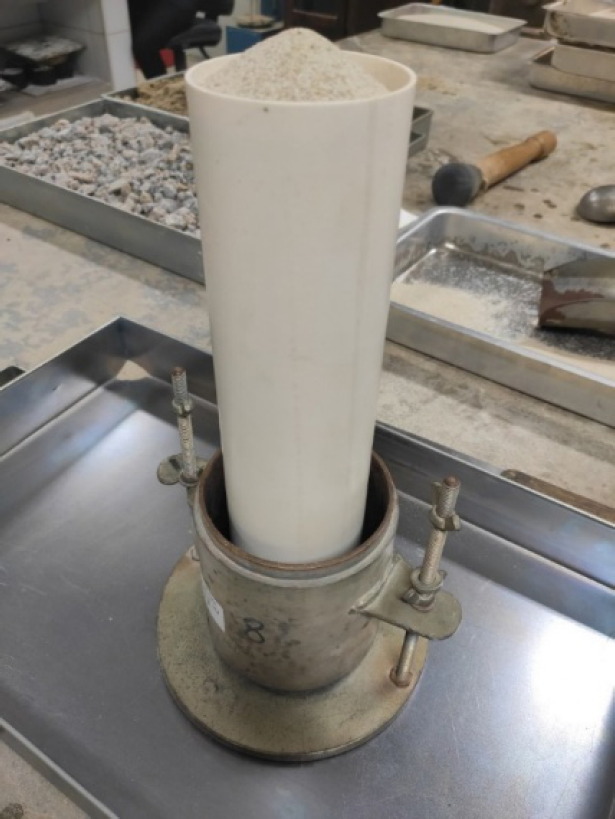
The maximum void ratio was determined using Method B of ABNT (2020a). For the test, 2.5 kg of sand were oven-dried for 24 h, homogenized, and subjected to the procedure. A Proctor Normal compaction mold (100 mm in diameter and 127.3 mm in height), with previously measured volume and mass, was used. The thin-walled tube specified by the standard was adapted from a PVC tube with an internal diameter of 7 cm and an approximate volume of 1300 cm3 (Figure 3).

The void ratio was determined using Method B of ABNT (2020a). For the test, 2.5 kg of sand were oven-dried for 24 h, homogenized, and subjected to the procedure. A Proctor Normal compaction mold (100 mm in diameter and 127.3 mm in height), with previously calibrated volume and mass, was used. The thin-walled tube specified by the standard was adapted from a PVC tube with an internal diameter of 7 cm and an approximate volume of 1300 cm3 (Figure 3). The test consists of uniformly filling the thin-walled tube with sand and quickly removing it in the vertical direction. Immediately after, the excess material above the upper edge of the Proctor mold was removed and the surface leveled, while the material accumulated at the edges of the mold was brushed off. The mold with the contained material was then weighed, enabling the calculation of the minimum dry bulk density and, subsequently, the maximum void ratio.
3.2.6.2 Minimum Void Ratio
The minimum void ratio was determined using the Multiple Sieving Pluviation (MSP) method (Miura and Toki, 1982), which involves pluviating sand through multiple sieves with controlled flow rates. Tests are performed with varying funnel opening diameters and sieve heights to establish the void ratio curve for each sand type. Equipment specifications and sieve opening ratios used in this and previous studies are detailed by Soares (2021) and summarized in Table 5.
Ratios between sieve diameters used in the MSP method and the D50 of the sample, as well as the number and sequence of sieves, according to different authors.
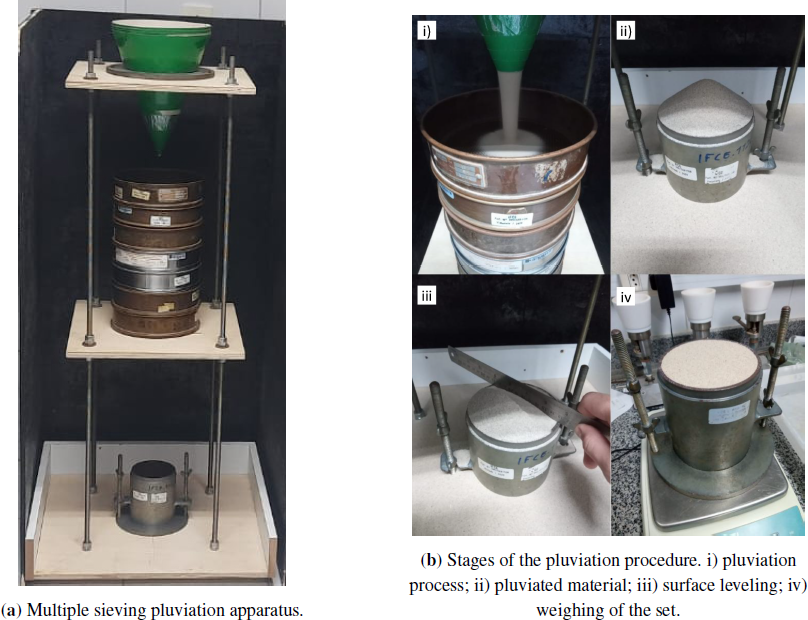
The procedure followed the #ps/D50 and #pi/D50 ratios and sieve sequencing proposed by Miura and Toki (1982), with adaptations introduced by Simões (2015), Costa (2020), and Soares (2021) that did not significantly affect the results. A multiple sieving pluviation apparatus was developed based on these studies to determine the maximum dry unit weight and minimum void ratio of the samples (Figure 4). Funnels with outlet diameters of 5, 10, 20, 30, 40, and 50 mm, a 60° inclination, and an upper opening of 225 mm were used to control discharge rate. The pluviation procedure involved oven-drying a sample volume five times that of the mold, pluviating it through the sieves [Figure 4b i) and ii)], removing excess material (Figure 4b iii), and weighing the mold (Figure 4 iv) to determine the maximum dry unit weight.

Multiple sieving pluviation developed for determining the maximum dry unit weight and minimum void ratio of sand samples, based on previously reported methodologies.
3.2.7 Permeability
Soils exhibit permeability due to the presence of interconnected voids (Das, 2008). Free water is generally not in hydrostatic equilibrium, moving from regions of higher to lower energy. This movement, called percolation, is relevant in soil mechanics as it allows estimation of the volume of water-or other fluids-infiltrating the subsoil under different hydraulic conditions, assisting in the analysis of problems such as pumping in underground constructions and the behavior of earth masses (Fernandes, 2016).
Soil permeability is based on Darcy’s Law, which experimentally demonstrated that the water flow rate (Q) through a sand layer is directly proportional to the cross-sectional area (A) and the hydraulic head difference (∆h), and inversely proportional to the thickness of the layer (L). This relationship, expressed in Equation 10, uses the hydraulic gradient (i = ∆h/L). Darcy’s law, presented in Equation 11, also allows the apparent flow velocity (v) to be obtained as the product of the coefficient of permeability (k) and the hydraulic gradient (i), as shown in Equation 12. The flow velocity can also be determined according to ABNT (2021) using Equation 13.
The constant head permeability test was carried out according to ABNT (2021), using a Type A permeameter. The system consists of a reservoir that stabilizes the water level and a tube that directs the flow to the permeameter.
The test setup began with the placement of a granular base layer, followed by a metallic mesh supporting a geotextile. Next, the specimen was molded, overlaid with another metallic mesh and an additional granular layer. The specimen was prepared to reproduce the relative density of the sampling site. For this purpose, a funnel and auxiliary compaction equipment were used to accommodate the soil mass required to achieve the in situ dry unit weight within a predefined volume. Before testing, the specimen was saturated by upward flow with a hydraulic gradient of 1.0 to remove entrapped air.
3.2.8 2D Shape and Angularity
Among particle characterization methods, shape and angularity determined according to DNIT (2020) are particularly relevant. Using the Aggregate Imaging Measurement System (AIMS), particles smaller than 4.75 mm are scanned and analyzed, with the software automatically calculating 2D shape (Equation 14) and angularity (Equation 15).
Where: R q= particle radius at an angle Θ; Dq = incremental angular difference.
Where: q = orientation angle of the contour points; n = total number of points; i = i th point of the particle contour.
For the classification of grains regarding angularity and 2D shape, the DNIT (2020) is adopted, which recommends the classification proposed by Ibiapina (2018), presented in Table 6. Since the analyzed particles are smaller than 4.75 mm, this study exclusively covers the evaluation of 2D shape and angularity. For each sample, the mean values obtained are calculated, and the classification is performed according to the criteria in Table 6.
3.2.9 Elemental and Mineralogical Analysis
According to Artioli (2010), X-ray diffraction (XRD) and X-ray fluorescence (XRF) are economically viable and reliable techniques for identifying crystalline phases in natural and artificial materials such as metals, ceramics, soils, building stones, metallurgical slags, pigments, and plasters. These techniques are complementary: XRF enables the identification of chemical compounds (ABNT, 2014), while XRD determines crystalline structures. When combined, they allow: the identification of crystalline compounds; quantitative analysis of multiphase mixtures; investigation of the long-range atomic structure of crystals, including charge density analyses; physical evaluation of crystalline aggregates, such as orientation texture, crystallite size distribution, and lattice microstrain effects. For these analyses, samples must be in the form of small individual crystals (0.1 to 1.0 mm), polycrystalline aggregates (powders, consisting of 103 to 106 crystallites of approximately 1 mm), or oriented specimens (fibers, films, polished surfaces). According to Artioli (2010), the choice of experimental techniques and data treatment methods depends on the physical state, chemical composition of the sample, and the objectives of the analysis.
3.2.10 Statistical Analysis
Data processing was conducted through statistical analyses using Jamovi software (version 2.3; The Jamovi Project, 2022). Initially, the Shapiro-Wilk test was employed to assess data normality (Larson, 2010). Variables for which normality was not rejected across all three sampling points were subsequently evaluated for homogeneity of variances using Levene’s test. Only the variables corresponding to microplastic occurrence, natural bulk density, natural dry bulk density, natural void ratio, porosity, and relative density satisfied these assumptions and were subjected to analysis of variance (ANOVA). For variables that did not meet the assumptions of normality or variance homogeneity the non-parametric Kruskal-Wallis test was applied to compare medians across the three sampling points. Statistical significance was considered at a 95% confidence level.
4 RESULTS AND DISCUSSION
4.1 Microplastic Occurrence
The ANOVA results for microplastic occurrence showed means of 76 objects/kg at Sampling Point 1, 46 objects/kg at Point 2, and 67 objects/kg at Point 3. Considering the analyzed depth (3 cm) and dry bulk densities (1519, 1485, and 1452 kg/m3), these correspond to concentrations of 3450, 2036, and 2925 objects/m2, respectively. Subsequent analysis using Tukey’s post-hoc test (Table 7) indicated no significant differences between the sampling points.
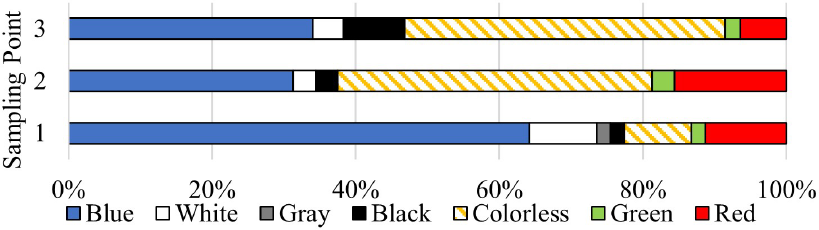
The MP occurrence per sampling point is shown in Figure 5. Fibers predominated (75-89%), followed by fragments (9-25%) and spheres (3%). Regarding color, blue objects (31.3-64.2%), colorless (9.4-44.7%), and red (6.4-15.6%) were observed (Figure 6). These results corroborate Nolasco et al. (2022), who identified 619 particles in 8,251.26 m3 of coastal water in Fortaleza, of which 57% were fibers and 36% were fragments. Dark green fibers were the most abundant (22%), followed by transparent fibers (15.1%). Blue fibers and fragments accounted for 11% and 13.3%, respectively, while white and black fragments represented 6.2% and 6.8%. The particles were characterized as polyamide (PA), polystyrene (PS), tire rubber, polyethylene (PE), polypropylene (PP), and polyvinyl chloride (PVC).
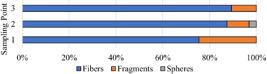

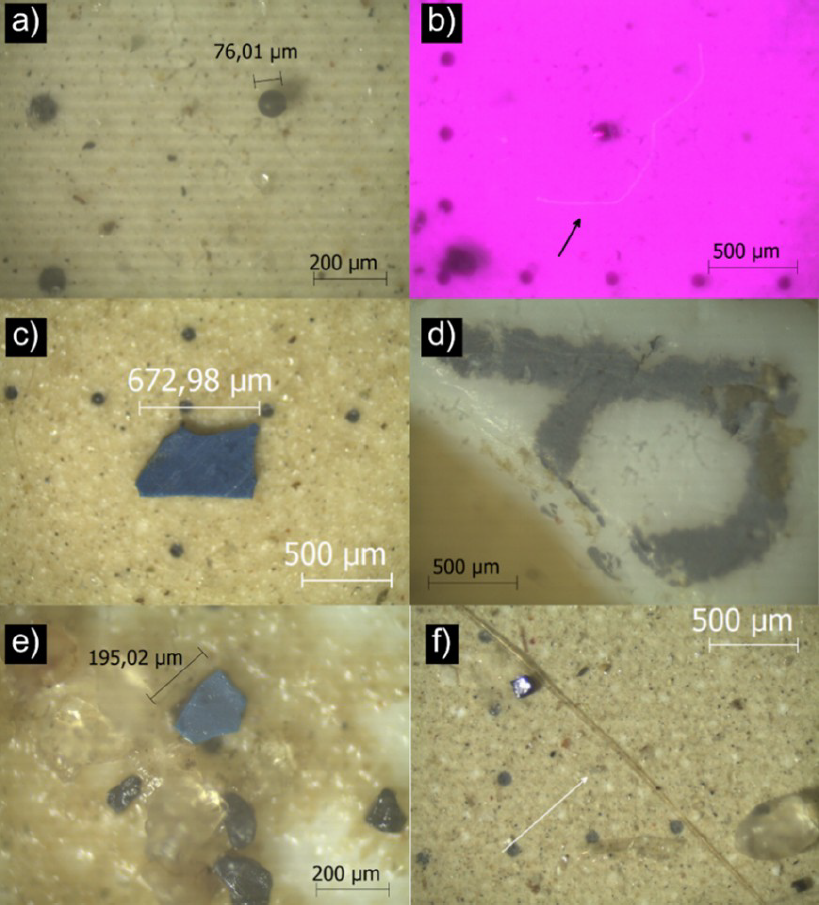
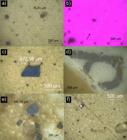
Figure 7 shows the identified microplastics. Observed features were: (a) a 76 µm sphere; (b) a colorless fiber fluorescing under ultraviolet light, longer than 1 mm; (c-e) plastic fragments with signs of fragmentation and oxidation, with approximate sizes of 673 µm and 195 µm, respectively; (d) a fragment with inscriptions, cuts, and oxidation; and (f) a rigid fiber longer than 2 mm.
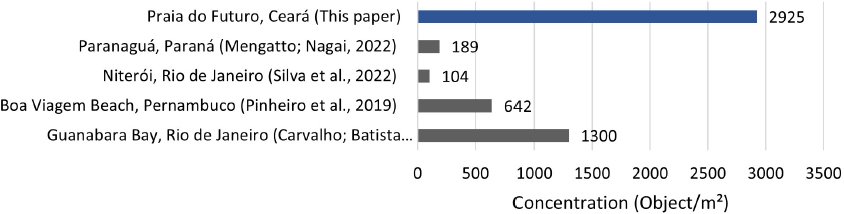
In Brazil, MP accumulation varies widely: Guanabara Bay showed 12-1300 particles/m2, with 56% fragments, 26.7% polystyrene foam, 9.9% pellets, and 7.2% fibers (Carvalho and Baptista Neto, 2016). Boa Viagem Beach (Pernambuco) recorded 642 particles/m2 in areas protected by beachrocks, compared to 130 particles/m2 in exposed zones, indicating greater accumulation in sheltered regions (Pinheiro et al., 2019). In Niterói (RJ), Sossego Beach reached 102.4 particles/m2, mainly polystyrene foam (52%), filaments and fragments (20% each), with films (4%), pellets (2%), and fibers (1%) (Silva et al., 2022). Vila das Peças (PR), an environmental protection area, presented 188.4 particles/m2 (Mengatto and Nagai, 2022).
International studies report higher concentrations: ports in Belgium contained 166.7 particles/kg, dominated by fibers (59%) and fragments (25%) (Claessens et al., 2011); Beijiang River sediments in China reached 544 items/kg, often associated with heavy metals (Wang et al., 2017); Norderney Island (Germany) recorded 23-213 fibers/kg (Dekiff et al., 2014); Mediterranean islands showed 897.35 items/kg in protected areas and 163.68 items/kg under anthropic influence (Alomar, Estarellas, and Deudero, 2016). Main MP sources include fluvial and urban inputs, with atmospheric deposition also contributing up to 365 particles/m2 daily in the Pyrenees (Allen et al., 2019).
In comparison, concentrations observed in this study exceeded all reported Brazilian values (Carvalho and Baptista Neto, 2016; Pinheiro et al., 2019; Silva et al., 2022; Mengatto and Nagai, 2022) (Figure 8), highlighting the substantial MP pollution in the sand of Praia do Futuro.

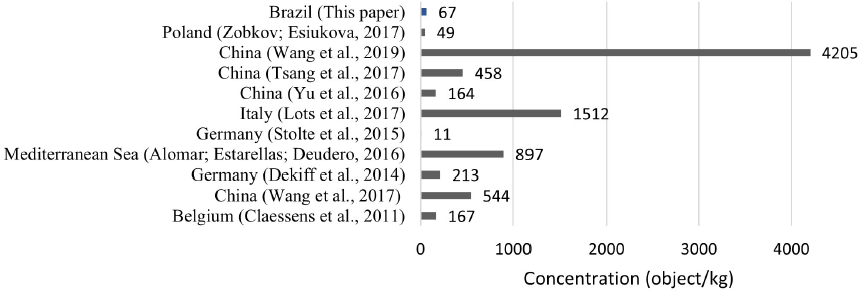
As shown in Figure 9, the concentrations obtained were lower than those reported in Belgium (Claessens et al., 2011), China (Yu et al., 2016; Wang et al., 2017; Tsang et al., 2017; Wang et al., 2019), Germany (Dekiff et al., 2014), Italy (Lots et al., 2017), and the Mediterranean Sea (Alomar; Estarellas; Deudero, 2016). On the other hand, they exceeded the values observed in Poland (Zobkov; Esiukova, 2017) and Germany (Stolte et al., 2015). The results are consistent with the range reported for coastal zones under tourism and fluvial influence, considering that the particles may have either oceanic or terrestrial origin (Vegter et al., 2014).

4.2 Natural Moisture
The values varied according to the proximity to the tidal zone and the water level in the sand, being higher in the areas close to the waterline. The medians were 3.8% (P1), 4.4% (P2), and 6.3% (P3), the latter being influenced by light rainfall at the time of sampling.
The discussion on the significance of the moisture variation is limited, since the values were influenced by rainfall at the time of sampling and by temperature variation throughout the morning. According to Tuijnman et al. (2020), moisture tends to increase with proximity to the sea and the water table; however, the depth of the latter was not analyzed to support the selection of the sampling points. Even so, the chart and the multiple comparison test (Table 8) indicated significant differences among the three points.
Wiggs, Baird, and Atherton (2004) analyzed the influence of moisture on sand transport and drift at Aberffraw Beach, United Kingdom. Samples with 3 cm thickness presented contents between 11.06% and 14.06%, while the surface layer (1-2 mm) ranged from 3.81% to 7.78%. Moisture determination was carried out using a ThetaProbe (3 cm) and by oven drying after collection with a Surface Sediment Sampler (1-2 mm). The authors emphasized that, under natural conditions, contents below 1.68% do not act as a barrier to wind transport. According to Sherman and Douglas (1990), sediment transport depends on multiple factors, including wind stress, grain size distribution, sediment availability, moisture content, bed roughness, beach slope, and vegetation cover. Thus, for the sediments of Praia do Futuro, the analysis of moisture as a barrier to transport is linked with the velocity and direction of local winds, which should be analyzed (Bauer et al., 2009).
4.3 Specific Densities
The specific densities obtained support the calculation of parameters such as degree of saturation, void ratios (minimum and maximum), relative density, and porosity.
4.3.1 Natural Bulk Density
As described in Section 3.2.2, the natural bulk density was determined in situ. The mean values were 1.576 g/cm3 (Point 1), 1.551 g/cm3 (Point 2), and 1.547 g/cm3 (Point 3). The interpretation of the graph and the Tukey Post-Hoc test (Larson, 2010; The Jamovi Project, 2022) (Table 9) showed no significant difference among the points, showing similar distribution regarding natural bulk density.
Polido et al. (2020) reported natural bulk density values between 1.50 and 2.04 g/cm3 in coastal sands from Greater Vitória-ES, determined using the sand-cone method. The results of this research fall within this range, possibly due to soil origin, grain sorting, and natural packing.
4.3.2 Natural Dry Bulk Density
The results of natural dry bulk density, with mean values of 1.519 g/cm3, 1.485 g/cm3, and 1.452 g/cm3 for Points 1, 2, and 3, respectively. The Tukey Post-Hoc test (Table 10) indicate a significant difference in natural dry bulk density between Points 1 and 3, with Point 2 being intermediate, possibly representing a transition zone between the sampling sites. Point 3, near the area of greatest tourist activity, exhibited the lowest natural dry bulk density, while Point 1 showed the highest. As this parameter informs the calculation of natural void ratio and relative density, these results are discussed in the corresponding sections.
4.3.3 Minimum Dry Bulk Density
The minimum dry bulk density, obtained according to ABNT (2020a) for the calculation of maximum void ratio. Point 1 presented the highest median value (1.448 g/cm3), possibly due to a higher fine content and smaller effective diameter, while Points 2 and 3 recorded medians of 1.406 g/cm3 and 1.410 g/cm3, respectively. The analysis of the significance test (Table 11) indicates that Point 1 presented a significantly higher minimum dry bulk density than Points 2 and 3.
The minimum dry bulk density values obtained in this study (1.406-1.448 g/cm3) are close to those reported by Polido et al. (2020), between 1.38 and 1.43 g/cm3, using an equivalent methodology.
4.3.4 Maximum Dry Bulk Density
The maximum dry bulk density, determined according to Miura and Toki (1982), was 1.700 g/cm3, 1.671 g/cm3, and 1.672 g/cm3 for Points 1, 2, and 3, respectively. The graph indicates a difference between Point 1 and the others; however, the multiple comparison test (Table 12) shows no significant variation among the sampling points.
4.4 Particle Density
The particle density varied among the sampling points, with medians of 2.673 g/cm3 at Point 1, 2.635 g/cm3 at Point 2, and 2.641 g/cm3 at Point 3. A greater presence of fine fractions and darker coloration was observed at Point 1, while Points 2 and 3 exhibited lighter and more uniform grains. The multiple comparison test (Table 13) indicates a significant difference between Points 1 and 3, while Point 2 showed no significant variation in relation to the others.
The values obtained are close to those reported for quartz by Chiossi (2013). Sands from Ipanema, Brazil (Simões, 2015; Costa, 2020), Toyoura, Japan (Suzuki; Yamada, 2006), and Leighton Buzzard, United Kingdom (Lanzano et al., 2016), present particle densities near 2.65 g/cm3, consistent with the results of this research.
4.5 Granulometry
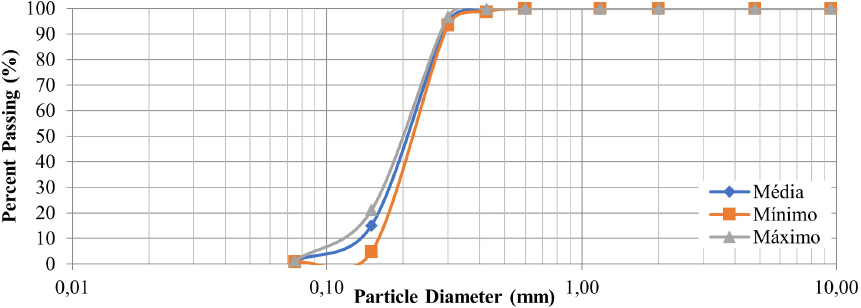
The granulometric analysis of Praia do Futuro sand is presented in Figures 10, 11, and 12 for Points 1, 2, and 3, respectively. At Point 1, the effective diameter (D10) ranged from 0.13 to 0.16 mm, with a median of 0.14 mm; the coefficient of uniformity (CU) varied between 1.53 and 1.81, median 1.72; and the coefficient of curvature (CC) ranged from 0.96 to 0.97, median 0.96.

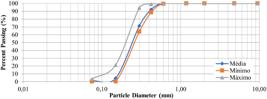

At Point 2, D10 ranged from 0.13 to 0.17 mm, median 0.17 mm; CU varied from 1.62 to 1.81, median 1.68; and CC ranged 0.96-0.97, median 0.96. At Point 3, D10 ranged 0.16-0.17 mm, median 0.16 mm; CU varied 1.60-1.68, median 1.65; and CC remained constant at 0.96.
Table 14 reviews the statistical analysis of D10 across the three points. The results indicate a slight variation in grain size distribution, with relatively uniform and well-graded sand throughout the site.
The multiple comparison test showed that Point 1 has a smaller effective diameter than Points 2 and 3, making it the finest sand among the three. No significant differences were observed between Points 2 and 3. Praia do Futuro sand exhibits granulometric characteristics similar to Nafud Desert sand, Saudi Arabia (D10 = 0.15 mm; D50 = 0.238 mm). Mean diameters were 0.21 mm (Point 1), 0.26 mm (Point 2), and 0.25 mm (Point 3) (Table 15), confirming finer granulometry at Point 1.
The mean diameter analysis indicates that Praia do Futuro sand is finer than sands from Famagusta (Cyprus), Hawaii (USA), Ipanema Beach (Brazil), and Hostun (France), surpassed only by Leighton Buzzard (UK) and Toyoura (Japan) (Table 3). CNU (Table 16) and CC analyses (Table 17) revealed no significant differences among the three sampling points.
The CNU and CC parameters are similar to the values reported by Almejed et al. (2020) for Nafud Desert sand, Saudi Arabia (CNU = 1.73; CC = 0.9). According to ABNT (2022), soils and rocks present a wide granulometric variation, from clays and silts to sands, gravels, pebbles, and boulders. Based on Table 18, Figure 13 presents the median percentages of sand fractions at the sampling points: Point 1 - 57% medium sand and 42% fine sand; Point 2 - 75% medium sand and 23% fine sand; Point 3 - 72% medium sand and 26% fine sand.

The hypothesis tests in Tables 19 and 20 indicate that the percentage of medium sand at Point 2 did not differ significantly from Points 1 and 3. Regarding fine sand, Point 1 presented significantly higher percentages, indicating that it has the finest granulometry. These results are consistent with those observed by Morais (1980), who identified a predominance of medium sand in a loose state in stratigraphic profiles of 2.2 to 2.9 m in the coastal environmental geology of Fortaleza.
According to Park and Santamarina (2017), soils can be grouped into systems that allow prediction of their behavior based on physical properties. Thus, the sands of Praia do Futuro were classified as poorly graded (SP) by the Unified Soil Classification System (ASTM, 2017). For comparison, Simões (2015) reported for Ipanema Beach sand an average effective diameter of 0.22 mm, CNU of 1.90, and CC of 0.97, classifying it as poorly graded uniform. Costa (2020) found an effective diameter of 0.27 mm, CNU of 1.56, and CC of 0.90, with the same classification. Praia do Futuro sand shows characteristics similar to the sands of Famagusta Bay, Nafud Desert, Linosa Island, and Ipanema Beach (Table 3).
4.6 Results Obtained from Mathematical Relationships of Physical Indexes
4.6.1 Void Ratio
4.6.1.1 Natural Void Ratio
Based on the data of natural bulk density and solid particle density, the mean values of the degree of saturation were: Point 1 = 0.76; Point 2 = 0.78; Point 3 = 0.82. Analyzing Table 21, the natural void ratio showed that Point 2 did not differ significantly from the others, while Point 3 was significantly different from Point 1.
Román-Sierra, Muñoz-Perez, and Navarro-Pons (2014) reported natural void ratios between 0.34 and 0.77 for sands, while Polido et al. (2020) found values between 0.62 and 0.72. The mean values in this study are within the range obtained by Román-Sierra, Muñoz-Perez, and Navarro-Pons (2014) and close to those of Polido et al. (2020), with Point 3 higher than the others, suggesting further analysis of grain shape to verify the relationship.
4.6.1.2 Maximum Void Ratio
The maximum void ratio was calculated from the minimum dry bulk density and the solid particle density (ABNT, 2020a). The median values obtained were 0.85, 0.88, and 0.88 for Points 1, 2, and 3, respectively. According to multiple comparison test (Table 22), Point 2 presented an intermediate value, while Point 1 was significantly lower than Point 3.
Simões (2015) verified the maximum void ratio of Ipanema Beach sand at 0.73, using a method adapted from Kolbuszewski (1948). Costa (2020), applying four methods, obtained values between 0.66 and 0.75. Polido et al. (2020) recorded mean values between 0.87 and 0.96 on the beaches of Espírito Santo. In this research, the mean values ranged between 0.85 and 0.88, higher than those found by Simões (2015) and Costa (2020) and lower than those of Polido et al. (2020). The difference compared to Nafud Desert sand, Saudi Arabia, which presented a maximum ratio of 0.66, is attributed to grain shape: rounded and spherical in Nafud versus semicircular and sub-rounded at Praia do Futuro. The value obtained is close to that reported by Miftah et al. (2022) for Famagusta Bay (emax = 0.88), despite granulometric and mineralogical differences.
4.6.1.3 Minimum Void Ratio
The minimum void ratio, calculated from the maximum dry bulk density and particle density following Miura and Toki (1982), showed median values of 0.58 across all three sampling points. Table 23 indicates no significant differences among points. Although differing from values reported for Nafud Desert sand (Almajed et al., 2020), the results are comparable to Famagusta Bay sand, likely influenced by grain shape rather than granulometry or mineralogy. The consistency of the measurements reflects uniform sand morphology, and the method exhibited high repeatability and reproducibility, making it suitable for preparing test specimens with controlled relative densities.
4.6.2 Relative Density
To classify the state of sand in its natural environment, relative density, also called degree of density or relative compaction, is used. This parameter allows distinguishing whether the sand is in a loose or dense state. ABNT (2020b) presents the procedure for calculating relative density (CR), as shown in Equation 16.
The relative density values determined were 0.33 for Point 1, 0.31 for Point 2, and 0.20 for Point 3. According to Table 24, which presents the classification of granular soil deposits based on relative density, these results allow classifying the analyzed points into their respective categories.
According to the mean values obtained for each sampling point, the deposits were classified within the range corresponding to the loose state. The result indicates no significant difference among the three sampling points, a result confirmed by the Tukey Post-Hoc test (Table 25). Thus, it is inferred that the relative density of the sand did not vary significantly among the analyzed points.
4.6.3 Degree of Saturation
The degree of saturation (S) corresponds to the ratio between the water volume and the void volume of the soil, as defined in Equation 17. Its value is determined by the mathematical expression presented in Equation 18.
Where: ρ s - solid particle density
The median values determined for the degree of saturation of the sand in its natural condition were 13.85%, 14.80%, and 20.82%, corresponding to Points 1, 2, and 3, respectively. According to Tuijnman et al. (2020), beach width and sediment saturation act as limiting factors in the supply of material for aeolian transport. Sassa et al. (2014) highlight that suction - related, among other factors, to soil saturation - influences geophysical properties of beach sediments, such as shear strength, relative density, and beach profile slope. These authors also investigated the influence of suction on the reproduction of three macrofauna species: two amphipod species (Haustorioides japonicus, found in the intertidal zone, and Talorchestia brito, characteristic of the supratidal zone), and one isopod (Excirolana chiltoni), located in intertidal zones. It is noteworthy that such organisms play a relevant ecological role, composing the food base of fish and birds (Placyk; Harrington, 2004; Kajihara, 2008). After determining the characteristic curve, Sassa et al. (2014) observed that amphipod species did not develop under conditions of increased suction, that is, reduced saturation, due to the increase in shear strength that hindered sand excavation. The isopod species, on the other hand, showed dependence on specific saturation ranges (between 10 and 20%), as it breathes through water. The multiple comparison test for the in-situ degree of saturation is described in Table 26.
4.6.4 Porosity
Porosity is defined as the ratio between the void volume (Vv) and the total soil volume (V), as expressed in Equation 19. Alternatively, it can also be obtained from the mathematical relationship with the void ratio, as shown in Equation 20.
According to USACE (2002), natural sands exhibit porosity between 25 and 50%, influenced by grain shape, texture, and angularity. The values obtained were 43% (Point 1), 44% (Point 2), and 45% (Point 3), falling within this range. Based on the Tukey Post-Hoc test (Table 27), a significant difference was verified only between Points 1 and 3, while Point 2 showed intermediate behavior.
Román-Sierra, Muñoz-Perez, and Navarro-Pons (2014) identified porosity values between 25.6% and 43.4% after nourishment of coastal regions, observing an initial increase followed by gradual reduction in about eight months, until approaching the natural state due to tidal action. Brady and Weil (2013) highlight that porosity can vary from 25% in well-compacted soils to over 60% in surface soils rich in organic matter. The values obtained in this research are consistent with those reported by Román-Sierra et al. (2014) and with the range indicated by USACE (2002).
4.7 Permeability
The mean permeability coefficient of the samples was 1.1 × 10⁻² cm/s at Point 1, 1.3 × 10⁻² cm/s at Point 2, and 1.3 × 10⁻² cm/s at Point 3. The respective relative density values were 0.43, 0.46, and 0.32, classifying the three points as loose sand. The determination of relative density considered the maximum and minimum void ratios according to Miura and Toki (1982) and ABNT (2020a). Table 28 presents the values obtained for permeability (k20), mean void ratio (emol), mean molding relative density (CRmol), state of density according to Das (2017), and natural void ratio (enat).
The sand from Famagusta Bay, molded with a relative density of 0.60, showed a permeability coefficient of 1.3 × 10⁻² cm/s, with D10 = 0.14 mm and D50 = 0.75 mm (Miftah et al., 2022). For Ipanema Beach, values of 2.1 × 10⁻² cm/s (CR = 0.30) and 1.2 × 10⁻² cm/s (CR = 0.80) were obtained (Costa, 2020), as well as 4.2 × 10⁻² cm/s (CR = 0.84) and 1.2 × 10⁻¹ cm/s (CR = 0.85) (Soares, 2021). The Table 29 indicates that Point 1 showed lower permeability compared to Points 2 and 3.
Despite granulometric differences compared to Ipanema Beach sand, the sand from Praia do Futuro showed permeability coefficients within the range reported by Costa (2020) and Soares (2021). It should be noted, however, that permeability is also influenced by the relative density adopted in molding test specimens. These values are relevant in oil spill studies, as they allow evaluation of correlations between water permeability and permeability to other fluids of higher viscosity, without the need to use crude oil samples in situ (Pereira; Calliari, 2005; Oliveira, 2016).
4.8 Angularity and Shape
The Aggregate Imaging Measurement System (AIMS) equipment records images of sand grains, which, through software and computational calculations, allow determining angularity and 2D shape parameters. Sand grains generally present semicircular shape and subrounded angularity (Figure 14 and Table 30).

Since soil is composed of mineral particles derived from rock weathering, these particles may remain close to the parent rock or be transported by natural agents, which influences grain shape (Craig, 2013). Transported soils tend to show more rounded angles and more spherical shapes (Das, 2017). With the advance of chemical action and abrasion, which increase with the age of deposits, sands become progressively more rounded, regardless of particle size (Cho et al., 2006), supporting the conclusion that sand grains may be equidimensional, presenting similar distances in all three directions (Fernandes, 2016). Grain shape affects properties such as porosity, specific surface area, and flow tortuosity between particles, directly influencing the hydraulic conductivity of soils. More concave and less spherical grains tend to form sands with higher porosity (Zheng et al., 2021; Shahsavari; Mahmood, 2022).
5 CONCLUSION
This research identified the presence of microplastic particles in the sand of Praia do Futuro, with concentrations notably higher than those reported in other regions. Fibers were the dominant particle type, followed by fragments and spheres, predominantly blue and colorless. Sand at the study site exhibited two distinct textural types, with variations in grain size distribution and relative density, yet overall porosity and density remained within expected ranges for natural coastal sands. Permeability coefficients aligned with the observed loose state of the sediment. Minor spatial variations in porosity were identified, reflecting natural heterogeneity rather than significant alteration in sediment packing. These results reinforce the importance of integrating geotechnical characteristics with coastal dynamic factors, such as wave action, wind, and sediment transport, to better understand erosion processes affecting dunes, slopes, and beaches. Overall, the results provide valuable insights for the interface between geotechnical engineering and environmental management, supporting strategies for coastal erosion mitigation, biodiversity conservation, and informed planning of emergency interventions.
Data Availability
The data that support the findings of this study are available from the corresponding author upon request.
References
- ABNT - ASSOCIAÇÃO BRASILEIRA DE NORMAS TÉCNICAS. 2014. NBR 12677: Análise química de produtos refratários por fluorescência de raios X (XRF) - Método do corpo de prova fundido.
- ABNT - ASSOCIAÇÃO BRASILEIRA DE NORMAS TÉCNICAS. 2016a. NBR 6457: Amostras de solo - Preparação para ensaios de compactação e ensaios de caracterização.
- ABNT - ASSOCIAÇÃO BRASILEIRA DE NORMAS TÉCNICAS. 2016b. NBR 7181: Solo - Análise granulométrica.
- ABNT - ASSOCIAÇÃO BRASILEIRA DE NORMAS TÉCNICAS. 2016c. NBR 9813: Solo - Determinação da massa específica aparente in situ, com emprego de cilindro de cravação. Rio de Janeiro, .
- ABNT - ASSOCIAÇÃO BRASILEIRA DE NORMAS TÉCNICAS. 2020a. NBR 16840: Solo - Determinação do índice de vazios máximo de solos não coesivos.
- ABNT - ASSOCIAÇÃO BRASILEIRA DE NORMAS TÉCNICAS. 2020b. NBR 16843: Solo - Determinação do índice de vazios mínimo de solos não coesivos.
- ABNT - ASSOCIAÇÃO BRASILEIRA DE NORMAS TÉCNICAS. 2021. NBR 13292: Solo - Determinação o coeficiente de permeabilidade de solos granulares à carga constante.
- ABNT - ASSOCIAÇÃO BRASILEIRA DE NORMAS TÉCNICAS. 2022. NBR 6502: Rochas e solos.
- ALBUQUERQUE M. 2009. Morfodinâmica da praia do Futuro, Fortaleza-CE: uma síntese de dois anos de estudo. Quaternary and Environmental Geosciences, 1.
- ALLEN S. 2019. Atmospheric transport and deposition of microplastics in a remote mountain catchment. Nature geoscience, 12: 339-344.
- ALMAJED A. 2020. Mitigating wind erosion of sand using biopolymer-assisted EICP technique. Soils and Foundations, 60: 356-371.
- ALOMAR C, ESTARELLAS F & DEUDERO S. 2016. Microplastics in the Mediterranean Sea: Deposition in coastal shallow sediments, spatial variation and preferential grain size. Marine Environmental Research, 115: 1-10.
- ANJOS RM. 2006-05. Radiometric analysis of Quaternary deposits from the southeastern Brazilian coast. Marine Geology, 229: 29-43.
- ARTIOLI G. 2010. Scientific Methods and Cultural Heritage. New York: Oxford University Press.
- ASTM - AMERICAN SOCIETY FOR TESTING AND MATERIALS. 2004. Standard test method for direct shear test of soils under consolidated drained conditions, p. - 3080.
- ASTM - AMERICAN SOCIETY FOR TESTING AND MATERIALS. 2017. Standard Practice for Classification of Soils for Engineering Purposes (Unified Soil Classification System, p. - 2487-17.
- AZEITEIRO RJN. 2017. Critical state-based interpretation of the monotonic behavior of Hostun sand. Journal of Geotechnical and Geoenvironmental Engineering, 143: 04017004.
- BAUER BO. 2009. Aeolian sediment transport on a beach: Surface moisture, wind fetch, and mean transport. Geomorphology, 105: 106-116.
- BESLEY A. 2017-09. A standardized method for sampling and extraction methods for quantifying microplastics in beach sand. Marine Pollution Bulletin, 114: 77-83.
- BRADY NC & WEIL R. 2013. Elementos da natureza e propriedades dos solos. 3 ed. Porto Alegre, RS: Bookman.
- CAMPELO RP. 2021. Oil spills: The invisible impact on the base of tropical marine food webs. Marine Pollution Bulletin , 167: 112281.
- CARVALHO DG & BATISTA NETO AJ. 2016. Microplastic pollution of the beaches of Guanabara Bay, Southeast Brazil. Ocean & Coastal Management, 128: 10-17.
- CHIOSSI NJ. 2013. Geologia de engenharia. 3 ed. São Paulo: Oficina de Textos.
- CHO GC. 2006-05. Particle Shape Effects on Packing Density, Stiffness, and Strength: Natural and Crushed Sands. Journal of Geotechnical and Geoenvironmental Engineering , 132: 591-602.
- CLAESSENS M. 2011. Occurrence and distribution of microplastics in marine sediments along the Belgian coast. Marine Pollution Bulletin , 62: 2199-2204.
- COSTA RC. 2020. Ensaios de Caracterização e Permeabilidade na Areia da Praia de Ipanema, RJ.
- CRAIG R. 2013. F: Mecânica dos solos, Rio de Janeiro.
- CÂMARA SF. 2021. Socioeconomic vulnerability of communities on the Brazilian coast to the largest oil spill (2019-2020) in tropical oceans. Ocean & Coastal Management , 202: 105506.
- DAS B. 2017. Fundamentos de engenharia geotécnica. 8 ed. São Paulo, Cengage Learning.
- DEKIFF JH. 2014. Occurrence and spatial distribution of microplastics in sediments from Norderney. Environmental Pollution, 186: 248-256.
- DIAS CRR & ALVES AML. 2009-10. Geotechnical properties of the Cassino Beach mud. Continental Shelf Research, 29: 589-596.
- DNER - DEPARTAMENTO NACIONAL DE ESTRADAS DE RODAGEM. 1994a. DNER-ME 041/94: Solos - preparação de amostras para ensaios de caracterização. Brasília.
- DNER - DEPARTAMENTO NACIONAL DE ESTRADAS DE RODAGEM. 1994b. DNER - ME 093/94: Solos - determinação da densidade real. Brasília.
- DNIT - DEPARTAMENTO NACIONAL DE TRANSPORTES. 2020. DNIT 432/2020 - ME: Agregados - Determinação das propriedades de forma por meio do Processamento Digital de Imagens (PDI) - Método de ensaio. Brasília.
- DRIEDGER AGJ. 2015. Plastic debris in the Laurentian Great Lakes: A review. Journal of Great Lakes Research, 41: 9-19.
- EO S. 2019. Spatiotemporal distribution and annual load of microplastics in the Nakdong River, South Korea. Water Research, 160: 228-237.
- ERIKSSON C & BURTON H. 2003-09. Origins and Biological Accumulation of Small Plastic Particles in Fur Seals from Macquarie Island. AMBIO: A Journal of the Human Environment, 32: 380-384.
- FERNANDES MDM. 2016. Mecânica dos solos: conceitos e princípios fundamentais. São Paulo: Oficina de Textos .
- GOLDBACH R. 2016. Caracterização geotécnica da areia da Praia de Copacabana a partir de ensaios de campo.
- GUIA JELGH. 2018. Influência da granulometria no comportamento de solos arenosos.
- HIDALGO-RUZ V. 2012-02a. Microplastics in the Marine Environment: A Review of the Methods Used for Identification and Quantification. Environmental Science & Technology, 46: 3060-3075.
- HIDALGO-RUZ V. 2012-02b. Microplastics in the Marine Environment: A Review of the Methods Used for Identification and Quantification. Environmental Science & Technology , 46: 3060-3075.
-
IBGE - INSTITUTO BRASILEIRO DE GEOGRAFIA E ESTATÍSTICA. 2023. Panorama de Fortaleza, Ceará. Available at: https://cidades.ibge.gov.br/brasil/ce/fortaleza/panorama
» https://cidades.ibge.gov.br/brasil/ce/fortaleza/panorama - IBIAPINA DS. 2018. Proposição de um Sistema de Classificação das Propriedades de Forma de Agregados Caracterizados com o Uso do Processamento Digital de Imagens para a Seleção de Materiais Brasileiros.
-
JAMOVI. Version 2.3. The Jamovi Project. Available at: https://www.jamovi.org
» https://www.jamovi.org - KAJIHARA N. 2008. Effects of saturation level of sand substrate on burrowing ability of gammaridean amphipod Haustorioides japonicus. Fish Eng, 45: 151-156.
- KARTHIK R. 2018. Microplastics along the beaches of southeast coast of India. Science of The Total Environment, 645: 1388-1399.
- KOLBUSZEWSKI JJ. 1948. An experimental study of the maximum and minimum porosities of sands. In: Proceedings of the second international conference on soil mechanics and foundation engineering. p. 158-165.
- LANZANO G. 2016. Experimental assessment of the stress-strain behaviour of Leighton Buzzard sand for the calibration of a constitutive model. Geotechnical and Geological Engineering, 34: 991-1012.
- LARSON R. 2010. Estatística aplicada. 4 ed. São Paulo: Pearson Prentice Hall.
- LEMOS CC, FERREIRA MA & ARAÚJO RGB. 2002. A sustentabilidade ambiental da Praia do Futuro, em Fortaleza-Ceará, no desenvolvimento da atividade turística. Revista do Centro de Ciências Administrativas, 8: 125-130.
- LIMA MS. 2017. Lazer e turismo em Fortaleza/CE: o consumo e a arrecadação tributária nas barracas da Praia do Futuro.
- LIU K. 2020-07. An experimental study of mitigating coastal sand dune erosion by microbial-and enzymatic-induced carbonate precipitation. Acta Geotechnica, 16: 467-480.
- LOTS FAE. 2017. A large-scale investigation of microplastic contamination: Abundance and characteristics of microplastics in European beach sediment. Marine Pollution Bulletin , 123: 219-226.
- MAGINI C. 2007. Avaliação ambiental da praia do Futuro, município de Fortaleza-Ceará. Revista de Geologia, 20: 91-98.
- MARTINZ JP, ANJOS SJG & SOHN APL. 2022. Determinantes da competitividade em destinos turísticos: um estudo sobre a cidade de Fortaleza. Revista de Turismo Contemporâneo, 10.
- MASURA J. 2015-07. Laboratory Methods for the Analysis of Microplastics in the Marine Environment: recommendations for quantifying synthetic particles in waters and sediments. National Oceanicand Atmospheric Administration - NOAA, .
-
MEIO AMBIENTE SEMACEE. 2022. Resultados do Plano Plurianual - PPA. Available at: https://www.semace.ce.gov.br/wp-content/uploads/sites/46/2022/04/RESULTADOS_PPA.pdf
» https://www.semace.ce.gov.br/wp-content/uploads/sites/46/2022/04/RESULTADOS_PPA.pdf - MENGATTO MF & NAGAI RH. 2022. A first assessment of microplastic abundance in sandy beach sediments of the Paranaguá Estuarine Complex, South Brazil (RAMSAR site. Marine Pollution Bulletin , 177: 113530.
-
MICROPLASTICS JRC. 2017. Focus on Food and Health European Union, Joint Research Centre (JRC. Available at: http://publications.jrc.ec.europa.eu/repository/bitstream/JRC110629/jrc110629_final.pdf
» http://publications.jrc.ec.europa.eu/repository/bitstream/JRC110629/jrc110629_final.pdf - MIFTAH A. 2022-12. Erodibility improvement and scour mitigation of beach sand by enzymatic induced carbonate precipitation. Geomechanics for Energy and the Environment, 32.
- MINISTÉRIO DO MEIO AMBIENTE. 2007. Especificações e normas técnicas para elaboração de cartas de sensibilidade ambiental para derramamentos de óleo.
- MIURA S & TOKI S. 1982. A sample preparation method and its effect on static and cyclic deformation-strength properties of sand. Soils and foundations, 22: 61-77.
- MOORE CJ. 2008-10. Synthetic polymers in the marine environment: A rapidly increasing, long-term threat. Environmental Research, 108: 131-139.
- MORAIS JOD. 1980. Aspects of Coastal Environmental Geology of the Municipality of Fortaleza (State of Ceará.
- NUNES BD, SOARES MO & MONT’ALVERNE TCF. 2020. Rethinking the environmental quality of Brazilian beaches: The incidence of microplastics as an indicator for sea water and sand quality. California Western International Law Journal, 51: 133.
- NUNES BZ. 2023. Marine Protected Areas Affected by the most extensive Oil Spill on the Southwestern Atlantic coast. Ocean and Coastal Research, 71: 23028.
- NUNES VP. 2014. Ensaios de Caracterização Geotécnica da Areia da Praia de Itaipuaçu.
- OLIVEIRA EB. 2016. Variações da permeabilidade ao óleo em praias arenosas do sistema Patos Guaíba, RS, Brasil.
- OLIVEIRA NETO BM. 2016. A influência da litologia e das formas de relevo nos solos do entorno de um reservatório de água situado no município de Pau dos Ferros-RN. In: 2016. Paper presented at the 1st International Congress on Semi-Arid Diversity. Campina Grande.
- PAGANI RN, KOVALESKI JL & RESENDE LM. 2015-12-12. Methodi Ordinatio: a proposed methodology to select and rank relevant scientific papers encompassing the impact factor, number of citation, and year of publication. Scientometrics, 105: 2109-2135.
- PARK J & SANTAMARINA JC. 2017-08. Revised Soil Classification System for Coarse-Fine Mixtures. Journal of Geotechnical and Geoenvironmental Engineering , 143.
- PEREIRA PS & CALLIARI LJ. 2005. Permeabilidade das praias oceânicas do Rio Grande do Sul (RS) em relação a eventuais derrames de óleo. In: Congresso Brasileiro de P&D em Petróleo e Gás.
- PINHEIRO LM. 2019. Do beachrocks affect microplastic deposition on the strandline of sandy beaches? Marine pollution bulletin, 141: 569-572.
- PLACYK JS & HARRINGTON BA. 2004. Prey abundance and habitat use by migratory shorebirds at coastal stopover sites in Connecticut. Journal of Field Ornithology, 75: 223-231.
- POLIDO UF. 2020. Areias Litorâneas da Grande Vitória-ES.
-
PREFEITURA DE FORTALEZA. 2023. Prefeitura de Fortaleza decreta Praia do Futuro como área de turismo sustentável. Site da Prefeitura de Fortaleza. Available at: Available at: https://www.fortaleza.ce.gov.br/noticias/prefeitura-de-fortaleza-decreta-praia-do-futuro-como-area-de-turismo-sustentavel access: 24 set. 2023.
» https://www.fortaleza.ce.gov.br/noticias/prefeitura-de-fortaleza-decreta-praia-do-futuro-como-area-de-turismo-sustentavel - RATTON RB & SAYÃO ASFJ. 1994. Ensaios triaxiais em areias saturadas. In: X COBRAMSEF - Congresso Brasileiro de Mecânica dos Solos e Engenharia de Fundações, ABMS, Foz do Iguaçu, vol. v.2. p. 451-458.
- ROMÁN-SIERRA J, MUÑOZ-PEREZ JJ & NAVARRO-PONS M. 2014. Beach nourishment effects on sand porosity variability. Coastal Engineering, 83: 221-232.
- SASSA S. 2014. Role of suction in sandy beach habitats and the distributions of three amphipod and isopod species. Journal of sea research, 85: 336-342.
- SHAHSAVARI MH & MAHMOOD S. 2022-08. An Experimental Insight into the Influence of Sand Grain Size Distribution on the Petrophysical and Geomechanical Properties of Artificially Made Sandstones. Journal of Petroleum Science and Engineering, 215: 110632.
- SHERMAN DJ & HOTTA S. 1990. Aeolian sediment transport: theory and measurement. Coastal Dunes: form and process, 17: 37.
- SHIM WJ. 2016. Identification and quantification of microplastics using Nile Red staining. Marine Pollution Bulletin , 113: 469-476.
- SILVA EF. 2022. Evaluation of microplastic and marine debris on the beaches of Niterói Oceanic Region, Rio De Janeiro. Brazil. Marine Pollution Bulletin , 175: 113161.
- SIMÕES FB. 2015. Caracterização geotécnica da areia da praia de Ipanema.
- SOARES BR. 2021. Ensaios de Permeabilidade de Laboratório na Areia da Praia de Ipanema e em uma Amostra de Microesferas de Vidro.
- STOLTE A. 2015-07. Microplastic concentrations in beach sediments along the German Baltic coast. Marine Pollution Bulletin , 99: 216-229.
- SUZUKI K & YAMADA T. 2006. Double strain softening and diagonally crossing shear bands of sand in drained triaxial tests. Int. Journal of Geomechanics, 6: 440-446.
- THOMPSON RC. 2004-05. Lost at sea: where is all the plastic?. vol. 304. New York: Science. 838 pp.
- TORRES-BEJARANO F. 2018. Effects of beach tourists on bathing water and sand quality at Puerto Velero, Colombia.
- TSANG YY. 2017. Microplastic pollution in the marine waters and sediments of Hong Kong. Marine Pollution Bulletin , 115: 20-28.
- TUIJNMAN JT. 2020. Consequences of a storm surge for aeolian sand transport on a low-gradient beach. Journal of Marine Science and Engineering, 8: 584.
- USACE - UNITED STATES ARMY CORPS OF ENGINEERS. 1110. Coastal engineering manual. Engineer Manual. vol. v. 2-1100 pp.
- VASCONCELOS FP & MIOSSEC A. 2006. Contribution to integrated coastal zone management (ICZM) as a solution to coastal environmental problems of Fortaleza (NE-Brazil. Journal of Coastal Research, p. 1711-1715.
- VEGTER A. 2014-10-17. Global research priorities to mitigate plastic pollution impacts on marine wildlife. Endangered Species Research, 25: 225-247.
- VISCONTI G. 2022. Hatching Success of Caretta caretta on a Mediterranean Volcanic Beach: Impacts from Environmental Parameters and Substrate Composition. Journal of Coastal Research , 38: 603-612.
- WANG J. 2017. Microplastics in the surface sediments from the Beijiang River littoral zone: Composition, abundance, surface textures and interaction with heavy metals. Chemosphere, 171: 248-258.
- WANG J. 2019. High levels of microplastic pollution in the sediments and benthic organisms of the South Yellow Sea, China. Science of The Total Environment , 651: 1661-1669.
- WESSEL CC. 2016. Abundance and characteristics of microplastics in beach sediments: Insights into microplastic accumulation in northern Gulf of Mexico estuaries. Marine Pollution Bulletin , 109: 178-183.
- WIGGS GFS, BAIRD AJ & ATHERTON RJ. 2004. The dynamic effects of moisture on the entrainment and transport of sand by wind. Geomorphology, 59: 13-30.
- WRIGHT SL, THOMPSON RC & GALLOWAY TS. 2013-07. The physical impacts of microplastics on marine organisms: A review. Environmental Pollution , 178: 483-492.
- YU X. 2016-05. Occurrence of microplastics in the beach sand of the Chinese inner sea: the Bohai Sea. Environmental Pollution , 214: 722-730.
- ZHENG W. 2021-07. Quantifying the Influence of Grain Morphology on Sand Hydraulic Conductivity: A Detailed Pore-Scale Study. Comput. Geotech, 135: 104147.
- ZHU L. 2018. Microplastic pollution in North Yellow Sea, China: Observations on occurrence, distribution and identification. Science of The Total Environment , 636: 20-29.
- ZOBKOV M & ESIUKOVA E. 2017. Microplastics in Baltic bottom sediments: Quantification procedures and first results. Marine Pollution Bulletin , 114: 724-732.