 Qualitative and quantitative study of intermolecular weak interactions for benzoic acid and anisic acid using terahertz spectroscopy combined with DFT
Abstract
This article employs terahertz time-domain spectroscopy (THz-TDS) to measure the terahertz absorption spectra of benzoic acid and anisic acid within the frequency range of 0.6-2.4 THz. Simultaneously, under the framework of density functional theory (DFT), the B3LYP-D3 method and the M06-2X method were utilized to conduct theoretical calculations on these two substances. Following a comparative analysis, it was found that the calculated results obtained through the B3LYP-D3 method exhibited a higher degree of consistency with the experimental results. To elucidate the formation mechanism of the absorption peaks in detail, the potential energy distribution (PED) method was employed to assign the corresponding vibration modes. The assignment results reveal that the characteristic peaks in the terahertz spectra of these two substances primarily stem from bond angle bending and dihedral angle torsion. Moreover, a qualitative and quantitative analysis of intermolecular weak interactions was carried out using the interaction region indicator (IRI), energy decomposition analysis based on force-field (EDA-FF), and in conjunction with the electrostatic potential (ESP) methods. This study reveals the intrinsic relationship between terahertz spectral differences and weak intermolecular interactions, providing important insights for a deeper understanding of the internal structural characteristics and potential applications of material molecules.
Keywords:
THz-TDS; DFT; vibration modes; weak interactions; hydrogen bond.
INTRODUCTION
Benzoic acid, acknowledged as the most fundamental aromatic acid, has a carboxyl group directly bonded to the carbon framework of the benzene ring. Owing to its efficacy in inhibiting the growth of various microorganisms, including fungi, bacteria, and molds, this compound is widely utilized in pharmaceutical formulations and preservation systems. The simplicity of its synthesis process and the high yields achieved contribute to its extensive industrial adoption.1 Derivatives of sodium benzoate exhibit bacteriostatic properties, making them suitable for a diverse range of applications, spanning from food preservation (such as in jams and toothpaste) to industrial processes like latex treatment and textile dyeing. Moreover, these compounds play crucial roles in the manufacturing of synthetic polymers, coating technologies, and the tobacco processing sector.2,3 Anisic acid, structurally similar to benzoic acid, retains the core aromatic ring and carboxyl functionality while introducing an additional methoxy substituent onto the benzene ring.4 The molecular differences between these two compounds result in distinct physicochemical properties and specialized industrial applications. Anisic acid finds particular utility not only as a raw material but also serves as a precursor for flavoring agents and sodium anisate-based antimicrobial agents. It is also a key component in the synthesis of cognitive enhancers like aniracetam, cardiac rhythm stabilizers such as amiodarone, and melanogenesis inhibitors that target tyrosinase activity. This versatile compound is further employed in personal care products, where it contributes its aromatic qualities and enhances formulation stability. The widespread use of benzoic acid derivatives, especially anisic acid, across nutritional science, industrial chemistry, and medicinal development highlights the critical importance of investigating their molecular configurations and developing efficient analytical techniques.5,6
Terahertz time-domain spectroscopy (THz-TDS) relies on femtosecond laser systems to capture the unique spectral fingerprints of materials within the terahertz (THz) range. During THz wave-based sample analysis, molecular vibrations or rotations that resonate with the THz frequency induce characteristic absorption phenomena, generating distinctive spectral signatures.7 Leveraging the exceptional properties of THz radiation, this methodology has found applications in various fields, including biomolecular analysis,8,9 food chemistry research,10 security screening for illicit substances,11 and pharmaceutical development.12 Recent advancements have combined experimental THz spectroscopy with computational modeling to investigate the properties of benzoic acid, yielding significant progress.13-15 However, current research predominantly focuses on theoretical investigations of monomeric or dimeric benzoic acid configurations, neglecting the influence of dispersion forces in molecular interactions. Experimental investigations into the intermolecular dynamics of anisic acid within theoretical modeling frameworks are scarce, with terahertz spectral analyses notably absent from the existing literature.
Based on this, this study uses THz-TDS to measure the terahertz absorption curves of benzoic acid and its derivative anisic acid, while potential energy distribution calculation is used to explain the spectral characteristics. In addition, through qualitative and quantitative analysis of weak intermolecular interactions, the intrinsic mechanism between terahertz spectral characteristic peaks and weak interactions, especially hydrogen bonds, was elucidated. This study combines terahertz spectroscopy and quantum chemistry to analyze benzoic acid and anisic acid from different perspectives, studying their structures and optical properties, which is beneficial for identifying structurally similar substances, predicting their physical and chemical properties, and further studying the application value of substances in the future.
METHODOLOGY
Experimental apparatus
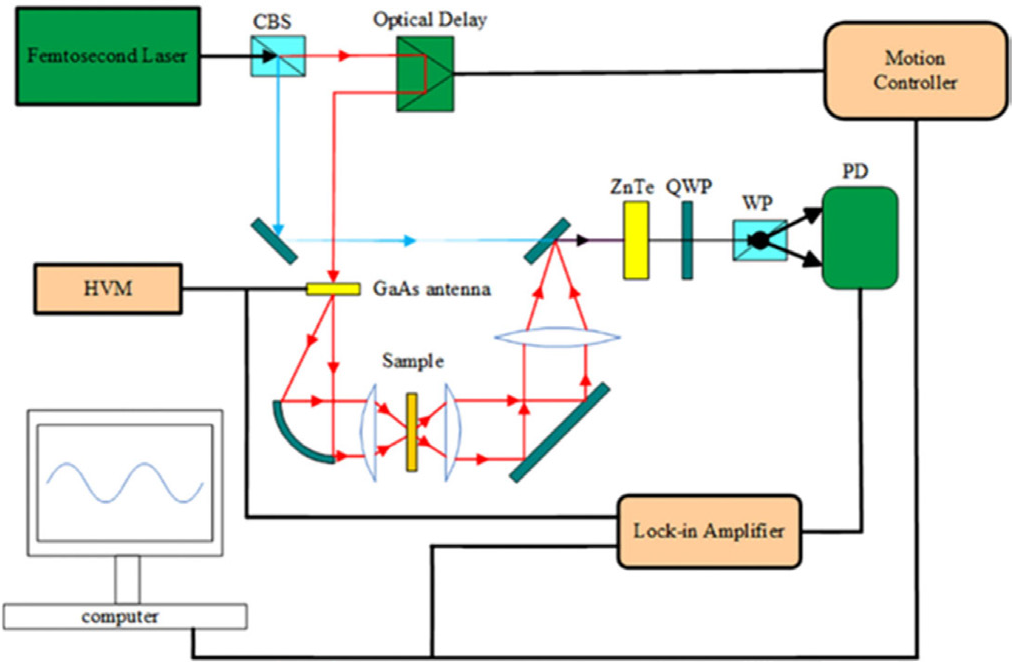
The investigation utilized a time-domain terahertz spectroscopy system (the Z-3 model, manufactured by Zomega Corporation, USA), with its configuration depicted in Figure 1.16,17 This device operates at a repetition rate of 82 MHz, featuring a pulse width of 100 femtoseconds and a central wavelength of 780 nm. The architecture of the system mainly comprises four modules: an ultrashort-pulse fiber laser emitter, a terahertz wave generation unit, a terahertz signal acquisition module, and precision time-delay synchronization components. All tests were carried out under ambient temperature conditions. To mitigate the absorption of terahertz radiation by atmospheric water vapor, the experimental chamber was continuously flushed with dry nitrogen gas. This ensured that the relative humidity levels remained below 2% throughout the measurement process.

Sample preparation
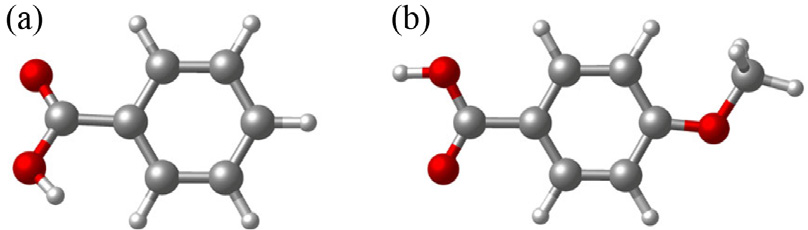
Benzoic acid and anisic acid (with a purity of 98%) were procured from Shanghai Macleans Biochemical Technology Co., Ltd. (Shanghai, China) These chemicals met the requirements for experimental use, eliminating the need for further purification. The molecular configurations of these two compounds are depicted in Figure 2. To prevent any interference from moisture, the samples were subjected to pre-experimental treatment. They were placed in a vacuum drying oven and kept at a constant temperature for about two hours. After dehydration, the materials were mixed with polyethylene powder in a mass ratio of 3:1. This mixture was then mechanically homogenized through mortar grinding. Using an FW-4A tablet press, uniform test specimens were fabricated under a compression pressure of 12 MPa. These specimens had a diameter of 13 mm and a thickness of 1.2 mm.18 To enhance the reliability of the experimental data, triplicate measurements were carried out, and the results were averaged to minimize systematic errors.
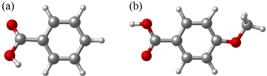
Monomolecular structures of (a) benzoic acid (C7H6O2) and (b) anisic acid (C8H8O3). Atomic elements in gray, white, and red represent carbon, hydrogen, and oxygen atoms, respectively
Given the strong absorption characteristics of water towards terahertz waves, which may directly affect the reliability of spectral measurement data, in order to ensure the accuracy and reproducibility of experimental results, the entire terahertz spectral measurement process was carried out in an orderly manner under strictly controlled environmental conditions. Considering that moisture in the atmosphere can significantly interfere with measurement results, a nitrogen purge system was specifically equipped in the experiment to create a stable dry environment by continuously introducing dry nitrogen into the sample chamber. At the same time, the terahertz optical path remains completely closed throughout the entire process, interior has also been filled with dry nitrogen gas. With dual protection, the relative humidity in the sample chamber has been strictly controlled below 2%, thereby minimizing the absorption of terahertz waves by moisture in the air and providing strong support for the accuracy of experimental data.
Data processing
Optical characterization of materials relies heavily on three crucial metrics: absorbance, absorption coefficient, and refractive index. Researchers can derive these metrics through computational models developed by Duvillaret et al.19 and Dorney et al.20 In practical implementation, the experimental setup transforms the acquired reference and sample signals into frequency domain representations via fast Fourier transform (FFT) processing. The Fresnel formalism provides the theoretical foundation for calculating absorbance A(ω), with the mathematical expression detailed in the work of Hua et al.21
Within the equation, Esam(ω) represents the terahertz amplitude of the sample, Eref(ω) denotes the THz amplitude of the reference, while ω stands for angular frequency. Given that inherent system characteristics and unavoidable environmental conditions could introduce minor noise during experimental measurements, a Gaussian window function was applied to enhance the signal to noise ratio. The processed spectral data within the 0.6-2.4 THz range was then selected for further analytical procedures.
DFT theoretical calculation
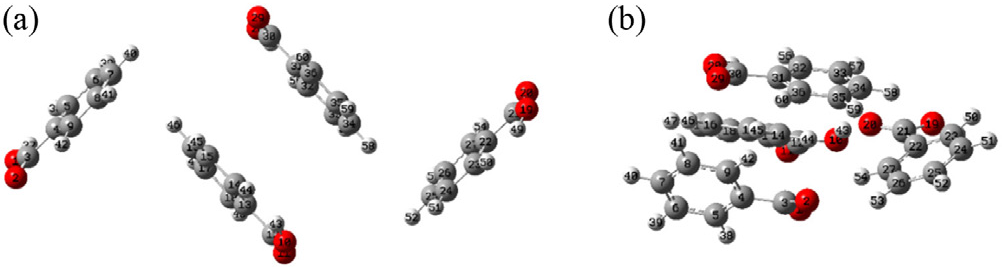
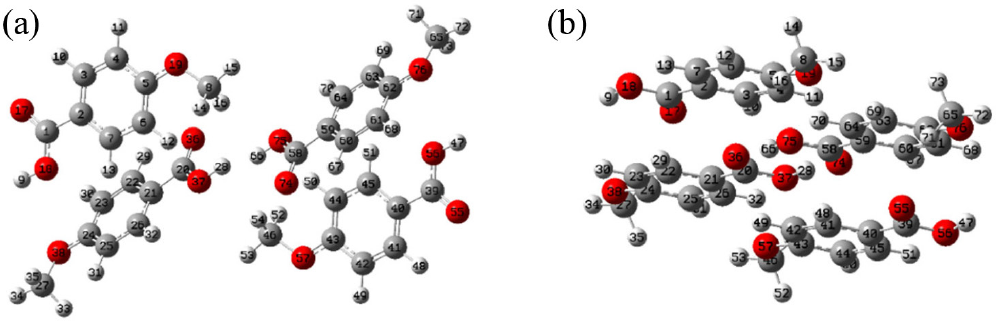
The structural frameworks of benzoic acid and anisic acid were obtained from the Cambridge Crystallographic Data Center (CCDC).22 Each framework corresponds to a crystalline unit that encompasses four molecular entities. In this study, two approaches of density functional theory (DFT) were employed: B3LYP and M06-2X. Both methods utilized the 6-311G** basis set. To improve the accuracy of intermolecular force modeling, the DFT-D3 methodology with Grimme dispersion correction was specifically incorporated into the B3LYP calculations.23 The structural optimizations of the crystalline units were carried out using Gaussian 16 software,24,25 version A.03 (Gaussian, Inc., Wallingford CT). Subsequently, vibrational frequency analyses were performed using the same computational parameters. Further validation demonstrated that there were no imaginary frequencies, which confirmed that energy minimization was successfully achieved during the optimization process, leading to the attainment of stable molecular configurations. The vibrational characteristics and energy profiles of the optimized structures are elaborated in Figures 3 and 4.
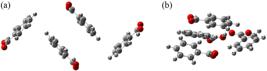
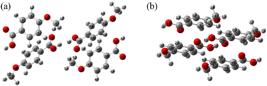
The unit cell configurations of benzoic acid and anisic acid are shown in their respective diagrams. Figures 3a and 4a depict the original molecular arrangements, while Figures 3b and 4b illustrate the geometrically refined configurations. The optimized geometries of the complexes indicate the presence of intermolecular interactions. To reach thermodynamic equilibrium, the constituent molecules underwent dynamic positional adjustments through rotational and translational movements under the influence of intermolecular forces. Detailed mechanistic explanations will be provided in the subsequent sections.
PED method
The potential energy distribution (PED) approach serves as an analytical technique for breaking down vibrational normal modes. This methodology quantifies the relative contribution of molecular groups to specific vibrational patterns through percentage evaluations. Through comparative analysis of these percentages, researchers can more effectively identify the fundamental characteristics of vibrational modes and determine predominant vibration types. The potential energy contribution percentage (PED) can be calculated using the expression:26
where FS is the force constant matrix under internal coordinates, and LS is the eigenvector matrix. PEDki represents the contribution ratio of the potential energy distribution of the group represented by the i-th internal coordinate in the structure, in the k-th (where k = 1, …, N) normal mode.
Interaction region indicator
To effectively characterize the nature, strength distribution, and spatial arrangement of intermolecular interactions in the studied system, the interaction region indicator (IRI) analytical approach was employed. Developed as an enhancement of the conventional reduced density gradient (RDG) technique,27 this methodology was introduced by Lu and Chen28 in 2021. The mathematical expression for the IRI function is formulated as:
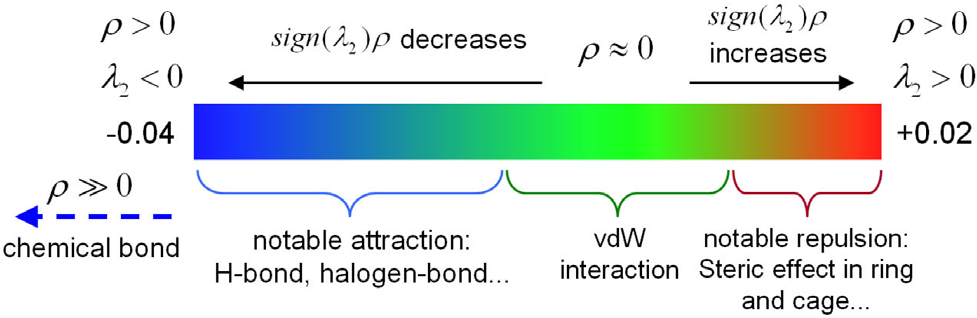
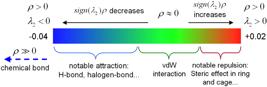
within this equation, ρ(r) represents electron density distribution, ∇ denotes the gradient differential operator, while α serves as a tunable coefficient. The conventional implementation utilizes α = 1.1 as the standard parameter configuration. The term sign(λ2) corresponds to the sign indicator of the second principal eigenvalue derived from the electron density Hessian matrix, providing critical information about interaction types. Through chromatic mapping of both sign(λ2) values and electron density parameters onto IRI iso surfaces, this dual variable visualization scheme enables dynamic presentation of interaction characteristics, as illustrated in Figure 5 with corresponding chemical interpretations.
Energy decomposition analysis based on forcefield
Energy decomposition analysis (EDA) constitutes a critical tool in quantum chemical methodologies, enabling the dissection of total inter-fragment interaction energies into physically interpretable components. This approach facilitates the systematic investigation of interaction mechanisms at the molecular level.29 Non-covalent interactions primarily comprise electrostatic and van der Waals contributions. The electrostatic term between two atomic sites can be quantitatively expressed as:
in this formula, A and B represent the atomic labels, q denotes the atomic charge, and r is the distance between the atoms. The van der Waals interaction can be divided into repulsive and dispersive components, which are calculated by the following formulas:
where, ε represents the depth of the van der Waals potential well, and R0 is the non-bonding distance between the atoms. A and B represent the atomic labels, and r is the distance between the atoms.
Electrostatic potential
The inherent manifestation of hydrogen bonds is the electrostatic attraction between permanent dipoles, and almost all hydrogen bonds, halogen bonds, and dihydrogen bonds are dominated by electrostatic interactions. The electrostatic potential on the molecular surface can be used to intuitively estimate the current electrostatic interactions between molecules and other molecules. At the same time, the binding mode and strength, reactivity, and charge distribution of hydrogen bonds can be predicted and explained. Therefore, the distribution of electrostatic potential energy is a valuable tool for studying intermolecular interactions. The electrostatic potential at a point in the space surrounding a molecule refers to the work done to move a unit positive charge from the zero potential energy surface to that point, expressed as follows:
in the equation, Zi is the charge on the nucleus i located at the ri position, and the parameter ρ(r’) represents the total electron density. The positive or negative value of VS(r) indicates that the current position is dominated by nuclear or electronic charges.
RESULTS AND DISCUSSION
Experimental and theoretical simulated spectra analysis
Figure 6 displays the temporal terahertz (THz) spectral profiles obtained from both atmospheric reference measurements and specimen measurements. In this figure, the dashed curves represent the baseline signals, while the continuous traces illustrate the material responses. This section focuses on evaluating the theoretical time-domain spectra, which are generated based on the molecular configurations optimized using the B3LYP-D3 and M06-2X methods, against the empirical observations. By performing Fourier transformation on the temporal waveforms to convert them into spectral representations, the comparative frequency domain analyses are visually presented in Figures 7 and 8.

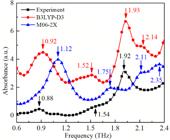
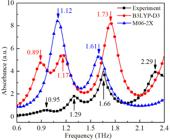
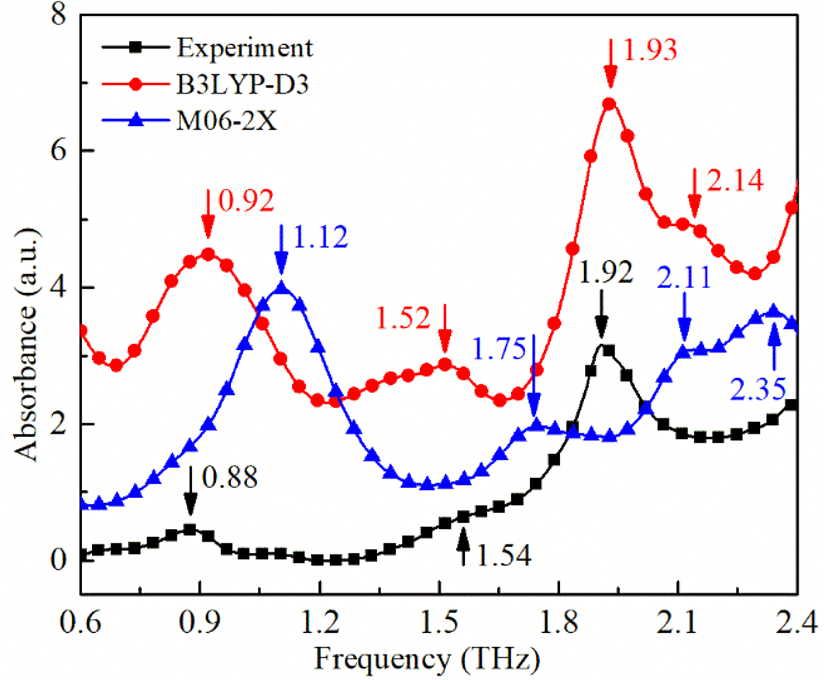
Figure 7 unveils three distinct resonance features in the terahertz (THz) spectrum of benzoic acid in the range of 0.6 2.4 THz. The most intense absorption peak is observed at 1.92 THz, with relatively weaker signals appearing at 0.88 and 1.54 THz on either side. Computational modeling reveals significant differences between the functional approaches of B3LYP and M06-2X. The structure optimized using the B3LYP/D3 method predicts four characteristic peaks. The peak at 1.93 THz shows a strong correlation with the experimental observations. The secondary resonances at 0.92 and 1.52 THz also align sequentially with the adjacent experimental features. In contrast, the M06-2X calculations exhibit substantial spectral displacements, generating four absorption signatures at 1.12, 1.75, 2.11, and 2.35 THz, respectively. This functional approach fails to reproduce any of the spectral characteristics observed experimentally with sufficient accuracy.
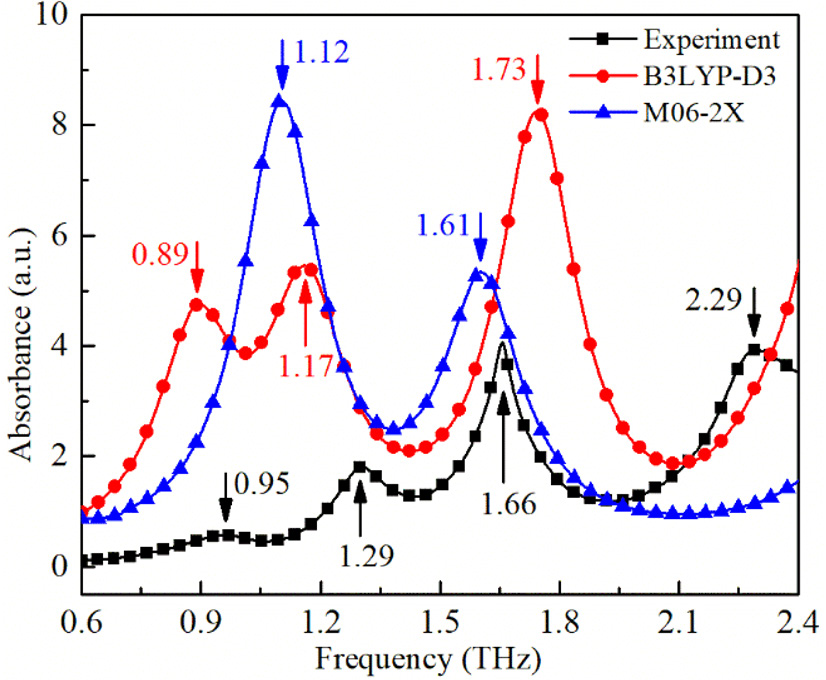
The experimental data aligns well with the principal spectral features. Figure 8 shows that the terahertz spectrum of anisic acid exhibits four distinct absorption bands. Three characteristic frequencies at 0.95, 1.29, and 1.66 THz correspond to the computational predictions of the B3LYP-D3 method at 0.89, 1.17, and 1.73 THz, respectively, although systematic shifts are evident. This positional variance can be attributed to multiple factors. Theoretical simulations use idealized unit cell configurations to approximate crystalline environments, which is in contrast to the experimental measurements conducted on physical crystal specimens. Methodological considerations, such as the constraints of the harmonic approximation, biases in functional selection, and limitations of the basis set, collectively influence the computational accuracy. Notably, the dispersion-corrected B3LYP-D3 methodology shows enhanced concordance with the experimental results compared to the M06-2X calculations. Consequently, subsequent analysis will prioritize the examination of vibrational properties and non-covalent molecular interactions, with a focus on the computational outcomes obtained from the B3LYP method.
Assignments of the vibrational modes
In molecular crystalline systems, low-frequency oscillations in the terahertz (THz) frequency range originate mainly from intermolecular interactions. The unique terahertz absorption signatures of compounds are closely related to the dynamic movements of their molecular subunits. To pinpoint the atomic fragments that contribute to the vibrational characteristics resulting from low-frequency modes in the target crystal, a potential energy distribution (PED) analysis was carried out to examine the absorption characteristics of the material. Table 1 provides a detailed breakdown of the main types of oscillations associated with the THz spectral features, along with the corresponding atomic components involved. These calculations were conducted using the Vibrational Energy Distribution Analysis (VEDA) computational package. At the same time, GaussView software,30 version 6.0.16 (Semichem Inc., USA), was employed to generate visual representations of the molecular motions corresponding to each absorption feature. This allows for a clear visualization of the oscillatory patterns within the molecular framework, as illustrated in the accompanying figures.
Vibrational mode description assigned to each absorption peak of benzoic acid and anisic acid
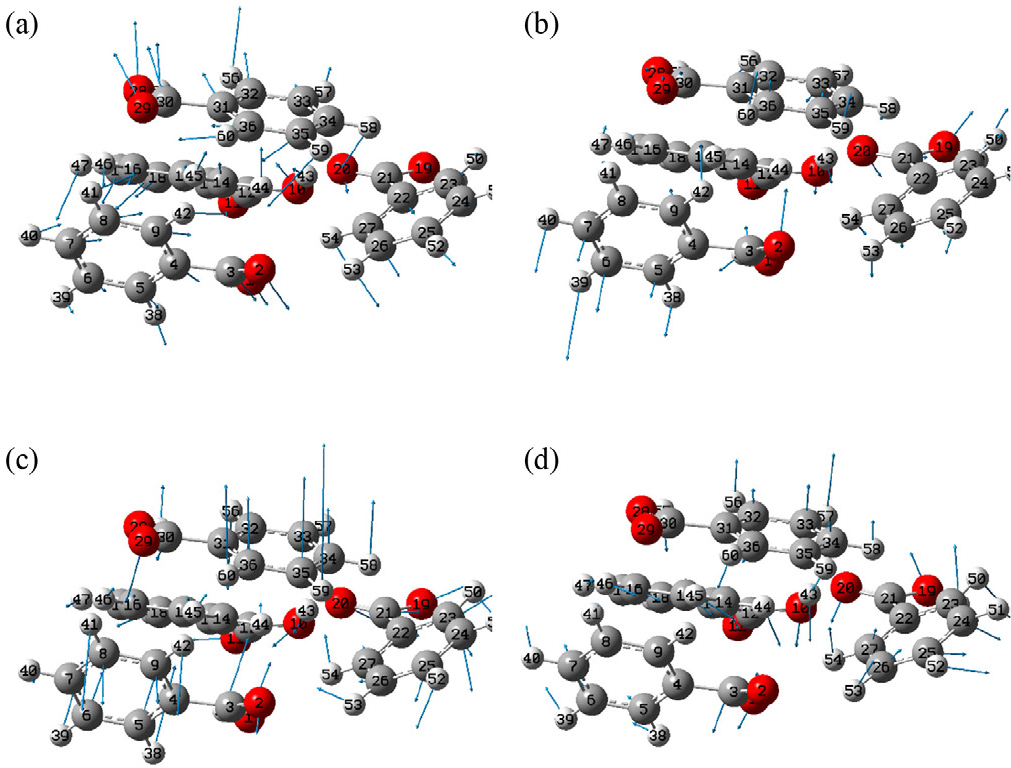
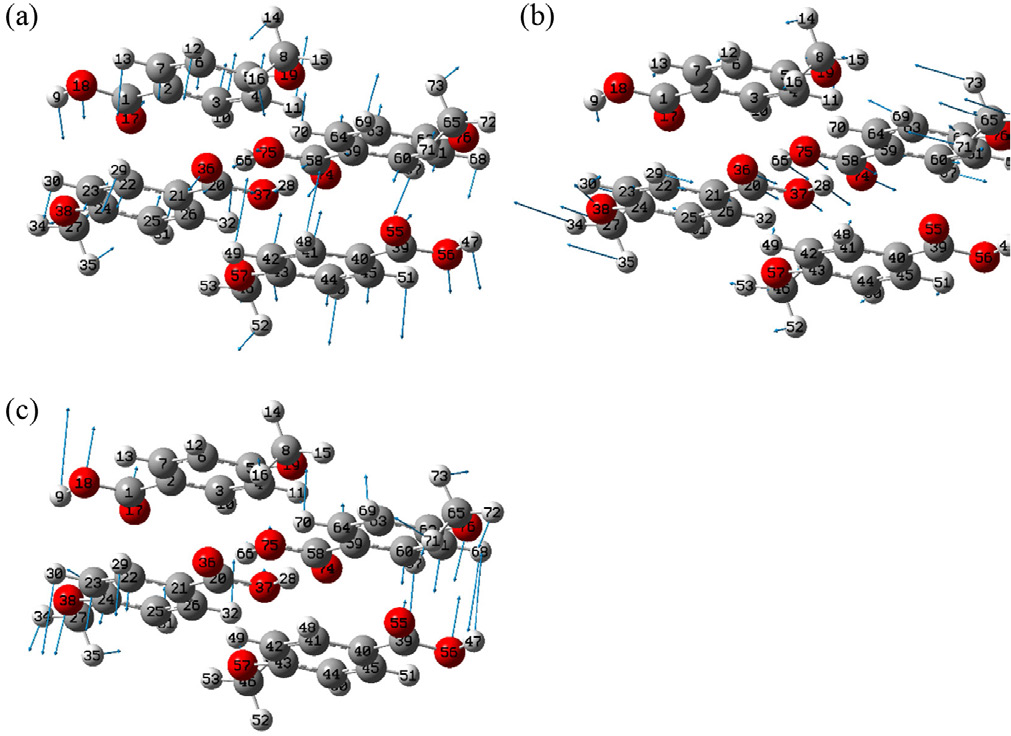
In Figure 9, oxygen, carbon, and hydrogen atoms are represented as red, gray, and white spheres, respectively. The size of the arrows corresponds to the magnitude of the vibrational intensity. Table 1 shows that the main vibration modes of benzoic acid at 0.92 THz are bond angle bending formed by C31C32H45 atoms and dihedral angle torsion formed by C4H45C32C33 and H45C4C5C6. The vibration modes of benzoic acid at 1.52 THz are bond angle bending formed by H43O20C21 atoms. The vibration modes at 1.93 THz mainly involve bond angle bending of the H43O20C21 atoms and the dihedral angle torsion of the C4H45C32C31 atoms located in the plane. While the vibration mode at 2.14 THz mainly involves dihedral angle torsion of the C12O10H43O20 and C27C22C21O20 atoms located in the plane.
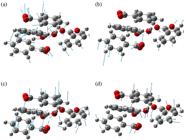
Vibrational modes of benzoic acid at (a) 0.92 THz; (b) 1.52 THz; (c) 1.93 THz; (d) 2.14 THz. The arrow indicates the displacement vectors
As illustrated in Figure 10 and detailed in Table 1, the vibration modes at 0.89 THz mainly involve dihedral angle torsion of the O37H28O74C58 atoms located in the plane, whereas the vibration mode at 1.17 THz mainly involves bond angle bending of the C21C20O37 atoms. The vibration mode at 1.73 THz mainly involves the bond angle bending of the O17H33C27 and O55H71C65 atoms.
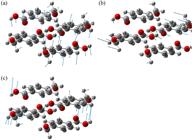
Vibrational modes of anisic acid at (a) 0.89 THz; (b) 1.17 THz; (c) 1.73 THz. The arrow indicates the displacement vectors
In summary, the PED analysis reveals that the main absorption features of both benzoic acid and anisic acid originate from bond angle bending and dihedral angle torsion. Structurally, anisic acid is a para-methoxy-substituted derivative of benzoic acid, in which an aromatic hydrogen atom is replaced by a functional group. The distinct terahertz spectral characteristics and resonance behaviors observed between these two compounds are attributable to the structural variations introduced through functional group substitution. These findings highlight the potential of terahertz spectroscopy as a discriminative tool for distinguishing structurally similar compounds.
Qualitative analysis of intermolecular weak interactions
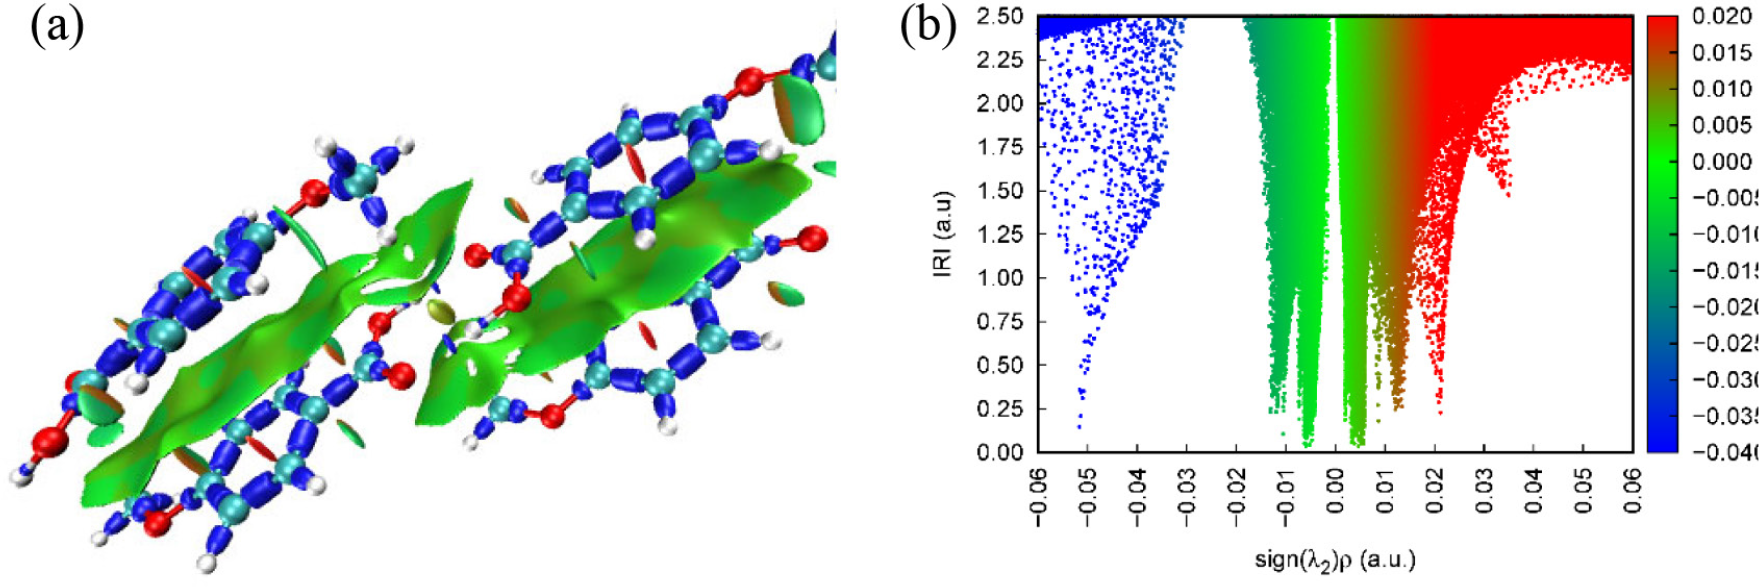
The unique spectral features observed in the low-frequency terahertz (THz) region mainly stem from non-covalent molecular forces. In this study, the independent gradient model (IGM) approach was employed to systematically investigate the weak interactions present in the molecular systems of benzoic acid and anisic acid. For the analytical process, Multiwfn,31 3.8 dev (Beijing Kein Research Center for Natural Sciences, China), a computational chemistry software package, was utilized for quantum chemical calculations and interaction visualization. In terms of structural characterization, iso-surface diagrams were generated using visual molecular dynamics (VMD, version 1.9.3) visualization tools, and comparative scatter plots were created with Gnuplot, version 5.4 (Williams, T.; Kelley, C.; USA, 2023). The detailed results are presented in Figures 11 and 12. The adopted color-coding scheme assigns cyan to carbon atoms, white to hydrogen atoms, and red to oxygen atoms. Structural analyses of both compounds revealed extensive green iso-surface regions (Figures 11a and 12a). According to the chemical interaction reference chart (Figure 5) established in sub section “Assignments of the vibrational modes”, these green regions correspond to van der Waals interactions. This suggests that, when considering their quantitative contributions, van der Waals forces predominantly govern the weak molecular interactions observed in the systems of benzoic acid and anisic acid. A detailed analysis reveals distinct blue iso-surfaces within the molecular structures, along with localized greenish brown surfaces at specific regions. These characteristic surfaces maintain spatial independence and signify hydrogen bonding patterns. Specifically, the blue regions correspond to intermolecular O-H…O interactions, while the greenish brown areas represent intramolecular C-H…O connections. Additionally, a prominent red iso-surface emerges at the core region of the benzene ring, which is a result of steric repulsion effects.

IRI analysis results of benzoic acid: (a) three-dimensional iso-surfaces and (b) two-dimensional scatter plots
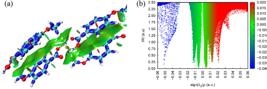
IRI analysis results of anisic acid: (a) three-dimensional iso-surfaces and (b) two-dimensional scatter plots
In the scatter diagrams, van der Waals interactions are manifested as peaks with sign(λ2)ρ values clustered between -0.01 and +0.01. Distinct green and brown peaks appear at approximately -0.012 and +0.012, respectively, which are indicative of C-H…O hydrogen bonding interactions within the molecular structures. Figure 11b reveals a light blue peak centered around -0.03 on the sign(λ2)ρ scale, which is characteristic of O-H…O hydrogen bonding between molecules. A comparative analysis with Figure 12b shows that, under equivalent intermolecular O…H-O hydrogen bonding conditions, the peak position shifts to approximately -0.05 on the sign(λ2)ρ scale. These observations establish a direct correlation between the distinctive THz spectral absorption features of benzoic acid and anisic acid and their respective intermolecular hydrogen bonding networks.
Quantitative analysis of intermolecular weak interactions
This article employs a combined approach of energy decomposition analysis based on force fields (EDA-FF) and electrostatic potential (ESP) methods to quantitatively analyze the intermolecular weak interactions within the systems of benzoic acid and anisic acid. This method can break down the total interaction energy between molecular fragments into physically meaningful energy components, primarily including electrostatic, repulsive, and dispersion effects. The unit cell structures of both substances contain four molecules each, with each molecule treated as a distinct fragment. As presented in Tables 2 and 3, the types of intermolecular weak interactions within the internal structures of the two substances, along with the energy contributions between each fragment, are clearly shown. From these tables, it is evident that the dispersion effect makes a substantial contribution to the binding energy in both the benzoic acid and anisic acid systems. The two fragments with higher dispersion energy are accompanied by strong mutual repulsion, both of which fall under the category of van der Waals interactions. The dispersion effect among the various fragments of benzoic acid is relatively evenly distributed. In contrast, the dispersion effect among the fragments of anisic acid is more concentrated, mainly occurring between Frag 1-Frag 2 and Frag 3-Frag 4. The electrostatic interaction energy between Frag 2 and Frag 3 of benzoic acid is -28.77 kJ mol-1, primarily due to the presence of hydrogen bonds between these two fragments. In other segments, the contribution of electrostatic interaction energy is relatively low. Frag 2 and Frag 3 will be used as reference fragments for the graphical analysis of the electrostatic potential of benzoic acid in the following section. The electrostatic interactions between the fragments of anisic acid are relatively concentrated, mainly taking place between Frag 2 and Frag 4, with an electrostatic interaction energy of -75.37 kJ mol-1. This is mainly attributed to the existence of two pairs of hydrogen bonds between these two fragments. Therefore, Frag 2 and Frag 4 will serve as reference fragments for the graphical analysis of the electrostatic potential. Similarly, for the analysis of the electrostatic potential distribution of anisic acid, Frag 2 and Frag 4, which exhibit the strongest electrostatic potential, are selected.
The EDA-FF analysis results for benzoic acid and anisic acid reveal that these two substances have distinct characteristics in the distribution of weak intermolecular interactions. The electrostatic, dispersive, and repulsive interactions between molecules are closely related to the arrangement of each molecular fragment. Moreover, the spatial arrangement of molecules depends on the molecular skeleton and the characteristic functional groups that constitute the molecule. Meanwhile, EDA-FF has confirmed that intermolecular hydrogen bonds directly participate in the formation of certain vibrational modes, which contribute to the generation of characteristic absorption peaks during molecular vibrations.
The molecular surface electrostatic potential distributions of single molecules of benzoic acid and anisic acid, as well as the two fragments with the strongest electrostatic interactions, were visualized by coloring the electron density iso-surface. The results are presented in Figure 13. The color of the iso-surface transitions from blue to white to red according to the range of electrostatic values. Areas that are redder indicate more positive electrostatic potential values and are more likely to combine with negatively charged electrons. Conversely, bluer areas represent more negative electrostatic potential values. The blue ball marks the minimum point on the molecular surface, while the orange ball indicates the maximum point. Figure 13a illustrates the electrostatic potential distribution characteristics of a single benzoic acid molecule. The positive region of the electrostatic potential is mainly concentrated around the C-H bond, with a maximum value of 53.43 kcal mol-1. The negative region of the electrostatic potential is located on the surface of the two oxygen atoms in the carboxyl group, with a minimum value of -41.04 kcal mol-1. As shown in Figure 13c, the characteristics of the electrostatic potential distribution of a single molecule of anisic acid are presented. The negative part of the electrostatic potential of anisic acid surrounds the two oxygen atoms of the carboxyl group, with a minimum value of -36.56 kcal mol-1. The positive region of the electrostatic potential appears around the C-H bond, with a maximum value of 44.75 kcal mol-1. The positions where the maximum and minimum values of the electrostatic potential occur for these two substances are essentially the same.

Electrostatic potential distribution diagrams: (a) benzoic acid monomer; (b) benzoic acid dimer; (c) anisic acid monomer; (d) anisic acid dimer
It should be noted that in this study, we calculated the ESP and EDA-FF values. The ESP value reflects the distribution of the surface electrostatic potential of molecules, and its unit is kcal mol-1; the EDA-FF value is used to evaluate the intermolecular interaction energy, measured in kJ mol-1. For the convenience of readers under different unit systems, we would like to supplement the conversion relationship between the two: 1 kcal mol-1 is equal to 4.184 kJ mol-1.
Figure 13b displays the electrostatic potential distribution characteristics of the benzoic acid dimer. It is clearly observable from the figure that after the formation of the dimer, there is significant penetration of the van der Waals surfaces of the two benzoic acid molecules. The area with positive electrostatic potential penetrates the area with negative electrostatic potential. In other words, the minimum position of the electrostatic potential of a benzoic acid molecule attracts another molecule to combine with its maximum position of electrostatic potential, forming a hydrogen bond. Therefore, the maximum and minimum points in the electrostatic potential distribution diagram of a single molecule are the donor and acceptor sites of the hydrogen bond during the formation of the spatial configuration of the cluster model. This indicates that the essence of the hydrogen bond interaction between benzoic acid molecules is mainly due to electrostatic attraction. Figure 13d depicts the electrostatic potential distribution of two anisic acid molecules. The blue and red regions permeate each other, reflecting the complementarity of electrostatic potential and the nature of hydrogen bonding interactions based on electrostatic attraction.
CONCLUSIONS
This study successfully elucidated the intrinsic relationship between the terahertz spectral characteristics and weak intermolecular interactions in benzoic acid and anisic acid through the combination of THz-TDS experiments and DFT calculations. Compared with M06-2X, the B3LYP-D3 method has higher accuracy in reproducing experimental spectral features, especially in capturing the vibration modes induced by hydrogen bonding. PED analysis shows that bond angle bending and dihedral angle twisting dominate the low-frequency THz absorption peak. In addition, IRI, EDA-FF, and ESP studies have confirmed that electrostatic attraction is the core mechanism driving hydrogen bond formation. The minimum electrostatic potential on carboxyl oxygen atoms and the maximum potential on aromatic C-H bonds act as hydrogen bond donor and acceptor sites, directly related to the intermolecular interaction regions recognized by IRI. These findings not only provide a theoretical basis for distinguishing structurally similar aromatic compounds, but also offer valuable insights for designing molecular materials with customized intermolecular interaction characteristics.
SUPPLEMENTARY MATERIAL
Complementary material for this work is available at http://quimicanova.sbq.org.br/, as a file, with free access.
ACKNOWLEDGMENTS
This work is funded by the National Natural Science Foundation of China under grant No. 62161005, and is partly supported by the Guangxi Middle-aged and Young Teachers’ Basic Ability Promotion Project (grant No. 2024KY1735), the Guangxi Key Laboratory of Automatic Detecting Technology and Instruments (grant No. YQ24103), and the Guilin Institute of Information Technology Campus-Level Research Projects (grant No. XJ2024098 and XJ202311).
DATA AVAILABILITY STATEMENT
The data supporting the findings of this study are available from the corresponding authors upon reasonable request.
REFERENCES
-
1 Xiao, X.; Sun, S.; Qi, Y.; Hao, S.; Zhang, W.; Qiu, X.; Electrochim. Acta 2023, 470, 143377. [Crossref]
» Crossref -
2 Gabriel, A. A.; Salazar, S. K. P.; Lett. Appl. Microbiol. 2014, 59, 139. [Crossref]
» Crossref -
3 Jang, W.; Choi, J.; Yu, H.; Kim, S.; Ha, S. D.; Lee, J.; J. Food Compos. Anal. 2025, 137, 106897. [Crossref]
» Crossref -
4 Periyasamy, S.; Subbiah, S.; Asian J. Chem. 2017, 30, 85. [Crossref]
» Crossref -
5 Shen, P.; Song, Z.; Zhang, Z.; Zeng, H.; Tang, X.; Jiang, C.; Li, J.; Wu, B.; J. Basic Microbiol. 2014, 54, 1251. [Crossref]
» Crossref -
6 Nair, N. S.; Mhatre, M.; Menon, S.; Shailajan, S.; J. Pharm. Biomed. Anal. 2014, 100, 190. [Crossref]
» Crossref -
7 Sun, J.; Shen, J.; Liang, L.; Xu, X.; Liu, H.; Zhang, C.; Chin. Phys. Lett. 2005, 22, 3176. [Crossref]
» Crossref -
8 Sushko, O.; Dubrovka, R.; Donnan, R. S.; J. Phys. Chem. B 2013, 117, 16486. [Crossref]
» Crossref -
9 Tang, Y.; Li, Z.; Tu, S.; She, Y.; Gan, Y.; Int. J. Quantum Chem. 2022, 122, e26971. [Crossref]
» Crossref -
10 Dash, J.; Ray, S.; Nallappan, K.; Kaware, V.; Basutkar, N.; Gonnade, R. G.; Ambade, A. V.; Joshi K.; Pesala, B.; J. Phys. Chem. A 2015, 119, 7991. [Crossref]
» Crossref -
11 Taylor, Z. D.; Singh, R. S.; Bennett, D. B.; Tewari, P.; Kealey, C. P.; Bajwa, N.; IEEE Trans. Terahertz Sci. Technol. 2011, 1, 201. [Crossref]
» Crossref -
12 Bawuah, P.; Zeitler, J. A.; Ketolainen, J.; Peiponen, K. E.; Opt. Rev. 2018, 25, 444. [Crossref]
» Crossref -
13 Ge, H.; Jiang, Y.; Lian, F.; Zhang, Y.; Optik 2016, 127, 4954. [Crossref]
» Crossref -
14 Lepodise, L. M.; Horvat, J.; Lewis, R. A.; J. Phys. Chem. A 2018, 122, 6886. [Crossref]
» Crossref -
15 Yamaguchi, S.; Tominaga, K.; Saito, S.; Phys. Chem. Chem. Phys. 2011, 13, 14742. [Crossref]
» Crossref -
16 Tang, Y.; Li, Z.; Zhang, H.; Tu, S.; She, Y.; AIP Adv. 2022, 12, 055015. [Crossref]
» Crossref -
17 Qin, B.; Li, Z.; Chen, T.; Chen, Y.; Optik 2017, 142, 576. [Crossref]
» Crossref -
18 Wang, Y.; Zhao, Z.; Chen, Z.; Kang, K.; Feng, B.; Zhang, Y.; J. Appl. Phys. 2007, 102, 22. [Crossref]
» Crossref -
19 Duvillaret, L.; Garet, F.; Coutaz, J. L.; IEEE J. Sel. Top. Quantum Electron. 2002, 2, 739. [Crossref]
» Crossref -
20 Dorney, T. D.; Baraniuk, R. G.; Mittleman, D. M.; J. Opt. Soc. Am. A 2001, 18, 1562. [Crossref]
» Crossref -
21 Hua, Y.; Zhang, H.; Zhou, H.; IEEE Trans. Instrum. Meas. 2010, 59, 1414. [Crossref]
» Crossref -
22 Groom, C. R.; Bruno, I. J.; Lightfoot, M. P.; Ward, S. C.; Acta Crystallogr., Sect. B: Struct. Sci., Cryst. Eng. Mater. 2016, 72, 171. [Crossref]
» Crossref -
23 Grimme, S.; Antony, J.; Ehrlich, S.; Krieg, H.; J. Chem. Phys. 2010, 132, 154104. [Crossref]
» Crossref -
24 Wang, Q.; Xue, J.; Wang, Y.; Jin, S.; Zhang, Q.; Du, Y.; Spectrochim. Acta, Part A 2018, 204, 99. [Crossref]
» Crossref -
25 Neu, J.; Nikonow, H.; Schmuttenmaer, C. A.; J. Phys. Chem. A 2018, 122, 5978. [Crossref]
» Crossref -
26 Jamroz, M. H.; Spectrochim. Acta, Part A 2013, 114, 220. [Crossref]
» Crossref -
27 Johnson, E. R.; Keinan, S.; Mori-Sanchez, P.; Contreras-Garcia, J.; Cohen, A. J.; Yang, W.; J. Am. Chem. Soc. 2010, 132, 6498. [Crossref]
» Crossref -
28 Lu, T.; Chen, Q.; ChemRxiv, 2021. [Crossref]
» Crossref -
29 Emamian, S.; Lu, T.; Kruse, H.; Emamian, H.; J. Comput. Chem. 2019, 40, 2868 [Crossref]
» Crossref -
30 Liu, X. D.; Hu, Z. Q.; University Chemistry 2006, 5, 34. [Crossref]
» Crossref -
31 Lu, T.; Chen, F.; J. Comput. Chem. 2012, 33, 580. [Crossref]
» Crossref
Edited by
-
Associate Editor handled this article:
Ana Paula L. de Batista