 Hydrogen production by photocatalytic decomposition of water by means of TiO2 nanotubes decorated with plasmonic bimetallic nanoparticles
Abstract
Energy from renewable sources, such as green hydrogen, stands out as an alternative with high potential to meet the significant global energy demand. New materials are being developed for use in catalytic hydrogen photogeneration. However, few works report precise control of the composition and structure of nanoparticles and their effects on water decomposition. The active sites available in both the semiconductor and the adsorbed nanoparticles significantly improve light absorption and reduce electron/vacancy pair recombination. Here, hydrogen was produced using TiO2 nanotubes decorated with plasmonic bimetallic nanoparticles. The samples were characterized by Raman spectroscopy, transmission electron microscopy (TEM), energy-dispersive X-ray spectroscopy (EDS), inductively coupled plasma optical emission spectrometer (ICP OES), X-ray excited photoelectron spectroscopy (XPS), UV-Vis, and N2 adsorption-desorption. The TEM images showed the formation of nanotubes with an external diameter of about 55 nm, with anatase being the predominant phase. The photocatalysts generally showed high production rates, particularly for AuPd-TiO2, with a rate of around 4000 μmol g-1. The results of this work show that the material is a good option for producing clean energy, providing future solutions for sustainable development.
Keywords:
nanotubes TiO2; bimetallic nanoparticles; photogeneration of H2; UV and visible light.
INTRODUCTION
The growing energy demand, allied with environmental problems and the high price and finite oil reserves, is increasingly leading to a near-future energy crisis. Energy from renewable sources stands out as a high-potential alternative capable of meeting the needs of humanity.1 Solar energy, wind energy, hydropower, and biomass are examples of renewable energy sources. Despite the variety, energy from renewable sources still cannot meet the high demand. The need for new materials with better performance and greater durability is wide-ranging, encompassing many challenges and consequences in achieving an H2 economy.2,3 Research4 shows that the natural candidate to occupy the rank of clean energy sources on a planetary scale is H2, considered the fuel of the future. However, it is still in its initial stages, with low efficiency, and further studies are needed to improve it. Therefore, not the H2 but its manufacturing method will decide whether the new energy source will be environmentally friendly.5-7 If a semiconductor has adequate energy bands and a band gap greater than 1.23 eV, water photolysis can occur without any externally applied potential.8,9 Among the semiconductors available for use in photocatalysis, titanium dioxide, since its publication in the photoelectrochemical production of hydrogen by Fujishima and Honda,10 has been a prominent target in water splitting. Nanotubes synthesized by hydrothermal processes are an interesting alternative for producing photocatalysts.11-13 They have several advantages over the classic catalysts used to produce H2 from the photolysis of water. This semiconductor has low cost, high chemical and thermal stability, solar sensitivity, and low toxicity. In addition, they have good photocatalytic activity; however, they only absorb radiation in ultraviolet regions, having a high band gap and high electron/vacancy recombination.14 In addition, they have small diameters and usually break when exposed to severe conditions.15,16 For optimal use of this energy, structural changes, such as doping and the addition of cocatalysts, should be carried out to improve the efficiency of the system.17 Kuo et al.18 showed that when calcining titanate nanotubes, a crystalline material composed of anatase phase nanotubes is formed, producing 20% more H2 than the reference material. An alternative is using nanoparticles of noble metals characterized by the plasmonic oscillation of the conduction band electrons in response to the received radiation.19-21 Yang et al.22 investigated hydrogen production from ethanol; in the absence of a metal, TiO2 showed negligible molecular hydrogen production. The plasmonic photocatalytic process can be represented by three main distinct mechanisms:23 nanoparticles can cause photon scattering and intensify the amount of incidence on the surface of the semiconductor; there can be an intensification of the electric field on the surface of the nanoparticles, causing a transfer of energy to the semiconductor and, finally, the electrons of plasmonic metals are excited to high energies, surpassing its Fermi level and reaching the metal-semiconductor limit, where the generation and transfer of high energy electrons occur.3,19 So, active sites are available both in the semiconductor and in the adsorbed nanoparticles, which improve light absorption and decrease the recombination capacity of electron/vacancy pairs.13,24 However, studies25,26 are limited to using gold and silver only. Many studies27 suggest the Pt-TiO2 combination as the best photocatalyst for hydrogen production. A possible explanation is the relatively large work function and smaller overpotentials among noble metals.28 However, bimetallic particles demonstrate increased activity, selectivity, optical properties, and stability, especially allowing absorption of visible radiation, an important energy source given its high incidence rate on the surface of the Earth.29,30 Wang et al.31 studied the properties of monoand bimetallic Au and Pd nanoparticles, including stability and catalytic activity, and reported that bimetallic particles showed better performance. Previously, we reported32,33 a method for growing TiO2 film matrices by anodic oxidation, and titanate nanotubes with a diameter of 8.42 nm obtained by the hydrothermal method. This work consisted of preparing TiO2 nanotubes using a simple methodology involving oven drying, incorporating bimetallic nanoparticles with plasmonic properties, and applying the resulting material to H2 photogeneration. We sought to obtain nanotubes with an ordered tubular structure, strong ion-exchange capacity, and a high specific surface area, with excellent photocatalytic properties compared to commercial TiO2.34,35 The hydrothermal method used in this work yields titanate tubular nanotubes. After heat treatment, a phase change occurs from titanate to anatase.11 To optimize H2 production, the nanotubes were decorated with bimetallic nanoparticles of AuPd, AuPt, and PtPd. UV-Vis, Raman, transmission electron microscopy (TEM), energy-dispersive X-ray spectroscopy (EDS), inductively coupled plasma optical emission spectrometer (ICP OES), X-ray excited photoelectron spectroscopy (XPS), and N2 adsorption-desorption analyses were also performed to shed some light on the role of the catalyst.
EXPERIMENTAL
Materials and instrumentation
TiO2 (anatase, 99.8%), ethylene glycol (C2H6O2, Sigma-Aldrich, 99.8%), hydrochloric acid (HCl, Dynamics, 37% P.A.), tetrachloroauric(III) acid trihydrate (HAuCl4∙3H2O, Sigma-Aldrich, 99.9%), palladium II chloride (PdCl2, Sigma-Aldrich, 99.0%), sodium tetrachloroplatinate(II) hydrate (Na2PtCl4•H2O, Sigma-Aldrich, 99.9%), sodium hydroxide (Synth P.A.), glycerol, ethyl alcohol and cinnamyl alcohol (C9H10O, Sigma-Aldrich, 98.0%) were used without further purification. All solutions were prepared with deionized water.
Synthesis of titanium dioxide nanotubes decorated with bimetallic nanoparticles with plasmonic properties and hydrogen photogeneration
Titanium nanotubes were prepared using commercial titanium dioxide. Typically, 3.0 g of commercial titanium dioxide was mixed in 90 mL of a 10 mol L-1 NaOH solution, then transferred to a drying oven and heated to 150 °C for 96 h. After cooling the system to room temperature, the solid obtained (NaTiNts) was washed with ionized water until it reached pH 10. Then, 0.1 mol L-1 aqueous HCl solution was added until the pH reached 6-7. This procedure was used to remove the sodium present in the sample, resulting in HTiNts. This sample was dried under vacuum for 12 h.36 To generate nanotubes decorated with plasmonic bimetallic nanoparticles, 10 mg of HTiNts and 14 mg of urea were added to 40 mL of deionized water and 20 mL of ethylene glycol. Then, 2.0 mmol L-1 aqueous solutions of gold, palladium, and platinum were added to this mixture under constant stirring. The solution was heated to 90 °C, under stirring, for 4 h. The final product was centrifuged and washed three times with deionized water and ethyl alcohol through successive centrifuges. After this procedure, it was calcined at 300 °C for 4 h with a heating ramp of 10 °C min-1 to obtain the anatase phase of titanium dioxide. Hydrogen photogeneration experiments were carried out in a calibrated 35 mL gas-enclosed photochemical double quartz reactor in which water circulates and controls the solution temperature (25 °C) under continuous magnetic stirring. The catalysts (7.5 mg) were dispersed in 15 mL of a 5 wt.% glycerol aqueous solution and introduced into the reactor.37 Before irradiation, the system was de-aerated using Ar-vacuum cycles for about 10 min to reduce the oxygen content.
Characterization
The Raman spectra were acquired on a Bruker Senterra II® instrument coupled to an optical microscope (Bruker AXS GmbH, Karlsruhe, Germany), with a 50× objective and a 785 nm laser as the excitation source. The low laser power density was used to prevent the sample from overheating. A spectral resolution of 3 cm-1 was used, with an interval of 100-1000 cm-1. The metal content in the catalysts was determined by an inductively coupled plasma optical emission spectrometer (ICP OES) on a SPECTRO ARCOS® instrument (Spectro Arcos, trade Zone, Shanghai). Solid samples were first digested in a mixture of HCl and HNO3 under heating and diluted with deionized water. Brunauer-Emmett-Teller (BET) and Barrett-Joyner-Halenda (BJH) surface areas and pore-size distributions of the materials were obtained using a Micromeritics ASAP 2420® instrument (Micromeritics, Florida, USA) by N2 physisorption. For each analysis, an average of 93 mg of each previously degassed sample was used. The adsorption isotherms were obtained over a relative pressure range of 0.01 to 0.99 at -196.15 °C. The surface areas and pore volume distribution were estimated using the BET and BJH methods. TEM images were obtained using MORGAGNI 268D® (Philips, Bungkum, Bangkok) operating at 110 kV. Samples for TEM were prepared by drop-casting an isopropanol suspension onto a carbon-coated copper grid, followed by drying under ambient conditions. The nanoparticles’ size was determined by using the ImageJ® software, version 1.53, developed at the National Institutes of Health, USA, 1997. The surface chemical composition was verified by XPS using a Scienta Omicron ESCA + spectrometer (Uppsala, Sweden) equipped with an EA 125 hemispherical analyzer and an XM 1000 monochrome X-ray source (Al Kα, 1486.7 eV). TA previous calibration of the spectra based on the C1s peak (binding energy (BE) = 284.8 eV) was performed to correct the charge accumulation. The adjustment of the peaks was performed by applying Shirley-type background correction, followed by fitting with combined Gaussian and Lorentzian curves. The diffuse reflectance spectra of UV-Vis were obtained concerning the reflectance of a pattern (BaSO4) using a UV-Vis spectrophotometer (Agilent, Cary 300) equipped with an accessory for diffuse reflectance sampling (Agilent, Santa Clara, USA). The samples were pressed into 2 g pellets of BaSO4 and 50 mg of material. The photocatalytic activity of the material was studied for H2 generation by water-splitting reaction under UV-visible irradiation for 3 h. The samples were illuminated by a 600 W solar simulator (Power Solar, Newport, USA) and a 450 W Xe lamp (Ushio, California, USA) at one-sun intensity. For the analyses, an irradiance of one sun (100 mW cm-2) was used, calibrated with an Instrutherm MRU-201 UV radiation meter, measured from an average distance of 17 cm between the lamp outlet and the reactor, using an FSQ-GG400 and FSQ-UG5 filters (Newport Corporation, California, USA) to refine the lamp spectrum to simulate solar radiation. The amount of accumulated H2 in the headspace of sealed quartz reactors was measured using an Agilent gas chromatograph equipped with a TCD detector and HP-PLOT/Q and HPMOLESIEVE columns (30 m each; Agilent, Santa Clara, USA). Data was taken at regular intervals from 30 to 210 min for rate determination. A maximum volume of 450 μL of the gas in the closed reactor was collected with a gas-tight syringe (Sample Lock Syringe, Hamilton, USA).
RESULTS AND DISCUSSION
Photocatalyst characterization
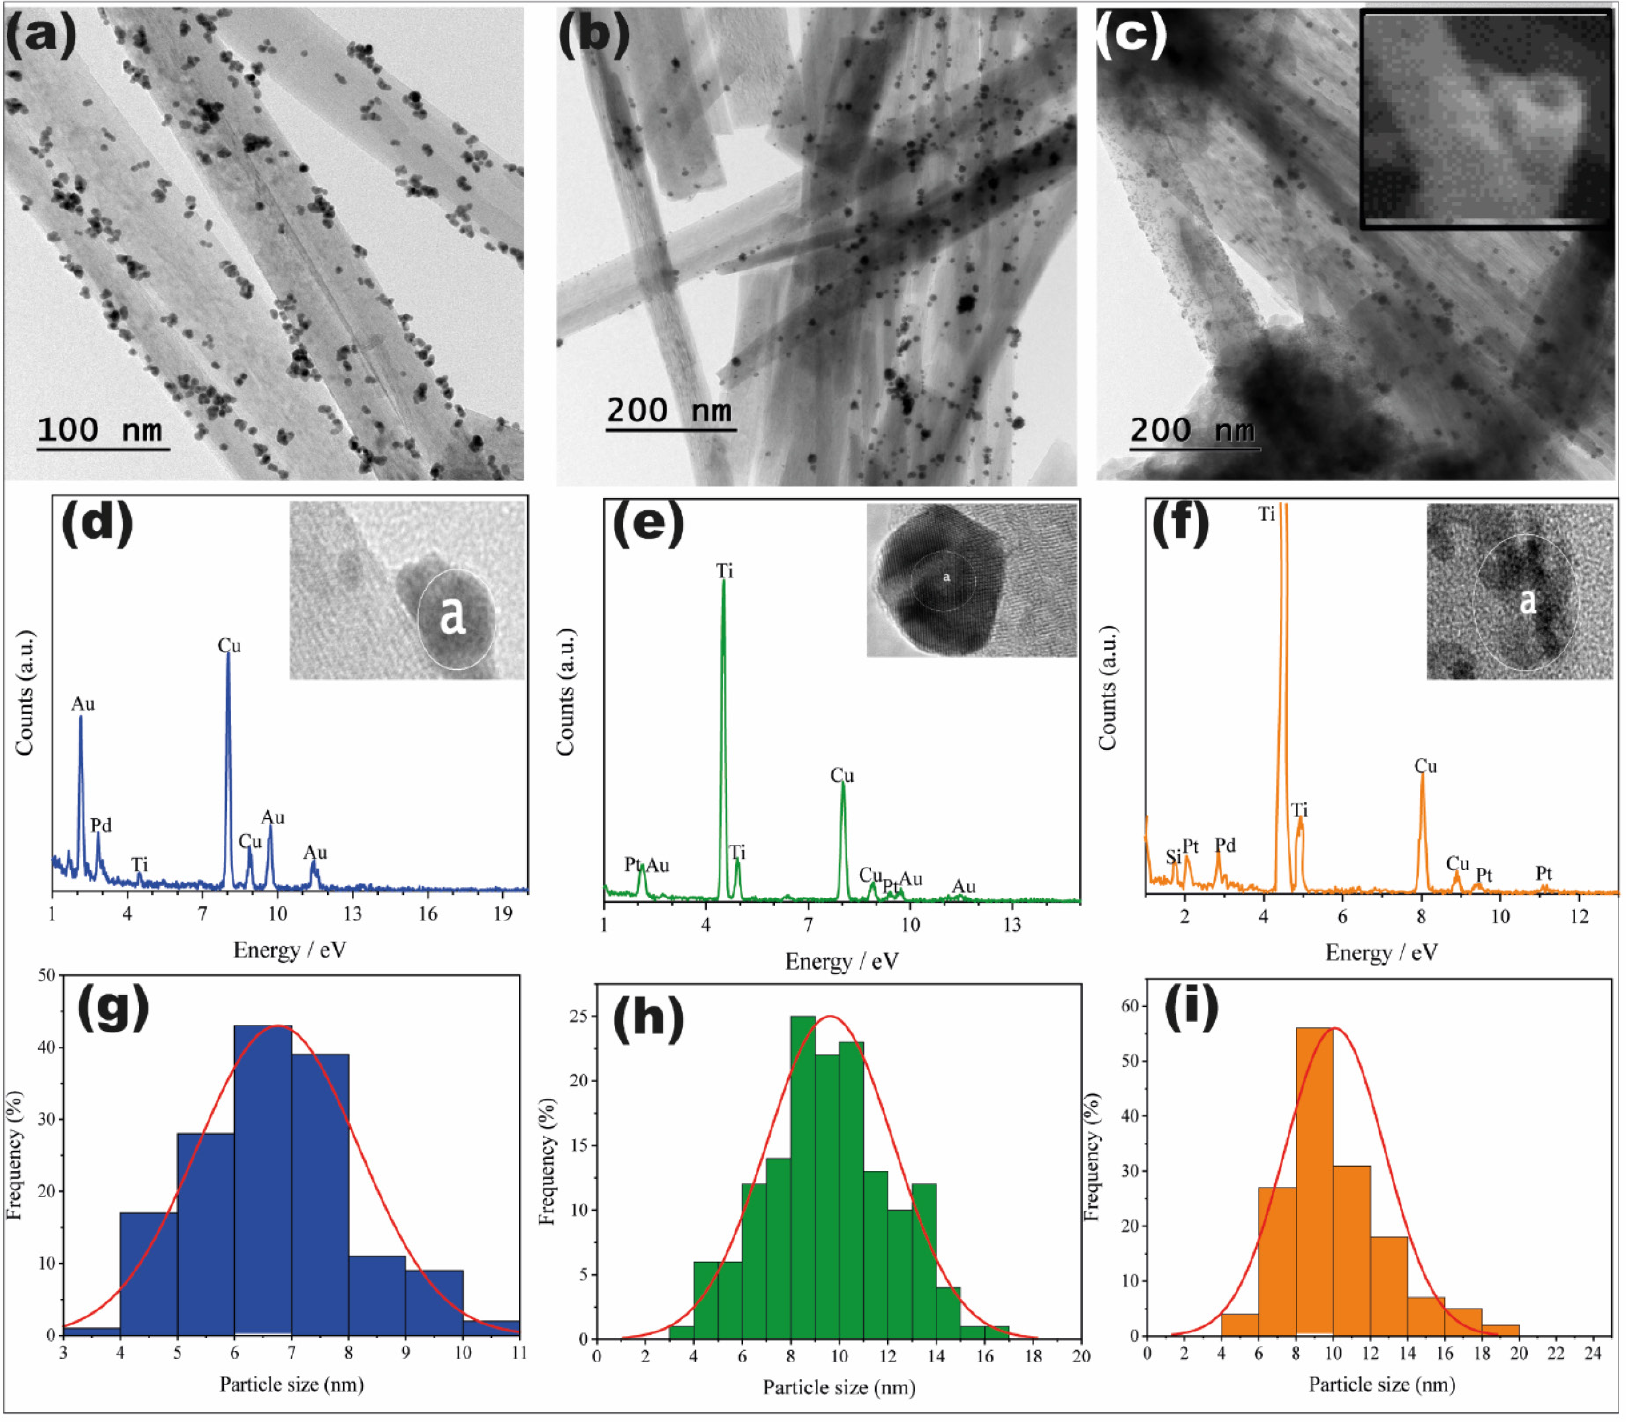
TEM images of the resulting titanium dioxide nanotubes decorated with plasmonic bimetallic nanoparticles, even after calcination at 300 °C, are shown in Figure 1. The nanotubes are uniform and present a width of around 55.50 ± 09.48 nm, as shown in the histogram (Figure 1S, Supplementary Material). The diameter is related to the methodology used, which involves an oven at 150 °C for 96 h. Compared to the literature,33 this increase in diameter makes the nanotubes more robust, facilitating the incorporation of bimetallic nanoparticles. In addition, it can be stated that the synthesized material is tubes formed from the winding of the structures formed in the hydrothermal treatment, following the image inserted in Figure 1c. During the heat treatment process, at around 300 °C, it was not observed changes in the morphology of the titanate; however, the anatase crystalline phase formed, likely due to dehydration between the layers.38 In this case, we maintained the structure and changed the crystalline phase. The histograms generated through the TEM images show a narrow distribution of the sizes of the bimetallic nanoparticles, according to the Figures 1g, 1h, and 1i, pointing to a good uniformity in sizes with excellent distribution throughout the surface of the nanotubes, with sizes around 7 ± 0.84, 9.5 ± 0.52, and 10 ± 0.67 nm for the samples AuPd, AuPt, and PdPt, respectively. This uniformity in particle size and distribution indicates a strong interaction between the nanoparticles and the titanium dioxide nanotubes. Using energy-dispersive X-ray analysis, it was possible to verify the formation of bimetallic nanoparticles on the nanotube surface, as shown in Figures 1d, 1e, and 1f. EDS analyses were carried out at different points in the samples, and, in all cases, the same chemical composition was observed (Figure 2S, Supplementary Material). Identifying the expected peaks for each sample was possible, evidencing the formation of bimetallic particles. The catalysts prepared, AuPd-TiO2, AuPt-TiO2, and PdPt-TiO2, were submitted to ICP OES analysis to quantify the metallic composition. The results were 2.1, 1.9, and 1.8 %m/m (Table 1S, Supplementary Material). ICP OES analysis was performed after use, and no material loss was observed. We sought to obtain nanoparticle concentrations of around 2%. For the gold nanocatalysts, we observed a more significant deposition of Au, indicating a better interaction of the metal with the TiO2 surface. Both Pd and Pt did not provide effective deposition compared to Au; this is evident from the percentage composition of the material (Table 1S).39 In a recent study, Silva et al.40 reported similar results for AuPd, which indicates a more significant deposition of Au.
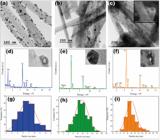
(a-c) TEM images of titanium nanotubes supported with bimetallic nanoparticles AuPd-TiO2, AuPt-TiO2, and PdPt-TiO2 employed in our studies. X-ray energy-dispersive spectroscopy was recorded for the bimetallic nanoparticles shown in images (d-f). The images (g-i) display the corresponding size distribution histogram

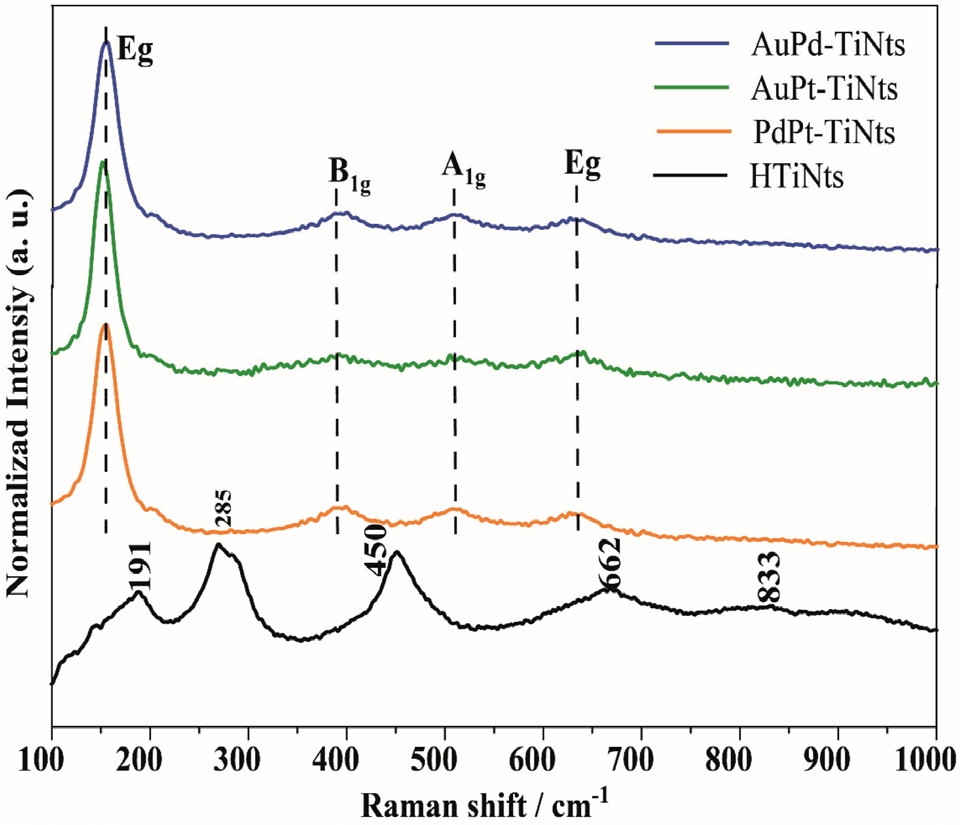
Figure 2 shows the Raman spectra of the material, which reveal several active modes. The spectrum of uncalcined titanate nanotubes shows vibrational modes at 191, 285, 450, 662, and 833 cm-1, characteristic of the nanotubular structure of titanate, which corresponds to the Ti-O-Ti stretching of the TiO6 octahedron. Kim et al.41 observed Raman spectra of titanates (NaTiNts) that showed a vibrational mode around 932 cm-1, attributed to sodium. When analyzing the spectra of the titanate in the present work, we observed that the removal of sodium was efficient since vibrational modes are not seen in this region. However, we cannot rule out its existence. When we analyzed the spectra of decorated and thermally treated nanotubes at 300 °C, we noticed the emergence of new vibrational modes due to changes in the crystal lattice. After calcination of nanotubes, new vibrational modes appeared around 157, 397, 513, and 635 cm-1, which, according to the literature,33 are attributed to Eg and B1g modes, O-Ti-O bending vibration and A1g and Eg vibrational modes of Ti-O bond stretching, respectively, with these new bands referring to the anatase phase. The change in character from titanate to anatase is directly linked to the spectral characteristics, pointing to the anatase phase.
As previously discussed, Raman spectra and TEM images show that nanotubes decorated with metals change their crystalline phase from titanate to anatase after calcination; however, they retain their nanotubular morphology. These nanotubes have a high surface area and, together with the anatase crystalline phase, the most photoactive polymorph of TiO2, permitted improvements in photocatalysis.17 As can be observed (Figure 3Sa, Supplementary Material), the typical diffraction peaks of NaTiNts are around 10° (2θ), referring to the interlayer distance; and 24° (2θ), referring to the diagonal planes formed by the ionic lamellae. In Figure 3Sb (Supplementary Material), we can observe the characteristic peaks of the anatase phase (25.2°, 37.9°, 48.1°, and 54.4°), corroborating the Raman results.
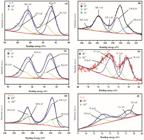
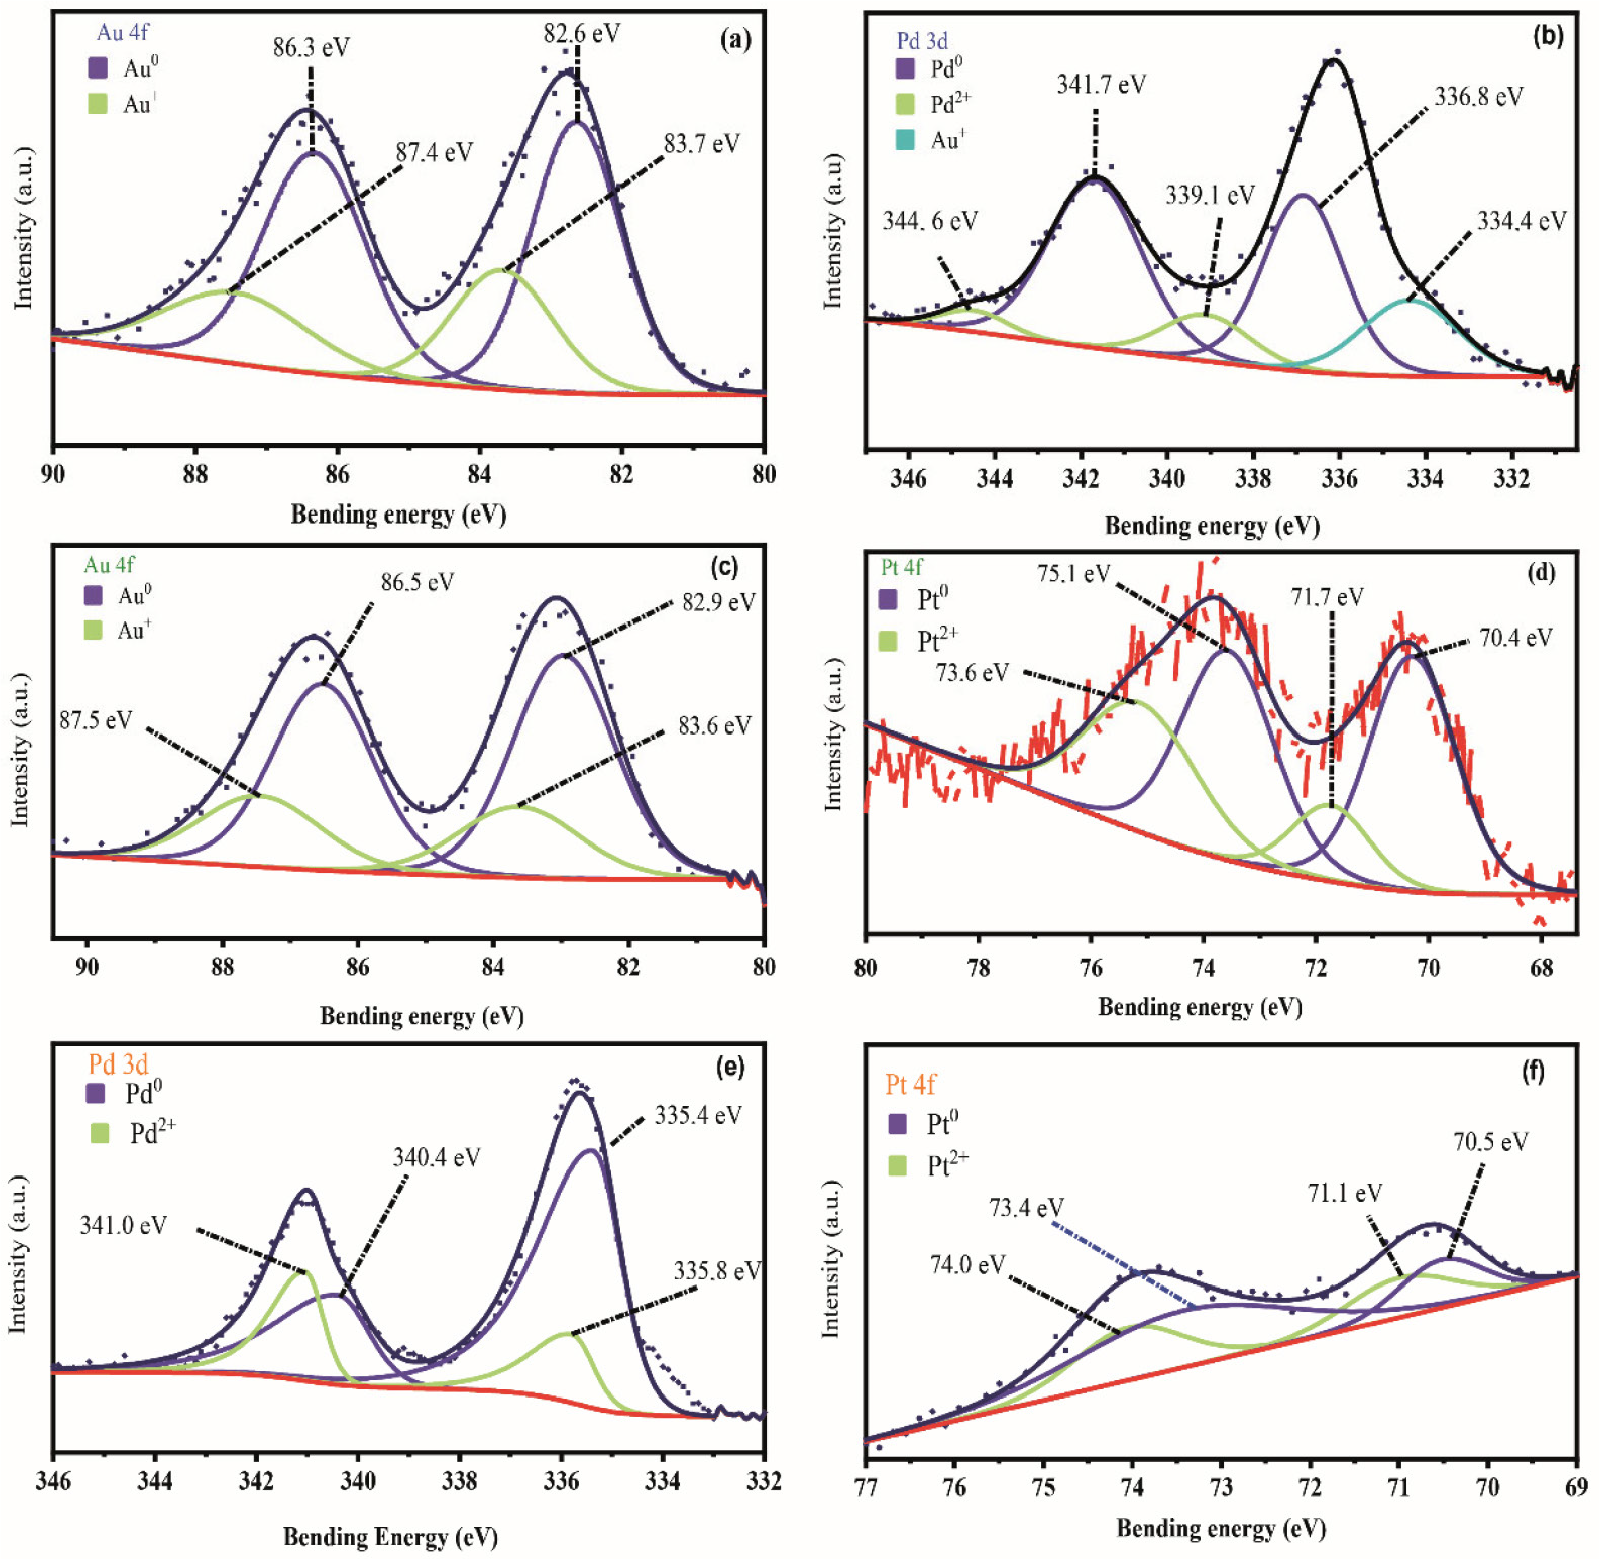
XPS spectra of (a) Au 4f, (b) Pd 3d from the AuPd-TiO2 sample; (c) Au 4f and (d) Pt 4f from the AuPt-TiO2 sample; (e) Pd 3d and (f) Pt 4f from the PdPt-TiO2 sample
X-ray photoelectron spectroscopy
The detailed study on the chemical environment of nanomaterials was analyzed by XPS. As expected, the survey scan (Figure 4S, Supplementary Material) revealed the presence of Au, Pd, Pt, and Ti, corroborating the EDS results. The spectra in Figure 5Sa (Supplementary Material) show the Ti 2p signals for the TiO2 nanotubes. In the first deconvolution, energies around 457.9 and 463.9 eV are assigned to Ti 2p3/2 and Ti 2p1/2, and the separation energy around 6 eV refers to Ti4+. These results agree with the literature;42,43 binding energy for Ti 2p to nanotubes is approximately 458.8 eV (2p3/2) and 464.4 eV (2p1/2) with separation energy around 5.6 eV corresponding to Ti4+. Variations of 0.4 eV are observed for AuPdTiO2 due to changes after nanoparticle decoration. However, observing a second deconvolution, two low-intensity peaks shifted around 458.9 and 459.9 eV (Ti 2p3/2 and Ti 2p1/2) can be attributed to Ti3+. The presence of this species suggests evidence of oxygen vacancies (Ti3+ sites) in the nanotubes, and these vacancies can increase the stability of plasmonic nanoparticles and improve catalytic activity.44,45 The spectra in Figure 5Sb (Supplementary Material) show the O 1s. The peaks at 532.0, 530.4, and 529.2 eV are assigned to H2O, OH-, and Ti-O, respectively. These results agree with the literature.42 For the sample AuPd-TiO2 (Figures 3a and 3b), high-resolution spectra of Au 4f show the deconvolution of the peaks present, two pairs of spin-orbit components, Au 4f7/2 and Au 4f5/2, which contribute to two different chemical species. The first deconvolution shows a peak at 82.6 eV for Au 4f7/2, which can be attributed to Au0 species. The second deconvolution shows a peak around 83.7 eV, which Zwijnenburg et al.46 attribute to the Au+ species. The value reported for the Au0 species is lower than the literature46,47 value due to the formation of the bimetallic nanoparticle. The shifts observed in the binding energy peaks of Au and Pd can be attributed to the formation of the AuPd nanoparticle due to the electronic modification of the Au species by Pd. This particle arrangement is consistent with what is observed in the transmission electron microscopy (Figure 2S). Figure 3b shows the two spin-orbit components of Pd 3d, Pd 3d5/2 and Pd 3d3/2. The Pd 3d5/2 peaks with 336.8 and 339.1 eV refer to the chemical species Pd0 and Pd2+. The literature48 reports a peak value for Pd0 around 335.4 eV; the value obtained differs because the sample contains a metal alloy. In the Pd 3d region, the contribution of the Au 4d orbital is notorious, which is related to the interaction of gold and palladium. Concerning the AuPd-TiO2 sample, the Au0/Au+ atomic composition ratio was 2.47, indicating a more significant amount of reduced gold deposited on the surface of the sample. As for Pd0/Pd2+, we have 3.50, showing a greater contribution from Pd0.47 The XPS data indicate approximately 70.80% Au0 on the external surface of the nanotubes. These results align with the literature; Kiss et al.49 showed that gold is partially stabilized in titanate nanotubes as Au+ via ion exchange.
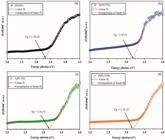
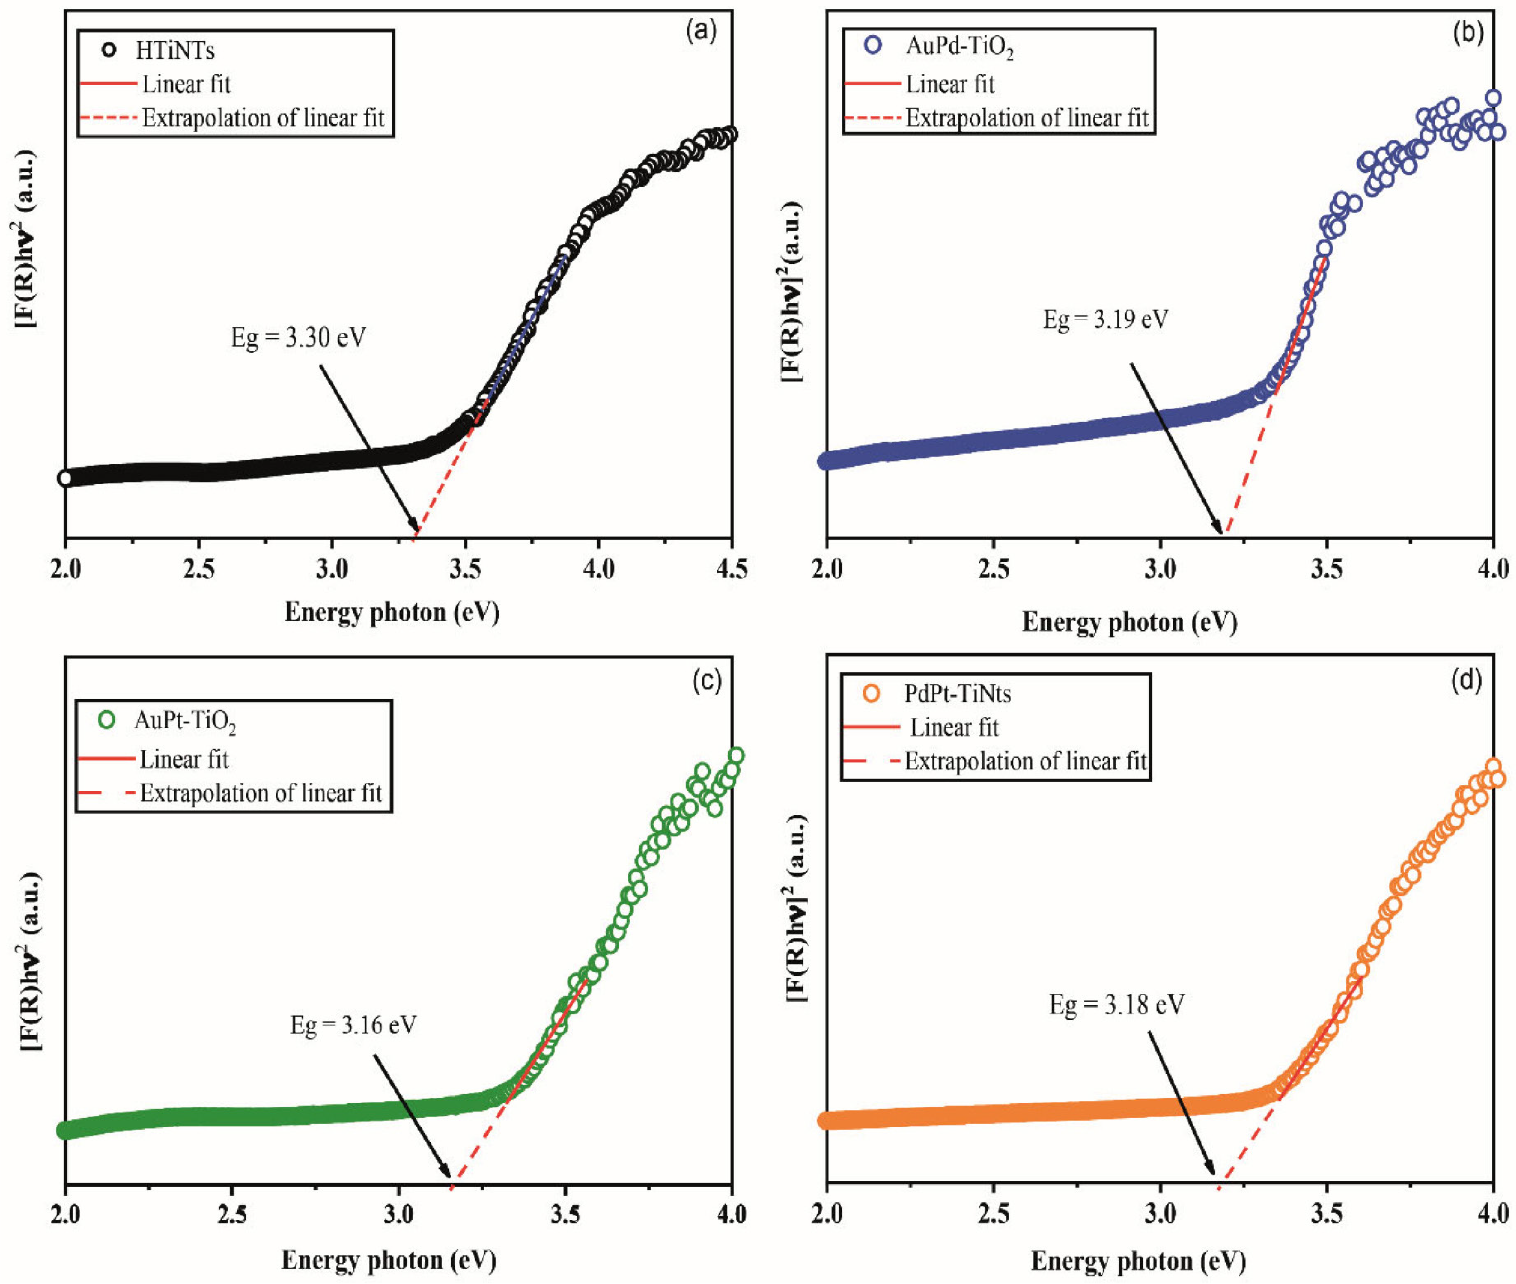
Kubelka-Munk curves versus photon energy (Ephot = hν) of the (a) titanate; (b) AuPt-TiO2; (c) AuPt-TiO2; (d) PdPt-TiO2
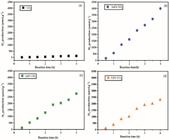
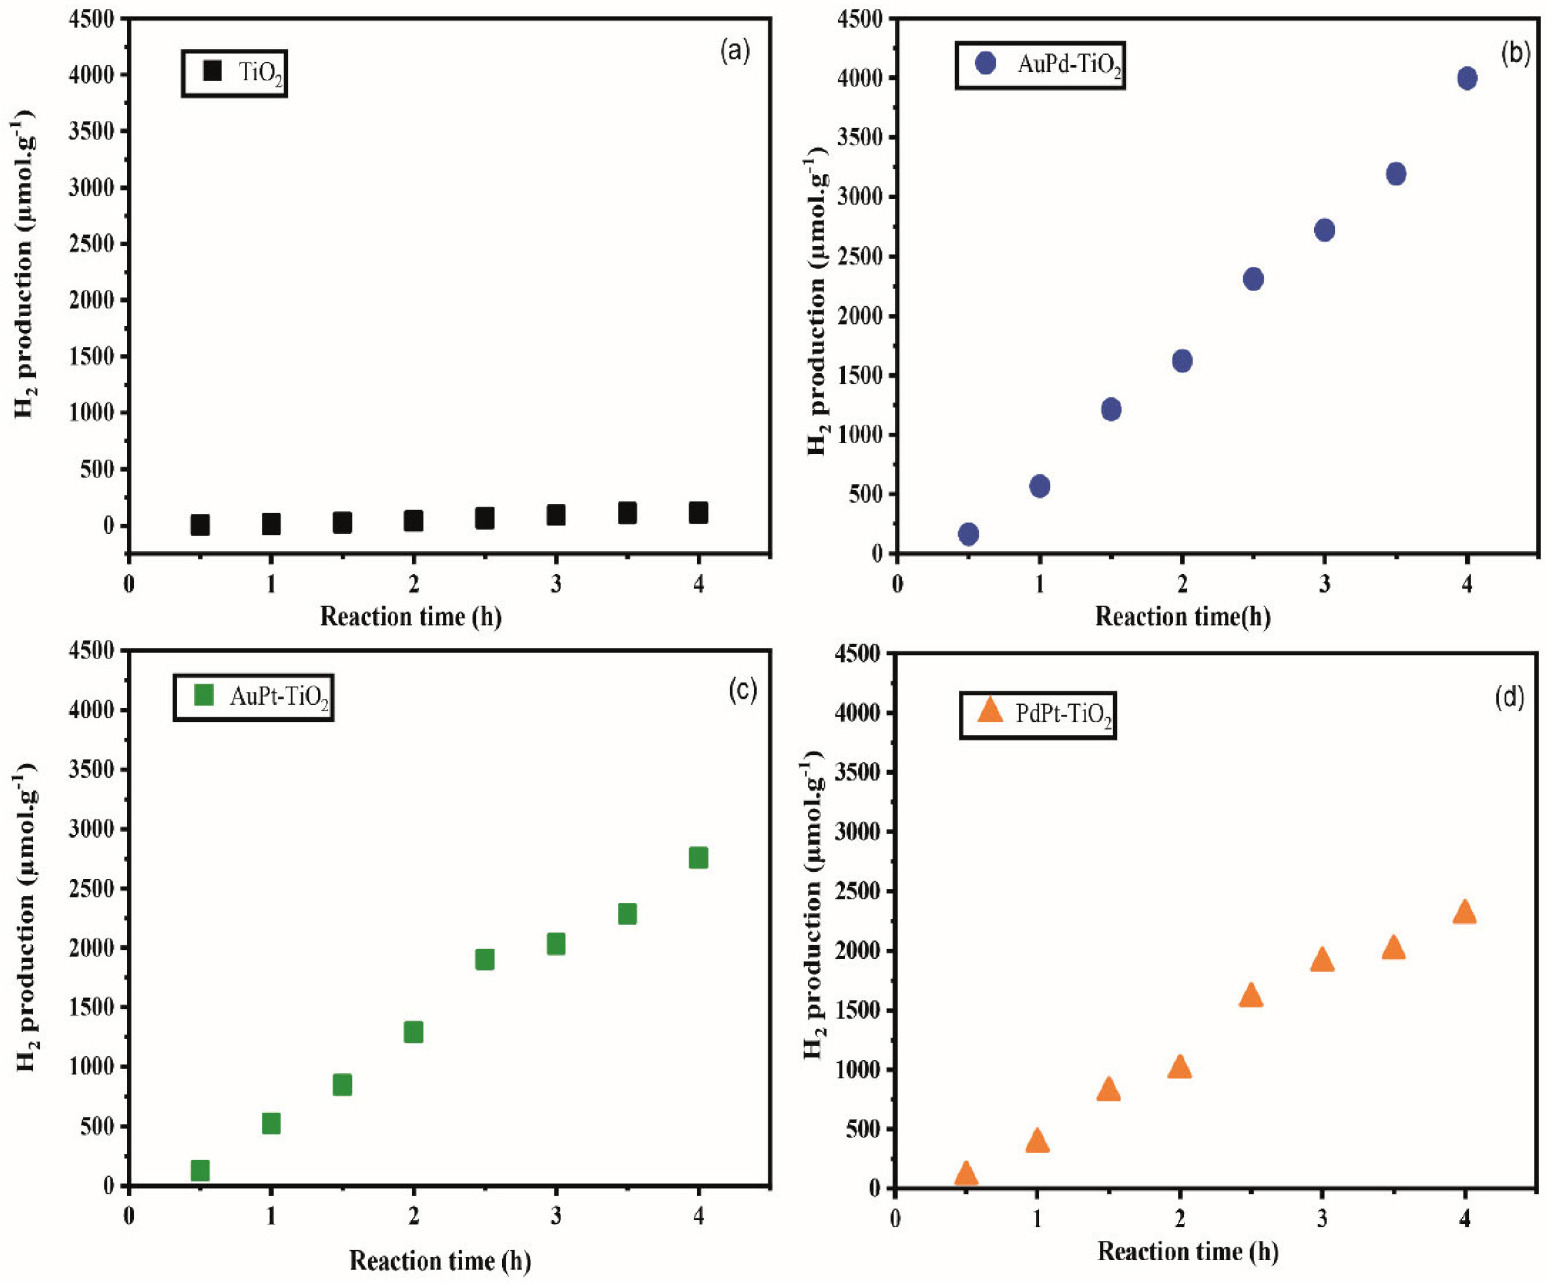
Photogeneration evolution of H2 under UV-Vis irradiation: (a) titanate and TiO2 nanotubes, (b) AuPd-TiO2, (c) AuPt-TiO2, (d) PdPt-TiO2
For the sample AuPt-TiO2 (Figures 3c and 3d), the deconvolution of Au 4f points to two pairs of components, Au 4f7/2 and Au 4f5/2, indicating two different chemical species of gold. Au 4f7/2 and Au 4f5/2 at 82.9 and 86.5 eV peaks are attributed to Au0 species. The following deconvolution refers to the Au+ species, with peaks around 83.6 and 87.5 eV, attributed to Au 4f7/2 and Au 4f5/2, respectively.31 For platinum (Figure 3d), the deconvolution of the peaks allows the evidence of two pairs of spin-orbit components, Pt 4f7/2 and Pt 4f5/2, illustrating the contribution of two different chemical species. In the first deconvolution, the peak at 70.4 eV in the Pt 4f7/2 region is attributed to Pt0. According to the literature,50 the energy for the chemical species Pt0 is around 71.1 eV. Therefore, the value obtained is consistent with the literature,50 as the chemical environment in which the species is found shifts the energy to lower values. In the second deconvolution, the Pt 4f7/2 peak is around 71.7 eV, attributed to the Pt2+ chemical species. The Au0/Au+ ratio was 2.41, indicating greater Au0 on the surface of the sample. Between Pt0/Pt2+, we have 1.93, with a more significant contribution from Pt0. This concentration of Pt2+ may be associated with its role as an electron scavenger, allowing its reduction.28,51 For the sample PdPt-TiO2, Figures 3e and 3f, the Pd shows binding energies in the first deconvolution at 335.4 and 340.4 eV, corresponding to Pd 3d5/2 and Pd 3d3/2, respectively. These values align with the literature,50 which indicates values of around 335.3 and 340.6 eV (Pd 3d5/2 and Pd 3d3/2) for the mentioned species, and values for the mentioned species around 335.3 and 340.6 eV (Pd 3d5/2 and Pd 3d3/2) attributed to Pd0. This negative displacement evidences the existing charge transfer between Pd and Pt.52,53 The following deconvolution indicates values around 335.8 and 341.0 eV (Pd 3d5/2 and Pd 3d3/2, respectively), attributed to Pd2+.54 Deconvolution allowed the identification of peaks at 70.5 and 73.4 eV for the pairs of Pt 4f7/2 and Pt 4f5/2 components, including the contribution of the chemical species Pt0. As already mentioned, the literature50 indicates values around 71.2 and 74.6 eV for the respective species. The other spin-orbit pairs give binding energies of 71.1 and 74.0 eV, attributed to the Pt2+ chemical species.
Adsorption and desorption of N2
The methods for obtaining these materials can improve their textural parameters and influence their photocatalytic activity. We can consider that, in addition to their morphology, the texture of these materials is highly relevant for the photocatalysis event. From the nanotube isotherms, we can deduce the characteristics of the pores (shape, volume, and diameter) and their specific surface area.55 Figure 6S (Supplementary Material) represents the isotherms of the synthesized materials for hydrogen production.56 The hysteresis formed with desorption determines the geometry of these pores, which in this case refers to an H3 hysteresis loop commonly found in plate/slit-like particle materials.57,58 According to Table 1, the titanate had a smaller surface area; this value is consistent with the literature.59 The pore and specific surface areas are related to the synthesis conditions. Bavykin et al.59 showed that increasing the molar ratio of TiO2 to NaOH generally increases the mean pore diameter and decreases the surface area. On the other hand, increasing the temperature from 120 to 150 °C results in an increase in the mean diameter of the nanotubes. That is, with the addition of metals to the surface and calcined at 300 °C for 4 h, a significant increase in the surface area of the catalysts can be observed, which may be related to the distribution of bimetallic nanoparticles on the surface of the catalyst and phase change from crystalline titanate to anatase.60 Regarding pore volume, there are no significant variations. The pore diameter shows irregular alteration in different samples, it is not possible to state that the material is porous. The different concentrations of nanoparticles that decorate each catalyst contribute to different pore diameters, however, this variation is not significant. In the photocatalytic splitting of water, the specific surface area of the catalyst contributes to its light absorption capacity. Therefore, it can be expected that, by increasing the surface area of the samples, the catalysts will exhibit better performance in hydrogen production.40
Ultraviolet-visible spectroscopy by diffuse reflectance
The ultraviolet-visible diffuse reflectance spectroscopy was performed on nanotubes to obtain the optical spectra. We can see in Figure 4a that the value equals 3.30 eV, following literature values.61 After the addition of bimetallic nanoparticles to the surfaces of the nanotubes and calcination at 300 °C (Figures 4b, 4c, and 4d), a decrease in their band gap is observed from 3.30 to 3.19, 3.18, and 3.16 eV for AuPd-TiO2, AuPt-TiO2 and PdPt-TiO2, respectively. The decrease in band gap energy is directly related to bimetallic nanoparticles anchored in nanotubes. Intermediate levels can be inserted between the valence-band orbitals (O 2p) and the conduction-band orbitals (Ti 3d) originating from the nanoparticle, thus facilitating charge transport within the internal structures of the materials.33,62-65 A smaller band gap allows better use of visible radiation and the potential for improved photocatalytic activity. In this case, considerably reducing the gap energy facilitates light absorption, providing the necessary vacancies for the reactions, and prevents easy recombination.28
Experimental design for photogeneration of hydrogen
As shown in Figure 5, using bimetallic catalysts with particles capable of generating surface plasmons yields significant improvements in H2 production compared to nanotubes without the bimetallic nanoparticles. The ability of these bimetallic nanoparticles to improve catalytic activity is associated with surface plasmon resonance.66 Once again, it is possible to associate the properties of these metals, forming unique structures and synergistic effects for excellent photocatalytic performance. It is well established in the literature that using plasmonic bimetallic nanoparticles, comprising metals such as Ag and Au and low-grade metals such as Pd and Pt, in combination with semiconductors can enable significant improvements in catalytic activity.24 In Figure 5b, AuPd-TiO2 with photocatalytic activity increased several times compared to nanotubes without cocatalysts and with PtPd-TiO2 (Figures 5a and 5d). These results are directly associated with semiconductor activation by less energetic processes, such as visible photons, since the presence of gold in both cases led to significant improvements. The AuPd-TiO2 nanocatalyst produced about 4000 μmol g-1 of H2. It can be noted that the presence of gold results in better photocatalytic activity, as Au exhibits a more pronounced surface plasmonic resonance than other metals, thereby improving light absorption, which is essential for catalyst performance. When irradiated, the electrons generated in the semiconductor migrate to the nanoparticles. These electrons migrate to Pd-rich sites, where greater H2 production will occur when compared to a monometallic system.67 In addition, the sample had a smaller average nanoparticle size, contributing to a larger surface area.
The PdPt-TiO2 photocatalyst, compared to the others, has the lowest contribution from the highlighted factors, reflecting a reduction in its production to 2280 μmol g-1. However, it can be noted that even with low plasmonic effects, the present photocatalyst still shows good results.68,69 When comparing the values obtained in this work with the literature, it is observed that the results are much higher. For example, Kunthakudee et al.70 proposed the production of H2 by photocatalytic decomposition of water using a catalyst prepared by photodeposition of Au/TiO2, and in the best proportion between Au and TiO2, obtained 134 μmol g-1. Costa et al.32 synthesized TiO2 nanotube film by anodic oxidation decorated with gold nanoparticles in different percentages, where TiO2Au 2.6% showed the best hydrogen production around 212.3 μmol g-1. Marques et al.33 obtained 853 μmol g-1 using titanate nanotubes decorated only with gold under the same conditions. It is essential to mention that titanate and TiO2 nanotubes, without plasmonic bimetallic nanoparticles, present low hydrogen generation rates under the same conditions (Figure 5a). The nanoparticles on the nanotube surface can facilitate the capture of electrons responsible for hydrogen production. Furthermore, it can absorb light in the visible region due to the effect of plasmon resonance, which can generate charge dissipation in the conduction band of the nanotubes, improving charge transfer. This system is intensified in the presence of bimetallic nanoparticles.71-73 Three cycles of sample reuse were performed, and we did not observe significant variation in activity. We use glycerol as a sacrificial agent, however, the process of photo reform of glycerol occurs slowly concerning the generation of H2, this behavior is attributed to the absence of energetic holes, which are evidenced only in nanoparticles of ca. 2 nm, contrary to the hot electrons reported in nanoparticles SPR < 30 nm3.74,75 Glycerol can act by filling holes in the semiconductor valence band, generated in the water splitting reaction, making electron recombination difficult.76,77 Thus, the results obtained are promising, as they were carried out under controlled incident radiation. Similar results can be obtained by exposing the material directly to the sun. In the high-metal-content sample, a decrease in photocatalytic activity is observed due to surface passivation of the nanotubes.39
CONCLUSIONS
This work demonstrated that TiO2 nanotubes, synthesized by the hydrothermal method and subsequently calcined, were satisfactorily obtained, as shown in the TEM images. It was also verified that the deposition-precipitation method was satisfactory for depositing metallic nanoparticles on the support surface, thereby making the materials plasmonic. With bimetallic nanoparticles, changes in their optical, morphological, and structural properties were observed, with these changes substantially reflected in hydrogen production, their catalytic focus. AuPd-TiO2 nanotubes showed the best results in production. In addition, other properties of the material were explored to obtain better results than those synthesized in previous works by the group. Among them: lamellar nanotubular morphology that has a larger surface area, with greater availability of active sites for better light absorption, since with the adsorption of plasmonic metals, there was a decrease in the band gap, adequate size of the nanoparticles, all of which further contribute to photocatalytic activity. These material improvements do not concern the individual properties of the added metals but their synergy. It is worth noting that the hydrogen production results for the other samples are also active. Based on the results, it can be inferred that the plasmonic bimetallic nanoparticles supported on TiO2 nanotubes are feasible for hydrogen production. The unique characteristics of these materials allow their effects to be evaluated, with potential for continued application in future.
SUPPLEMENTARY MATERIAL
Complementary material for this study is available at http://quimicanova.sbq.org.br/, as a PDF file, with free access.
ACKNOWLEDGMENTS
The authors acknowledge financial support from CNPq and the technical support of the Center for Strategic Technology of the Northeast (CETENE). In special, grants CNPq-405334/2021-4 (Universal).
DATA AVAILABILITY STATEMENT
All data generated or analyzed during this study are included in this published article.
REFERENCES
-
1 Griffiths, S.; Sovacool, B. K.; Kim, J.; Bazilian, M.; Uratani, J. M.; Energy Research & Social Science 2021, 80, 102208. [Crossref]
» Crossref -
2 Fiorio, J. L.; Gothe, M. L.; Kohlrausch, E. C.; Zardo, M. L.; Tanaka, A. A.; de Lima, R. B.; da Silva, A. G. M.; Garcia, M. A. S.; Vidinha, P.; Machado, G.; Hydrogen 2022, 3, 218. [Crossref]
» Crossref -
3 Arifin, K.; Yunus, R. M.; Minggu, L. J.; Kassim, M. B.; Int. J. Hydrogen Energy 2021, 46, 4998. [Crossref]
» Crossref -
4 Li, Y.; Sun, Q.; Li, P.; Wan, Z.; Liu, S.; Wang, Z.; Liu, J.; Li, L.; Deng, G.; Yang, M.; Catal. Lett. 2024, 154, 1839. [Crossref]
» Crossref -
5 Li, R.; Li, C. In Advances in Catalysis, vol. 60; Song, C., ed.; Elsevier, 2017, p. 1-57. [Crossref]
» Crossref -
6 Teng, J.; Li, W.; Wei, Z.; Hao, D.; Jing, L.; Liu, Y.; Dai, H.; Zhu, Y.; Ma, T.; Deng, J.; Angew. Chem., Int. Ed. 2024, 63, e202416039. [Crossref]
» Crossref -
7 Xie, Z.-H.; Ye, G.; Gong, H.; Murugan, P.; Lang, C.; Dai, Y.-F.; Yang, K.; Liu, S.-Y.; Chem. Sci. 2025, 16, 9998. [Crossref]
» Crossref -
8 Chen, X.; Shen, S.; Guo, L.; Mao, S. S.; Chem. Rev. 2010, 110, 6503. [Crossref]
» Crossref -
9 B., A.; A., J.; Rao, A. S.; Nagarkar, S. S.; Dutta, A.; Duttagupta, S. P.; Prabhu, S. S.; Pinto, R.; Int. J. Hydrogen Energy 2024, 81, 1442. [Crossref]
» Crossref -
10 Fujishima, A.; Honda, K.; Nature 1972, 238, 37. [Crossref]
» Crossref -
11 Martins, N. J.; Barbosa, L. R. S.; Cota, V. E. P.; Mourão, H. A. J. L.; Quim. Nova 2022, 45, 594. [Crossref]
» Crossref -
12 Ullah, F.; Ghani, U.; Saheed, M. S. M.; Int. J. Hydrogen Energy 2023, 48, 39866. [Crossref]
» Crossref -
13 Sekhar, Y. C.; Raghavendra, P.; Maiyalagan, T.; Loka, S. S.; Int. J. Hydrogen Energy 2022, 47, 40407. [Crossref]
» Crossref -
14 Reghunath, S.; Pinheiro, D.; KR, S. D.; Applied Surface Science Advances 2021, 3, 100063. [Crossref]
» Crossref -
15 Rodríguez-González, V.; Obregón-Alfaro, S.; Lozano-Sánchez, L. M.; Lee, S.-W.; J. Mol. Catal. A: Chem. 2012, 353-354, 163. [Crossref]
» Crossref -
16 Kumar, M.; Singh, N. K.; Kumar, R. S.; Singh, R. In Towards Sustainable and Green Hydrogen Production by Photocatalysis: Insights into Design and Development of Efficient Materials, vol. 2; Kumar, A., ed.; ACS Publications: Washington, 2024, ch. 1. [Crossref]
» Crossref -
17 Ren, P.; Song, M.; Lee, J.; Zheng, J.; Lu, Z.; Engelhard, M.; Yang, X.; Li, X.; Kisailus, D.; Li, D.; Adv. Mater. Interfaces 2019, 6, 1901121. [Crossref]
» Crossref -
18 Kuo, H.-L.; Kuo, C.-Y.; Liu, C.-H.; Chao, J.-H.; Lin, C.-H.; Catal. Lett. 2007, 113, 7. [Crossref]
» Crossref -
19 Warren, S. C.; Thimsen, E.; Energy Environ. Sci. 2012, 5, 5133. [Crossref]
» Crossref -
20 Hong, L.; Xu, H.; Zhu, Y.; Li, Z.; Bai, B.; Ding, G.; Catal. Lett. 2023, 153, 2296. [Crossref]
» Crossref -
21 Yu, H.; Li, S.; Peng, S.; Yu, Z.; Chen, F.; Liu, X.; Guo, J.; Zhu, B.; Huang, W.; Zhang, S.; Int. J. Hydrogen Energy 2023, 48, 975. [Crossref]
» Crossref -
22 Yang, Y. Z.; Chang, C.-H.; Idriss, H.; Appl. Catal., B 2006, 67, 217. [Crossref]
» Crossref -
23 Schuller, J. A.; Barnard, E. S.; Cai, W.; Jun, Y. C.; White, J. S.; Brongersma, M. L.; Nat. Mater. 2010, 9, 193. [Crossref]
» Crossref -
24 de Oliveira, R.; Martini, W. S.; Sant’Ana, A. C.; Environ. Nanotechnol., Monit. Manage. 2022, 17, 100657. [Crossref]
» Crossref -
25 Boltasseva, A.; Atwater, H. A.; Science 2011, 331, 290. [Crossref]
» Crossref -
26 Catchpole, K. R.; Polman, A.; Appl. Phys. Lett. 2008, 93, 191113. [Crossref]
» Crossref -
27 Jang, J. S.; Choi, S. H.; Kim, H. G.; Lee, J. S.; J. Phys. Chem. C 2008, 112, 17200. [Crossref]
» Crossref -
28 Meng, A.; Zhang, L.; Cheng, B.; Yu, J.; Adv. Mater. 2019, 31, 1807660. [Crossref]
» Crossref -
29 Mallikarjuna, K.; Kim, H.; Colloids Surf., A 2017, 535, 194. [Crossref]
» Crossref -
30 Sytwu, K.; Vadai, M.; Dionne, J. A.; Adv. Phys.: X 2019, 4, 1619480. [Crossref]
» Crossref -
31 Wang, Q.; Lu, X.; Zhen, Y.; Li, W.; Chen, G.; Yang, Y.; J. Chem. Phys. 2018, 149, 244307. [Crossref]
» Crossref -
32 Costa, J. C. S.; Franco, N.; Soares, T. A. S.; Saraiva, N. A. M.; Garcia, M. A. S.; Gonzalez, J. R.; Machado, G.; An. Acad. Bras. Cienc. 2020, 92, e20200504. [Crossref]
» Crossref -
33 Marques, T. M. F.; Morais, R. N.; Nobre, F. X.; Rocha, J. M.; Ghosh, A.; Soares, T. A. S.; Viana, B. C.; Machado, G.; Costa, J. C. S.; de Matos, J. M. E.; An. Acad. Bras. Cienc. 2019, 91, e20190082. [Crossref]
» Crossref -
34 Ge, M.; Li, Q.; Cao, C.; Huang, J.; Li, S.; Zhang, S.; Chen, Z.; Zhang, K.; Al-Deyab, S. S.; Lai, Y.; Adv. Sci. 2017, 4, 1600152. [Crossref]
» Crossref -
35 Cai, J.; Huang, J.; Ge, M.; Lai, Y. In Multifunctional Photocatalytic Materials for Energy; Lin, Z.; Ye, M.; Wang, M., eds.; Elsevier, 2018, p. 237. [Crossref]
» Crossref -
36 Ferreira, O. P.; Souza Filho, A. G.; Mendes Filho, J.; Alves, O. L.; J. Braz. Chem. Soc. 2006, 17, 393. [Crossref]
» Crossref -
37 Schwengber, C. A.; Alves, H. J.; Schaffner, R. A.; da Silva, F. A.; Sequinel, R.; Bach, V. R.; Ferracin, R. J.; Renewable Sustainable Energy Rev. 2016, 58, 259. [Crossref]
» Crossref -
38 Zhang, L.; Lin, H.; Wang, N.; Lin, C.; Li, J.; J. Alloys Compd. 2007, 431, 230. [Crossref]
» Crossref -
39 Enachi, M.; Guix, M.; Braniste, T.; Postolache, V.; Ciobanu, V.; Ursaki, V.; Schmidt, O. G.; Tiginyanu, I.; Surface Engineering and Applied Electrochemistry 2015, 51, 3. [Crossref]
» Crossref -
40 da Silva, J. M.; Sousa, R. C.; Costa, J. C. S.; Magalhães, J. L.; Luz Jr., G. E.; de Moura, C. V. R.; de Moura, E. M.; Catal. Lett. 2022, 152, 585. [Crossref]
» Crossref -
41 Kim, S.-J.; Yun, Y.-U.; Oh, H.-J.; Hong, S. H.; Roberts, C. A.; Routray, K.; Wachs, I. E.; J. Phys. Chem. Lett. 2010, 1, 130. [Crossref]
» Crossref -
42 Kim, G.-S.; Ansari, S. G.; Seo, H.-K.; Kim, Y.-S.; Shin, H.-S.; J. Appl. Phys. 2007, 101, 024314. [Crossref]
» Crossref -
43 Pótári, G.; Madarász, D.; Nagy, L.; László, B.; Sápi, A.; Oszkó, A.; Kukovecz, A.; Erdöhelyi, A.; Kónya, Z.; Kiss, J.; Langmuir 2013, 29, 3061. [Crossref]
» Crossref -
44 Xu, H.; Chen, J.; Li, Y.; Guo, X.; Shen, Y.; Wang, D.; Zhang, Y.; Wang, Z.; Sci. Rep. 2017, 7, 2960. [Crossref]
» Crossref -
45 Nayak, S.; Sahoo, B.; Chaki, T. K.; Khastgir, D.; RSC Adv. 2014, 4, 1212. [Crossref]
» Crossref -
46 Zwijnenburg, A.; Goossens, A.; Sloof, W. G.; Crajé, M. W. J.; van der Kraan, A. M.; de Jongh, L. J.; Makkee, M.; Moulijn, J. A.; J. Phys. Chem. B 2002, 106, 9853. [Crossref]
» Crossref -
47 Khawaji, M.; Chadwick, D.; Catal. Sci. Technol. 2018, 8, 2529. [Crossref]
» Crossref -
48 Brun, M.; Berthet, A.; Bertolini, J. C.; J. Electron Spectrosc. Relat. Phenom. 1999, 104, 55. [Crossref]
» Crossref -
49 Kiss, J.; Pusztai, P.; Óvári, L.; Baán, K.; Merza, G.; Erdöhelyi, A.; Kukovecz, A.; Kónya, Z.; e-J. Surf. Sci. Nanotechnol. 2014, 12, 252. [Crossref]
» Crossref -
50 Wesley, T. S.; Hülsey, M. J.; Westendorff, K. S.; Lewis, N. B.; Crumlin, E. J.; Román-Leshkov, Y.; Surendranath, Y.; Chem. Sci. 2023, 14, 7154. [Crossref]
» Crossref -
51 Jian, J.; Jiang, G.; van de Krol, R.; Wei, B.; Wang, H.; Nano Energy 2018, 51, 457. [Crossref]
» Crossref -
52 Ho, P. H.; Woo, J.-W.; Ilmasani, R. F.; Han, J.; Olsson, L.; Ind. Eng. Chem. Res. 2021, 60, 6596. [Crossref]
» Crossref -
53 Moakhar, R. S.; Jalali, M.; Kushwaha, A.; Goh, G. K. L.; Riahi-Noori, N.; Dolati, A.; Ghorbani, M.; J. Appl. Electrochem. 2018, 48, 995. [Crossref]
» Crossref -
54 Xu, C.; Hao, Q.; Duan, H.; J. Mater. Chem. A 2014, 2, 8875. [Crossref]
» Crossref -
55 Leofanti, G.; Padovan, M.; Tozzola, G.; Venturelli, B.; Catal. Today 1998, 41, 207. [Crossref]
» Crossref -
56 Thommes, M.; Kaneko, K.; Neimark, A. V.; Olivier, J. P.; Rodriguez-Reinoso, F.; Rouquerol, J.; Sing, K. S. W.; Pure Appl. Chem. 2015, 87, 1051. [Crossref]
» Crossref -
57 Labani, M. M.; Rezaee, R.; Saeedi, A.; Al Hinai, A.; J. Pet. Sci. Eng. 2013, 112, 7. [Crossref]
» Crossref -
58 Dostanić, J.; Lončarević, D.; Pavlović, V. B.; Papan, J.; Nedeljković, J. M.; Ceram. Int. 2019, 45, 19447. [Crossref]
» Crossref -
59 Bavykin, D. V.; Parmon, V. N.; Lapkin, A. A.; Walsh, F. C.; J. Mater. Chem. 2004, 14, 3370. [Crossref]
» Crossref -
60 Yu, J.; Yu, H.; Cheng, B.; Trapalis, C.; J. Mol. Catal. A: Chem. 2006, 249, 135. [Crossref]
» Crossref -
61 Ferreira, V. C.; Nunes, M. R.; Silvestre, A. J.; Monteiro, O. C.; Mater. Chem. Phys. 2013, 142, 355. [Crossref]
» Crossref -
62 Kelly, K. L.; Coronado, E.; Zhao, L. L.; Schatz, G. C.; J. Phys. Chem. B 2003, 107, 668. [Crossref]
» Crossref -
63 El Rouby, W. M. A.; Comesaña-Hermo, M.; Testa-Anta, M.; Carbó Argibay, E.; Salgueiriño, V.; Pérez-Lorenzo, M.; Correa-Duarte, M. A.; J. Phys. D: Appl. Phys. 2017, 50, 144002. [Crossref]
» Crossref -
64 Tang, Z.-R.; Yin, X.; Zhang, Y.; Xu, Y.-J.; Inorg. Chem. 2013, 52, 11758. [Crossref]
» Crossref -
65 Vempati, S.; Kayaci-Senirmak, F.; Ozgit-Akgun, C.; Biyikli, N.; Uyar, T.; RSC Adv. 2015, 5, 82977. [Crossref]
» Crossref -
66 Min, Y.; Wang, Y.; Front. Chem. 2020, 8, 411. [Crossref]
» Crossref -
67 Zhang, S.; Li, M.; Zhao, J.; Wang, H.; Zhu, X.; Han, J.; Liu, X.; Appl. Catal., B 2019, 252, 24. [Crossref]
» Crossref -
68 Matsubara, K.; Inoue, M.; Hagiwara, H.; Abe, T.; Appl. Catal., B 2019, 254, 7. [Crossref]
» Crossref -
69 Nalajala, N.; Salgaonkar, K. N.; Chauhan, I.; Mekala, S. P.; Gopinath, C. S.; ACS Appl. Energy Mater. 2021, 4, 13347. [Crossref]
» Crossref -
70 Kunthakudee, N.; Puangpetch, T.; Ramakul, P.; Serivalsatit, K.; Hunsom, M.; Int. J. Hydrogen Energy 2022, 47, 23570. [Crossref]
» Crossref -
71 Panayotov, D. A.; Frenkel, A. I.; Morris, J. R.; ACS Energy Lett. 2017, 2, 1223. [Crossref]
» Crossref -
72 Sang, L.; Yu, Z.; Wang, C.; Zhao, Y.; Int. J. Hydrogen Energy 2023, 48, 12215. [Crossref]
» Crossref -
73 Su, R.; Tiruvalam, R.; Logsdail, A. J.; He, Q.; Downing, C. A.; Jensen, M. T.; Dimitratos, N.; Kesavan, L.; Wells, P. P.; Bechstein, R.; Jensen, H. H.; Wendt, S.; Catlow, C. R. A.; Kiely, C. J.; Hutchings, G. J.; Besenbacher, F.; ACS Nano 2014, 8, 3490. [Crossref]
» Crossref -
74 Murdoch, M.; Waterhouse, G. I. N.; Nadeem, M. A.; Metson, J. B.; Keane, M. A.; Howe, R. F.; Llorca, J.; Idriss, H.; Nat. Chem. 2011, 3, 489. [Crossref]
» Crossref -
75 Paul, K. K.; Giri, P. K. In Encyclopedia of Interfacial Chemistry: Surface Science and Electrochemistry, 1st ed.; Wandelt, K., ed.; Elsevier: Amsterdam, 2018, p. 786. [Crossref]
» Crossref -
76 Luo, N.; Jiang, Z.; Shi, H.; Cao, F.; Xiao, T.; Edwards, P. P.; Int. J. Hydrogen Energy 2009, 34, 125. [Crossref]
» Crossref -
77 Strataki, N.; Bekiari, V.; Kondarides, D. I.; Lianos, P.; Appl. Catal., B 2007, 77, 184. [Crossref]
» Crossref
Edited by
-
Associate Editor handled this article:
Sibele B. C. Pergher