 Extreme hydrological and erosive processes during the April 2024 event: A small catchment-monitoring experience in southern Brazil
ABSTRACT
The extreme climatic event in southern Brazil underscores the hydro-sedimentological vulnerability of agricultural headwater catchments within the Jacuí River Basin. This article describes the hydrological and erosive processes that took place between April 29 and 30, 2024, in the Guarda Mor River experimental catchment (18.5 km2), located at the interface between the Basaltic Plateau and the Central Depression regions of Rio Grande do Sul. The hydrological event was monitored based on rainfall, streamflow, and suspended sediment concentration to characterize runoff generation and sediment transport. In addition, topographic and geospatial surveys were conducted to characterize hillslope erosion processes and morphological changes in the stream channel. The study of the behavior of this event allows for a more precise understanding of local water dynamics, enabling stakeholders to anticipate flood risks, manage water resources more efficiently, and design targeted conservation strategies. Over a 31-hour period, 435 mm of rainfall were recorded, resulting in multiple streamflow peaks, with the highest reaching approximately 700 m3 s-1, and an estimated suspended sediment yield of around 12,365 Mg. Numerous diffuse and concentrated erosion processes occurred simultaneously and extensively, aggravated by local geomorphological, pedological, and land-use characteristics. The results underscore the importance of hydrological monitoring in headwater catchments and the adoption of practices to control and reduce surface runoff. These findings are particularly relevant for the Southern region of Brazil, which is characterized by intensive agricultural activity, complex topography, and a high frequency of extreme weather events, including intense rainfall and prolonged droughts. In this context, headwater catchments play a critical role in regulating water flow, sediment transport, and nutrient cycling across larger river basins.
Keywords
hydrological monitoring; flash flood event; peak discharge; sediment yield
INTRODUCTION
Flash floods are most often caused by extremely heavy rainfall. However, it is essential to understand the processes of formation and propagation of surface runoff during extreme weather events (Fang et al., 2013; Werle et al., 2025; Bernardi et al., 2025), whether at the hillslope scale (Anderson and Brooks, 1996) or the catchment scale (Rose, 2004). Surface runoff occurs on hillslopes during a storm when the soil infiltration capacity is exceeded, and the excess precipitation surpasses the surface roughness storage. In this context, the formation of surface runoff is governed by infiltration and surface detention processes, while the propagation is determined by geomorphological features (e.g., slope and plane and profile curvatures) and soil surface characteristics (e.g., surface roughness and plant cover) (Kirkby, 1989). Depending on the volume and velocity of surface runoff, its propagation on hillslopes can trigger rill and gully erosion processes. On the other hand, runoff propagation in the fluvial channel, according to its stream flow power, may cause channel bed and bank erosion – an erosive process known as fluvial erosion (Charlton, 2009; Bernardi et al., 2025).
The generation and propagation of runoff in response to rainfall can be evaluated through hydrograph analysis. The shapes of a hydrograph reflect hydrologic factors such as precipitation patterns (intensity and duration), soil properties associated with infiltration, and soil surface conditions (roughness associated with plant cover and crop residue). These factors can either reduce or increase the volume and velocity of runoff (Parsons and Abrams, 1992; Tucci and Clarke, 1997). However, to obtain hydrographs, it is necessary to monitor the phenomena at both the hillslope (Merten et al., 2015; Londero et al., 2021a; Koppe et al., 2022; Barbosa et al., 2023) and catchment scales (Minella et al., 2014; Menezes et al., 2020). Hydrograph analysis provides a clear understanding of how factors influencing the generation, propagation, and attenuation of surface runoff are influenced by land use, soil management, and soil and water conservation practices (Schneider et al., 2025).
Although soil topography is an intrinsic landscape factor, land use and soil management strongly influence surface runoff characteristics and the associated erosion and sedimentation processes (Toy et al., 2002; Morgan, 2005; Boardman, 2015). How soils are managed affects surface roughness and the physical-hydraulic properties of the soil profile, significantly altering infiltration and runoff propagation processes, as previously mentioned. Therefore, agricultural practices (soil tillage, crop, and water management) amplify or attenuate the potential damage caused by storm-runoff events. This is especially important in headwater catchments in southern Brazil, where agricultural activity occupies a considerable portion of the runoff-forming areas (Didoné et al., 2014; Robinet et al., 2018; Dambroz et al., 2022; Minella et al., 2022; Barros et al., 2023).
On April 29 and 30, 2024, the state of Rio Grande do Sul (RS), Brazil, was hit by the largest precipitation event observed in Brazil in recent decades (Collischonn et al., 2024). The April 2024 rainfall event triggered a massive climate catastrophe and serves as an example of the kind of extreme event caused by climate change that the southern region of Brazil is facing (Teixeira and Prieto, 2002; Cardoso et al., 2020). Landslides, debris flows, flash floods, and floods affected more than 80 % of the municipalities of the state, with over 2 million people impacted. In addition to the economic and infrastructure damage in the capital and inland cities, the impacts on rural areas were immeasurable and caused irreparable losses (RS/SDR, 2024).
Based on a hydrological monitoring study, we addressed the repercussions of the extreme event in an experimental agricultural catchment in central RS, describing the hydrological and erosive phenomena triggered by the rainfall. Given the importance of hydrologic monitoring for understanding the impacts of storm runoff on hydrological and erosive processes in headwater catchments, this study reports an exceptional storm runoff event that occurred in April 2024 in the Guarda Mor River experimental catchment. The catchment is located in the transition between the Southern Plateau and the Central Depression regions of the state of Rio Grande do Sul. This study aims to describe the hydrological and erosional processes observed during this exceptional storm-runoff event. Additionally, this article discusses the main factors that contributed to the amplification of this geoenvironmental disaster.
MATERIALS AND METHODS
Study site
The Guarda Mor River experimental catchment is located in the central region of Rio Grande do Sul (RS), encompassing the municipalities of Ivorá, São João do Polêsine, Silveira Martins, and Júlio de Castilhos. From a geomorphological perspective, the catchment lies in the transition between the Southern Plateau and the Central Depression, including the plateau escarpment, which features a steep topographic gradient (slope). The catchment has a drainage area of 18.5 km² and elevations ranging from 197 to 511 m a.s.l. Guarda Mor River is a tributary of the Soturno River, which in turn flows into the Jacuí River – the main tributary of the Guaíba Lake hydrographic region, where the metropolitan area of Porto Alegre, the capital of RS, is located (Figure 1).

Location of the Guarda Mor River experimental catchment within the Jacuí River catchment, in Rio Grande do Sul State, Southern Brazil, along with the Digital Elevation Model highlighting the significance of the edge of the plateau.
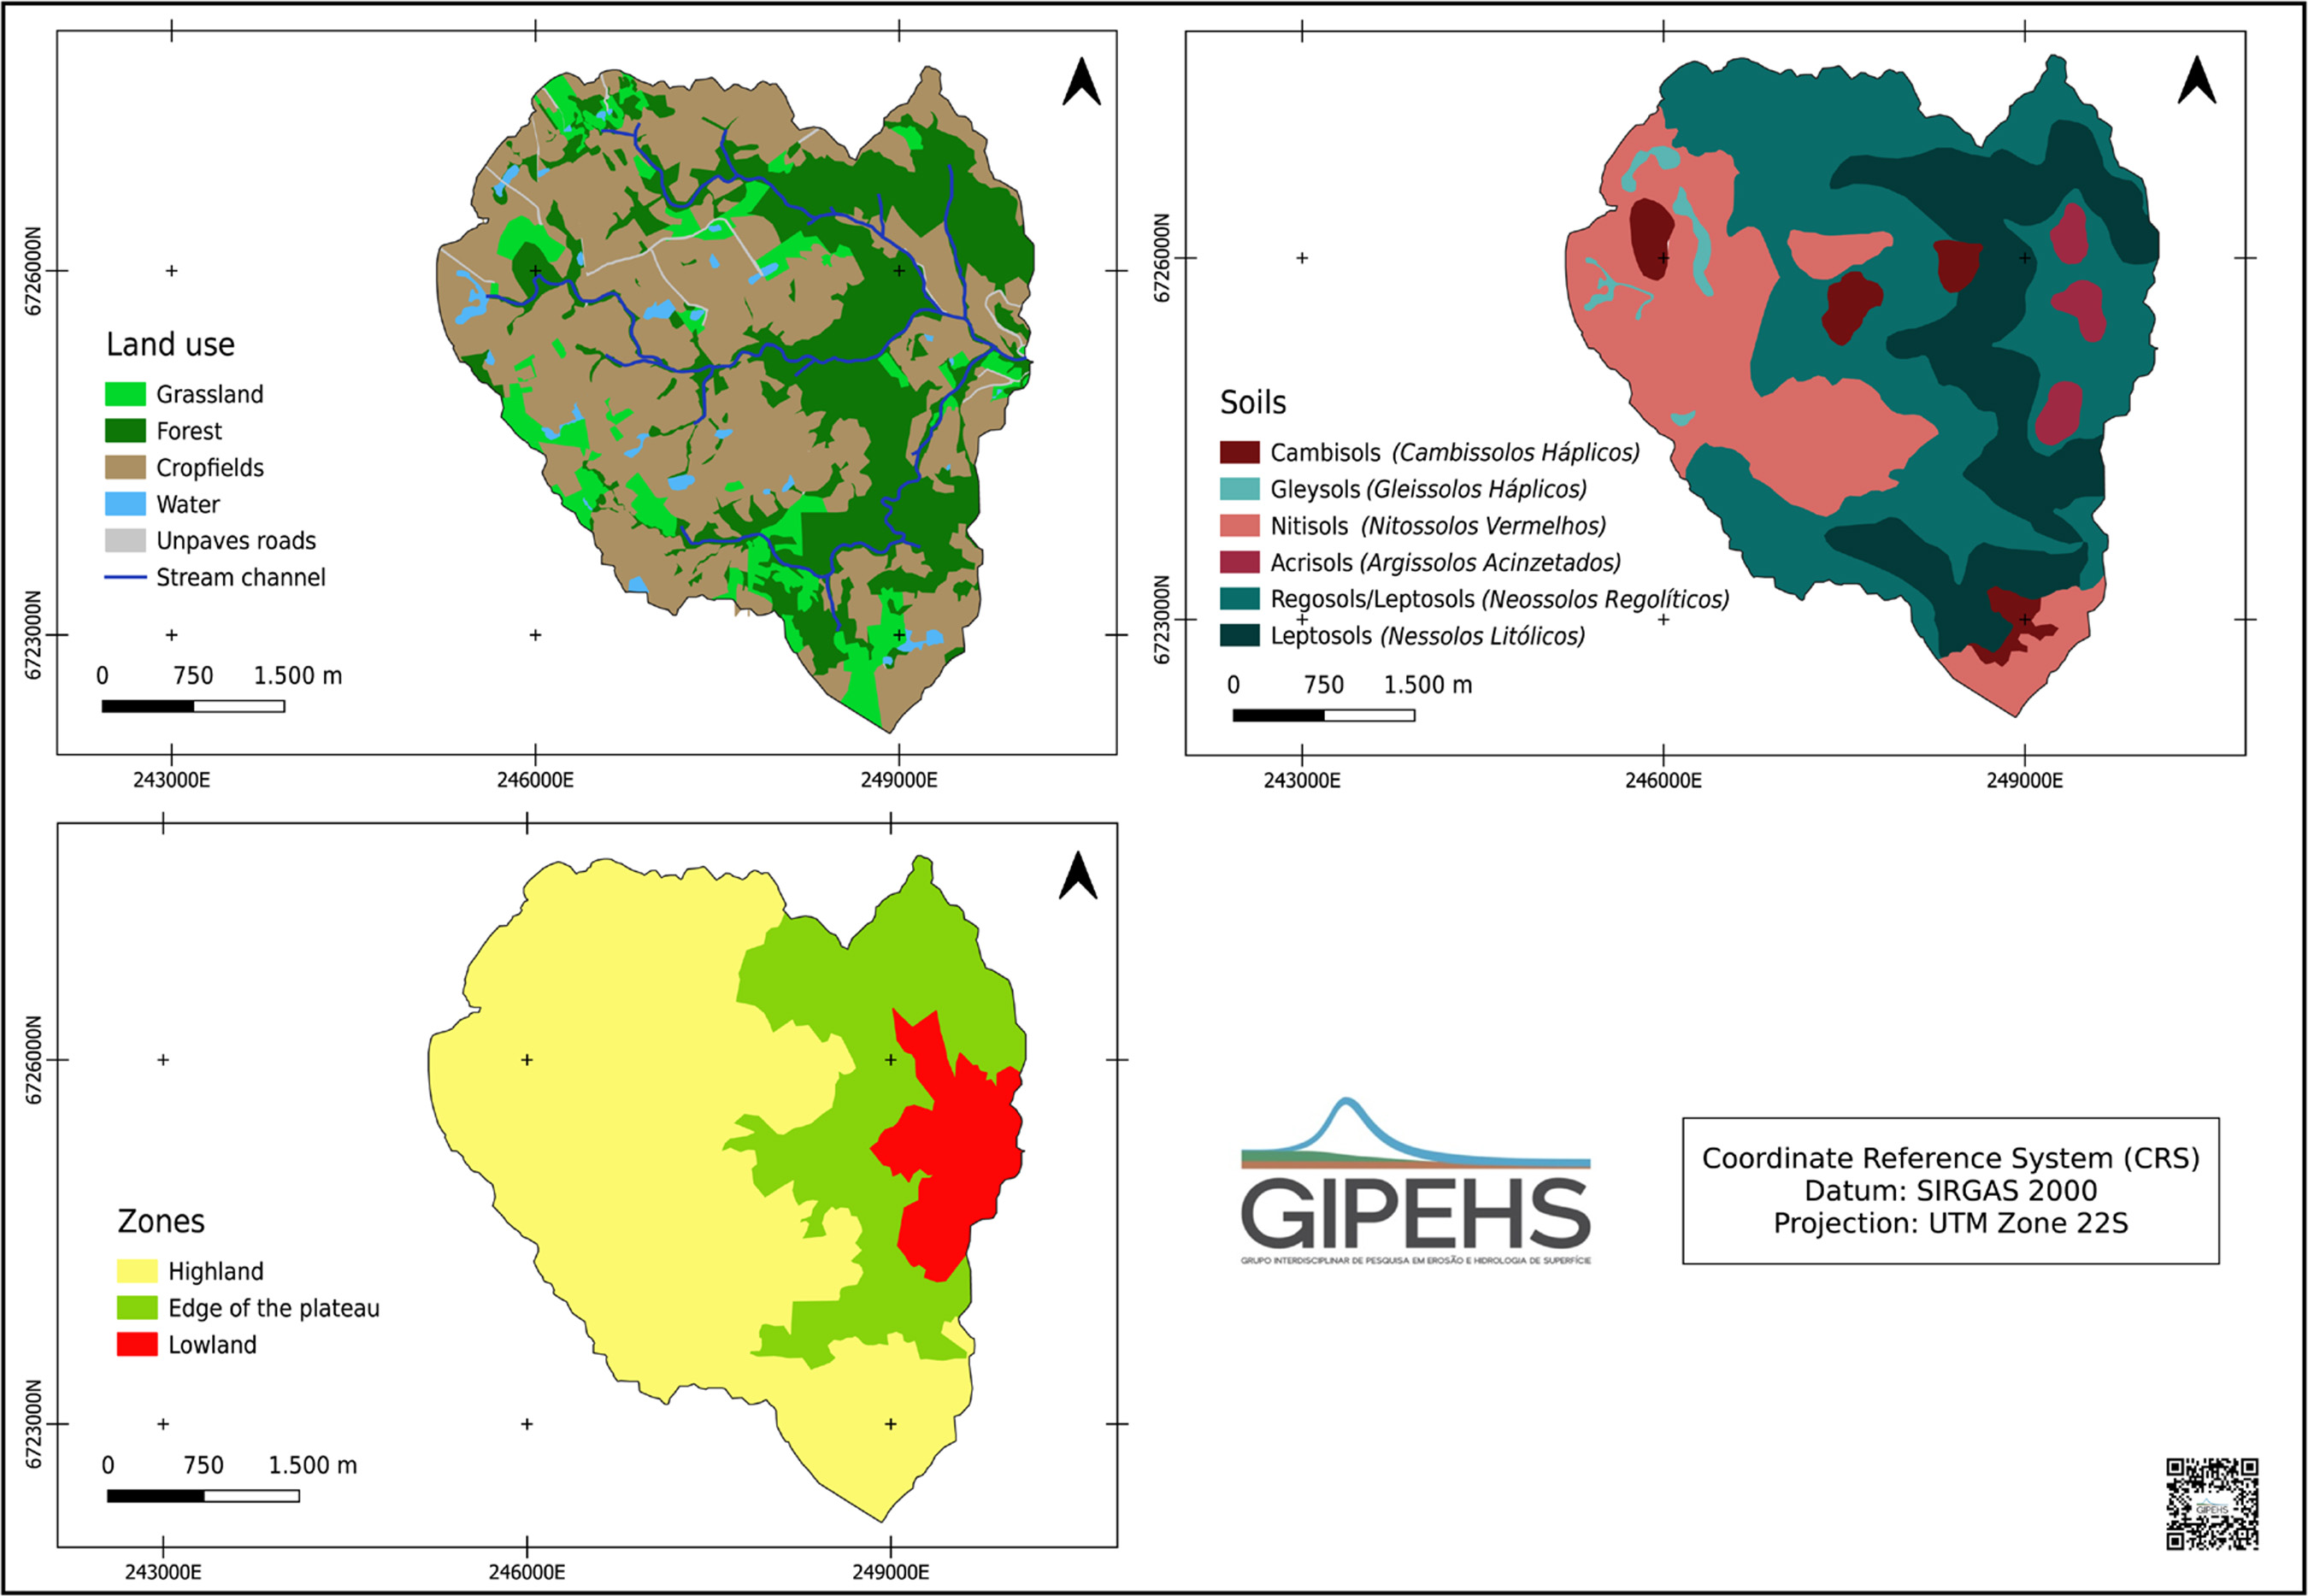
The lithology of the catchment is divided between volcanic rocks, covering 87.46 % of the total area – composed of rhyodacite and basalt from the Serra Geral Formation – and sedimentary rocks, which make up 12.54 % of the area and consist of sandstones from the Botucatu and Caturrita Formations. Geomorphologically, the catchment can be subdivided into three distinct regions: (i) Southern Plateau (Highland), 66 % of the total area; (ii) Plateau Escarpment (Edge of the Plateau), 25 % of the area; and (iii) Central Depression (Lowland), which accounts for 9 % of the catchment area (Figure 2). In the Highland, slopes range from 5-10 %; by the Edge of the Plateau, they exceed 75 %; and in the Lowland, slopes range between 2 and 45 %. Soils in the Highland include Neossolos Regolíticos (Regosols), Nitossolos Vermelhos (Nitisols), Cambissolos Háplicos (Cambisols), and Gleissolos Háplicos (Gleysols). The Edge of the Plateau region is dominated by Neossolos Litólicos (Leptosols) and Regolíticos (Regosols). In the Lowland, Argissolos Acinzentados (Acrisols) and Neossolos Regolíticos (Regosols) are predominant (Figure 2).

Map of geomorphological regions (a), soil types (b), and land-use (c) in the Guarda Mor River experimental catchment.
The climate in the region is subtropical, classified as Cfa 2 according to Köppen (1931), with an average annual rainfall of approximately 1,700 mm. Higher magnitude rainfall events typically occur during autumn and spring (Diaz et al., 1998), while droughts are frequent during the summer. Considering the potential evapotranspiration (PET) calculated for the nearby Vacacaí River catchment, the annual average ranges from 810 to 990 mm (Buriol et al., 2021). Potential evapotranspiration (PET) peaks between October (60 mm) and January (145 mm), reaching its minimum during June and July (28 and 34 mm, respectively). In May, average PET ranges from 42 to 48 mm in the Vacacaí River catchment (Buriol et al., 2021). Land use includes crop fields (42.46 %), forests (41.81 %), pastures (11.81 %), roads (1.99 %), urban or paved areas (1.03 %), and water bodies (0.9 %). Forested areas are concentrated on the Edge of the Plateau (Figure 2). Crop fields are managed under no-till (a farming method in which crops are grown without disturbing the soil through tillage), with soybeans in the summer and wheat/oats in the winter. Further details can be found in the studies of Dambroz (2020, 2024), Bernardi (2022), and Werle (2024).
Hydrological monitoring
Hydrological monitoring in this catchment began in 2020, intending to describe the impact of agricultural land use and management on the hydrological and sedimentological dynamics in the region by the edge of the Rio Grande do Sul Plateau (Dambroz et al., 2022, 2025; Bernardi et al., 2025; Werle et al., 2025). The studies are based on the behavior of hydrographs and sediment graphs during significant storm-runoff events, as a function of land-use and soil-management characteristics in the catchment. While rainfall, streamflow, and water quality parameters are measured automatically, manual monitoring is conducted for suspended sediment concentration (SSC) and bedload transport, which are defined as having a return period greater than 0.5 years. Measurements are taken from a metal walkway facility built over a cross-section of the main river (Figure 3).

Monitoring section of the Guarda Mor River experimental catchment, illustrating landscape conditions before (left) and after (right) the extreme storm-runoff event of April 2024. The images highlight significant changes in channel morphology, sediment deposition, and vegetation cover resulting from the high-intensity rainfall and associated hydrological response.
This study examines the period from 09:00 am on April 29 to 03:00 pm on April 30, 2024, during which the highest rainfall volumes were recorded. The threshold was based on a rainfall duration of 30 h and a magnitude of 435 mm. This period produced multiple streamflow peaks, resulting in varied effects on erosive processes and sediment yield. Rainfall was monitored at two locations – one in the Lowland area of the catchment (near the outlet), and another in the Highland. At both sites, rainfall was recorded using a tipping bucket rain gauge and a manual rain gauge operated by a local observer. The tipping bucket gauges recorded rainfall data at 5-minute intervals, while manual gauges were read daily at 07:00 am. Streamflow was monitored using a water level sensor (Campbell CR451) at 5-minute intervals, and the flow rates were estimated using a stage-discharge rating curve (Bernardi, 2022). Automatic streamflow monitoring continued as normal until 02:05 am on April 30, 2024, when the flooding removed the logger support structure and staff gauges. From this moment onward, water level measurements were taken manually every 30 min using markings on a masonry structure located 40 m downstream from the monitoring section. The manually recorded levels were transferred to the main monitoring section and converted to streamflow. Based on hydrograph analysis, surface runoff was separated from total streamflow using the constant baseflow method (Chow, 1964; Chin, 2020). The runoff coefficient was estimated, indicating the proportion of rainfall volume converted into surface flow volume.
Suspended sediment samples were collected using a US D-49 depth-integrating suspended-sediment sampler, with one sample taken from the middle of the walkway facility section, until 01:00 am on April 30, 2024. After that time, due to the risk of accessing the walkway facility, samples were collected from the edge of the river right bank using a US DH-48 depth-integrating suspended-sediment sampler. Samples were analyzed in the laboratory to determine SSC using the evaporation method (Shreve and Downs, 2005). Based on continuous streamflow and SSC data, suspended sediment discharge and suspended sediment yield were estimated. We attempted to measure the bedload discharge using the Helley-Smith sampler. However, it was impossible due to the high flow velocity, which prevented the equipment from stabilizing, as well as the significant risk involved. We assume the total stream sediment discharge reported in this study is underestimated, given the significant contribution of bedload transport.
Survey of hillslope erosive processes
We employed different sources of information and strategies to describe the erosive processes observed on the catchment hillslopes. It is important to note that the event occurred shortly after soybean harvest, when fields are highly susceptible to surface runoff due to the minimal amount of plant residue left on the soil surface.
Mapping of landslide and debris flows was carried out through 2-m resolution satellite imagery from the Planet Scope provider (Planet Labs PBC, 2024), with images analyzed for the period between April 19 and May 6, 2024 (before and after the event, respectively), using the software QGIS (QGIS Development Team, 2024). Deep and shallow rills were identified from aerial images collected over 46 ha of the catchment on August 24, 2024, using a Remotely Piloted Aircraft System (RPAS). The drone model was a Phantom 4 PRO with a 20-megapixel RGB camera. The flight was conducted at 120 m above ground level (AGL), resulting in a spatial resolution of 3.4 cm pixel-1. These images were processed using the software Agisoft Metashape Professional version 1.8.4 64-bit (www.agisoft.com), generating a digital elevation model (DEM) with a resolution of 0.5 m.
To evaluate erosive processes on catchment hillslopes (diffuse and concentrated erosion), field surveys were conducted across all affected areas (roads and crop fields) to identify erosion types and their magnitudes. For diffuse erosion (interrill and rill), each field was evaluated and assigned a severity class based on evidence of surface sealing, rill formation, and deposition zones. This empirical field assessment classified each field according to a severity criterion (low, medium, or high diffuse erosion; gullies, and landslides).
Planimetric topographic survey of the stream channel
The impact of the extreme rainfall-runoff event was also assessed with respect to fluvial erosion processes affecting the stream bed and banks. . A planimetric topographic survey was conducted by the Laboratory of Spatial Geodesy (LaGE) at the Department of Rural Engineering (DER) of Federal University of Santa Maria (UFSM), over a 130-m stretch upstream and a few meters downstream of the monitoring section. The objective was to assess and visualize morphological changes in this channel section compared with a previous 2021 survey (Bernardi, 2022). To determine the absolute and relative positions, as well as the dimensions, of channel and bank features, georeferenced topographic surveys were conducted in both periods. The first campaign took place in April 2021, characterizing the river and its surroundings before the extreme event, while the second was conducted between May and November 2024 following the hydrological disaster. The planimetric coordinates were referenced to the official datum of the Brazilian Geodetic System, SIRGAS2000, using the UTM (E, N) coordinate system in meters. The altimetric component was referenced to the official Brazilian altimetric datum in Imbituba/SC. In the 2021 campaign, more than 2,500 points were surveyed, while in 2024 just over 2,100 were. To ensure proper georeferencing, reference points – stations – were established, where the measuring instruments were set up. In total, six stations were used across the two campaigns. Initially, each station point was georeferenced using geodetic tracking with GNSS (Global Navigation Satellite System) receivers, employing the static method with observations over several hours. Polaris S100 and RTK App receivers were used. The tracking data was post-processed using the Precise Point Positioning (PPP) technique via the public online IBGE application (www.ibge.gov.br/geociencias).
Based on the georeferenced station points, the geometric survey was performed using polar coordinates (irradiation method), with a total station, a conventional optical-electronic instrument known as an electronic tachometer. A prism was positioned at each point of interest, allowing measurements to be taken from the reference stations. The collected data were then pre-filtered and organized into files for generating products, such as three-dimensional visualizations, profiles, area, and volume calculations. The data were processed in GeoOffice to create Digital Terrain Models (DTMs). Subsequently, the channel geomorphology volume was generated for both periods, enabling a comparative analysis of channel morphology before (2021) and after the flood (2024). Further details of this survey are presented in Bernardi et al. (2025) and Feyh (2026).
RESULTS
Rainfall
Table 1 presents the measured daily rainfall (recorded at 7:00 am) at the Ivorá Monastery (Carthusian Monks), which corresponds to the rain gauge measurements in the Highlands. In April and May 2024, the accumulated rainfall reached 1,391 mm, representing 82 % of the region average annual precipitation. During the three most critical days of the event (from 7:00 am on April 29 to 7:00 am May 2, 2024), 718 mm were recorded, equivalent to 42 % of the region average annual precipitation total.
Daily rainfall in the Guarda-Mor River experimental catchment (Highland region) during April and May 2024. Data represent 24-h accumulated precipitation measured daily at 07:00 am
Figure 4 illustrates the most critical period of surface runoff formation and erosive processes. A cumulative rainfall of 435 mm was recorded over 31 h, from 9:00 am on April 29 to 03:00 pm on April 30, 2024, based on the average of the two rain gauges (Highland and Lowland). Four distinct rainfall parts of the hyetograph occurred during this 31-hour window, strongly influencing the shape and magnitude of the subsequent hydrographs. The first part of the hyetograph, with 144 mm of rainfall between 09:00 am and 08:00 pm on April 29, 2024, was responsible for wetting the topsoil layers. The second part of the hyetograph, with 121 mm between 10:00 pm on April 29 and 06:00 a.m. on April 30, was responsible for an intense flash flood hydrograph. The third part of the hyetograph, with 169 mm after 07:00 am on April 30, was responsible for many landslides, a long hydrograph, and a huge sediment yield.
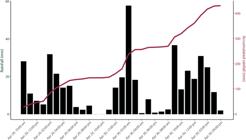
Temporal distribution of hourly rainfall (black bars) and accumulated rainfall (red-grey curve) during the critical phase of the extreme storm-runoff event in April 2024, as recorded within the Guarda Mor River experimental catchment, emphasizing the rapid accumulation that contributed to peak runoff and hydrological disruption.
Rainfall data recorded in the two tipping bucket rain gauges in the Highland and the Lowland areas show that the highest accumulated values over 15- and 30-minute intervals were 19 and 44 mm, respectively. For 1, 6, 12, and 24 h intervals, the maximum accumulations were 58, 148, 200, and 341 mm, respectively. The Highland, which corresponds to the plateau region, exhibited relatively higher values than the Lowland. In the Highland (Plateau), maximum intensity values for 10-, 30-, and 60-min intervals were 67, 88, and 115 mm h-1, respectively. In the Lowland (Central Depression), the maximum intensity values for the same intervals were 56, 74, and 106 mm h-1, respectively. Nevertheless, both sets of intensity values have high erosivity (a high capacity for rainfall to cause erosion). It is important to emphasize that the values recorded by the tipping bucket rain gauges were corrected using the daily values observed from the manual rain gauges.
Water discharge and sediment flux
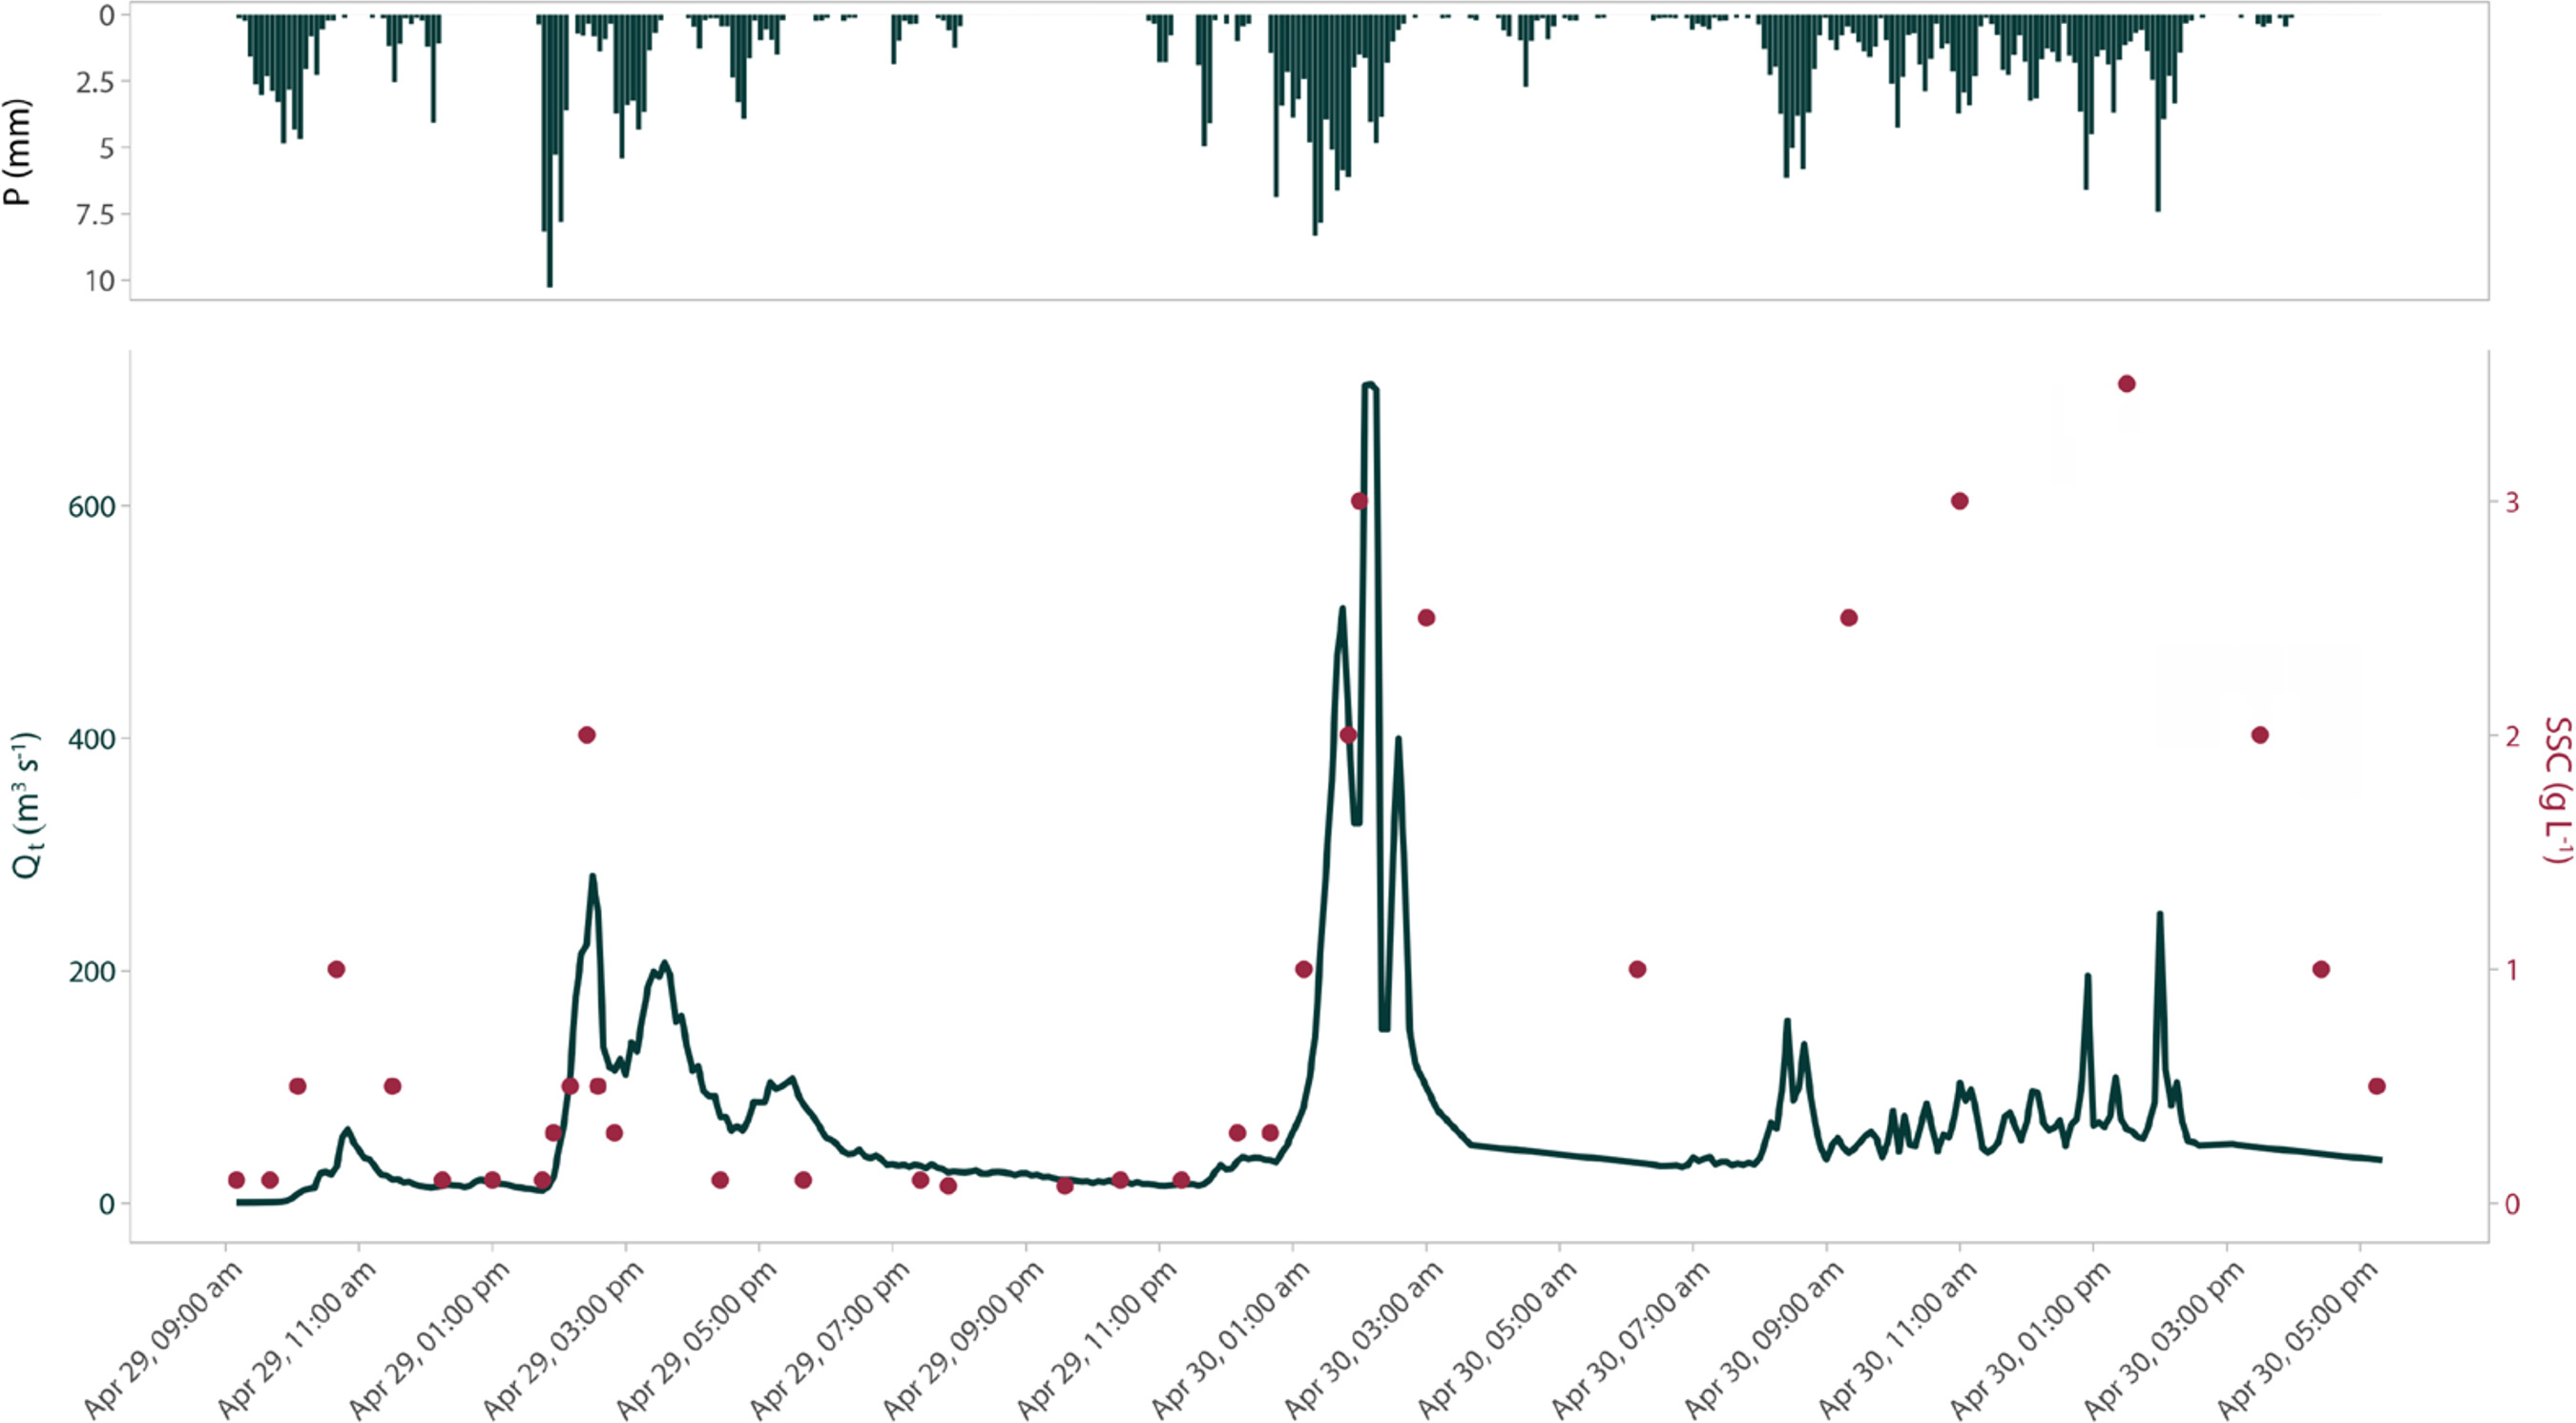
Four successive flood waves were observed during the critical period shown in figure 4, each with distinct responses regarding hydrograph shape and magnitude. The sequential occurrence of rainstorms over a 31-h window produced extraordinary streamflow magnitudes and, consequently, high sediment yield (Figure 5).

Hyetograph (P – black bars), hydrograph (Q – blue line), and suspended sediment concentration graph (SSC – red dots) for the Guarda Mor River experimental catchment during the critical hydrological period of April 29–30, 2024, highlighting the catchment dynamic behavior under extreme storm conditions.
The first event was the smallest in magnitude, but naturally important for establishing an initial condition of elevated soil moisture. Although it was relatively minor compared to those that followed, it still reached a notably high streamflow discharge considering the historical records for the catchment. The second event peak of 282 m3 s-1 was more than twice the highest discharges previously recorded since monitoring began. Prior peak annual discharges were 65 m3 s-1 (May 28, 2021), 57 m3 s-1 (July 14, 2022), and 177 m3 s-1 (November 12, 2023) (Bernardi et al., 2025; Werle et al., 2025), where the bankfull flow discharge is approximately 170 m3 s-1.
The third event produced the highest peak discharge, approximately 700 m3 s-1. Notably, this peak, which caused severe damage in the floodplain, occurred over a very short period. At 1:20 am on April 30, 2024, the flow was 142.60 m3 s-1; by 2:05 am, it peaked at 703.3 m3 s-1, and by 2:45 am, it had returned to the initial 150 m3 s-1. The rise and fall of this largest event lasted approximately 1 h and 40 min and represents a typical flash flood hydrograph, with steep rising and falling limbs and a short delay between rainfall and hydrograph peaks.
The fourth and final hydrograph began at 8:00 am on April 30, 2024, with a rainfall total of 160 mm. Compared to the second and third events, maximum rainfall intensities were lower, considering periods shorter than 2 h. Meanwhile, when considering the intensities in longer durations (e.g., 6 h), the value measured for this rainfall interval was higher (Figure 5). Even so, several high-intensity peaks occurred over 6.5 h of uninterrupted rain. This pattern produced a hydrograph with lower peak discharge but sustained flow over an extended period, with multiple peak discharges.
The third hydrograph, which featured the highest peak discharge, produced a flood wave with high stream power and sediment transport capacity, leading to fluvial erosion and mobilizing large sediment blocks. However, during the fourth and final rainfall event, mass movements, such as landslides and debris flows, were observed on the hillslopes, leading to a large amount of sediment being transferred into the stream channel. In this final phase (from 8:05 am to 02:00 pm on April 30, 2024), 160 mm of rainfall occurred over saturated soil conditions, favoring gravity-driven erosive processes in steep areas. Many sediment sources were located near or within the drainage network, contributing large quantities of coarse material (sand and gravel) to the stream channel. Many landslides and debris flows were perceptible to residents due to loud rumbling sounds in the Lowland area. Shortly after these mass movements, the greatest concentration of sediments in the stream flow was visually noticeable (increased turbidity) and later confirmed by sample analyses (Figure 5). Alongside the sudden increase in turbidity, a strong odor of organic matter was also noted.
From the hydrographs generated by the multiple rainfall peaks (Figure 5), the critical 31-hour period can be divided into four hydrologically distinct phases, each with specific consequences for sediment yield. Table 2 presents the estimates of surface runoff volume, peak discharge, runoff coefficient, and sediment yield for each event. In addition to the previously described extreme rainfall intensities, the increasing magnitude of the four rainfall events favored soil saturation. This resulted in elevated runoff coefficients and sediment yield during this critical period (April 29 and 30, 2024). Despite the high sediment yield, sediment concentrations did not exceed in magnitude those observed in past events, with maximum values between 2 and 3 g L‑1. Sediment yield was elevated by the excessive runoff volumes, more than by suspended sediment concentration.
Main hydrological variables monitored during the multiple discharge peaks of the extreme storm-runoff event in the Guarda Mor River experimental catchment during the critical period
In the second precipitation pulse of 93 mm (Table 2), the stream channel overflowed (with bankfull flow rate and stage estimated at 170 m3 s-1 and 1.9 m, respectively), but this storm-runoff event did not cause significant fluvial erosion or trigger landslides. Nevertheless, it was important for increasing soil moisture content, which strongly influenced the impacts of the subsequent storm-runoff events. Two unfavorable hydrological conditions coincided during the third storm-runoff event: high rainfall intensities and soils with moisture content near saturation. This combination resulted in significant surface runoff volumes (RC = 60 %), which quickly propagated through the drainage network, causing a singular flood wave that reached a maximum stage of approximately 3.1 m at 2:10 am on April 30, 2024. This flood wave rise and recession time of approximately 1.5 h caused immeasurable erosion on the stream channel and floodplain along the downstream reach until its confluence with the Soturno River (Figure 1). This event resulted in intense bank erosion and mobilization of large sediment blocks. Lastly, the fourth rainfall event recorded the highest total rainfall (169 mm), following an accumulated 266 mm, which promoted the maximum expansion of saturated area near the drainage network. Under this extreme hydrological condition, a significant erosional process was triggered, with catastrophic repercussions for local communities. The estimated specific sediment yield for the third and fourth events was approximately 626.63 Mg km-2, which is likely underestimated, since bedload transport could not be quantified.
In addition to the excess runoff and sediment yield, which contributed to flooding in the Jacuí River (Figure 1), this event triggered numerous landslides in the escarpment region, caused by the excessive weight of regolith on steeper slopes. Multiple debris flows were also observed in areas of topographic convergence, particularly where first-order streams are located. In the stretches of the drainage network affected by landslides and debris flows, vegetation was removed, and large volumes of regolith were mobilized downslope, reaching lower areas with direct connectivity to the main drainage network. This facilitated the transfer of eroded sediments towards the catchment outlet (Figure 6).

Characteristic landslides and debris flows were observed in the Lowland area of the Guarda Mor River experimental catchment, particularly near the drainage network, contributing to sediment mobilization and landscape alteration during the extreme storm-runoff event.
Hillslope erosive processes
Table 3 presents the estimated surface area where erosion processes were observed within the catchment, by physiographic region (Highland, Edge of the Plateau, and Lowland) and by erosion type (diffuse and concentrated). In cropland areas, diffuse erosion (rill and interrill) and concentrated erosion (channel and gullies) were observed. The largest affected area is associated with diffuse erosion processes (interrill and rill erosion), mostly in croplands and pastures (accounting for more than 90 % of the total affected area). All croplands within the catchment were categorized according to the magnitude (low, medium, or high) of diffuse erosion. For this reason, the total affected area is approximately equal to the total cultivated area in the catchment, even though some plots experienced only minor impacts (low magnitude).
Estimates of areas affected by different erosive processes on the hillslopes of the Guarda Mor River experimental catchment after the extreme event
Although the cropland area in the Lowland is relatively smaller than in the Highland, the magnitude of losses was significantly greater (Figure 7). The fragility of the soil types in that region makes them more prone to disaggregation.
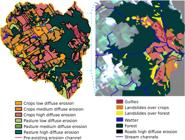
Agricultural fields within the Guarda Mor River experimental catchment, categorized by varying magnitudes of diffuse erosion. Areas affected by concentrated erosive processes – such as rill and gully formation – are also indicated, highlighting zones of intensified soil degradation and sediment mobilization.
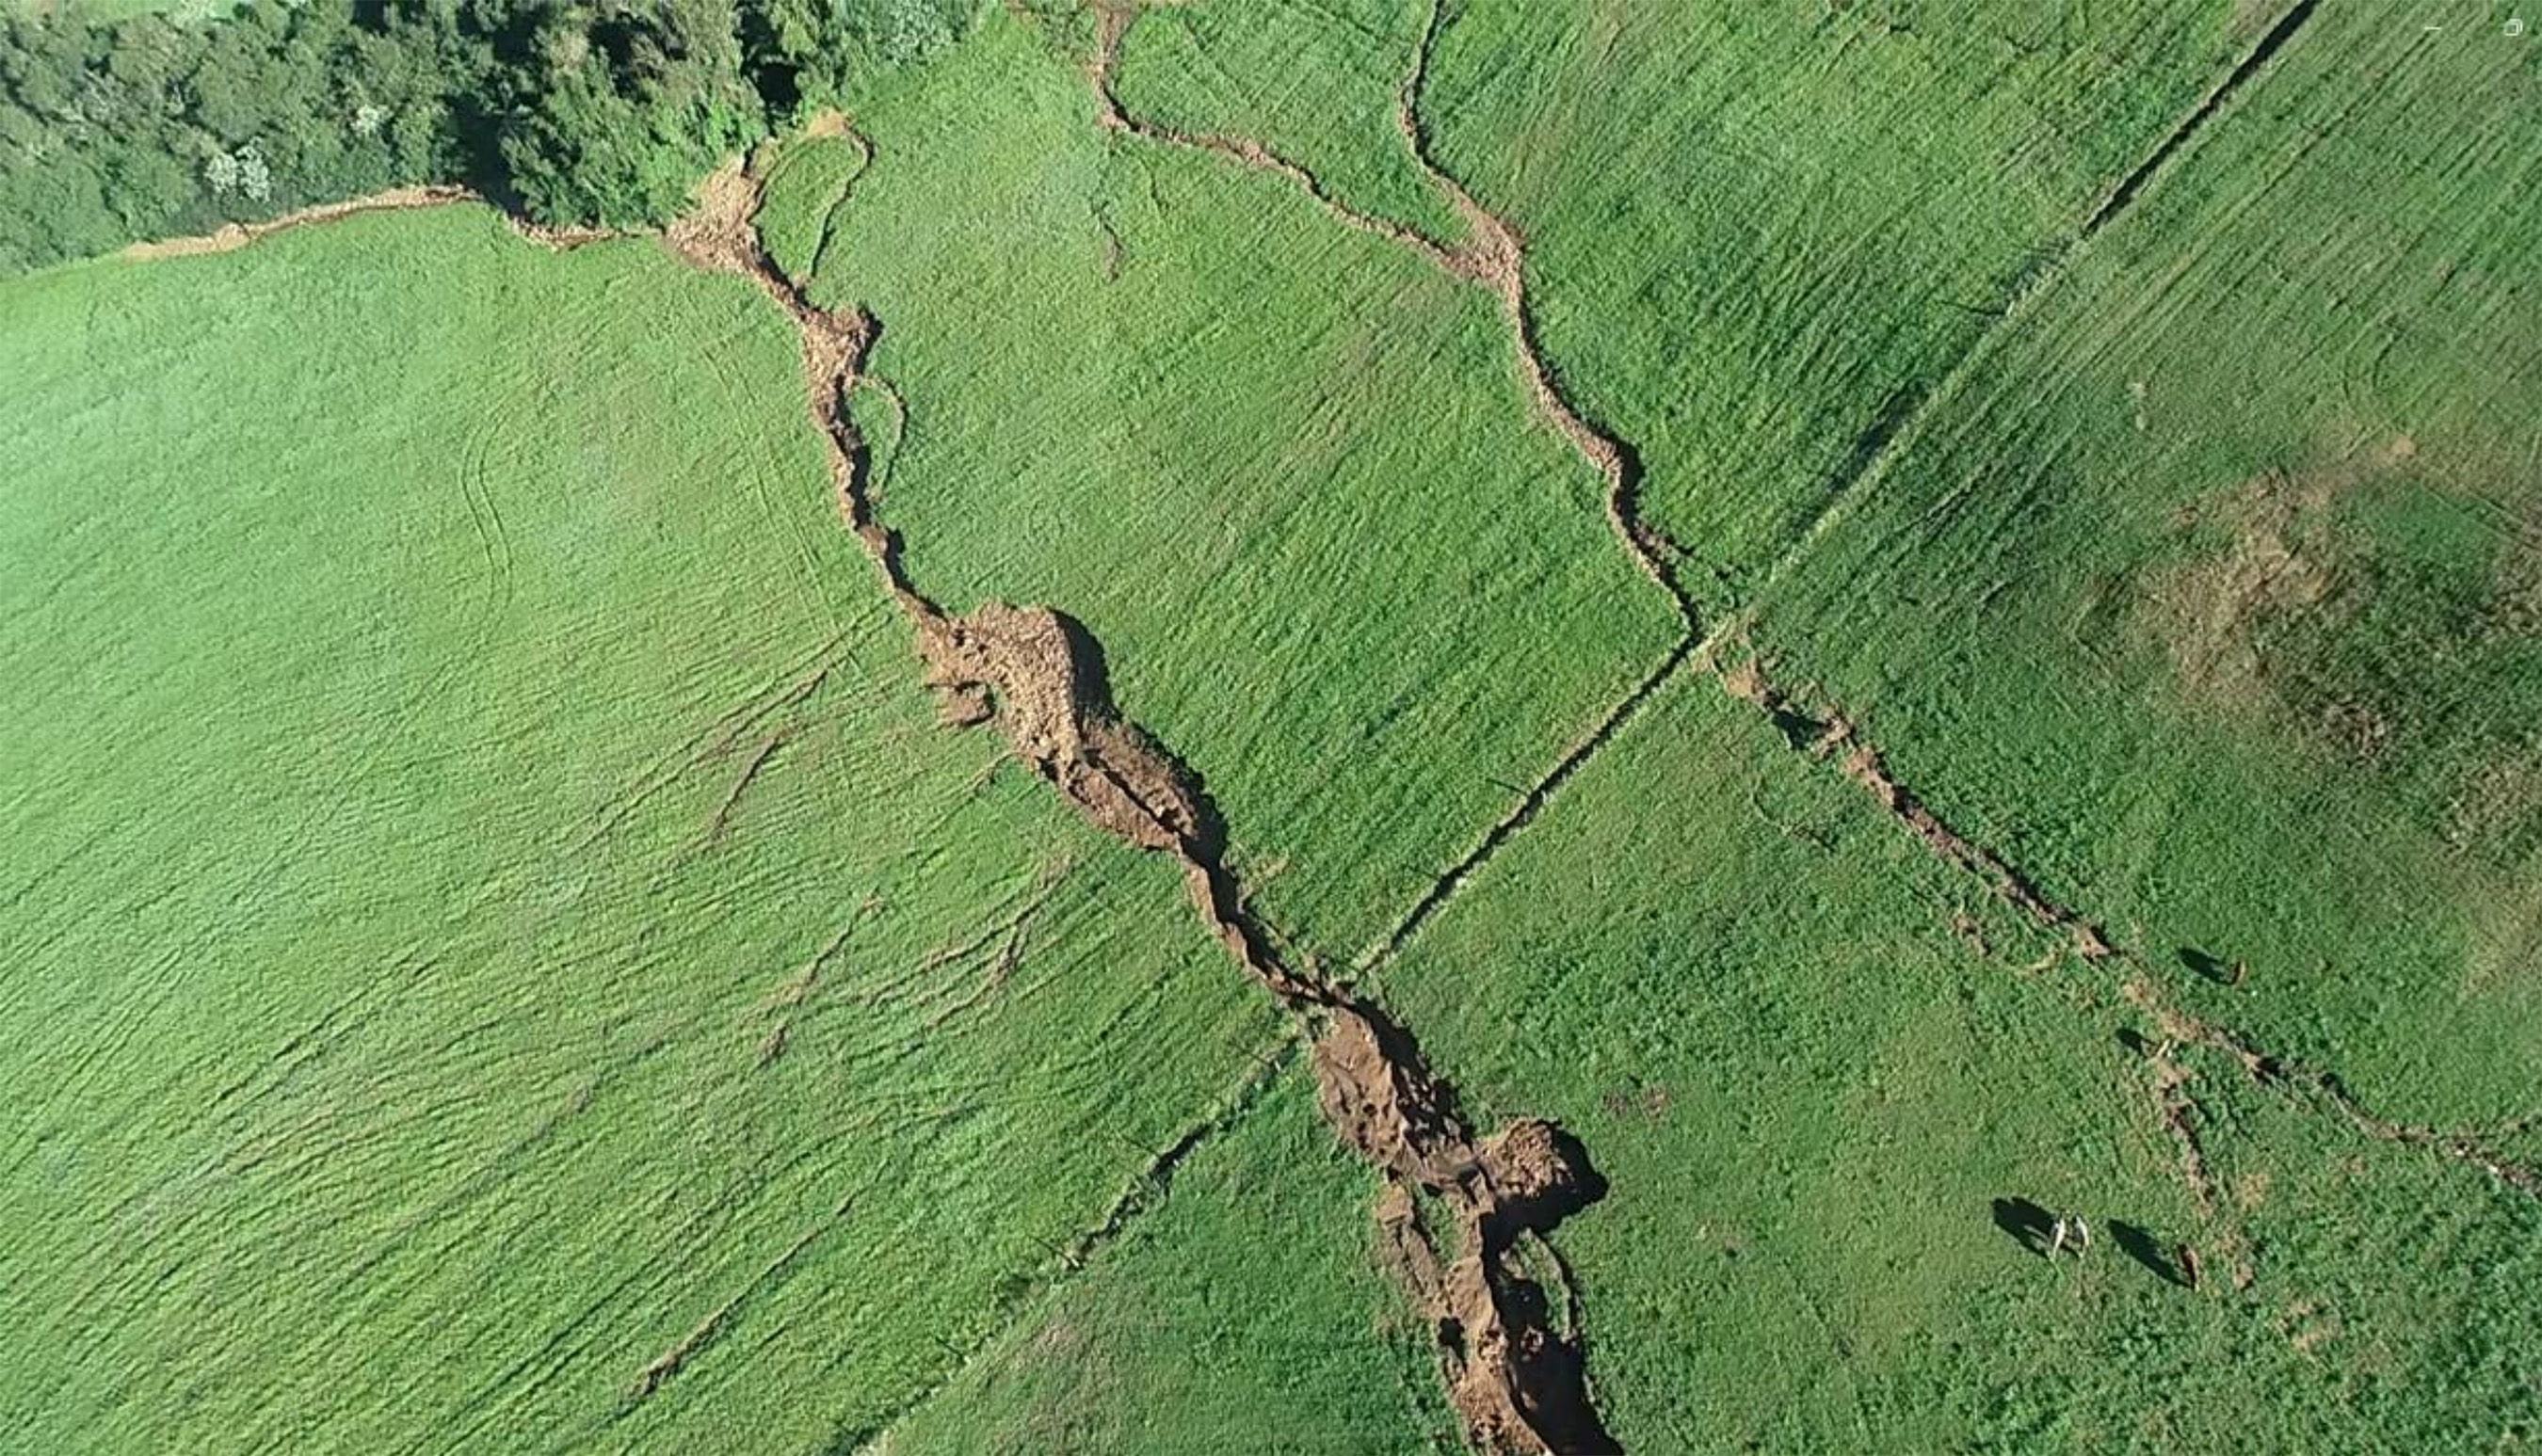
Concentrated erosive processes (channels and gullies) occurred mainly in the Lowland area of the catchment due to the fragility of soils derived from sedimentary rocks, which are highly erodible (Figure 7). The 12-minute flight at 15 m s-¹ produced 174 images, 75 % of which had lateral and longitudinal overlap. This supported the on-field evaluation of concentrated erosion processes. Excessive rainfall, combined with a low amount of plant residue over the soil surface and the high erodibility of sandy soils favored the formation of numerous erosion channels and gullies (Figure 8). Additionally, soil collapse over subsurface erosion pipes (piping) was observed in croplands over Argissolos (soils with a restrictive layer in the B horizon). Despite the smaller cultivated area in the Lowland, the degradation of croplands in this region was significantly greater than that observed in the Highland of the catchment. In the Edge of the Plateau region, where very steep slopes are largely forested, landslides on hillslopes and debris flow deposits in first-order channels were observed.
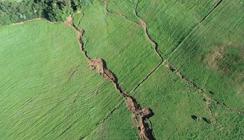
Characteristic channel and gully erosion observed in the Lowland area of the Guarda Mor River experimental catchment, intensified by concentrated surface runoff, reflect the geomorphological and soil responses to extreme rainfall events and highlight zones of accelerated sediment transport and land degradation.
The empirical visual field survey allowed identification of areas where diffuse and concentrated erosion processes occurred; however, it is difficult to properly estimate sediment yield from these areas with this data. Future studies should consider calibrating erosion models, such as LISEM, using sediment yield data from the catchment outlet.
Fluvial erosion processes
The 2024 flood event triggered significant fluvial geomorphic adjustments in the Guarda Mor Stream, as documented through high-resolution DEM comparisons, cross-sectional surveys, and field surveys. The most pronounced changes were observed along the right-side bank, the mid-channel, and near the catchment outlet, revealing distinct erosion and sediment redistribution patterns. The right-side bank retreated laterally by approximately 5 m following the flood, exposing cohesive soil layers and bedrock in areas where localized erosion depths exceeded 1.5 m (Figure 9).

Digital Elevation Model (DEM) of the stream near the monitoring section of the Guarda Mor River experimental catchment, captured before and after the extreme storm-runoff event of April 2024, highlighting areas of erosion (negative values) and deposition (positive values), revealing significant geomorphological changes induced by high-intensity rainfall and concentrated surface flow.
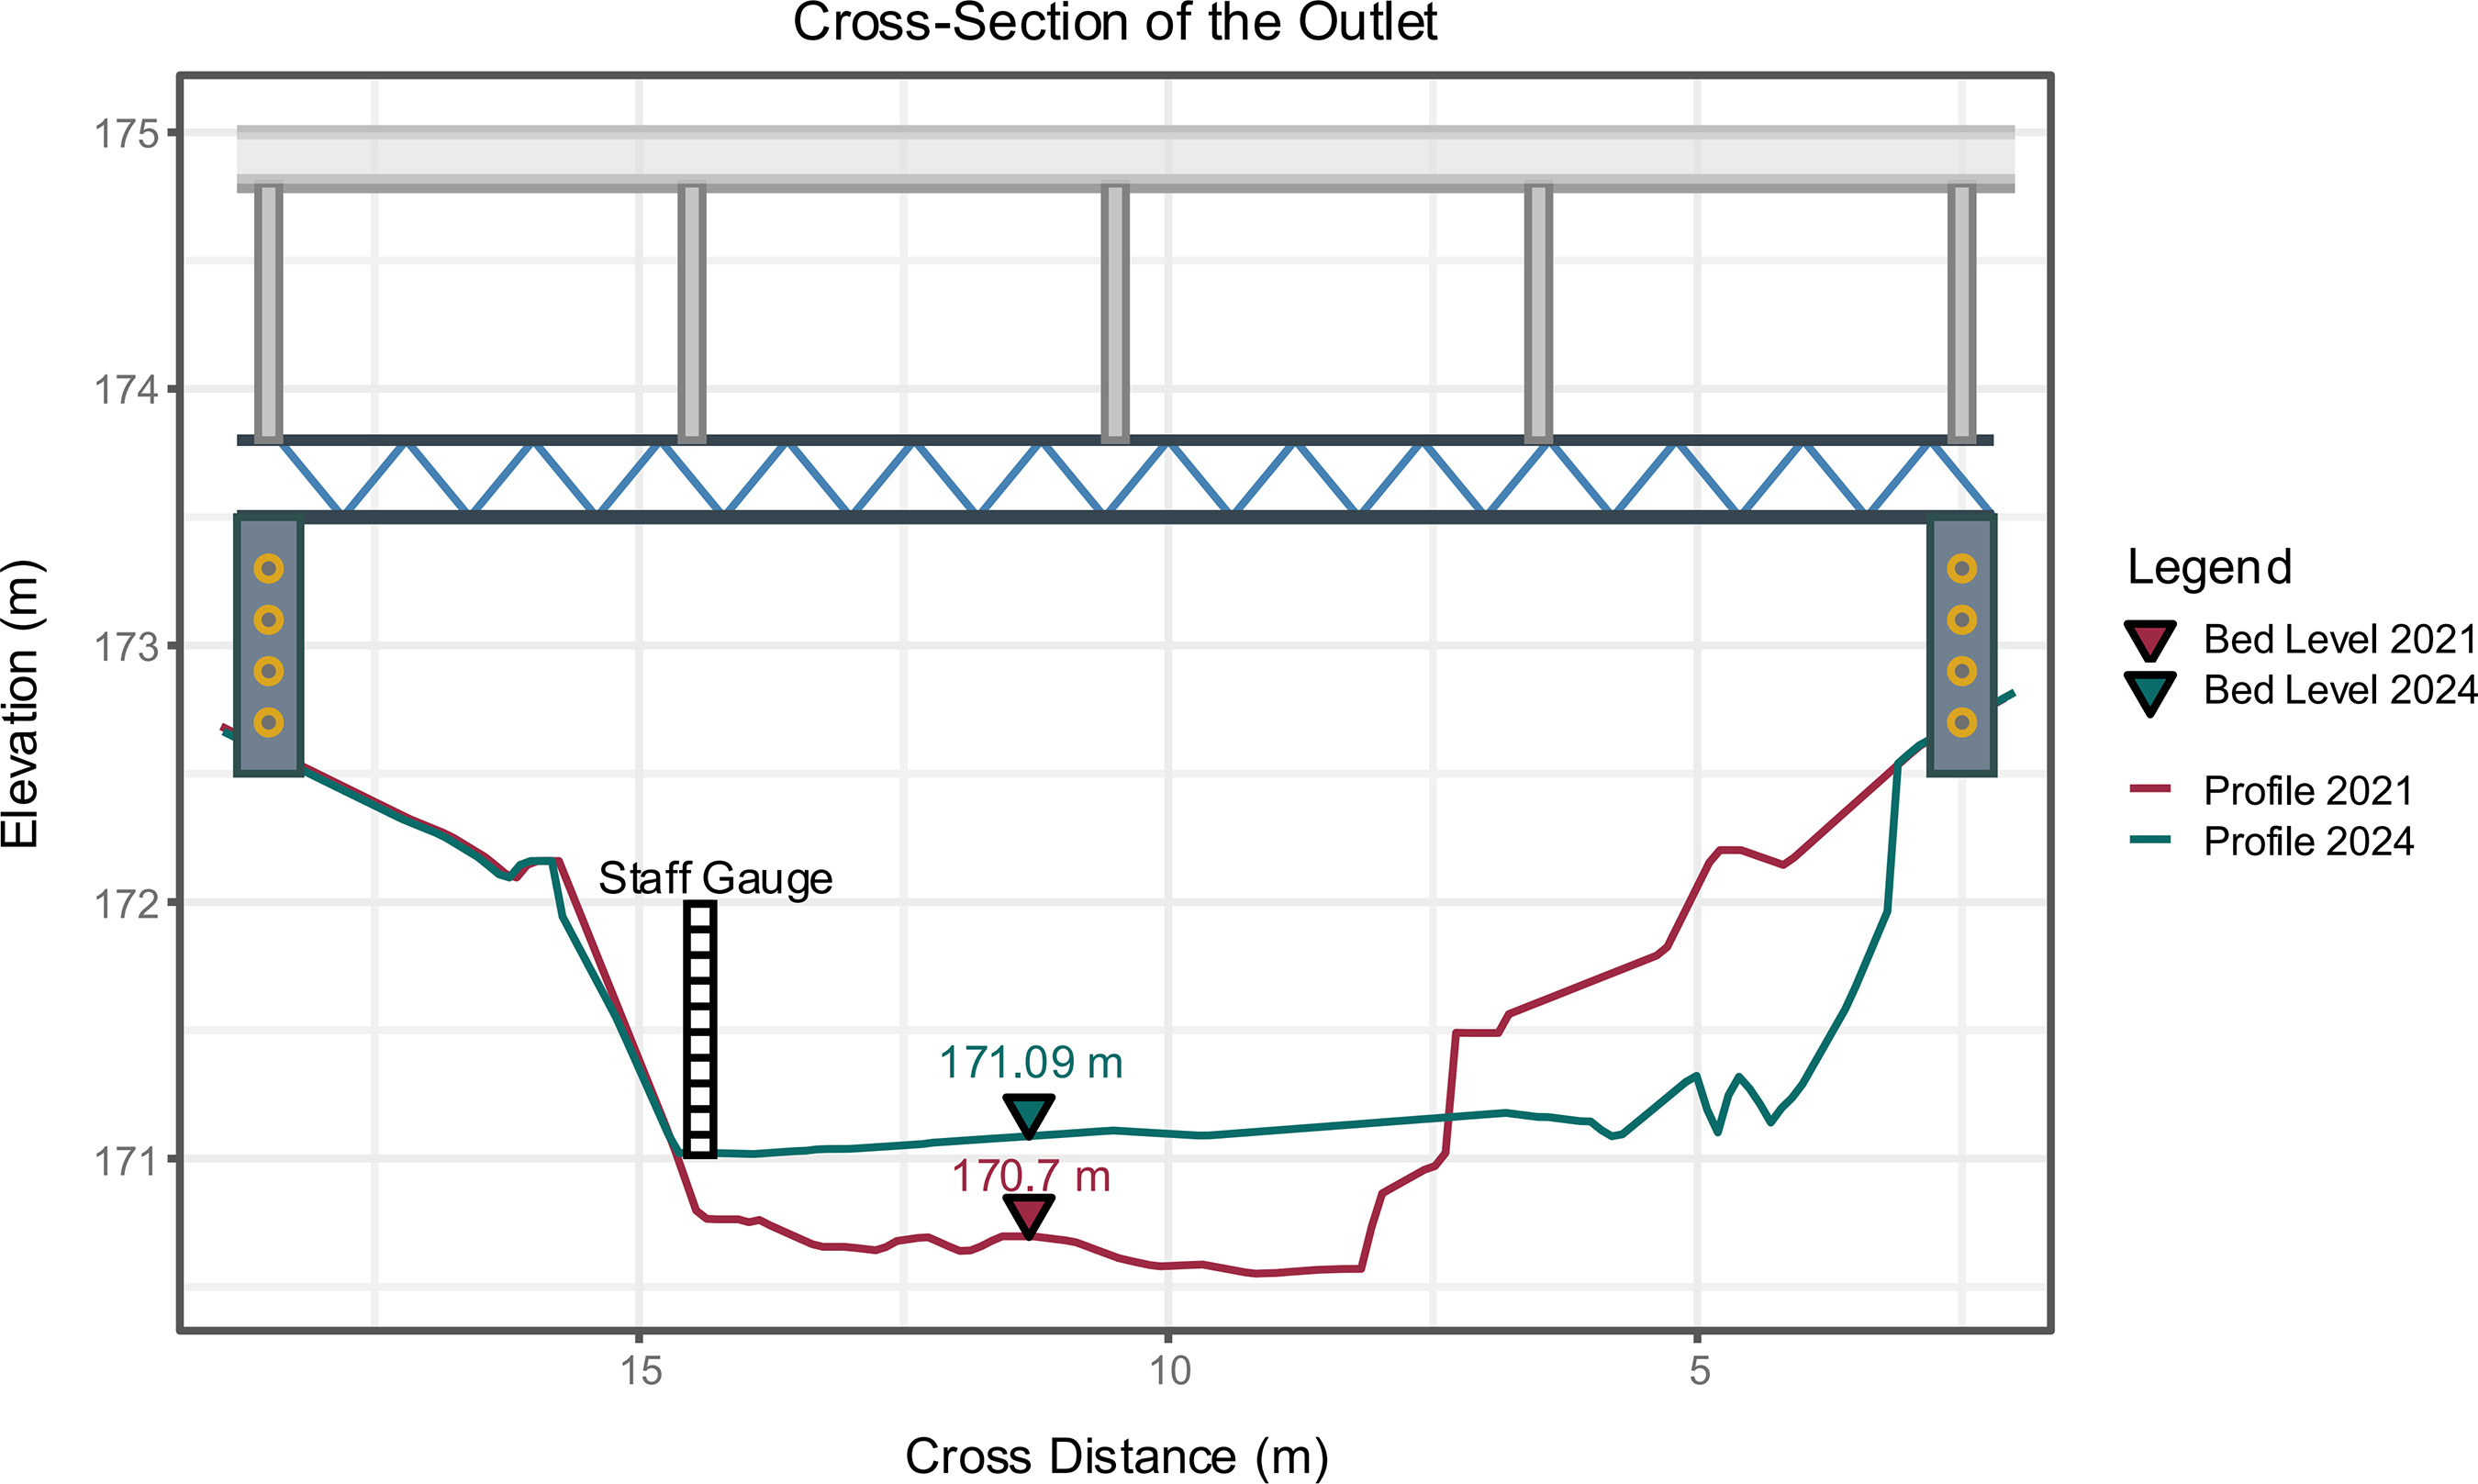
This reach contributed to a total eroded soil volume of 412.49 m3, distributed over 2,742.42 m2, with an average erosion depth of 0.15 m and localized maxima of 0.5 m near the walkway facility. In contrast, substantial sediment deposition occurred in the mid-channel, particularly at the catchment outlet, where gravel accumulated to a thickness of 0.5 m, reducing the channel discharge capacity and altering flow dynamics. On the left-side bank, discontinuous sandbars were formed (0.3–0.4 m thick), reflecting flow divergence during peak discharge. The total volume of deposited sediment was quantified at 497.17 m3 (mean thickness: 0.18 m), yielding a net sediment gain of 84.68 m3 for the analyzed reach. The DEM differencing (2024 minus 2021) highlighted a vertical rise of up to 0.8 m in bed elevation in central channel sections and undercutting of the right-side bank. Cross-sectional profiles at the catchment outlet showed a transition from a pre-flood V-shaped channel to a post-flood U-shaped morphology, driven by bed aggradation and bank retreat (Figure 10).

Cross-sectional profiles at the gauging station of the Guarda Mor River experimental catchment, captured before and after the extreme storm-runoff event of April 2024. The comparison reveals substantial morphological changes in the channel, including bed incision, bank erosion, and sediment redistribution, reflecting the hydrodynamic impact of high-intensity rainfall and peak discharge.
Methodologically, both survey campaigns covered the same 130-meter reach (upstream and downstream of the bridge), ensuring spatial comparability. The 2024 dataset, acquired using RTK-GNSS and electronic tachymetry (Total Station instrument) technologies (horizontal/vertical accuracy: 0.05 m), included over 2,100 georeferenced points, allowing for high-resolution mapping of features such as gravel bars and erosional scarps. Four permanent geodetic control points were maintained between campaigns, minimizing registration errors and ensuring consistent DEM alignment. This dataset provides a robust basis for evaluating flood-induced geomorphic changes, highlighting the interplay between lateral erosion, sediment redistribution, and reduced channel capacity. Despite intense bank erosion, the net sediment surplus emphasizes the role of upstream sediment sources during high-magnitude flood events.
DISCUSSION
General aspects of the large-scale event
The sequential occurrence of rainstorms, over a 31-hour window in the Jacuí River catchment (Figure 1) on April 29 and 30, 2024, triggered an extraordinary hydrological event with tragic social, economic, and environmental consequences for the population of Rio Grande do Sul. The hydrological behavior of this large-scale event is described in detail by Collischonn et al. (2024), emphasizing its effects on the Jacuí River and its consequences for the metropolitan region of Porto Alegre. Due to the destructive capacity of the resulting flood, only a few gauge stations managed to record the flood across the Jacuí River basin, making it difficult to describe the flood wave propagation from the headwaters to the Jacuí River catchment outlet. Additionally, at that scale, no data was recorded on sediment yield during the event. The significant volume of sediment transported through the fluvial system and deposited in the Jacuí River outlet caused severe sedimentation problems in the Guaíba Lake and the Patos Lagoon (Figure 1).
Although the Porto Alegre metropolitan region, located at the outlet of the Jacuí River, suffered the greatest flood impacts, the flood and the consequent erosional processes were spread across the escarpment by the Edge of the Plateau and in the Central Depression region. This region received flood waves from the tributary sub-basins of the Jacuí River, including the Taquari, Pardo, and Soturno Rivers (Figure 1). Estimating the economic impacts of this event involves a high degree of uncertainty due to the extent of the problem, which prevented comprehensive field diagnosis, and the high spatial variability of the erosion processes. The negative impacts of hillslope and floodplain erosion were caused by soil losses from a wide range of processes. These include landslides, debris flows, concentrated erosion (channel and gully), diffuse erosion (interrill and rill), and sediment deposition of different orders of magnitude.
The hydraulic power of streamflow significantly influenced the fluvial environment, leading to bank erosion, sediment mobilization (including boulders), and sediment deposition on both floodplain and channel beds. Different controlling factors govern all these erosional processes, and their quantitative analysis requires extensive fieldwork, as demonstrated in this study. For this reason, it is not feasible to obtain fully reliable estimates of all these erosion processes at the scale and complexity of the Jacuí River catchment. The absence of flow discharge and sediment flux data in the various sub-basins prevents any attempt at a mathematical modeling-based estimation. Even if the streamflow gauging stations had remained operational, the lack of a basic sediment monitoring network would still prevent such estimates.
Other important factors that regulate the extreme storm-runoff event
The characteristics of the Guarda Mor headwater catchment intensified the erosive and depositional effects of this extreme storm-runoff event. Three controlling factors significantly influenced the magnitude of erosion processes and the resulting high sediment yield: land use, topography, and soil type. Considering the first, land use in the Highland area predominantly comprises soybean crop fields under no-tillage. Although no-tillage farming is considered efficient at controlling interrill erosion, it is less effective at controlling surface runoff (Londero et al., 2021ab; Schneider et al., 2025, Werle et al., 2025). In short, the Highland is characteristic of headwater catchments where surface runoff forms. While this area is economically important for agriculture due to its topography and deep, clay-rich soils, it is also hydrologically fragile.
The second controlling factor is related to the geomorphological characteristics of the catchment. The transition from the Southern Plateau (Highland) to the Central Depression (Lowland) occurs abruptly in a transitional area (Edge of the Plateau) marked by steep slopes and rock outcrops with limited soil water storage capacity. The “step and pool” type fluvial network produces torrential flow with high sediment transport capacity (Bernardi et al., 2025). This can be observed through the wide range of sediment granulometry (fine, medium, and coarse-grained sediments) in the river channel, especially between the Edge of the Plateau and Lowland sections. Blocks and boulders are transported during extreme events due to the high stream power, which enables intense sediment transport. The large runoff volume generated in the Highland area gains energy as it flows through the escarpment (Edge of the Plateau). This energy is then dissipated through sediment transport and fluvial erosion along the Edge of the Plateau and the Lowland of the catchment.
The third factor influencing hydrological and erosive processes during the storm runoff event is soil type. In the Edge of the Plateau region, the shallow soils (Neossolos Litólicos and Regolíticos) have limited water storage capacity. Soils in the Lowland, Neossolos Regolíticos, and, especially, the Argissolos, are highly erodible due to their sandy texture and a restrictive layer in the B horizon of Argissolos. This also favors runoff formation and promotes large-scale erosive processes. These characteristics (land use, topography, and soil types) represent a large portion of the Jacuí River catchment. This conceptual model can be easily extrapolated to the transitional region between the Southern Plateau and the Central Depression.
Catchment monitoring and management
Fifty-seven rainfall-runoff events analyzed between June 2021 and April 2024 (Dambroz, 2024; Dambroz et al., 2025) resulted in a total sediment yield of 10,400 Mg (626.23 Mg km-2), which is lower than the 12,365 Mg (668.37 Mg km-2) recorded during the April 29-30, 2024 event. Fang et al. (2013) measured suspended sediment transport during extreme events in a 16.7 km2 mountainous agricultural catchment in China's Three Gorges Area (TGA). The suspended sediment yield recorded was 1,285.44 Mg km-2 for a rainfall of 153.7 mm over 16 h. This value is twice as high as that observed in the Guarda Mor River catchment. The SSC measured in the Chinese catchment during extreme events exceeded 40 g L-1, while concentrations in the Guarda Mor River catchment were ten times lower. This explains the difference in sediment yield, as soils in the TGA region are highly erodible. Nevertheless, the runoff coefficient showed similar magnitudes (50 %) to those measured in the third and fourth hydrographs of the extreme event.
Sediment yield data for extreme events are rare due to their infrequent occurrence, operational challenges, and associated risks. In a 20-year monitoring effort in the Arvorezinha experimental catchment (1.2 km2), the largest event recorded occurred on October 25, 2003, with 145 mm of rainfall in 29.7 h, resulting in a peak discharge of 5.96 m3 s-1 and a sediment yield of 289.37 Mg (243.17 Mg km-2) (Minella, 2007; Minella et al., 2017). In the Guaporé River catchment (2,000 km2), 322 mm of rainfall fell between March 26 and April 1, 2011, generating a sediment yield of 86,413 Mg (43.20 Mg km-2) from a single event.
The existence of experimental catchments with long-term hydrological monitoring is an essential strategy for society to understand the hydrological and erosive processes in the catchments where they live. The knowledge generated by research in rural experimental catchments has the potential to produce numerous scientific and technological products. Additionally, it enables the expansion of training for professionals capable of understanding local phenomena and applying soil and water conservation techniques, leading to the adequate use of regional natural resources (Minella et al., 2022). This information is of utmost importance for the agricultural and environmental planning of headwater catchments (Schneider et al., 2025). They are the source areas of surface runoff and determine the behavior of streamflow and sediment yield in larger rivers, affecting thousands of people in municipalities such as those in the Quarta Colônia region of RS, or even millions of people living within the hydrological context of the Jacuí River catchment. Despite all the advantages of hydrometeorological modeling technologies in understanding these phenomena, monitoring data remain indispensable for improving and validating models.
Understanding how the initial processes of runoff formation occur and how each erosive agent operates in headwater catchments is essential for defining control strategies at the source of the problem (Zhai et al., 2021). This is because controlling runoff becomes ineffective once flows concentrate along the catchment due to the accumulated area. Analyzing this phenomenon based on measured data provides public managers with the necessary information and tools. These resources support the responsible and effective allocation of public resources to mitigate the impacts of extreme events. Therefore, monitoring small experimental catchments is a vital tool for training future professionals and for enabling public managers to make responsible land-use and land-occupation decisions. These decisions favor society safety and well-being.
Soil and water conservation as a means of mitigating extreme events
Agricultural expansion in hydrologically fragile areas, such as headwaters, facilitates the generation and propagation of surface runoff to the drainage network. Initially diffuse and slow-moving, surface runoff concentrates along hillslopes towards convergent zones (thalwegs) and into the river network. More frequent and intense rainfall patterns require the agricultural sector to adopt more efficient stormwater control practices to attenuate runoff and increase water available to crops during droughts (Rockström et al., 2010), especially in headwater catchments. Despite the widespread use of no-till farming in South Brazil, which effectively controls interrill soil erosion, findings show that the practice is inefficient at controlling surface runoff, especially during storms with high-intensity precipitation (Reicosky, 2015; Londero et al., 2021a; Schneider et al., 2025).
CONCLUSIONS
The Jacuí River catchment and its main tributaries were severely affected by the extreme storm-runoff events in April and May of 2024. Estimates of rainfall, peak discharge, surface runoff, runoff coefficient, and suspended sediment yield were obtained from monitoring the Guarda Mor experimental catchment. This made it possible to describe the initial runoff formation and flood propagation, and to quantify suspended sediment yield in a representative headwater catchment. Over 31 h, 435 mm of rainfall were recorded, resulting in multiple streamflow peaks of 46.6, 281.7, 704.8, and 249.1 m3 s-1, and a total suspended sediment yield of 12,365.3 Mg. The cumulative effects of four hydrological events led to a combination of distinct erosive processes that severely impacted hillslopes and the fluvial system. The first two events increased soil moisture and streamflow in the drainage system without causing any serious impact. The third event generated an extraordinary flash flood with a high peak flow, impacting the river system and hillslopes. The fourth event, which had the highest precipitation volume but lower intensity, triggered multiple landslides and debris flows, intensifying hillslope erosion and depositing material in the river system and on floodplains.
Considering the main factors that intensified the destructive impact of the April 2024 extreme rainfall event (soil management, fragile soils, and topography), it is crucial to improve production systems in headwater catchments with high environmental vulnerability. This includes protecting hydrologically fragile areas such as wetlands and riparian zones, and applying conservation principles in production areas, such as improving soil cover and maximizing infiltration and adopting runoff control measures like agricultural terraces, vegetated channels, retention strips, among other practices.
ACKNOWLEDGMENTS
We thank Professors Leandro de M. Pinto and Carlito V. de Moraes, from the Department of Rural Engineering (DER/CCR/UFSM), for their support with part of the topographic surveys in a section of the Guarda Mor River experimental catchment. The authors gratefully acknowledge the assistance of Camilo José Iglesias in the preparation and construction of the maps, which significantly contributed to the quality of this study. We would like to thank the Support from “Committee for Extreme Events and Emergencies (CARE)” of the Federal University of Santa Maria (UFSM) for the financial support provided for the reconstruction of the gauging station.
-
How to cite:
Minella JPG, Buligon L, Silva CC, Londero AL, Dambroz APB, Silva PRB, Feyh GA, Saatkamp ED, Schlesner A, Fernando E, Merten GH, Carvalho LFD, Papalia D, Rubert T. Extreme hydrological and erosive processes during the April 2024 event: A small catchment-monitoring experience in southern Brazil. Rev Bras Cienc Solo. 2026;50:e0250117. https://doi.org/10.36783/18069657rbcs20250117
-
FUNDING
This study was supported by the National Council for Scientific and Technological Development – CNPq (403754/2023-2 and 309759/2021-8), and Foundation of Support for Research of the State of Rio Grande do Sul – FAPERGS (23/2551-0001871-3 and 24/2551-0002122-1).
DATA AVAILABILITY
The data will be provided upon request.
References
- Anderson MG, Brooks SM. Advances in hillslope processes (Volumes 1-2). Chichester, England: John Wiley & Sons; 1996.
- Barbosa GMC, Pott CA, Pellegrini A, Barbosa EAA. Manejo e conservação de solo e água. Volume 2 – Resultados da hidrossedimentometria e atributos do solo. Curitiba: Sistema FAEP/SENAR-PR; 2023.
-
Barros CAP, Govers G, Minella JPG, Ramon R. How water flow components affect sediment dynamics modeling in a Brazilian catchment. J Hydrol. 2023;597:126111. https://doi.org/10.1016/j.jhydrol.2021.126111
» https://doi.org/10.1016/j.jhydrol.2021.126111 - Bernardi F. Caracterização e modelagem dos processos erosivos com interface canal-encosta em bacias de elevado gradiente topográfico: O caso da bacia experimental do rio Guarda Mor [thesis]. Santa Maria: Universidade Federal de Santa Maria; 2022.
-
Bernardi F, Minella JPG, Dambroz APB, Schlesner A, Merten GH, Mao L, Evrard O, Piccilli DGA, Dalmolin RSD, Pedro FA. Fluvial erosion in a catchment cultivated with no-tillage at the edge of the southern Brazilian plateau. Environ Monit Assess. 2025;197:9. https://doi.org/10.1007/s10661-024-13440-1
» https://doi.org/10.1007/s10661-024-13440-1 -
Boardman J. Extreme rainfall and its impact on cultivated landscapes with particular reference to Britain. Earth Surf Process Landf. 2015;40:2121-30. https://doi.org/10.1002/esp.3792
» https://doi.org/10.1002/esp.3792 -
Buriol GA, Estefanel V, Swarowsky A, Todeschini R. Espacialização da evapotranspiração potencial mensal e anual na bacia hidrográfica do Rio Vacacaí - RS, Brasil. Rev Bras Climatol. 2021;14:275-84. https://doi.org/10.5380/abclima.v14i1.36708
» https://doi.org/10.5380/abclima.v14i1.36708 -
Cardoso CS, Quadro MFL, Bonetti C. Persistência e abrangência dos eventos extremos de precipitação no Sul do Brasil: Variabilidade espacial e padrões atmosféricos. Rev Bras Meteorol. 2020;35:219-31. https://doi.org/10.1590/0102-7786352031
» https://doi.org/10.1590/0102-7786352031 -
Charlton R. Fundamentals of fluvial geomorphology. London: Routledge; 2009. https://doi.org/10.4324/9780203371084
» https://doi.org/10.4324/9780203371084 - Chin DA. Water-resources engineering. 4th ed. Boston: Pearsons; 2020.
- Chow VT. Handbook of applied hydrology: A compendium of water-resources technology. New York: McGraw-Hill; 1964.
-
Collischonn W, Fan FM, Possantti I, Dornelles F, Paiva R, Medeiros MS, Michel GP, Magalhães Filho FJC, Moraes SR, Marcuzzo FFN, Michel RDL, Beskow TLC, Beskow S, Fernandes EHL, Santos LL, Ruhoff A, Kobiyama M, Collares GL, Buffon F, Duarte E, Lima S, Meirelles FSC, Piccilli DGA. The exceptional hydrological disaster of April-May 2024 in southern Brazil. Rev Bras Rec Hidr. 2025;30:e1. https://doi.org/10.1590/2318-0331.302520240119
» https://doi.org/10.1590/2318-0331.302520240119 - Dambroz APB. Monitoramento do fluxo de água, sedimentos e solutos em uma bacia hidrográfica agrícola no sul do Brasil [thesis]. Santa Maria: Universidade Federal de Santa Maria; 2024.
- Dambroz APB. Fragilidade ambiental da bacia do arroio Guarda Mor [dissertation]. Santa Maria: Universidade Federal de Santa Maria; 2020.
-
Dambroz APB, Minella JPG, Capel PD, Bernardi F, Werle L, Silva JHS, Schlesner AA, Buligon L, Mallmann FJK, Barros CAP, Tiecher T, Evrard O, Merten GH. Assessing sediment and nutrient transport in a South Brazilian catchment: hysteresis, fingerprinting, and management implications. Environ Monit Assess. 2025;197:933. https://doi.org/10.1007/s10661-025-14198-w
» https://doi.org/10.1007/s10661-025-14198-w -
Dambroz APB, Minella JPG, Tiecher T, Moura-Bueno JM, Evrard O, Pedron FA, Dalmolin RSD, Bernardi F, Schneider FJA, Cerdan O. Terrain analysis, erosion simulations, and sediment fingerprinting: A case study assessing the erosion sensitivity of agricultural catchments in the border of the volcanic plateau of Southern Brazil. J Soils Sediments. 2022;22:1023-40. https://doi.org/10.1007/s11368-022-03139-6
» https://doi.org/10.1007/s11368-022-03139-6 -
Diaz AF, Studzinski CD, Mechoso CR. Relationships between precipitation anomalies in Uruguay and southern Brazil and sea surface temperature in the Pacific and Atlantic Oceans. J Clim. 1998;11:251-71. https://doi.org/10.1175/1520-0442(1998)011<0251:RBPAIU>2.0.CO;2
» https://doi.org/10.1175/1520-0442(1998)011<0251:RBPAIU>2.0.CO;2 -
Didoné EJ, Minella JPG, Reichert JM, Merten GH, Dalbianco L, Barros CAP, Ramon R. Impact of no-tillage agricultural systems on sediment yield in two large catchments in Southern Brazil. J Soils Sediments. 2014;14:1287-97. https://doi.org/10.1007/s11368-013-0844-6
» https://doi.org/10.1007/s11368-013-0844-6 -
Fang NF, Shi ZH, Yue BJ, Wang L. The characteristics of extreme erosion events in a small mountainous watershed. PLoS One. 2013;8:e76610. https://doi.org/10.1371/journal.pone.0076610
» https://doi.org/10.1371/journal.pone.0076610 - Feyh GA. Geomorphic and sedimentological response to an extreme flood in the Guarda Mor River, Brazil [dissertation]. Santa Maria: Universidade Federal de Santa Maria; 2026.
- Kirkby MJ. Hillslope hydrology. New York: John Wiley & Sons; 1989.
-
Koppe E, Schneider FJA, Londero AL, Queiroz R, Buligon L, Minella JPG. Soil water infiltration evaluation from punctual to hillslope scales. Environ Monit Assess. 2022;194:300. https://doi.org/10.1007/s10661-022-09893-x
» https://doi.org/10.1007/s10661-022-09893-x -
Köppen WP. Grundriss der Klimakunde. Berlin: Walter de Gruyter; 1931. https://doi.org/10.1515/9783111667751
» https://doi.org/10.1515/9783111667751 -
Londero AL, Minella JPG, Schneider FJA, Deuschle D, Menezes D, Evrard O, Boeni M, Merten GH. Quantifying the impact of no-till on runoff in southern Brazil at hillslope and catchment scales. Hydrol Process. 2021a;35:e14286. https://doi.org/10.1002/hyp.14094
» https://doi.org/10.1002/hyp.14094 -
Londero AL, Minella JPG, Schneider FJA, Deuschle D, Merten GH, Evrard O, Boeni M. Quantifying the impact of no-till on sediment yield in southern Brazil at the hillslope and catchment scales. Hydrol Process. 2021b;35:e14286. https://doi.org/10.1002/hyp.14286
» https://doi.org/10.1002/hyp.14286 -
Menezes D, Minella JPG, Tassi R. Monitoring sediment yield for soil and water conservation planning in rural catchments. Environ Monit Assess. 2020;192:736. https://doi.org/10.1007/s10661-020-08670-y
» https://doi.org/10.1007/s10661-020-08670-y -
Merten GH, Araújo AG, Biscaia RCM, Barbosa GMC, Conte O. No-till surface runoff and soil losses in southern Brazil. Soil Till Res. 2015;152:85-93. https://doi.org/10.1016/j.still.2015.03.014
» https://doi.org/10.1016/j.still.2015.03.014 - Minella JPG. Utilização de técnicas hidrossedimentométricas combinadas com a identificação de fontes de sedimentos para avaliar o efeito do uso e do manejo do solo nos recursos hídricos de uma bacia hidrográfica rural no Rio Grande do Sul [thesis]. Porto Alegre: Universidade Federal do Rio Grande do Sul; 2007.
-
Minella JPG, Merten GH, Barros CAP, Ramon R, Schlesner A, Clarke RT, Moro M, Dalbianco L. Long-term sediment yield from a small catchment in southern Brazil affected by land use and soil management changes. Hydrol Process. 2017;32:200-11. https://doi.org/10.1002/hyp.11404
» https://doi.org/10.1002/hyp.11404 -
Minella JPG, Walling DE, Merten GH. Establishing a sediment budget for a small agricultural catchment in southern Brazil, to support the development of effective sediment management strategies. J Hydrol. 2014;519:2189-201. https://doi.org/10.1016/j.jhydrol.2014.10.013
» https://doi.org/10.1016/j.jhydrol.2014.10.013 -
Minella JPG, Merten GH, Schlesner A, Bernardi F, Barros CAP, Tiecher T, Ramon R, Evrard O, Santos DR, Reichert JM, Tassi R. Combining sediment source tracing techniques with traditional monitoring: The Arvorezinha catchment experience. Hydrol Process. 2022;36:e14665. https://doi.org/10.1002/hyp.14665
» https://doi.org/10.1002/hyp.14665 - Morgan RPC. Soil erosion and conservation. 3rd ed. Oxford: Blackwell Publishing; 2005.
- Parsons JA, Abrahams AD. Overland flow: Hydraulics and erosion mechanics. London: ULC Press; 1992.
-
Planet Labs PBC. PlanetScope 2-m resolution satellite imagery; 2024. Available from: https://api.planet.com
» https://api.planet.com -
QGIS Development Team. QGIS Geographic Information System. Versão 3.x. Open Source Geospatial Foundation; 2024. Available from: http://qgis.osgeo.org
» http://qgis.osgeo.org -
Reicosky DC. Conservation tillage is not conservation agriculture. J Soil Water Conserv. 2015;70:103A-8A. https://doi.org/10.2489/jswc.70.5.103A
» https://doi.org/10.2489/jswc.70.5.103A -
Rio Grande do Sul – RS / Secretaria de Desenvolvimento Rural - SDR. Impactos das chuvas e cheias extremas no Rio Grande do Sul em maio de 2024. Porto Alegre: Empresa de Assistência Técnica e Extensão Rural; 2024 [cited 2024 Nov 24]. (Boletim Evento Adverso, 1). Available from: https://www.estado.rs.gov.br/upload/arquivos/202406/relatorio-sisperdas-evento-enchentes-em-maio-2024.pdf
» https://www.estado.rs.gov.br/upload/arquivos/202406/relatorio-sisperdas-evento-enchentes-em-maio-2024.pdf -
Robinet J, Minella JPG, Barros CAP, Schlesner A, Lücke A, Ameijeiras-Mariño Y, Opfergelt S, Vanderborght J, Govers G. Impacts of forest conversion and agriculture practices on water pathways in Southern Brazil. Hydrol Process. 2018;32:2304-17. https://doi.org/10.1002/hyp.13155
» https://doi.org/10.1002/hyp.13155 -
Rockström J, Karlberg L, Wani SP, Barron J, Hatibu N, Oweis T, Bruggeman, A, Farahani J, Qiang, Z. Managing water in rainfed agriculture—The need for a paradigm shift. Agric Water Manag. 2010;97:543–50. https://doi.org/10.1016/j.agwat.2009.09.009
» https://doi.org/10.1016/j.agwat.2009.09.009 - Rose CW. An introduction to the environmental physics of soil, water and watersheds. Cambridge: Cambridge University Press; 2004.
- Schneider FJA. Modeling sediment yield on hillslopes under no-till farming [thesis]. Santa Maria: Universidade Federal de Santa Maria; 2021.
-
Schneider FJA, Minella JPG, Londero AL, Deuschle D, Merten GH, Evrard O, Cerdan O, Dambroz APB. Surface runoff and sediment yield modelling under no-till: chiselling and crop management effects. Hydrol Process. 2025;39:e70354. https://doi.org/10.1002/hyp.70354
» https://doi.org/10.1002/hyp.70354 - Shreve EA, Downs AC. Quality-assurance plan for the analysis of fluvial sediment by the US Geological Survey Kentucky Water Science Center Sediment Laboratory. Virginia, EUA: U.S. Geological Survey Open, U.S. Geological Survey, Reston; 2005. (File Report 2005-1230).
-
Teixeira MS, Prieto RB. Eventos extremos de chuva no Estado do Rio Grande do Sul, Brasil, entre 2004 e 2013. Parte 1: Definição dos eventos e estatísticas. Rev Bras Meteorol. 2020;35:45-52. https://doi.org/10.1590/0102-7786351027
» https://doi.org/10.1590/0102-7786351027 - Toy TJ, Foster GR, Renard KG. Soil erosion: processes, prediction, measurement, and control. New York: John Wiley & Sons; 2002.
-
Tucci CEM, Clarke RT. Impacto das mudanças da cobertura vegetal no escoamento: Revisão. Rev Bras Rec Hidr. 1997;2:135-52. https://doi.org/10.21168/rbrh.v2n1.p135-152
» https://doi.org/10.21168/rbrh.v2n1.p135-152 - Werle L. Modelagem do efeito do terraceamento para o controle do escoamento superficial numa bacia rural no sul do Brasil [dissertation]. Santa Maria: Universidade Federal de Santa Maria; 2024.
-
Werle L, Minella JPG, Merten GH, Kaiser DR, Schlesner A, Dambroz APB, Hammes BE, Bernardi F. Modeling the effect of terracing on runoff control in a rural catchment in southern Brazil. Rev Bras Cienc Solo. 2025;49:e0240108. https://doi.org/10.36783/18069657rbcs20240108
» https://doi.org/10.36783/18069657rbcs20240108 -
Zhai X, Guo L, Liu R, Zhang Y, Zhang Y. Comparing three hydrological models for flash flood simulations in 13 humid and semi-humid mountainous catchments. Water Res Manage. 2021;35:1547-71. https://doi.org/10.1007/s11269-021-02801-x
» https://doi.org/10.1007/s11269-021-02801-x
Edited by
-
Editor:
José Miguel Reichert https://orcid.org/0000-0001-9943-2898 and Yuri Jacques A. B. da Silva https://orcid.org/0000-0001-6865-7146