 Phosphorus critical soil test value reassessment in subtropical Oxisols under no-till: Insights from South-Central Paraná
ABSTRACT
The critical soil test value (CSTV) of phosphorus (P) is defined by the relationship between relative crop yield (%) and soil P availability and is essential to guide fertilization decisions. However, CSTVs may vary depending on the diagnostic soil layer, crop type, and the Mathametical model used, highlighting the importance of refining their estimation. This study aimed to evaluate whether the subsurface layer (0.10–0.20 m) improves the diagnosis of P availability under different fertilization strategies and to re-estimate CSTVs for the Center-South region of Paraná, Brazil, by integrating new field trials with existing regional datasets and comparing multiple models. Relative yield and Mehlich-1 extractable P data were fitted to five models: Cate and Nelson (1965), modified ALCC, Mitscherlich, linear-plateau, and quadratic-plateau. Field trials were conducted in Oxisols (Humic Hapludox - Latossolos) with medium and high soil test P (STP) levels. Data were grouped by soil layer (0.00–0.20, 0.00–0.10, and 0.10–0.20 m) and crop season (summer and winter). In a second analysis, regional data were grouped by soil layer and crop type (summer + winter, summer, and winter), and all models were adjusted to 90 % of maximum relative yield. The field trials showed limited model fit due to high P availability in the surface layer, which was sufficient to sustain high yields even without P fertilization for four years. The Cate and Nelson model yielded CSTVs of 3.7 mg dm-3 for the 0.00–0.20 m layer and 0.9 mg dm-3 for the 0.10–0.20 m layer, both adequate for maintaining crop productivity. In the regional analysis, all models provided statistically significant fits, though numerical differences were not statistically significant due to overlapping 95 % confidence intervals. Estimated CSTVs ranged from 7.4–13.5 mg dm-3 (summer + winter), 6.6–19.0 mg dm-3 (summer), and 5.5–12.5 mg dm-3 (winter), encompassing the regional threshold of 8 mg dm-3. Plateau models tended to estimate higher CSTVs for summer crops, while ALCC and Mitscherlich were more aligned with winter crop requirements, with Mitscherlich showing the best performance for winter crops in both 0.00–0.10 and 0.00–0.20 m layers. These results support the use of the 0.10–0.20 m layer as a diagnostic depth under no-till systems and highlight the need for standardized model selection and expanded regional datasets to refine CSTV estimates and enhance the efficiency of P fertilization strategies.
Keywords
soil fertility; fertilizer recommendation; P fertilization; Mehlich-1
INTRODUCTION
Phosphorus (P), although not the nutrient most demanded by cultivated plants, is one of the main factors limiting global agricultural production (Weil and Brady, 2017; Oliveira et al., 2022). This limitation is even more pronounced in agricultural systems established on subtropical Oxisols, which are characterized by high contents of Fe and Al oxides in the clay fraction and a high phosphate adsorption capacity (Bortoluzzi et al., 2015; Fink et al., 2016; Oliveira et al., 2020). Weathered soils typically have low P availability, a condition that is mitigated through the application of phosphate fertilizers, which increases soil available P content (Tiecher et al., 2021) and ensures the expression of the maximum productive potential of crops such as soybean, corn, and winter cereals (Hopkins and Hansen, 2019).
Fertilizer recommendation systems serve as a reference for determining appropriate P application rates. These systems are typically developed based on research conducted in the specific region where the recommendations will be applied, ensuring they reflect local soil, crop, and climate conditions. In the state of Paraná, located in Southern Brazil, several studies have been conducted to establish phosphate fertilization guidelines for no-till Oxisols. These studies developed P availability classes based on the relationship between crop relative yield and soil available P (Fontoura et al., 2015; Vieira et al., 2015). These studies aimed to estimate the critical soil test value of P (CSTV of P) that ensures maximum crop yield, typically defined as 90 % of the maximum relative yield (RY). Historically, a 90 % relative yield threshold has been used in P calibration experiments in southern Brazil. Common cut-offs range from 80 to 99 % (Siatwiinda et al., 2024), with lower values reducing the CSTV of P. The variation is partly crop-dependent, with 95 % used for high-value crops and 80 % for low-value crops, particularly in areas with limited access to inputs such as fertilizers (Siatwiinda et al., 2024). When soil P availability is below the CSTV, crop yield increases progressively in response to P addition. Conversely, when soil available P is above CSTV, P fertilization becomes economically unfeasible, as yield gains are negligible and do not offset fertilizer costs (Mallarino and Blackmer, 1992; Filippi et al., 2025).
The CSTV of P is not a static value; it varies according to soil clay content and mineralogy, the soil layer evaluated, crop species, and climatic conditions (Schlindwein and Gianello, 2008; Vieira et al., 2015; Tiecher et al., 2023). In soils from Paraná, Lantmann et al. (1996) had already proposed a CSTV of P of 6 mg kg-1 for soybean and 9 mg kg-1 for barley cultivation, demonstrating differences in CSTV between plant species. Similarly, Vieira et al. (2015) found that winter crops (cereals) have higher CSTV of P than summer crops (soybean and corn). Among summer crops, corn exhibits a higher CSTV than soybean due to its greater P demand, especially during the early stages of crop development (Vieira et al., 2015, 2016; Morales et al., 2023; Tiecher et al., 2023).
In soils under conservation systems such as no-tillage (NT), the sampled soil layer is particularly important due to the strong P gradient caused by the low mobility of this nutrient in the soil (Tiecher et al., 2012). Under these conditions, the CSTV generally decreases with increasing sampling depth (Tiecher et al., 2023). However, as defined by Vieira et al. (2016), in areas with a long-term history of NT (>20 years), the available P content in the 0.00–0.20 m soil layer showed a stronger correlation with crop yield than that in the 0.00–0.10 m layer. Therefore, the 0.00–0.20 m layer was chosen as the diagnostic layer for estimating soil P availability for crops. However, to date, no reports in the literature address the use of subsurface layers (e.g., 0.10–0.20 m) for diagnosing soil P availability in the South-Central region of Paraná. For this reason, adjustments have typically been made using the 0.00–0.10 and 0.00–0.20 m layers, as in other studies (Crozier et al., 1999; Schlindwein and Gianello, 2008). Nevertheless, recent studies such as those by Bellinaso et al. (2021) and Reed et al. (2022) have shown that subsurface layers (0.10–0.20 or 0.20–0.30 m) can improve the diagnosis of P availability in NT systems, particularly in consolidated NT clayey soils, or during dry years, when the surface layer is the first to dry out, hindering the absorption of nutrients absorbed by diffusion, such as P. Under such conditions, roots rely more on subsurface layers for water and nutrient uptake; evaluating P availability in these layers is essential for an accurate diagnosis.
It is estimated that approximately 57 % of crop fields in Oxisols (Latossolos) under no-tillage in the South-Central region of Paraná have available P levels below the CSTV (Fontoura et al., 2015). Therefore, various P fertilization strategies have been studied in short-term experiments (<5 years) to improve nutrient use efficiency. These include: fertilization strategies (system fertilization and crop fertilization) (Amorim, 2020; Lima et al., 2025a,b), fertilizer application timing (Guera et al., 2020; Riferte, 2021), and application methods (broadcast and banded P) (Hansel et al., 2017; Nunes et al., 2020; Lima et al., 2025a). Furthermore, the choice of the most appropriate management practice is influenced by the history of the area and its legacy (Lopes et al., 2021). It is important to emphasize that studies on P fertilization management, as well as updates to the CSTV, should be conducted continuously, since genetic materials, yield expectations, and other factors can influence the CSTV of P and require regular adjustments. Therefore, we hypothesized that the CSTV of P varies with soil depth, crop species, and the mathematical models used, which ultimately affects fertilization recommendations and nutrient use efficiency. Accordingly, the objectives of this study were: (i) to use the subsurface soil layer (0.10–0.20 m) to estimate the CSTV of P across different fertilization management practices, and (ii) to re-estimate and compare the CSTV of P for the South-Central Paraná region by integrating new experimental data with existing datasets and current regional recommendation systems using different soil depths, crop species and multiple mathematical models.
MATERIALS AND METHODS
Site description
The field trials were conducted in the South-Central region of Paraná, Southern Brazil. The climate is classified as humid subtropical (Cfb, Köppen), with altitudes ranging from 800 to 1,200 m. The mean annual temperature is 17 °C, varying from 21 °C in summer to 13 °C in winter. The mean annual precipitation is 1,921 mm, well distributed throughout the year, with no dry season and frequent frost events (Fontoura et al., 2015). The soils are classified as Latossolos, according to the Brazilian Soil Classification System (Santos et al., 2018), and as Humic Hapludox, according to the Soil Survey Staff (2022), with a clayey to very clayey texture. The dominant minerals in the clay fraction are kaolinite, iron oxides (goethite and hematite), and aluminum oxide (gibbsite).
The field trials were conducted in the municipalities of Candói and Pinhão, in soils with initial P levels in the 0.00–0.20 m layer of 4.9 and 15.9 mg dm-3, respectively, which are considered medium (4–8 mg dm-3) and high (8–16 mg dm-3) soil test P (STP) levels, according to Fontoura et al. (2015). Both sites had been under long-term no-tillage (NT) management for over 20 years. The experiments were established in 2019 and conducted over four years (four winter and four summer crop seasons). Table 1 presents the soil chemical properties at both sites at the time of experiment establishment. Historical rainfall data for the region (1976–2019) and rainfall records during the experimental period are provided in table 2.
Selected soil properties of the 0.00-0.20 m layer before the establishment of the field trials in subtropical Oxisols under no-tillage with medium soil test P (STP) (Candói) and high STP (Pinhão), State of Paraná (PR), Southern Brazil
Historical average monthly precipitation data (1976-2019) and average monthly precipitation in the field trials with medium (Candói, PR) and high (Pinhão, PR) soil test P (STP) conditions during the study period (2019-2023), State of Paraná (PR), Southern Brazil
Experimental design and treatments
The field trials were established in the winter of 2019. The evaluated factors included: (i) fertilization strategy, (ii) placement method, (iii) fertilization time, and (iv) spatial distribution, in addition to a control treatment without P application. In total, 11 treatments were arranged in a randomized complete block design with three replicates for the site with medium initial soil P and four replicates for the site with high initial soil P. Plot sizes were 32 and 35 m², respectively (Table 3).
Factors and treatments applied in the field trials established on subtropical Oxisols with medium (Candói, PR) and high (Pinhão, PR) STP conditions, State of Paraná (PR), Southern Brazil
Phosphorus application rates were calculated according to the current fertilizer recommendations for the South-Central region of Paraná, using triple superphosphate (TSP) as the P source (Table 4; Fontoura et al., 2015). Fertilization strategy treatments included: (i) crop fertilization, consisting of applying the recommended rate separately for each winter and summer crop, and (ii) system fertilization, in which the sum of the winter and summer crop rates was applied at the time of winter crop sowing (Table 3). The placement method treatments included: (i) banded P at a depth of 0.05 m, and (ii) broadcast, on the soil surface. The P fertilization time treatments included: (i) 90 days before sowing, (ii) 45 days before sowing, and (iii) at sowing of the winter cereal crop (DBS – days before sowing). The 90 and 45 DBS treatments were applied in the fall over the summer crop residues, and the soil was left fallow until winter crop sowing. The P spatial distribution treatments were as follows: (i) application with 0.17 m horizontal spacing and 0.05 m depth (0.17 × 0.05 m), and (ii) application with 0.40 m horizontal spacing and 0.10 m depth (0.40 × 0.10 m). Additional control treatment received no P fertilizer but was supplied with N and K fertilizers at rates equivalent to those applied in the other treatments.
Crop rotations and phosphate fertilization
The same crop rotation was used at both field trials over the four cropping years. During the winter seasons at the Candói site (medium STP), black oat (Avena strigosa Schreb) was cultivated in three seasons, common vetch (Vicia sativa) in one season, and barley (Hordeum vulgare L.) in one season. In the summer, soybean (Glycine max (L.)) was grown in three seasons and corn (Zea mays L.) in one season. At the Pinhão site (high STP), winter crops included black oat in three seasons, fodder radish (Raphanus sativus L.) in one season, and barley in one season. In the summer, soybeans were also grown in three seasons and corn in one (Table 4). The total amount of P applied over four years across the 10 treatments that received P was 317 and 186 kg ha-1 of P for the field trials with medium STP (Candói) and high initial STP (Pinhão), respectively (Table 4).
Crop rotation from 2019 to 2023 in both field trials and the amount of P applied according to the soil test P (STP) condition in two subtropical Oxisols under no-tillage, State of Paraná (PR), Southern Brazil
Crop and relative yield
Only the first black oat crop was evaluated for dry matter production at the beginning of grain filling, and the results were expressed in Mg ha-1. Black oat, forage radish, and common vetch crops were used as cover crops, and their grain yield was not evaluated. For soybean, corn, and barley, grain yield was assessed at 130 g kg-1 moisture content and expressed in Mg ha-1. Based on the grain yield data, relative yield (RY, %) was calculated using the “MAX” method described by Pearce et al. (2022). In each treatment, RY was calculated by dividing the average yield for that treatment by the highest average yield observed across all treatments, regardless of whether it was the control or a treatment with P fertilization. This method produces a maximum RY value of 100 %, indicating that the yield of the treatment with 100 % RY was likely not limited by the availability of the evaluated nutrient.
Soil sampling and analysis
Soil samples were collected between crop rows using a hand spade from the 0.00–0.10 and 0.10–0.20 m layers after the summer crop harvests in the 2019/2020, 2021/2022, and 2022/2023 seasons, corresponding to the first, third, and fourth years of the experiment. Soil sampling was not possible in the second year of evaluation. Samples were air-dried, mechanically ground, sieved to 2 mm, and analyzed for available P using the Mehlich-1 extractant (0.05 mol L-1 HCl + 0.0125 mol L-1 H₂SO₄) (Mehlich, 1953), following the methodology described by Tedesco et al. (1995). The available P content in the 0.00–0.20 m layer was estimated as the average of the available P in the 0.00–0.10 and 0.10–0.20 m layers.
Compilation of calibration data from the literature
Calibration data from Vieira et al. (2015), the study that served as the basis for the fertilizer recommendation manual for the South-Central region of Paraná (Fontoura et al., 2015), were compiled. All data on available P extracted by Mehlich-1 and RY (%) were obtained from digitized figures. For the 0.00–0.10 m soil layer, a total of 142 observations were compiled: 64 from soybean, 24 from corn, 30 from barley, 17 from wheat, and 6 from white oat crops. For the 0.00–0.20 m soil layer, a total of 144 observations were compiled: 68 from soybean, 23 from corn, 30 from barley, 17 from wheat, and 6 from white oat crops.
Estimation of CSTV of P using different approaches
Initially, the CSTV of P in different soil layers (0.00–0.10, 0.10–0.20, and 0.00–0.20 m) was estimated based on experimental data obtained under different P fertilization management strategies, conducted in soils with medium and high levels of STP published by Lima et al. (2025a,b). For each crop season and site combination, the average RY was paired with the corresponding average STP value, considering the replicates within each treatment. This pairing resulted in individual data points used in scatter plots depicting the relationship between available P and crop response. A total of 11 treatments (with and without P application) were considered (Table 3) and evaluated across three crop seasons and two experimental sites, yielding 66 observations (n = 66).
In the second stage of the study, the dataset comprised both the experimental data generated in this study and the database from Vieira et al. (2015). Then, the CSTV of P was estimated at different layers (0.00–0.10, 0.10–0.20, and 0.00–0.20 m), as well as separately for winter crops, summer crops, and for both winter and summer crops combined.
Five models were selected to estimate the relationship between available P and crop response, using a sufficiency level of 90 % to estimate the CSTV of P in all models. The models used were: Cate and Nelson (1965), Modified Arcsine Logarithm Calibration Curve (ALCC), Mitscherlich, Linear-plateau (LP), and Quadratic-plateau (QP). The uncertainty associated with the estimates was evaluated by bootstrap analysis, extracting the 0.025 and 0.975 quantiles from the distribution to obtain the 95 % confidence interval (CI). For each dataset, 5,000 resamplings were performed and used to calculate the lower (LCI) and upper (UCI) bounds of the 95 % confidence interval for each fit.
Statistical analysis
All analyses were performed using RStudio version 4.2.0. The code for model fitting and bootstrap sampling was adapted from the Soil Test Correlation and Calibration package (soiltestcorr 2.2.0) (Correndo et al., 2023). Model quality was evaluated based on the pseudo-R2, Akaike Information Criterion (AIC), and the width of the confidence intervals.
RESULTS AND DISCUSSION
Critical soil test values (CSTV) of P using different soil layers
For the dataset measured between 2019 and 2023 at both sites (medium and high STP), it was not possible to estimate the CSTV of P by fitting the modified ALCC, Mitscherlich, LP, or QP models for any of the evaluated soil layers (0.00–0.20, 0.00–0.10, or 0.10–0.20 m) (Table 5). The only model to successfully estimate the CSTV of P was that of Cate and Nelson (1965). For the 0.00–0.20 m layer, the CSTV of P estimated by Cate and Nelson (3.7 mg dm-3; Table 5) was approximately half of the value reported by Vieira et al. (2015) (8 mg dm-3) using the Mitscherlich model. Similarly, Jordan-Meille et al. (2024) found that the Cate and Nelson approach generally yields lower CSTV than other models.
The poor fit of the continuous models was mainly due to the absence of a clear yield response to P application, since soil P availability was already sufficient to sustain high yields. Under such conditions, the Cate and Nelson model performs better because it classifies observations into two categories (responsive and non-responsive) based on a target relative yield, rather than assuming a gradual or continuous response function (Jordan-Meille et al.,2024). This categorical approach allows the identification of a threshold even when yield variation is minimal or absent. Nevertheless, the Cate and Nelson model has been criticized for its limited agronomic realism (Colomb et al., 2007), as it does not account for potential yield losses near the CSTV of P. In contrast, models such as Plateau or Mitscherlich are often considered more agronomically realistic because they represent minimal or no yield loss near the CSTV. Despite this limitation, several studies have shown that the Cate and Nelson approach remains useful when yield response is weak or inconsistent, as it tends to identify a conservative CSTV corresponding to the point of highest P-use efficiency (Mallarino and Blackmer, 1992; Recena et al., 2016).
Summary of the calculated critical soil test value of P adjusted to 90 % of relative yield grouped by different soil layers and adjusted models, including all summer crops and field trials in different soil test phosphorus (STP) conditions established on two subtropical Oxisols in Paraná State, Brazil
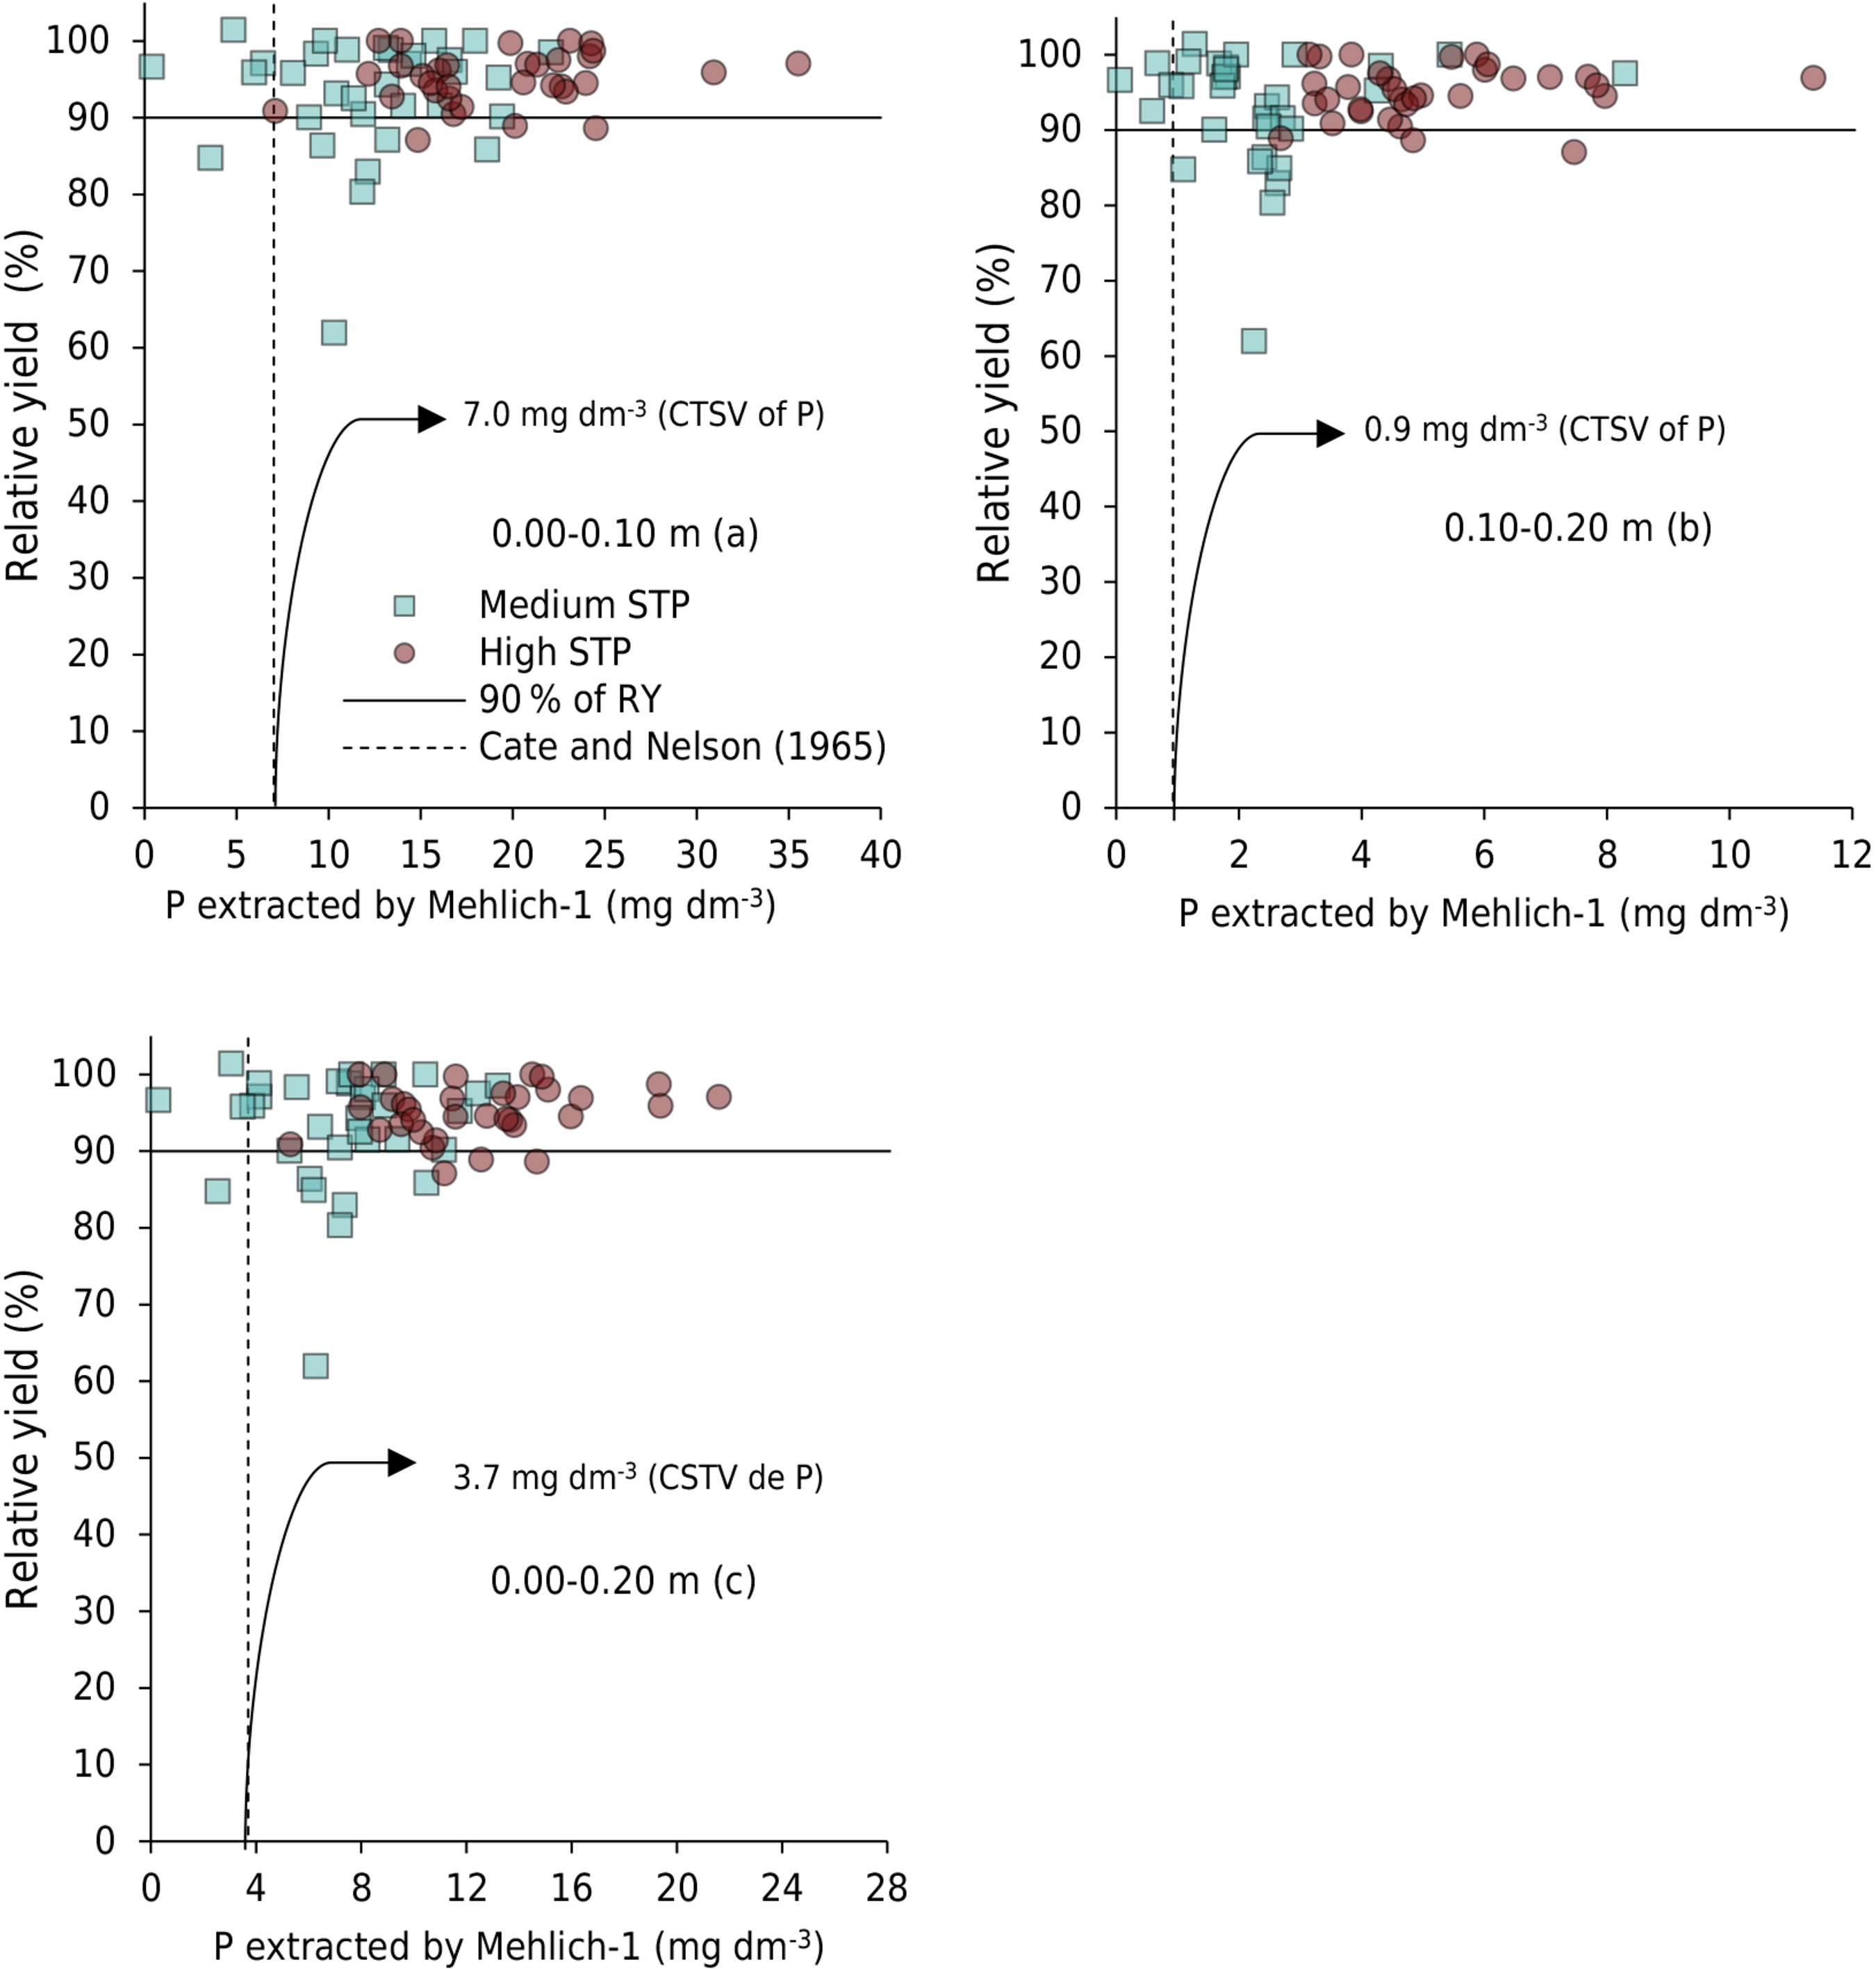
On the other hand, the CSTV of P estimated by the Cate and Nelson (1965) model for individual crops in each experiment for the 0.00–0.20 m layer ranged from 4.6 to 7.7 mg dm-3 P in soils with medium initial STP and from 8.8 to 13.1 mg dm-3 P in soils with initial high STP (Supplementary data). These CSTVs fall within the range of values established by the fertilizer recommendation guidelines for the South-Central region of Paraná (8 mg dm-3) and for the state of Paraná for soils with clay content greater than 400 g kg-1 (10 mg dm-3) (Fontoura et al., 2015; Paulleti and Motta, 2019).
The CSTV of P increased when calculated using more superficial soil layers. Comparing the CSTV obtained for the 0.00–0.20 m layer with that of the 0.00–0.10 m layer showed an average increase of 91 % (Table 5). However, when considering the confidence interval limits, overlap was observed between the estimates for the two layers, indicating no significant difference. The CSTV currently established for the 0.00–0.10 m layer in soils under long-term no-tillage with clay content above 600 g kg-1 in the states of Santa Catarina and Rio Grande do Sul is 9 mg dm-3 of P extracted by Mehlich-1 (CQFS-RS/SC, 2016), a value that also falls within the range observed in this study (Figure 1a).
The greater increase in CSTV observed in the 0.00–0.10 m layer is due to the accumulation of P in the soil surface layer (Table 5 and Figure 1a). Phosphorus gradients in soil are naturally formed by the deposition of plant residues on the surface in NT systems; this process is intensified in soils with high clay content, such as Oxisols (Tiecher et al., 2017, 2023). This surface accumulation has direct implications for the soil sampling strategy. When sampling does not adequately capture the top few centimeters of the surface layer, the actual available P levels in the soil are underestimated. This situation is especially critical when P is applied as a broadcast, a common practice in many tropical and subtropical regions where insufficient attention is given to placement method and its effects on sampling representativeness (Tiecher et al., 2023). As a consequence, excessive rates of phosphate fertilizer may be inappropriately recommended, increasing production costs and enhancing nutrient loss to the environment (Dodd and Sharpley, 2016).
Critical soil test value (CSTV) of P estimated with the Cate and Nelson (1965) model at 90 % of relative yield (RY) grouped by 0.00-0.10 m (a), 0.10-0.20 m (b) and 0.00-0.20 m (c) soil layers, combining all summer crops evaluated in the medium and high soil test phosphorus (STP) field trials established on subtropical Oxisols in the Paraná State, Brazil.
The average STP in the 0.10–0.20 m layer represents 25 % of the CSTV of P level in the diagnostic soil layer for the South-Central region of Paraná State (0.00–0.20 m) (Table 5), which corroborates with Bellinaso et al. (2021), who showed that 30 % of this ratio was sufficient to maintain soybean crop yield. It should also be considered that, although the P gradient observed in our soil evaluations is not a desirable condition given the fluctuations in water availability during the cropping seasons (Table 2), the CSTV obtained for the 0.10–0.20 m layer (Figure 1b) proved sufficient to sustain crop yield.
In the present study, there was a low frequency of relative yields with low values, with most observations ranging between 80 and 100 % of the maximum yield (Figure 1), indicating that the accumulation of P in the soil surface layer, although not desirable, was sufficient to maintain crop yields, even for the control treatment that did not receive any P application for four years. This demonstrates the buffering capacity of P in the soil solution derived from the mineral fraction of these clayey Oxisols in the South-Central region of Paraná, especially considering that these soils already had medium to high STP levels at the start of the experiment. Gatiboni et al. (2025) reported that, under the same initial conditions, it would be possible to cultivate for up to 8 years without P replacement, with only a 50 % reduction in the initial soil available P content. Furthermore, the results suggest that, in addition to P export through harvest, there is a P cycling process via decomposition of crop residues, which enriches the soil surface and mineralizes organic P fractions. In consolidated NT systems (>20 years), these organic forms contribute to maintaining crop yield (Tiecher et al., 2018; Gatiboni et al., 2021) and potentially explain part of the variation observed in the confidence intervals of the CSTV estimates.
CSTV of P for Oxisols in the South-Central region of Paraná
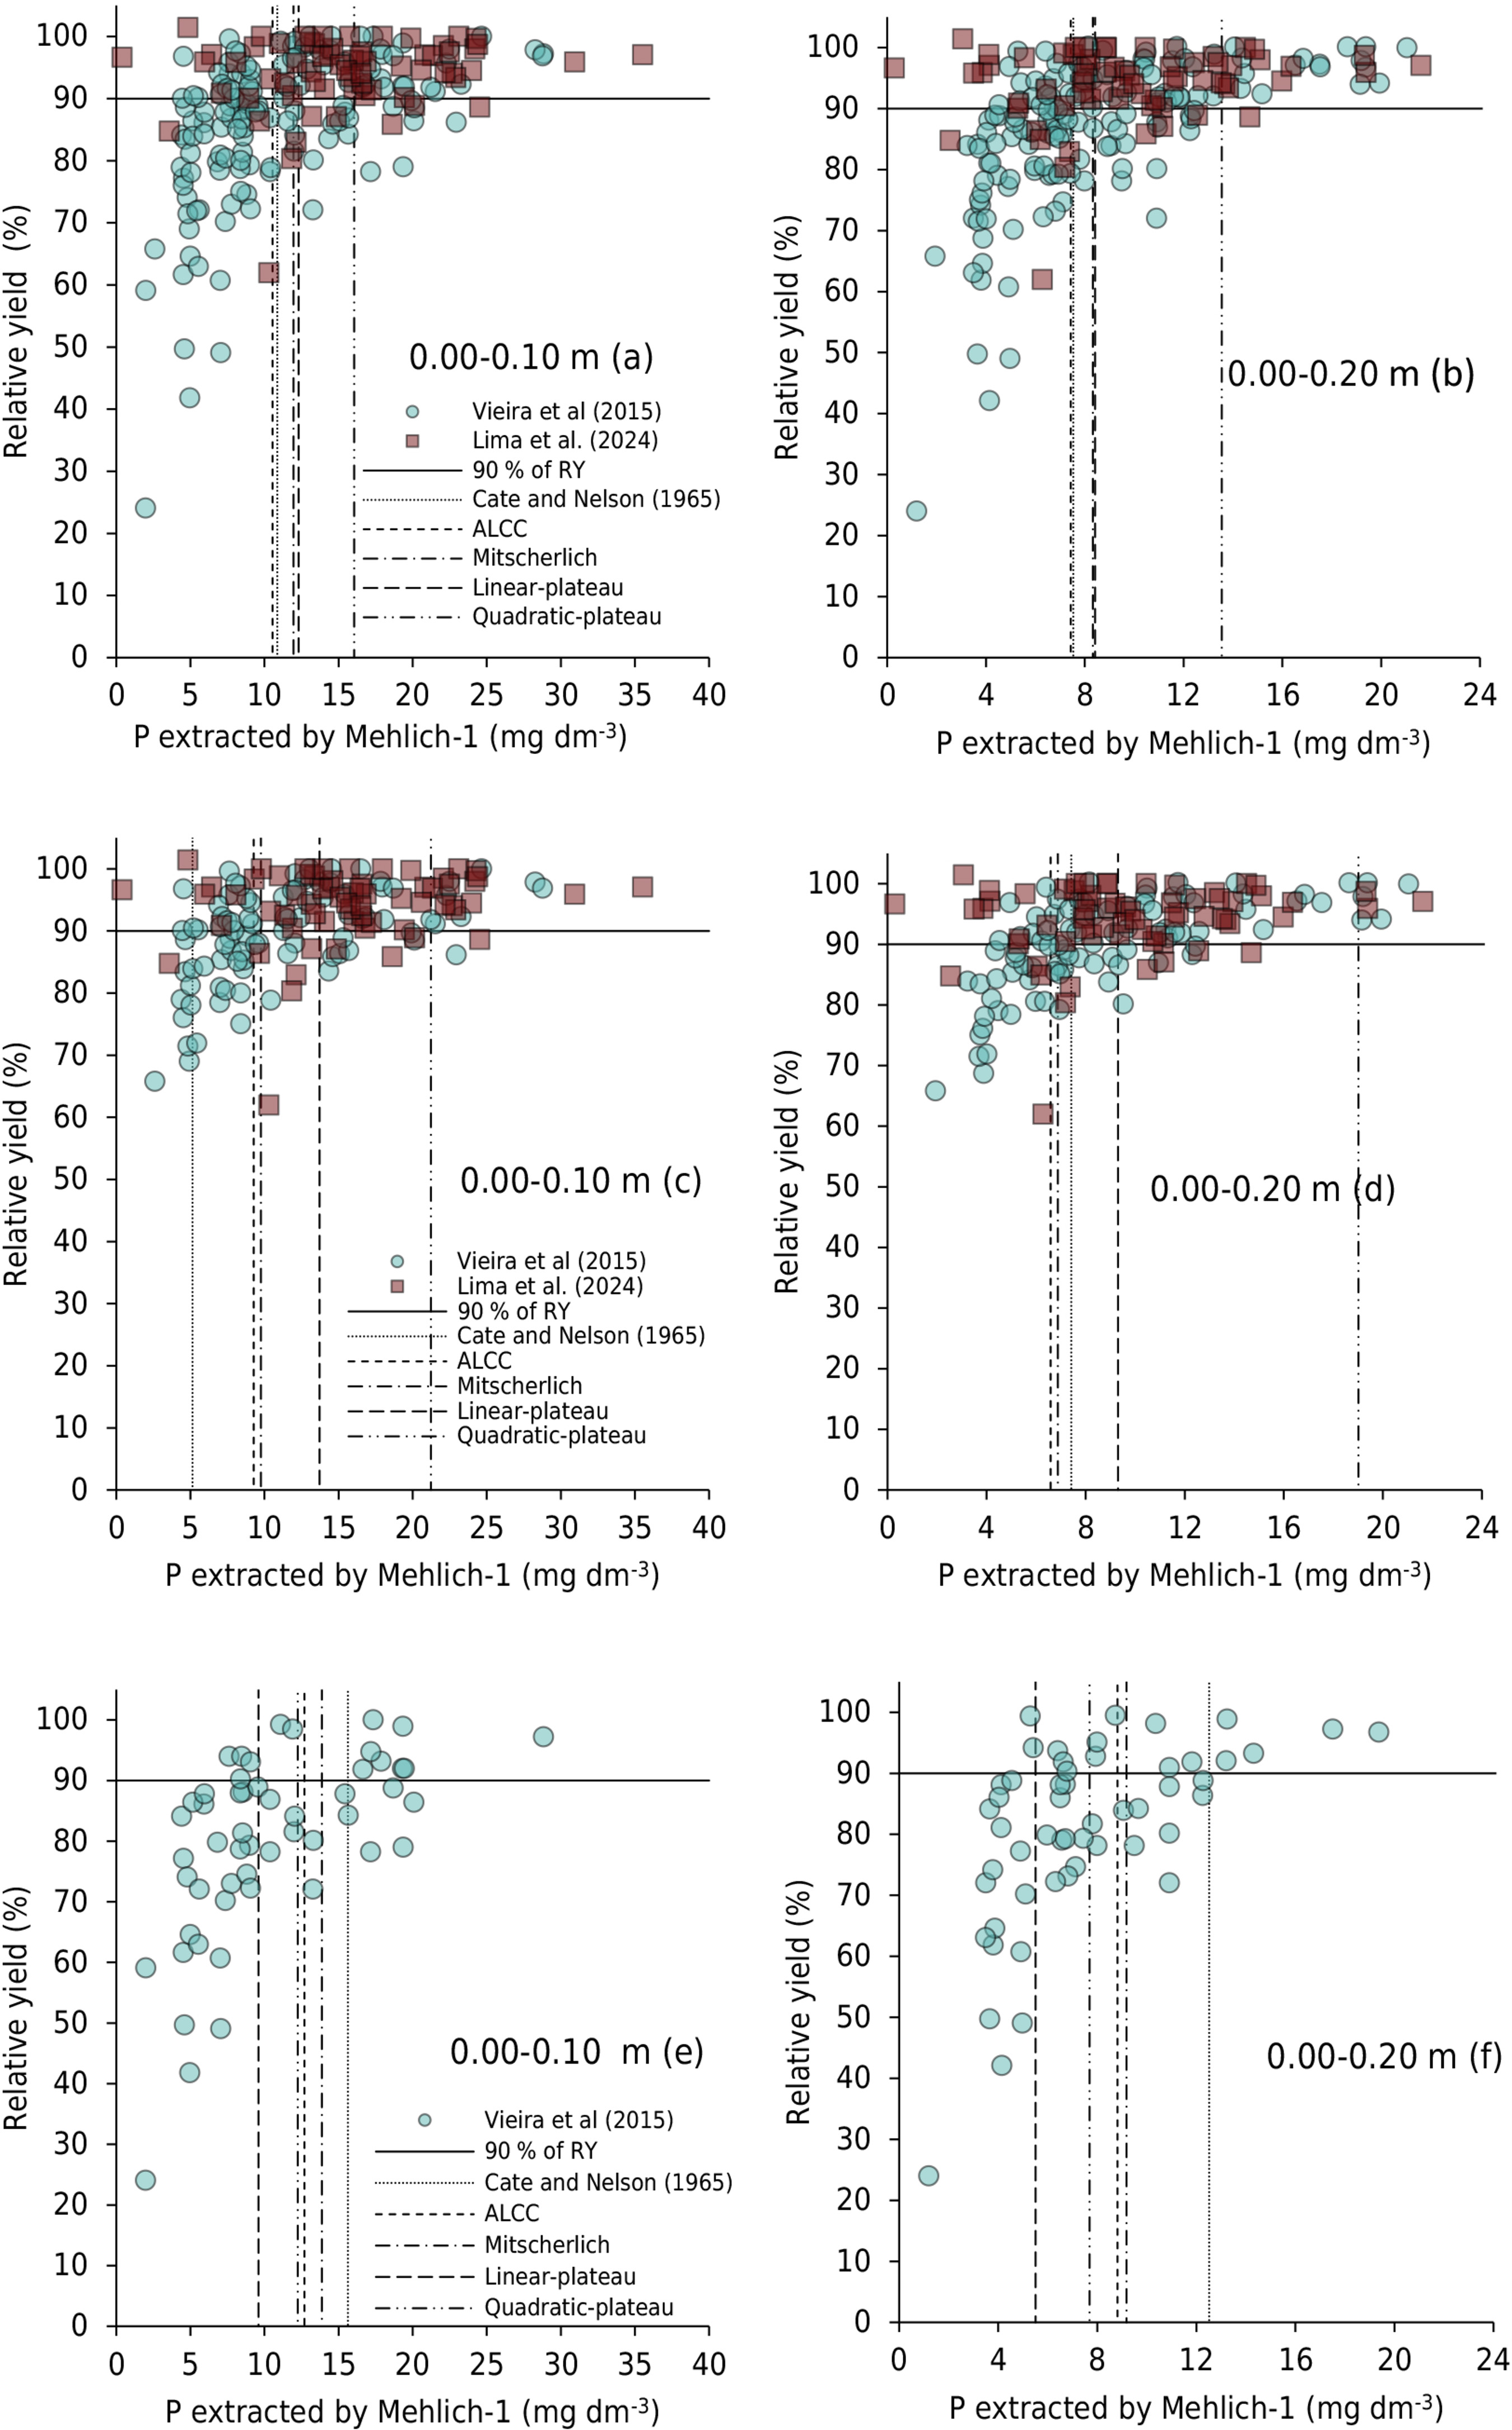
Although all fitted models were statistically significant for the crop groups and soil layers, the CSTV values obtained, despite being numerically different, did not show statistically significant differences among them (Table 6). This indicates consistency among the tested models, suggesting that regardless of the approach adopted, the estimated CSTV tends to converge within a similar confidence interval range.
Summary of the calculated critical soil test value CSTV of P (CSTV of P) adjusted to 90 % of relative yield grouped by different soil layers and adjusted models, with all data from Lima (2024) and Vieira et al. (2015), Paraná State, Brazil
The CSTV of P calculated for the diagnostic soil layer of 0.00–0.20 m when combining summer and winter crops ranged from 7.4 to 13.5 mg dm-3 (Figures 2a and 2b; Table 6). For summer crops, the CSTV of P ranged from 6.6 to 19.0 mg dm-3 (Figures 2c and 2d; Table 6), while for winter crops it ranged from 5.5 to 12.5 mg dm-3 (Figures 2e and 2f; Table 6). These estimates are broad and, in many cases, differ substantially from the reference value currently adopted by the regional guidelines (8 mg dm-3) (Fontoura et al., 2015). However, as the confidence intervals of the models overlap, these differences are not statistically significant.
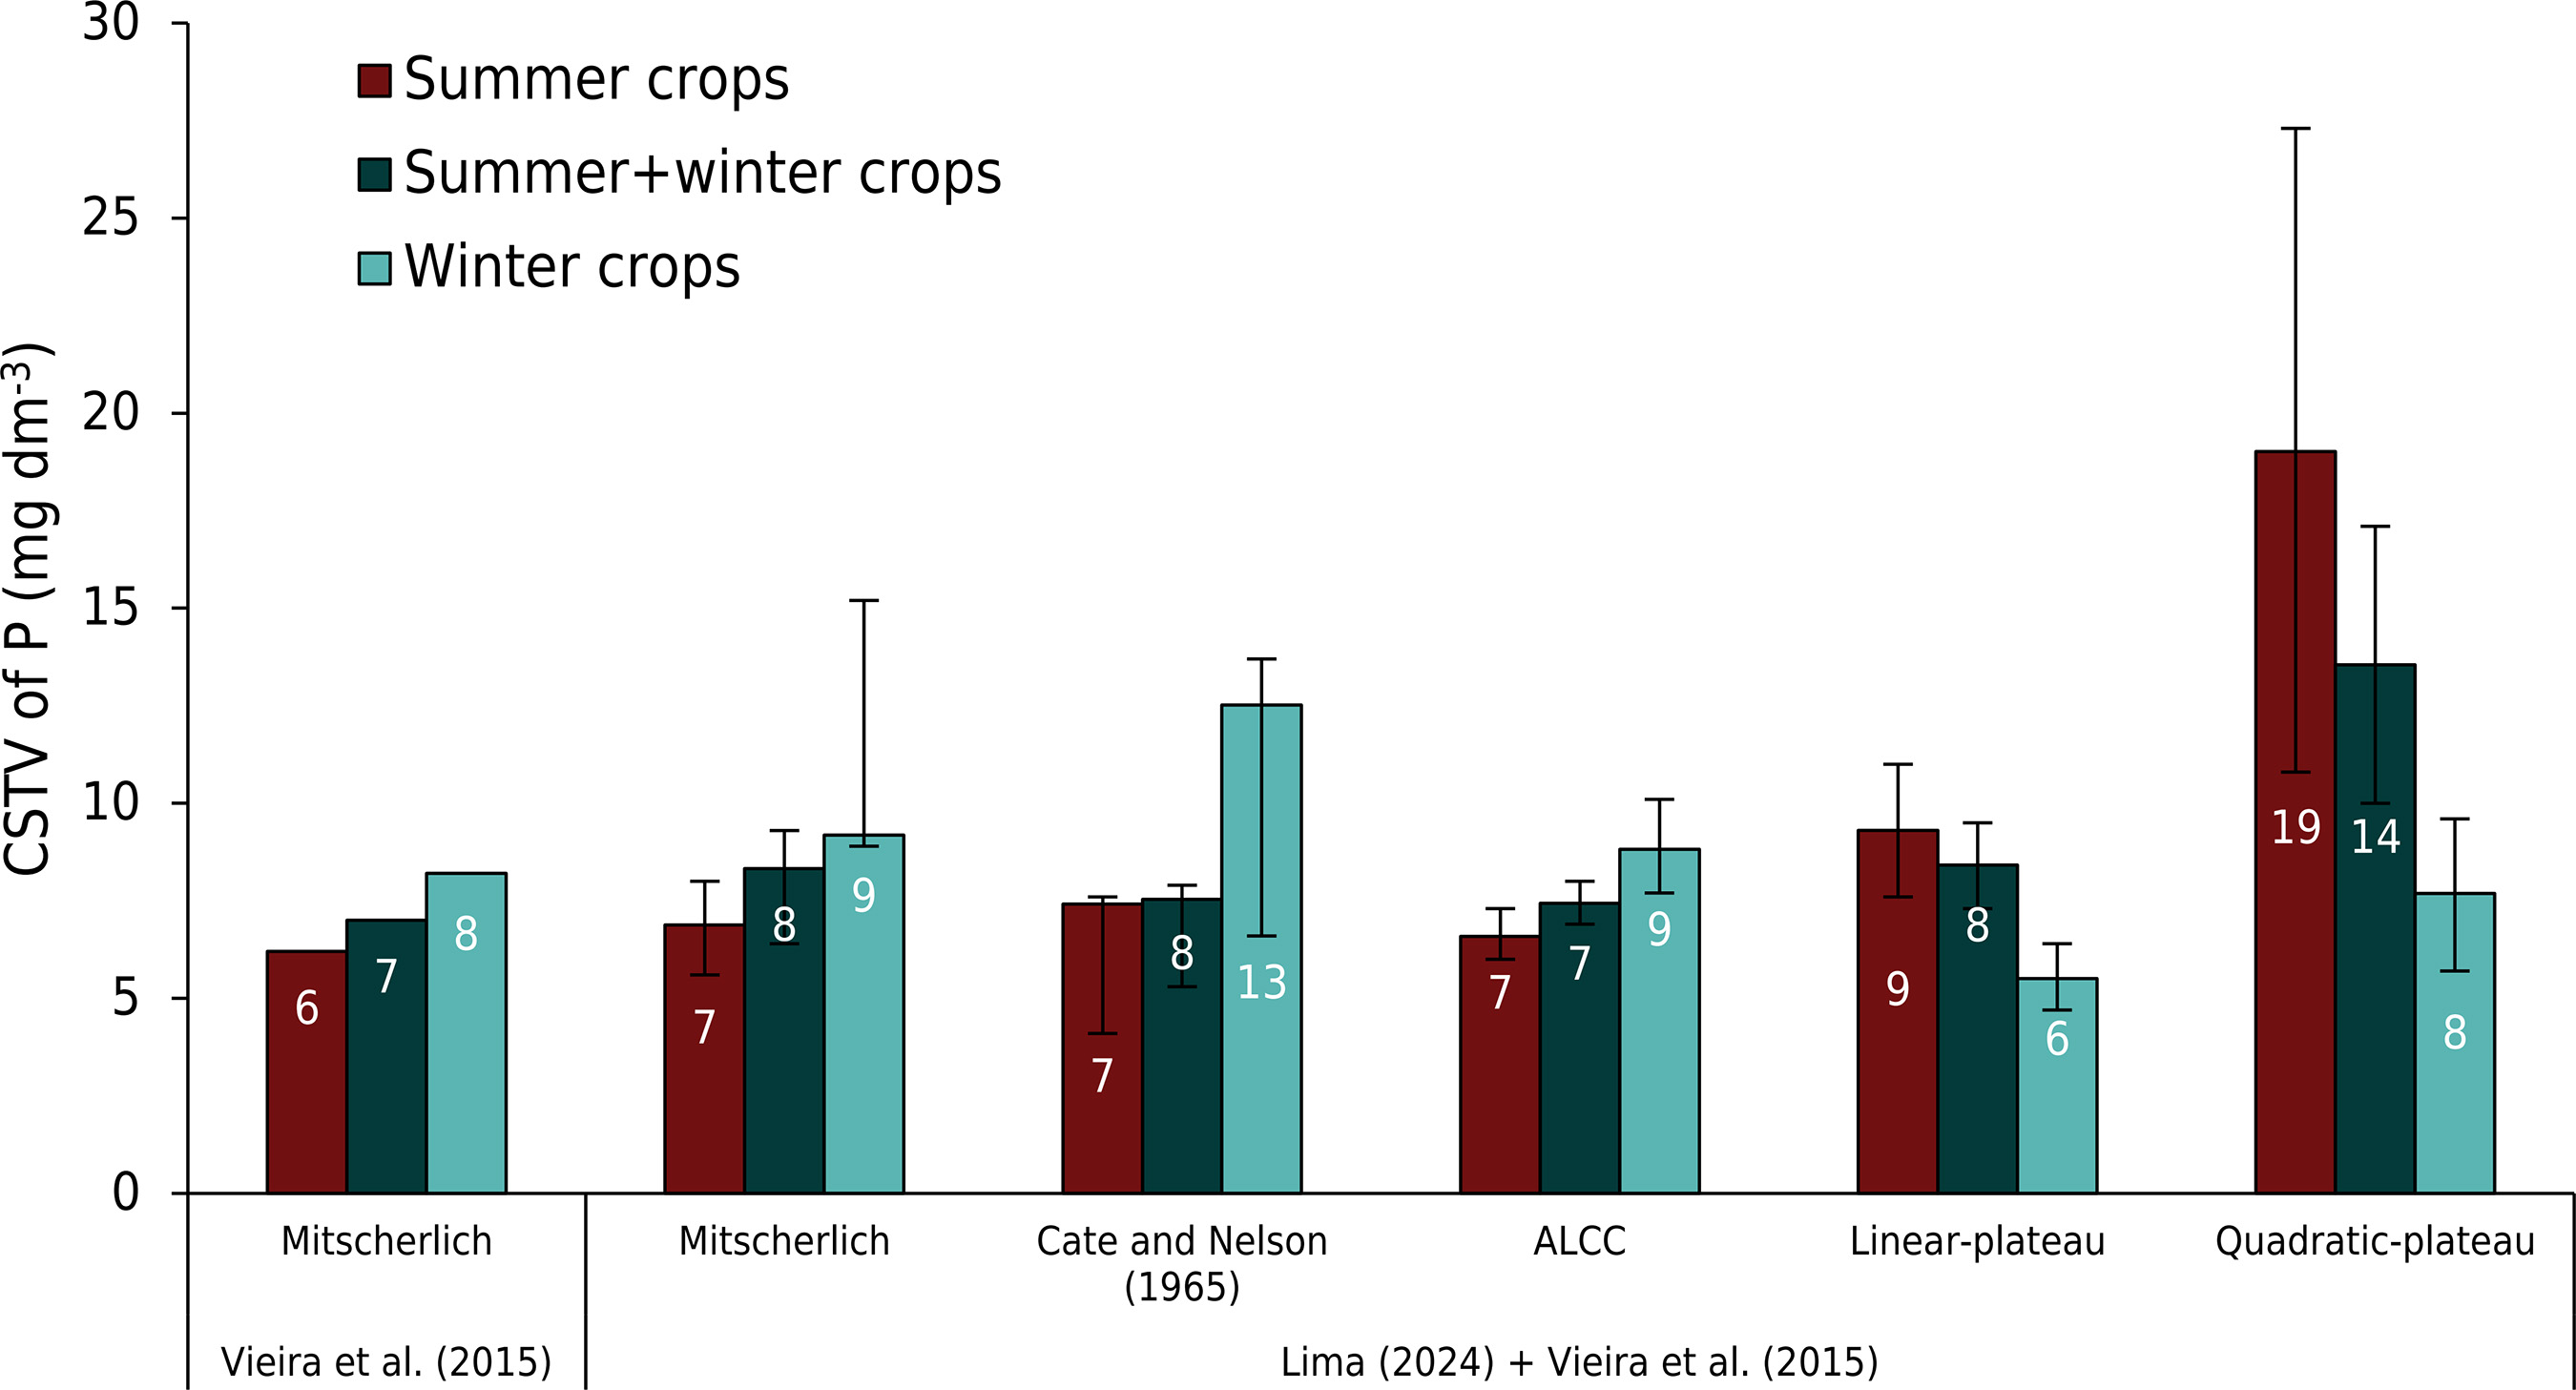
It is important to highlight that the models showed greater confidence interval (CI) ranges when considering summer crops (soybean + corn) (Figure 3), which can be attributed to the distinct nutritional requirements of these crops. Previous studies conducted in the same region (Vieira et al., 2015, 2016) and in contrasting environments, such as North Carolina (Tiecher et al., 2023), have shown that corn demands a higher CSTV of P than soybean, resulting in greater variability in models including both crops.
Additionally, the Cate and Nelson (1965), ALCC, and Mitscherlich models presented higher CSTVs of P for winter crops (Table 6 and Figure 3), consistent with the regional guideline (Fontoura et al., 2015). Cereals are more demanding in P due to lower temperatures during the growing season, which reduce phosphate diffusion (Vieira et al., 2015). On the other hand, the LP and QP models resulted in higher CSTVs of P specifically for summer crops (Figure 3), as also observed by Jordan-Meille et al. (2024). The Mitscherlich model, in turn, generated a CSTV of P consistent with the value currently adopted in the regional guideline (Fontoura et al., 2015) (Table 6 and Figure 3) and showed the best overall statistical performance for winter crops, as indicated by the lowest AIC values, highest pseudo-R², and significant p-values for both the 0.00–0.10 and 0.00–0.20 m soil layers.
However, there is no universal consensus on which model should be prioritized when differences arise among them. Researchers have selected models based on expectations of nonlinear biological responses (Melsted and Peck, 1977), while others chose models for simplicity (Cate and Nelson, 1971). Some studies evaluate multiple models and select the one with the best statistical fit (Alvarado et al., 2019). Often, authors do not provide a clear justification for their choice beyond precedence in similar research (Singh et al., 2019). Historically, in Southern Brazil, the Mitscherlich model has been adopted for fertilizer calibration experiments. It is an asymptotic, diminishing-returns model originally proposed by Mitscherlich (1909) and applied to Brazilian soils by Gomes (1953). The combination of existing data with the results from the present study underscores the importance of expanding databases for P calibration within recommendation systems, aiming not only to enlarge the dataset for commonly used models but also to enable more robust comparisons with alternative approaches. Model selection should consider crop type, soil properties, and the context of the dataset. Furthermore, expanding databases and sharing methodologies (Slaton et al., 2022) enhance the precision of CSTV estimation across diverse management practices and regions.
The results of the present study were consistent with the current recommendation systems in the Southern region of Brazil, and also demonstrated that the CSTV of P is not static, as it varies according to soil layer, crop type, model used, and other factors. This suggests the need for future studies involving the influence of additional factors on the CSTV, such as the P placement with more stratified soil sampling (i.e., 2.5 or 5 cm), aiming to investigate how these affect the vertical distribution of P and the CSTV, since current recommendation systems do not consider this factor. It is also suggested that field trials be evaluated on different soil types, including cropping years with adverse climatic conditions, as it is essential to develop strategies that enhance P use efficiency in the face of climate change, given that P becomes one of the limiting nutrients in this scenario.
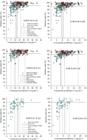
Critical soil test value (CSTV) of P adjusted to 90 % of relative yield grouped by 0.00-0.10 m and 0.00-0.20 m soil layers: Summer+winter crops (a and b); Summer crops (c and d); Winter crops (e and f), with all data from field trials established in subtropical Oxisols in the Paraná State, Brazil.
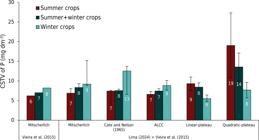
Critical soil test value (CSTV) of P in the 0.00-0.20 m soil layer by each adjusted model (Cate and Nelson (1965), ALCC, Mitscherlich, Linear-plateau, and Quadratic-plateau), combining all data from field trials established in subtropical Oxisols at the Paraná State, Brazil. Whiskers represent the 95 % confidence interval (LCI–UCI); the central point indicates the estimated CSTV.
CONCLUSIONS
This study highlights the importance of revising P calibration systems in Southern Brazil, particularly under long-term no-tillage conditions. The results demonstrate that current fertilizer recommendation systems can be refined by integrating new experimental data, alternative modeling approaches, and diagnostic soil layers beyond the traditional 0.00–0.20 m depth.
The findings also emphasize the need to standardize the criteria used for estimating the critical soil test value and to expand calibration databases to include different soil types, crops, and management systems. These steps are essential to enhance the agronomic efficiency of phosphate fertilization, reduce environmental risks, and strengthen the scientific basis for sustainable nutrient management.
The poor fit of the models under medium and high soil-test P conditions reflected sufficient P availability in the soil surface layer at the studied sites, which maintained high yields even without P application for 4 years. All models evaluated (Cate and Nelson, ALCC, Mitscherlich, Linear-plateau, and Quadratic-plateau) showed significant fits for estimating critical soil test values of P using an expanded database combining new and previously published datasets.
The estimated critical soil test values of P ranged from 7.4 to 13.5 mg dm-3 when combining summer and winter crops, from 6.6 to 19.0 mg dm-3 for summer crops, and from 5.5 to 12.5 mg dm-3 for winter crops—broader than the regional reference value currently adopted (8 mg dm-3). Although these variations were not statistically significant due to overlapping confidence intervals, they highlight differences in P requirements among crops and environmental conditions. Among the evaluated models, the Mitscherlich model showed the best performance for winter crops in both the 0.00–0.10 and 0.00–0.20 m layers, reinforcing the robustness and reliability of the integrated dataset for calibration purposes.
In consolidated no-tillage systems, the 0.10–0.20 m soil layer proved to be a reliable diagnostic depth, particularly under conditions of surface P accumulation or limited rainfall, when roots explore deeper layers for water and nutrients. Adopting this layer for diagnostic purposes could improve the accuracy of soil P assessment, avoiding overestimation (when only the 0.00–0.10 m layer is used) or underestimation (when only the 0.00–0.20 m layer is used) of soil P availability, and strengthen the regional basis for fertilizer recommendation systems in subtropical Oxisols.
-
How to cite:
Lima AP, Fontoura SMV, Filippi D, Lourenzi CR, Vieira RCB, Tiecher T. Phosphorus critical soil test value reassessment in subtropical Oxisols under no-till: Insights from South-Central Paraná. Rev Bras Cienc Solo. 2026;50:e0250136. https://doi.org/10.36783/18069657rbcs20250136
-
FUNDING
This study was supported by the Brazilian Federal Foundation for Support and Evaluation of Graduate Education (CAPES), Grant/Award Number: 88887.615015/2021-00, through the PhD scholarship granted to the first author. Also, with the support of a scholarship by the UFRGSCAPES Print program. T. Tiecher thanks the National Council for Scientific and Technological Development (CNPq) of Brazil for the research grant (311788/2019-0).
SUPPLEMENTARY MATERIALS
Supplementary data to this article can be found online at https://www.rbcsjournal.org/wp-content/uploads/articles_xml/1806-9657-rbcs-50-e0250136/1806-9657-rbcs-50-e0250136-suppl01.pdf
DATA AVAILABILITY
The data will be provided upon request.
References
-
Alvarado JS, McCray JM, Erickson JE, Sandhu HS, Bhadha JH. Sugarcane biomass yield response to phosphorus fertilizer on four mineral soils as related to extractable soil phosphorus. Commun Soil Sci Plant Anal. 2019;50:2960-70. https://doi.org/10.1080/00103624.2019.1689260
» https://doi.org/10.1080/00103624.2019.1689260 - Amorim MB. Manejo da adubação fosfatada, resposta das culturas e formas de fósforo em Latossolos em plantio direto [thesis]. Porto Alegre: Universidade Federal do Rio Grande do Sul; 2020.
-
Bellinaso RJS, Tiecher T, Vargas JPR, Rheinheimer DS. Crop yields in no-tillage are severely limited by low availability of P and high acidity of the soil in depth. Soil Res. 2021;60:33-49. https://doi.org/10.1071/SR21021
» https://doi.org/10.1071/SR21021 -
Bortoluzzi EC, Pérez CA, Ardisson JD, Tiecher T, Caner L. Occurrence of iron and aluminum sesquioxides and their implications for P sorption in subtropical soils. Appl Clay Sci. 2015;104:196-204. https://doi.org/10.1016/j.clay.2014.11.032
» https://doi.org/10.1016/j.clay.2014.11.032 -
Cate RB, Nelson LA. A simple statistical procedure for partitioning soil test correlation data into two classes. Soil Sci Soc Am J. 1971;35:658-60. https://doi.org/10.2136/sssaj1971.03615995003500040048x
» https://doi.org/10.2136/sssaj1971.03615995003500040048x - Cate RB Jr, Nelson LA. A rapid method for correlation of soil test analysis with plant response data. Raleigh: North Carolina Agric Exp Stn; 1965. (Technical bulletin, 1).
-
Colomb B, Debaeke P, Jouany C, Nolot JM. Phosphorus management in low-input stockless cropping systems: Crop and soil responses to contrasting P regimes in a 36-year experiment in southern France. Eur J Agron. 2007;26:154-65. https://doi.org/10.1016/j.eja.2006.09.004
» https://doi.org/10.1016/j.eja.2006.09.004 -
Correndo AA, Pearce AW, Bolster CH, Spargo JT, Osmond D, Ciampitti IA. The soiltestcorr R package: An accessible framework for reproducible correlation analysis of crop yield and soil test data. SoftwareX. 2023;21:101275. https://doi.org/10.1016/j.softx.2022.101275
» https://doi.org/10.1016/j.softx.2022.101275 - Comissão de Química e Fertilidade do Solo - CQFS-RS/SC. Manual de calagem e adubação para os Estados do Rio Grande do Sul e de Santa Catarina. 11. ed. Porto Alegre: Sociedade Brasileira de Ciência do Solo - Núcleo Regional Sul; 2016.
-
Crozier CR, Naderman GC, Tucker MR, Sugg RE. Nutrient and pH stratification with conventional and no-till management. Commun Soil Sci Plant Anal. 1999;30:65-74. https://doi.org/10.1080/00103629909370184
» https://doi.org/10.1080/00103629909370184 -
Dodd RJ, Sharpley AN. Conservation practice effectiveness and adoption: Unintended consequences and implications for sustainable phosphorus management. Nutr Cycl Agroecosyst. 2016;104:373-92. https://doi.org/10.1007/s10705-015-9748-8
» https://doi.org/10.1007/s10705-015-9748-8 -
Filippi D, Gatiboni L, Crozier C, Osmond D, Hardy D. Effect of model choice on critical soil test value of phosphorus for corn in long-term trials in North Carolina. Soil Sci Soc Am J. 2025;89:e70104. https://doi.org/10.1002/saj2.70104
» https://doi.org/10.1002/saj2.70104 -
Fink JR, Inda AV, Tiecher T, Barrón V. Iron oxides and organic matter on soil phosphorus availability. Cienc Agrotec. 2016;40:369-79. https://doi.org/10.1590/1413-70542016404023016
» https://doi.org/10.1590/1413-70542016404023016 - Fontoura SMV, Vieira RCB, Bayer C, Viero F, Anghinoni I, Moraes RP. Fertilidade do solo e seu manejo em sistema plantio direto no Centro-Sul do Paraná. Guarapuava: Fundação Agrária de Pesquisa Agropecuária; 2015.
-
Gatiboni LC, Schmitt DE, Tiecher T, Veloso MG, Santos DR, Kaminski J, Brunetto G. Plant uptake of legacy phosphorus from soils without P fertilization. Nutr Cycl Agroecosyst. 2021;119:139-51. https://doi.org/10.1007/s10705-020-10127-1
» https://doi.org/10.1007/s10705-020-10127-1 -
Gatiboni L, Shober AL, Fiorellino N, Osmond D, Mosesso LR. Drawdown of soil phosphorus by crop removal: A meta-analysis of 56 fields with interrupted fertilization. Agric Environ Lett. 2025;10:e70007. https://doi.org/10.1002/ael2.70007
» https://doi.org/10.1002/ael2.70007 -
Gomes FP. The use of Mitscherlich’s regression law in the analysis of experiments with fertilizers. Biometrics. 1953;9:498-516. https://doi.org/10.2307/3001441
» https://doi.org/10.2307/3001441 -
Guera KCS, Fonseca AF, Harkatin S. Phosphorus use in soybean in integrated production system under anticipation of phosphate fertilization. Rev Cienc Agron. 2020;51:e20196881. https://doi.org/10.5935/1806-6690.20200044
» https://doi.org/10.5935/1806-6690.20200044 -
Hansel FD, Ruiz Diaz DA, Amado TJC, Rosso LHM. Deep banding increases phosphorus removal by soybean grown under no-tillage production systems. Agron J. 2017;109:1091-8. https://doi.org/10.2134/agronj2016.09.0533
» https://doi.org/10.2134/agronj2016.09.0533 -
Hopkins BG, Hansen NC. Phosphorus management in high-yield systems. J Environ Qual. 2019;48:1265-80. https://doi.org/10.2134/jeq2019.03.0130
» https://doi.org/10.2134/jeq2019.03.0130 -
Jordan-Meille L, Mollier A, Poulton P, Glendining M, Jouany C, Gratecap J-B, Hanocq D, Montagnier C, Denoroy P. Using long-term experiments to assess statistical models for determining critical P fertilisation thresholds. Eur J Agron. 2024;158:127220. https://doi.org/10.1016/j.eja.2024.127220
» https://doi.org/10.1016/j.eja.2024.127220 - Lantmann AF, Roessing AC, Sfredo GJ, Oliveira MCN. Adubação fosfatada e potássica para sucessão soja-trigo em Latossolo Roxo distrófico sob semeadura direta. Londrina: Embrapa Soja; 1996. (Circular técnica, 15).
- Lima AP. Manejo do fósforo em solos subtropicais [thesis]. Porto Alegre: Universidade Federal do Rio Grande do Sul; 2024.
-
Lima AP, Fontoura SMV, Moraes RP, Bayer C, Gatiboni L, Tiecher T. Phosphate fertilization strategies and placement effects on grain crop yields in subtropical no-till Oxisols. Rev Bras Cienc Solo. 2025a;49:e0240071. https://doi.org/10.36783/18069657rbcs20240071
» https://doi.org/10.36783/18069657rbcs20240071 -
Lima AP, Fontoura SMV, Eckert DJ, Martins AP, Vieira RCB, Bayer C, Tiecher T. Phosphate system fertilization in no-tillage Oxisols: Effects of temporal, horizontal, and vertical distribution of available phosphorus in the soil. J Environ Qual. 2025b;54:1352-67. https://doi.org/10.1002/jeq2.70108
» https://doi.org/10.1002/jeq2.70108 -
Lopes GHA, Ramos LF, Sales ALM, Smerine VGV, Souza Junior AD, Bega RM. Milho safrinha: Efeito da adubação fosfatada associado a área de cultivo. Braz J Anim Environ Res. 2021;4:2196-209. https://doi.org/10.34188/bjaerv4n2-051
» https://doi.org/10.34188/bjaerv4n2-051 -
Mallarino AP, Blackmer AM. Comparison of methods for determining critical concentrations of soil test phosphorus for corn. Agron J. 1992;84:850-6. https://doi.org/10.2134/agronj1992.00021962008400050017x
» https://doi.org/10.2134/agronj1992.00021962008400050017x - Mehlich A. Determination of P, Ca, Mg, K, Na and NH₄ by North Carolina soil testing laboratory. Raleigh: North Carolina State University; 1953.
-
Melsted SW, Peck TR. The Mitscherlich–Bray growth function. In: Peck TR, Cope Jr JT, Whitney DA, editors. Soil testing: Correlation and interpreting analytical results. Madison: ASA; 1977. p. 1-18. https://doi.org/10.2134/asaspecpub29
» https://doi.org/10.2134/asaspecpub29 - Mitscherlich E. The law of the minimum and the law of diminishing soil productivity. Landw Jahrb. 1909;38:537-52.
-
Morales NA, Gatiboni L, Osmond D, Vann R, Kulesza S, Crozier C, Hardy D. Critical soil test values of phosphorus and potassium for soybean and corn in three long-term trials in North Carolina. Soil Sci Soc Am J. 2023;87:278-90. https://doi.org/10.1002/saj2.20491
» https://doi.org/10.1002/saj2.20491 -
Nunes RS, Sousa DMG, Goedert WJ, Oliveira LEZ, Pavinato PS, Pinheiro TD. Distribution of soil phosphorus fractions as a function of long-term soil tillage and phosphate fertilization management. Front Earth Sci. 2020;8:350. https://doi.org/10.3389/feart.2020.00350
» https://doi.org/10.3389/feart.2020.00350 -
Oliveira JS, Inda AV, Barrón V, Torrent J, Tiecher T, Camargo FAO. Soil properties governing phosphorus adsorption in soils of Southern Brazil. Geoderma Reg. 2020;22:e00318. https://doi.org/10.1016/j.geodrs.2020.e00318
» https://doi.org/10.1016/j.geodrs.2020.e00318 -
Oliveira LEZ, Nunes RS, Figueiredo CC, Rein TA. Spatial distribution of soil phosphorus fractions in a clayey Oxisol submitted to long-term phosphate fertilization strategies. Geoderma. 2022;418:115847. https://doi.org/10.1016/j.geoderma.2022.115847
» https://doi.org/10.1016/j.geoderma.2022.115847 - Pauletti V, Motta ACV. Manual de adubação e calagem para o estado do Paraná. 2. ed. Curitiba: Sociedade Brasileira de Ciência do Solo – Núcleo Estadual Paraná; 2019.
-
Pearce AW, Slaton NA, Lyons SE, Bolster CH, Bruulsema TW, Grove JH, Jones JD, McGrath JM, Miguez FE, Nelson NO, Osmond DL, Parvej MR, Pena-Yewtukhiw EM, Spargo JT. Defining relative yield for soil test correlation and calibration trials in the fertilizer recommendation support tool. Soil Sci Soc Am J. 2022;86:1338-53. https://doi.org/10.1002/saj2.20450
» https://doi.org/10.1002/saj2.20450 -
Recena R, Díaz I, Campillo MC, Torrent J, Delgado A. Calculation of threshold Olsen P values for fertilizer response from soil properties. Agron Sustain Dev. 2016;36:54. https://doi.org/10.1007/s13593-016-0387-5
» https://doi.org/10.1007/s13593-016-0387-5 -
Reed V, Finch B, Souza J, Watkins P, Arnall B. Soil sampling depth impact on phosphorus yield response prediction in winter wheat. Agric Environ Lett. 2022;7:e20067. https://doi.org/10.1002/ael2.20067
» https://doi.org/10.1002/ael2.20067 - Riferte FB. Antecipação da adubação fosfatada no inverno: produtividade das culturas e formas de P no solo [thesis]. Ponta Grossa: Universidade Estadual de Ponta Grossa; 2021.
- Santos HG, Jacomine PKT, Anjos LHC, Oliveira VA, Lumbreras JF, Coelho MR, Almeida JA, Araújo Filho JC, Oliveira JB, Cunha TJF. Sistema brasileiro de classificação de solos. 5. ed. rev. ampl. Brasília, DF: Embrapa; 2018.
-
Schlindwein JA, Gianello C. Calibração de métodos de determinação de fósforo em solos cultivados sob sistema plantio direto. Rev Bras Cienc Solo. 2008;32:2037-49. https://doi.org/10.1590/S0100-06832008000500025
» https://doi.org/10.1590/S0100-06832008000500025 -
Siatwiinda SM, Ros GH, Yerokun OA, Vries W. Options to reduce ranges in critical soil nutrient levels used in fertilizer recommendations by accounting for site conditions and methodology: A review. Agron Sustain Dev. 2024;44:9. https://doi.org/10.1007/s13593-023-00943-3
» https://doi.org/10.1007/s13593-023-00943-3 -
Singh S, Savoy HJ, Yin X, Schneider L, Jagadamma S. Phosphorus and potassium fertilizer rate verification for a corn–wheat–soybean rotation system in Tennessee. Agron J. 2019;111:2060-8. https://doi.org/10.2134/agronj2018.12.0749
» https://doi.org/10.2134/agronj2018.12.0749 -
Slaton NA, Lyons SE, Osmond DL, Brouder SM, Culman SW, Drescher G, Volenec JJ. Minimum dataset and metadata guidelines for soil-test correlation and calibration research. Soil Sci Soc Am J. 2022;86:19-33. https://doi.org/10.1002/saj2.20338
» https://doi.org/10.1002/saj2.20338 - Soil Survey Staff. Keys to soil taxonomy. 13th ed. Washington, DC: United States Department of Agriculture, Natural Resources Conservation Service; 2022.
- Tedesco MJ, Gianello C, Bissani CA, Bohnen H, Volkweiss SJ. Análises de solo, plantas e outrosmateriais. 2. ed. Porto Alegre: Universidade Federal do Rio Grande do Sul; 1995. (Boletim técnico, 5).
-
Tiecher T, Santos DR, Kaminski J, Calegari A. Forms of inorganic phosphorus in soil under different long-term soil tillage systems and winter crops. Rev Bras Cienc Solo. 2012;36:271-82. https://doi.org/10.1590/S0100-06832012000100028
» https://doi.org/10.1590/S0100-06832012000100028 -
Tiecher T, Gomes MV, Ambrosini VG, Amorim MB, Bayer C. Assessing linkage between soil phosphorus forms in contrasting tillage systems by path analysis. Soil Till Res. 2018;175:276-80. https://doi.org/10.1016/j.still.2017.09.010
» https://doi.org/10.1016/j.still.2017.09.010 -
Tiecher T, Brunetto G, Rheinheimer D, Gatiboni LC, Comin JJ, Eugênio D. Phosphorus accumulation in a southern Brazilian Ultisol amended with pig manure for nine years. Pesq Agropec Bras. 2021;56:e01957. https://doi.org/10.1590/1678-992X-2019-0157
» https://doi.org/10.1590/1678-992X-2019-0157 -
Tiecher T, Calegari A, Caner L, Rheinheimer DS. Soil fertility and nutrient budget after 23 years of different soil tillage systems and winter cover crops in a subtropical Oxisol. Geoderma. 2017;308:78-85. https://doi.org/10.1016/j.geoderma.2017.08.028
» https://doi.org/10.1016/j.geoderma.2017.08.028 -
Tiecher T, Fontoura SMV, Ambrosini VG, Araújo EA, Alves LA, Bayer C, Gatiboni LC. Soil phosphorus forms and fertilizer use efficiency are affected by tillage and soil acidity management. Geoderma. 2023;435:116495. https://doi.org/10.1016/j.geoderma.2023.116495
» https://doi.org/10.1016/j.geoderma.2023.116495 -
Vieira RCB, Fontoura SMV, Bayer C, Moraes RP, Carniel E. Phosphorus fertilization for high yield of soybean, maize, and winter cereals in rotation in Oxisols under long-term no-till in the South-Central Region of Paraná, Brazil. Rev Bras Cienc Solo. 2015;39:794-808. https://doi.org/10.1590/01000683rbcs20140463
» https://doi.org/10.1590/01000683rbcs20140463 -
Vieira RCB, Fontoura SMV, Bayer C, Ernani PR, Anghinoni I, Moraes RP. Sampling layer for soil fertility evaluation in long-term no-tillage systems. Rev Bras Cienc Solo. 2016;40:e0150143. https://doi.org/10.1590/18069657rbcs20150143
» https://doi.org/10.1590/18069657rbcs20150143 - Weil RR, Brady NC. The nature and properties of soils. 15th ed. New York: Pearson; 2017.
Edited by
-
Editor:
José Miguel Reichert https://orcid.org/0000-0001-9943-2898 and Leônidas Azevedo Carrijo Melo https://orcid.org/0000-0002-4034-4209