
 Accurate prediction of soil organic carbon using spectroscopic techniques and machine learning
Soil organic carbon is a key indicator for assessing soil quality and condition. Its estimation can be conducted through hyperspectral imaging spectroscopy within the visible and near-infrared (VNIR) range. This study aimed to evaluate the potential of spectroscopic techniques to accurately predict soil organic carbon (SOC) content by comparing direct field measurements with laboratory-processed samples. The efficiency and reliability of this approach were assessed. A rigorous exploratory data analysis (EDA) was conducted to identify key spectral features and minimize noise. Support vector machine (SVM) consistently outperformed other machine learning algorithms, demonstrating high accuracy and reliability. It is concluded that the model has been calibrated very well in the field, a breakthrough for science; spectroscopy offers a rapid, cost-effective and non-destructive alternative to traditional laboratory methods for SOC assessment. This has significant implications for sustainable agriculture and soil health monitoring, allowing for timely and accurate assessment of soil carbon stocks.
Key words:
spectroscopy; SOC; support vector machine; soil health
An innovative method to estimate soil carbon content without traditional laboratory procedures.
A reliable predictive model for preliminary soil classification and trend detection.
A safe and sustainable approach that eliminates the use of hazardous chemicals.
 Thumbnail
 Thumbnail
 Thumbnail
 Thumbnail
 Thumbnail
 Thumbnail
 Thumbnail
 Thumbnail
 Thumbnail
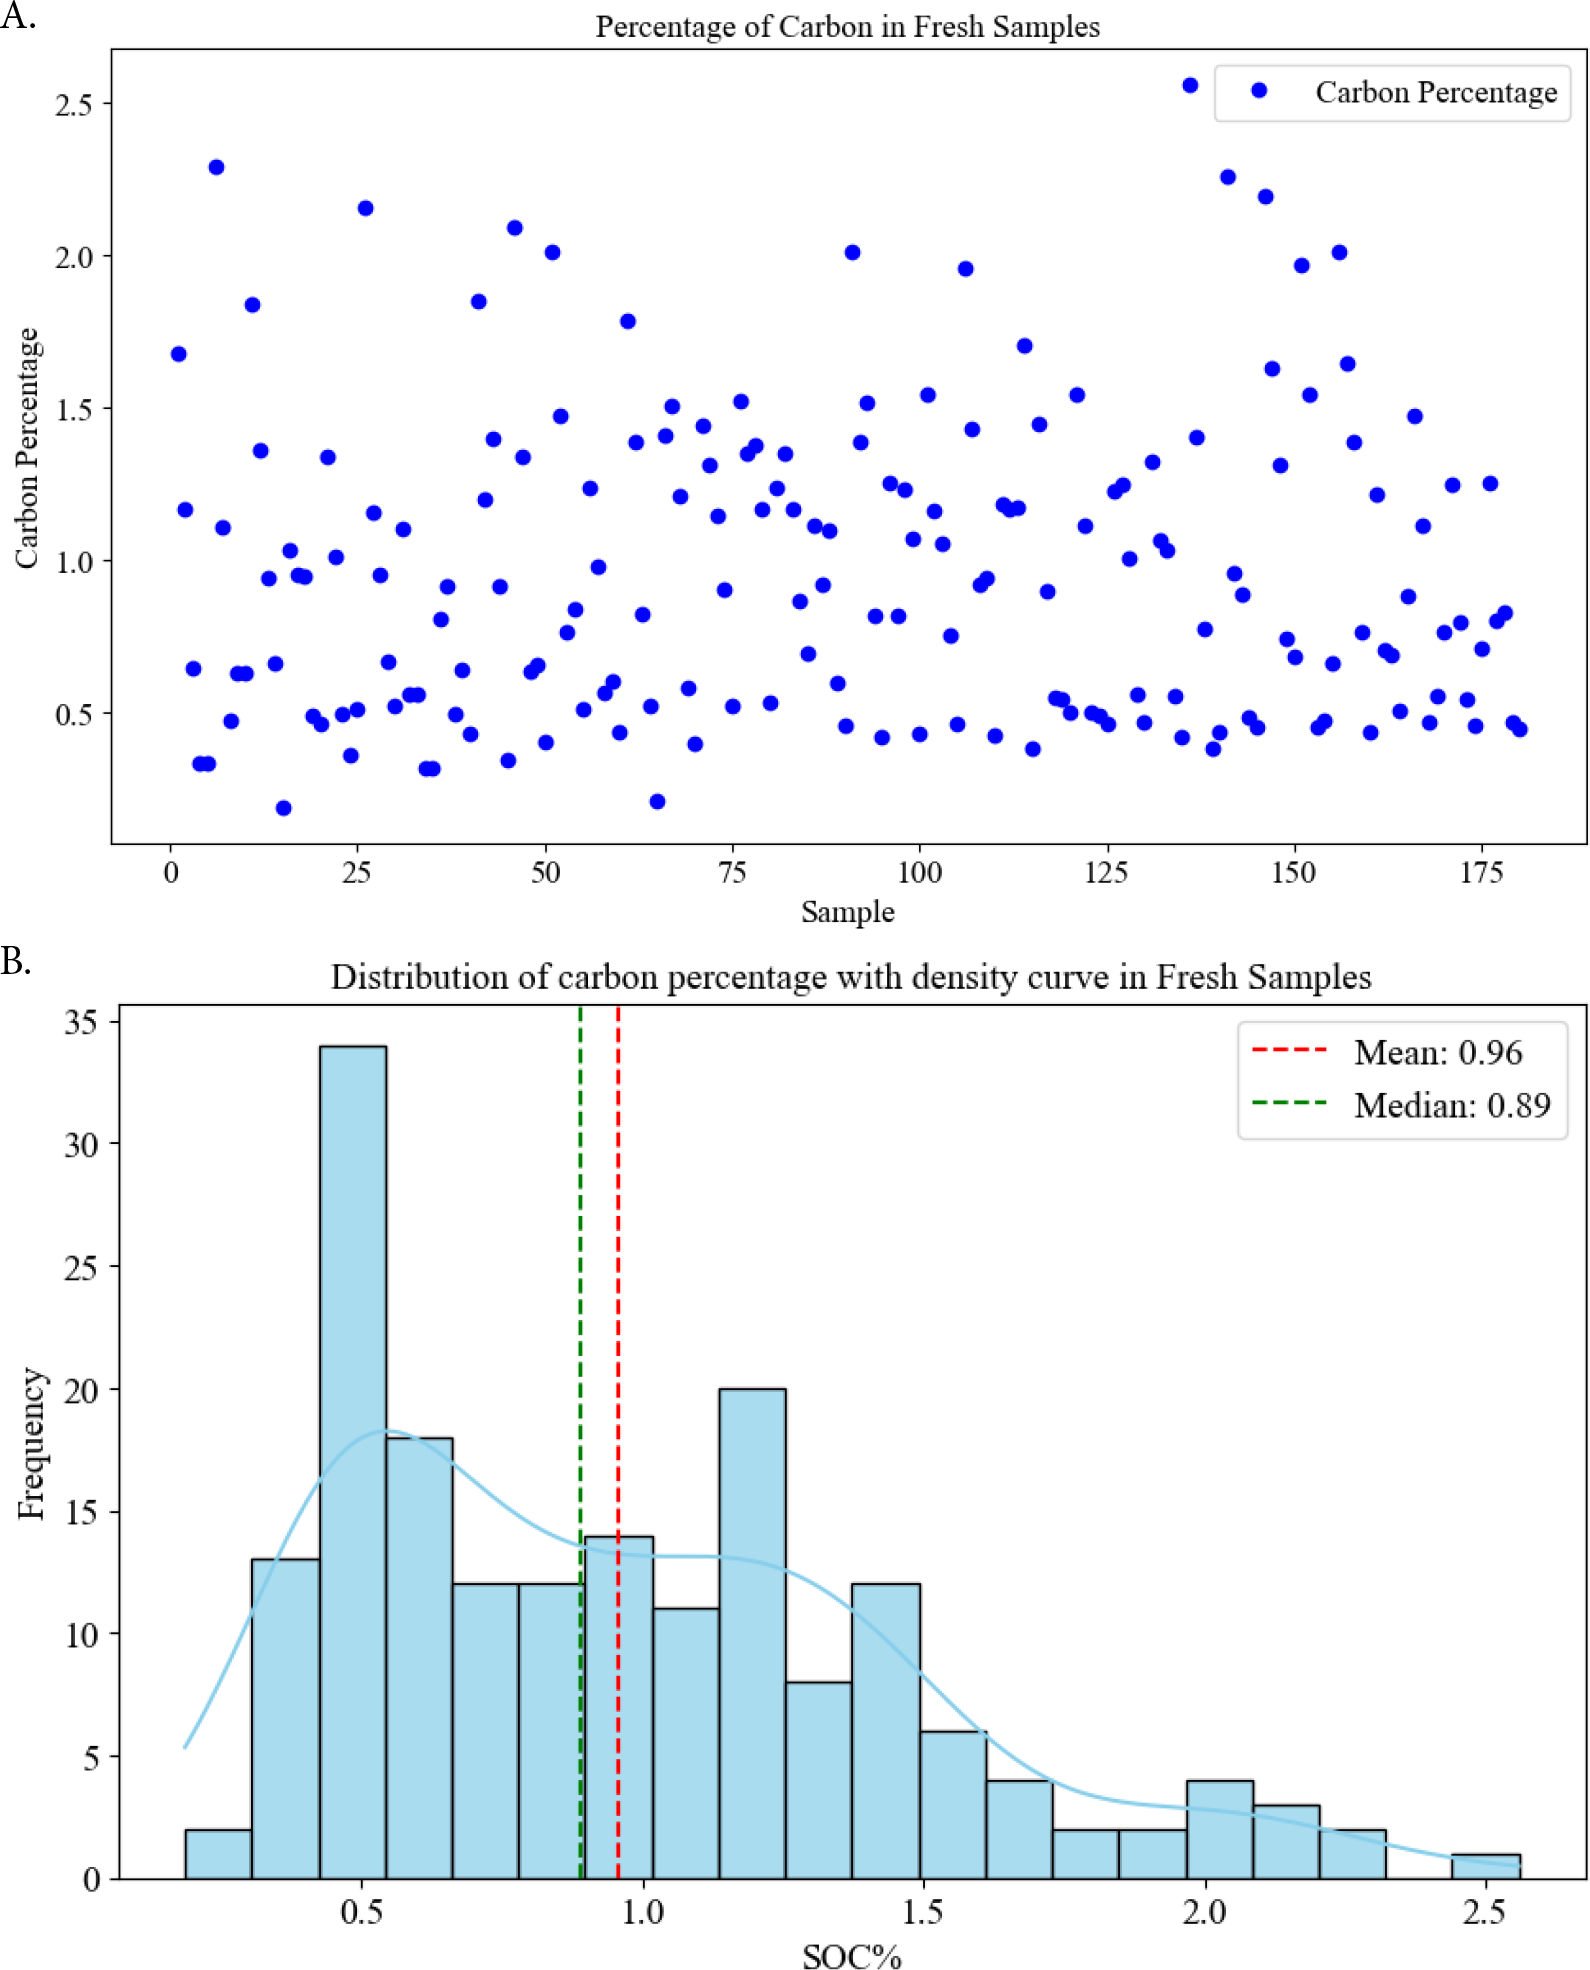 SOC - Soil Organic Carbon. Scatter diagram showing the distribution of carbon percentage across individual soil samples. Each blue dot represents the carbon percentage of a distinct soil sample. Frequency distribution of Soil Organic Carbon (SOC%) in fresh soil samples overlaid with a density curve. The dashed red line indicates the mean carbon percentage, while the dashed green line represents the median carbon percentage
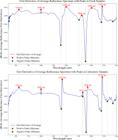
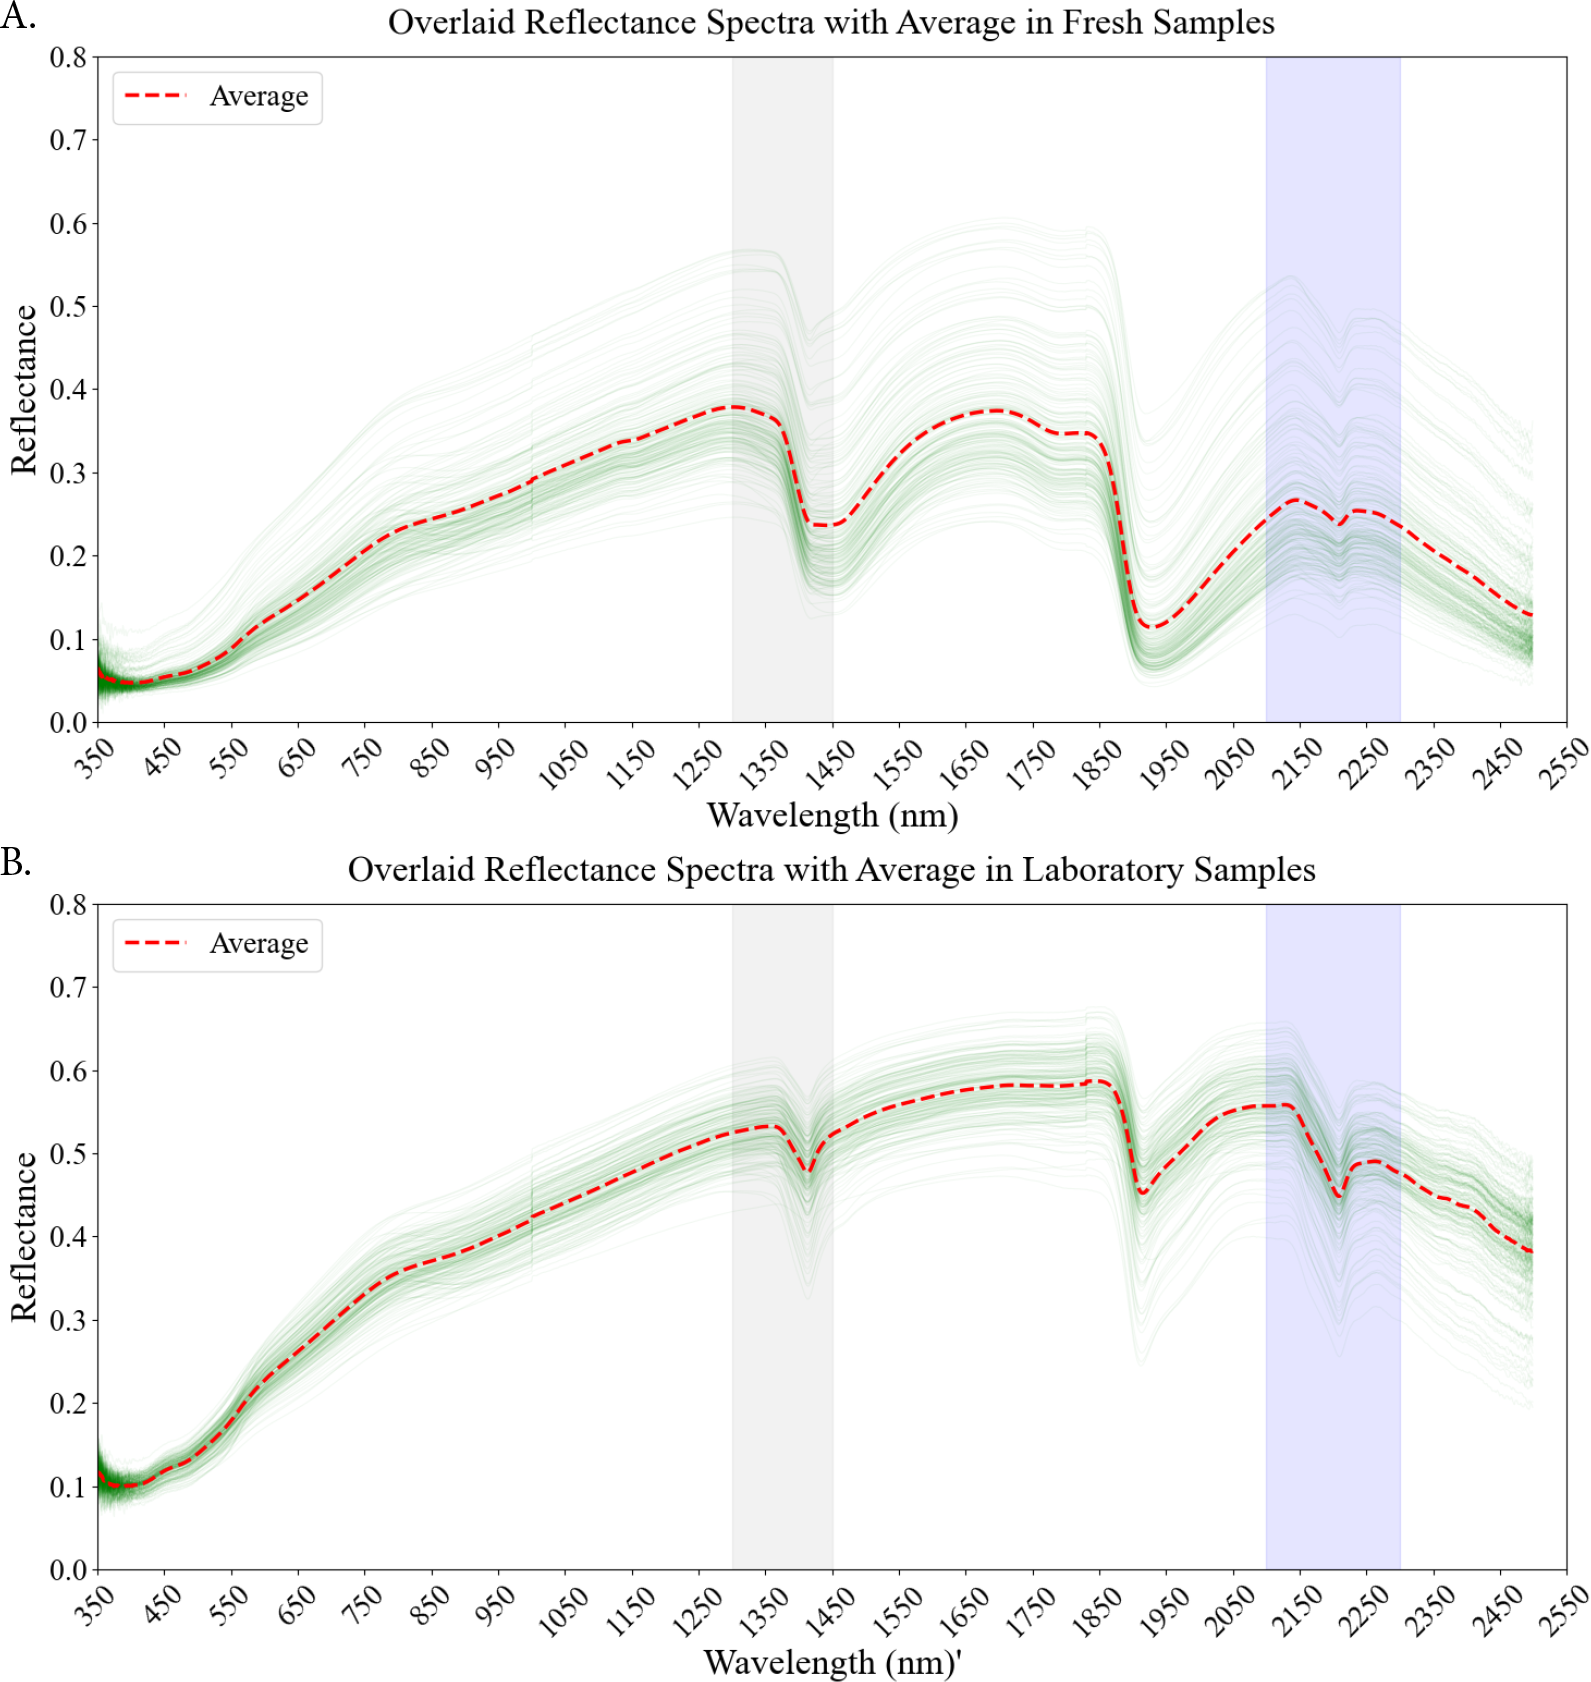 A. Reflectance spectra acquired from average fresh soil samples (collected in the field). The individual lines represent the reflectance spectrum for each fresh sample, showing how much light was reflected at different wavelengths (visible to near-infrared range). The average spectrum (thicker line) is overlaid to represent the general spectral characteristics and trends of the fresh samples within the dataset. B. Reflectance spectra obtained from the laboratory soil samples (drying, grinding, and sieving to standardize the sample condition). Each line corresponds to the reflectance spectrum of a laboratory-prepared sample, illustrating how light is reflected across different wavelengths. The average spectrum (thicker line) is overlaid to show the laboratory-processed samples’ overall spectral signature and central tendency. The vertical gray band, typically associated with organic matter, lies within the 1300-1450 nm range, while the vertical purple band, also linked to organic matter in previous studies, spans the 2100-2300 nm range
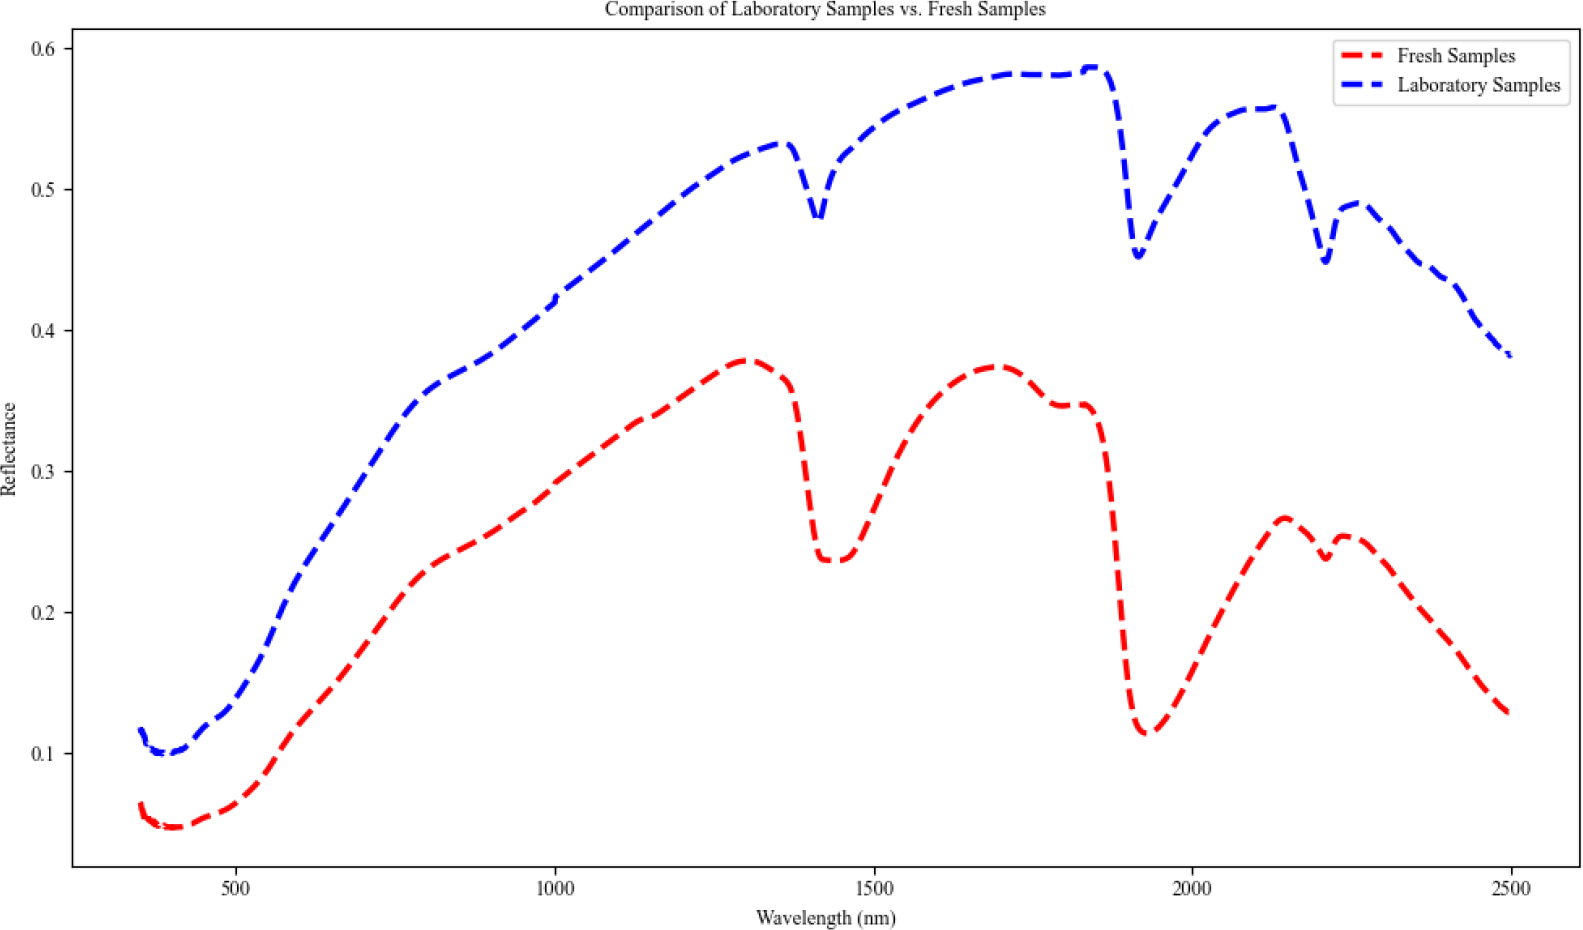

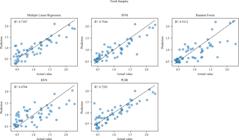
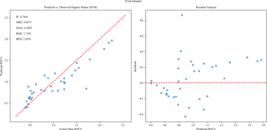
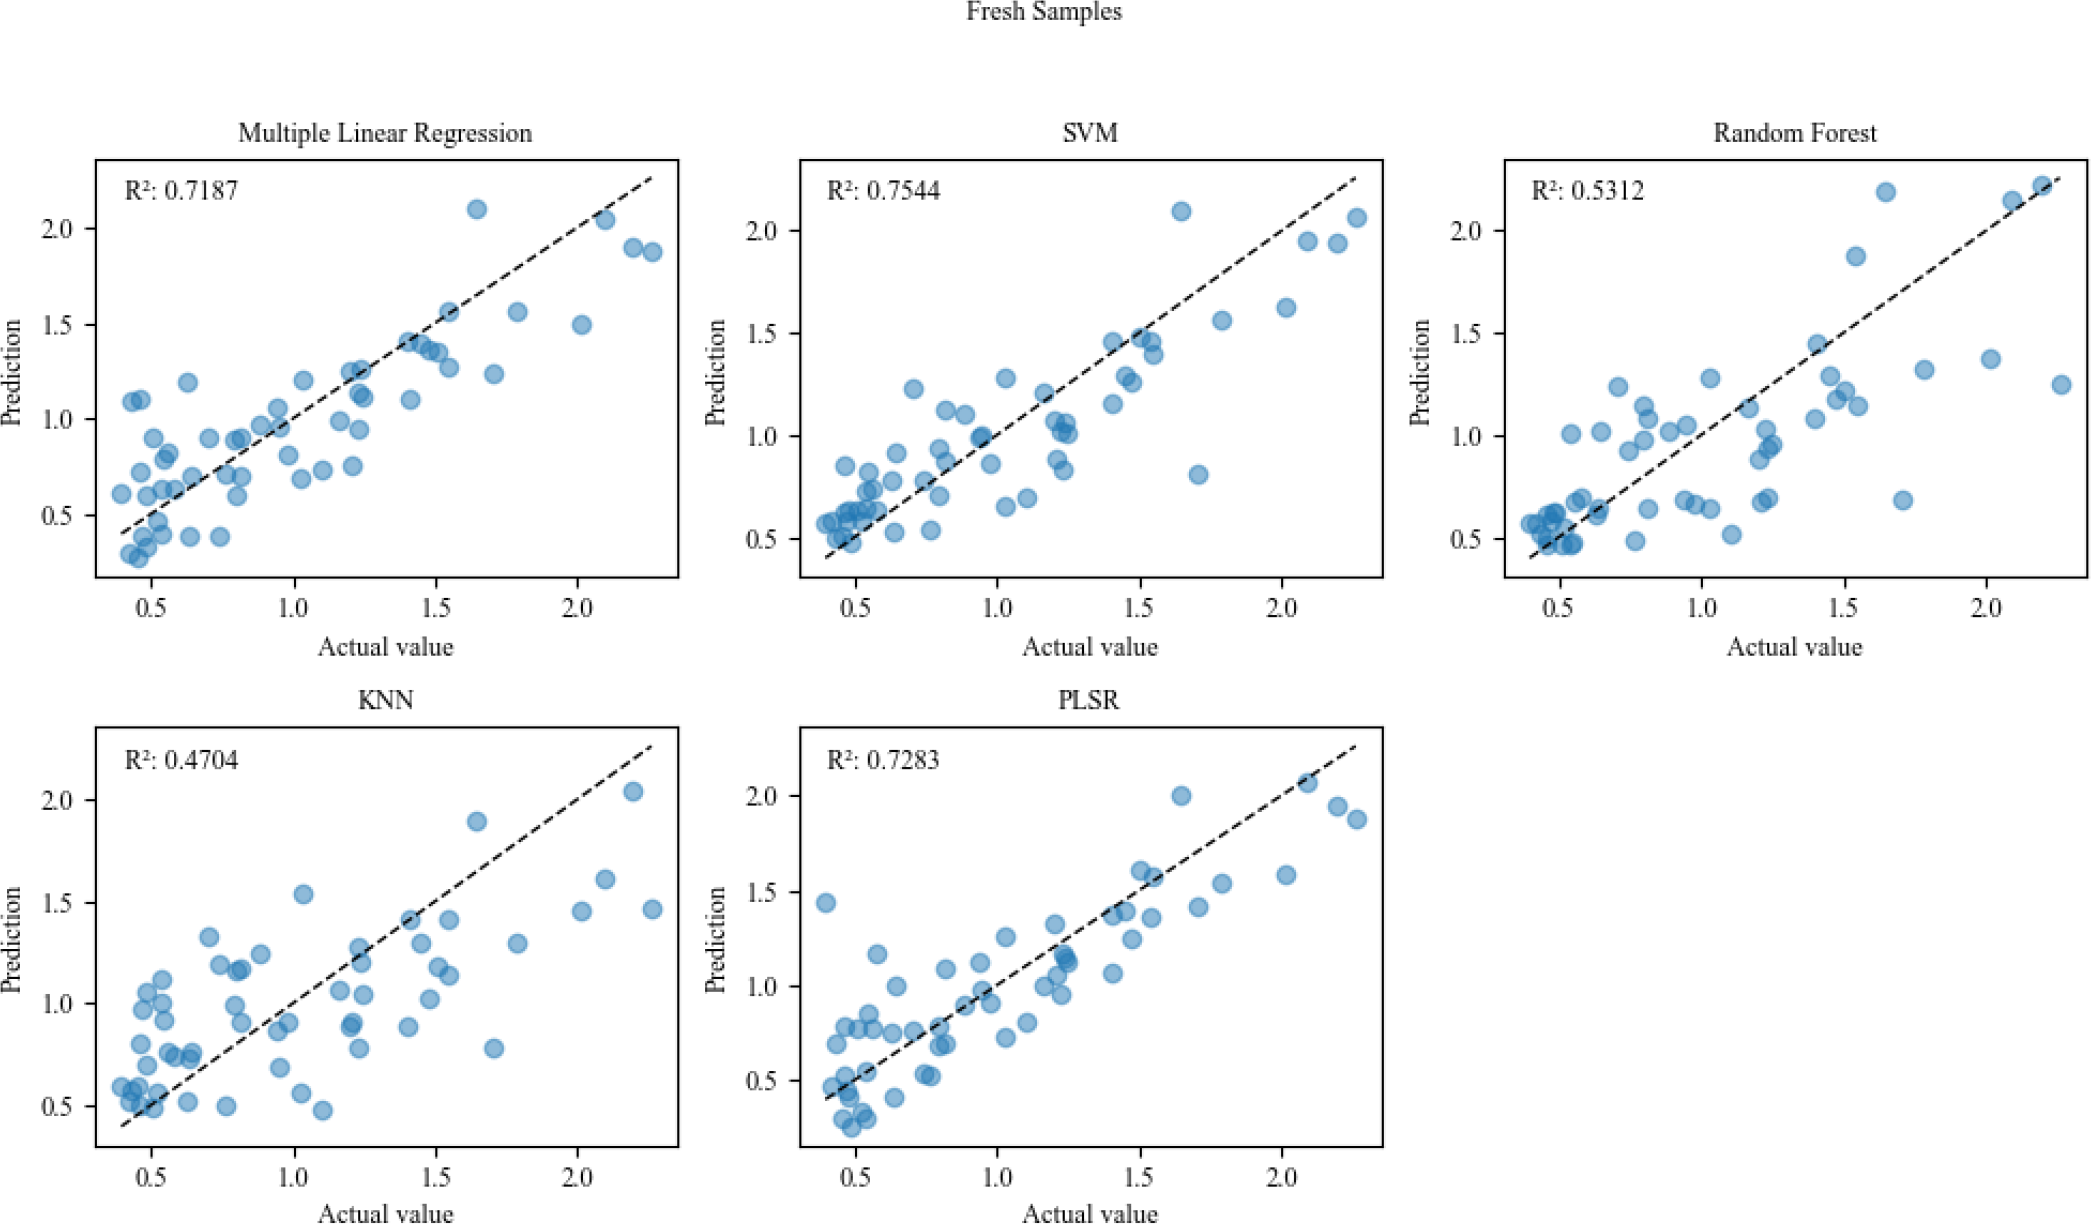 R2 - Coefficient of determination; SVM - Support Vector Machine; KNN - K-Nearest Neighbors and PLSR - Partial Least Squares Regression
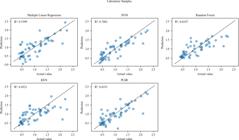
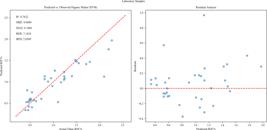
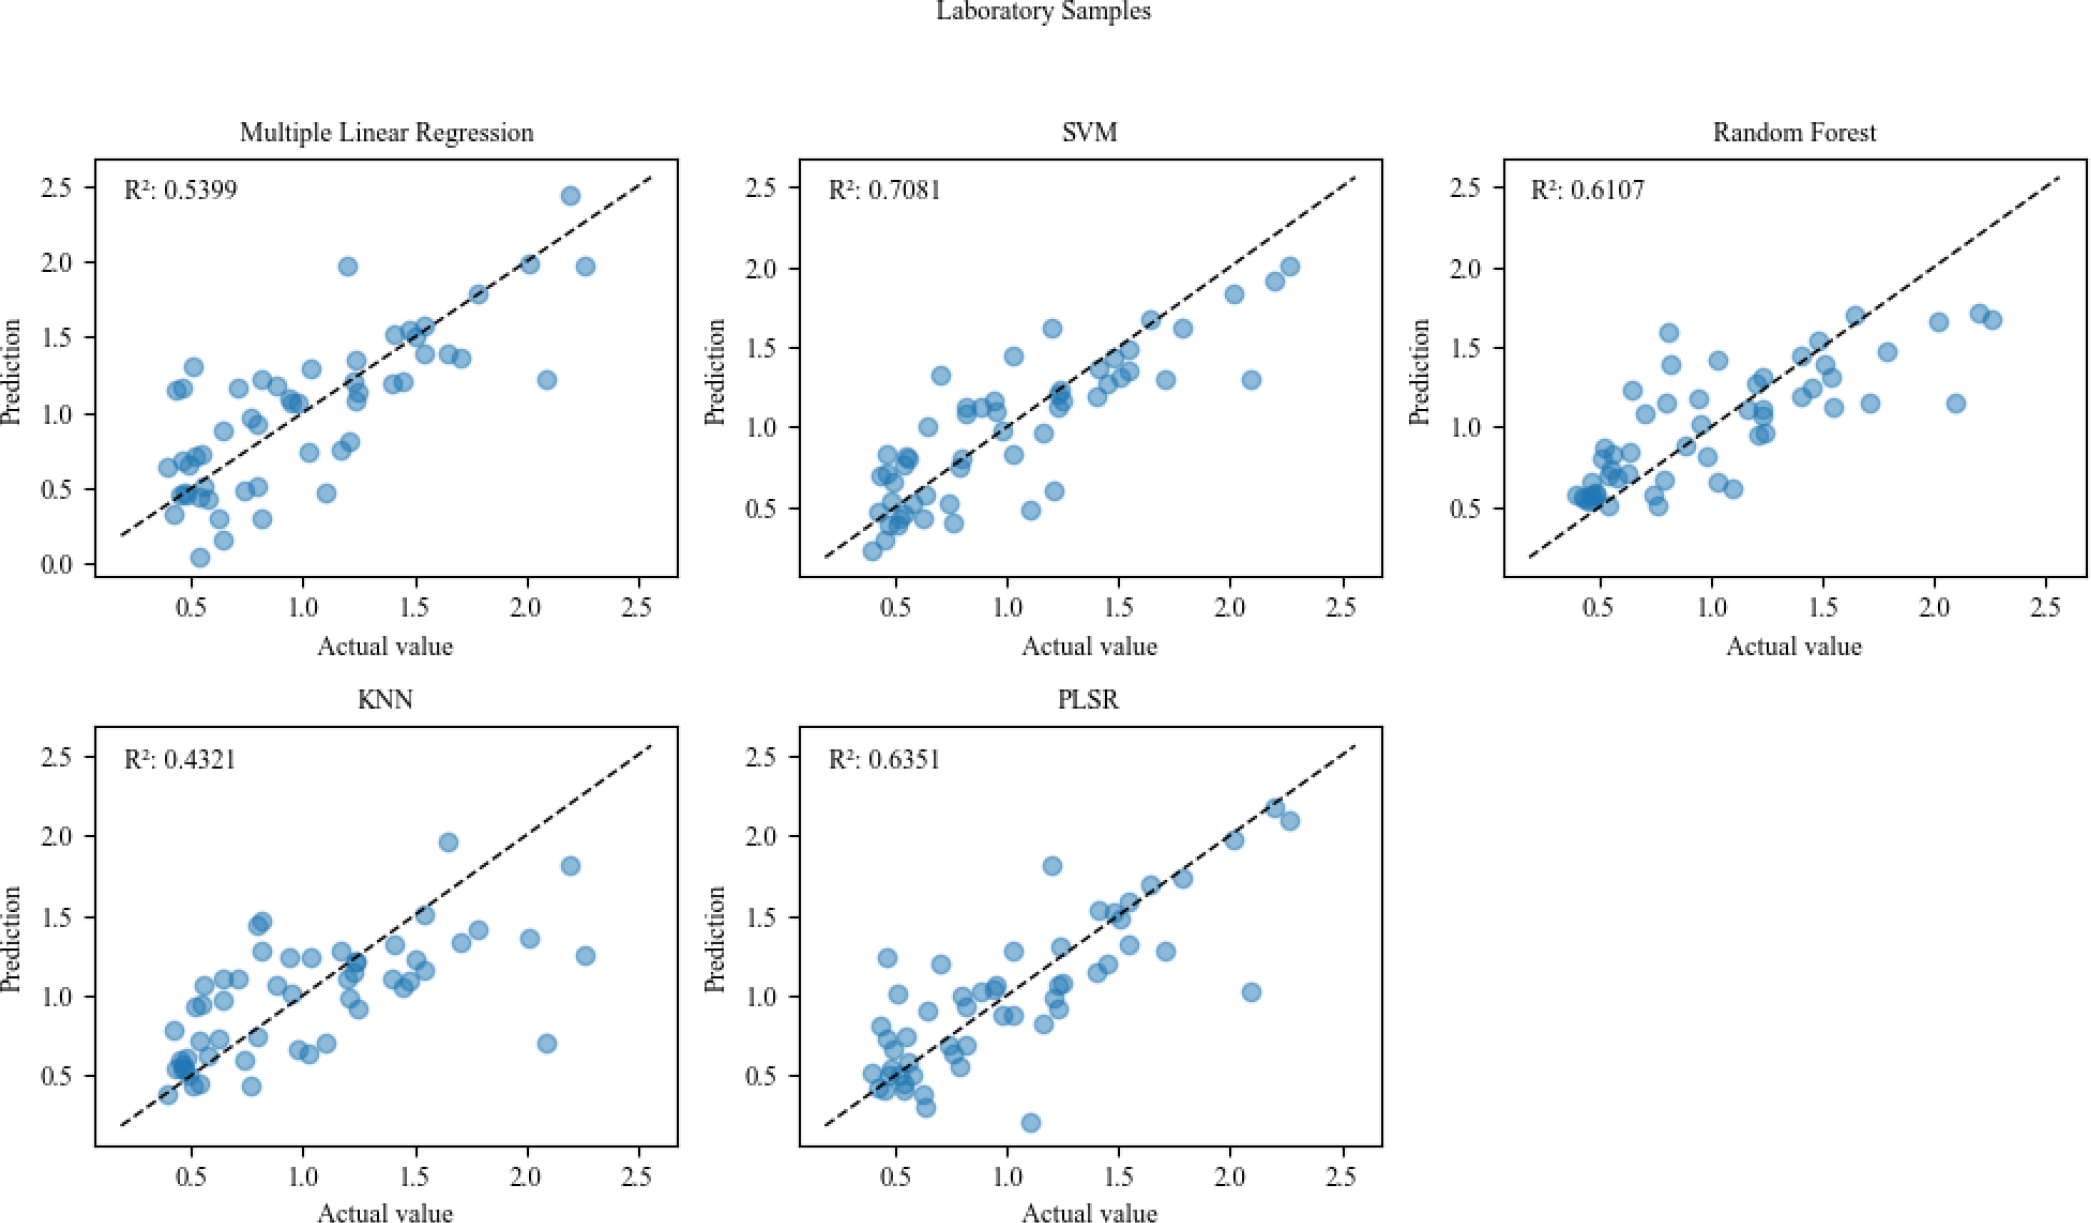 R2 - Coefficient of determination; SVM - Support Vector Machine; KNN - K-Nearest Neighbors and PLSR - Partial Least Squares Regression
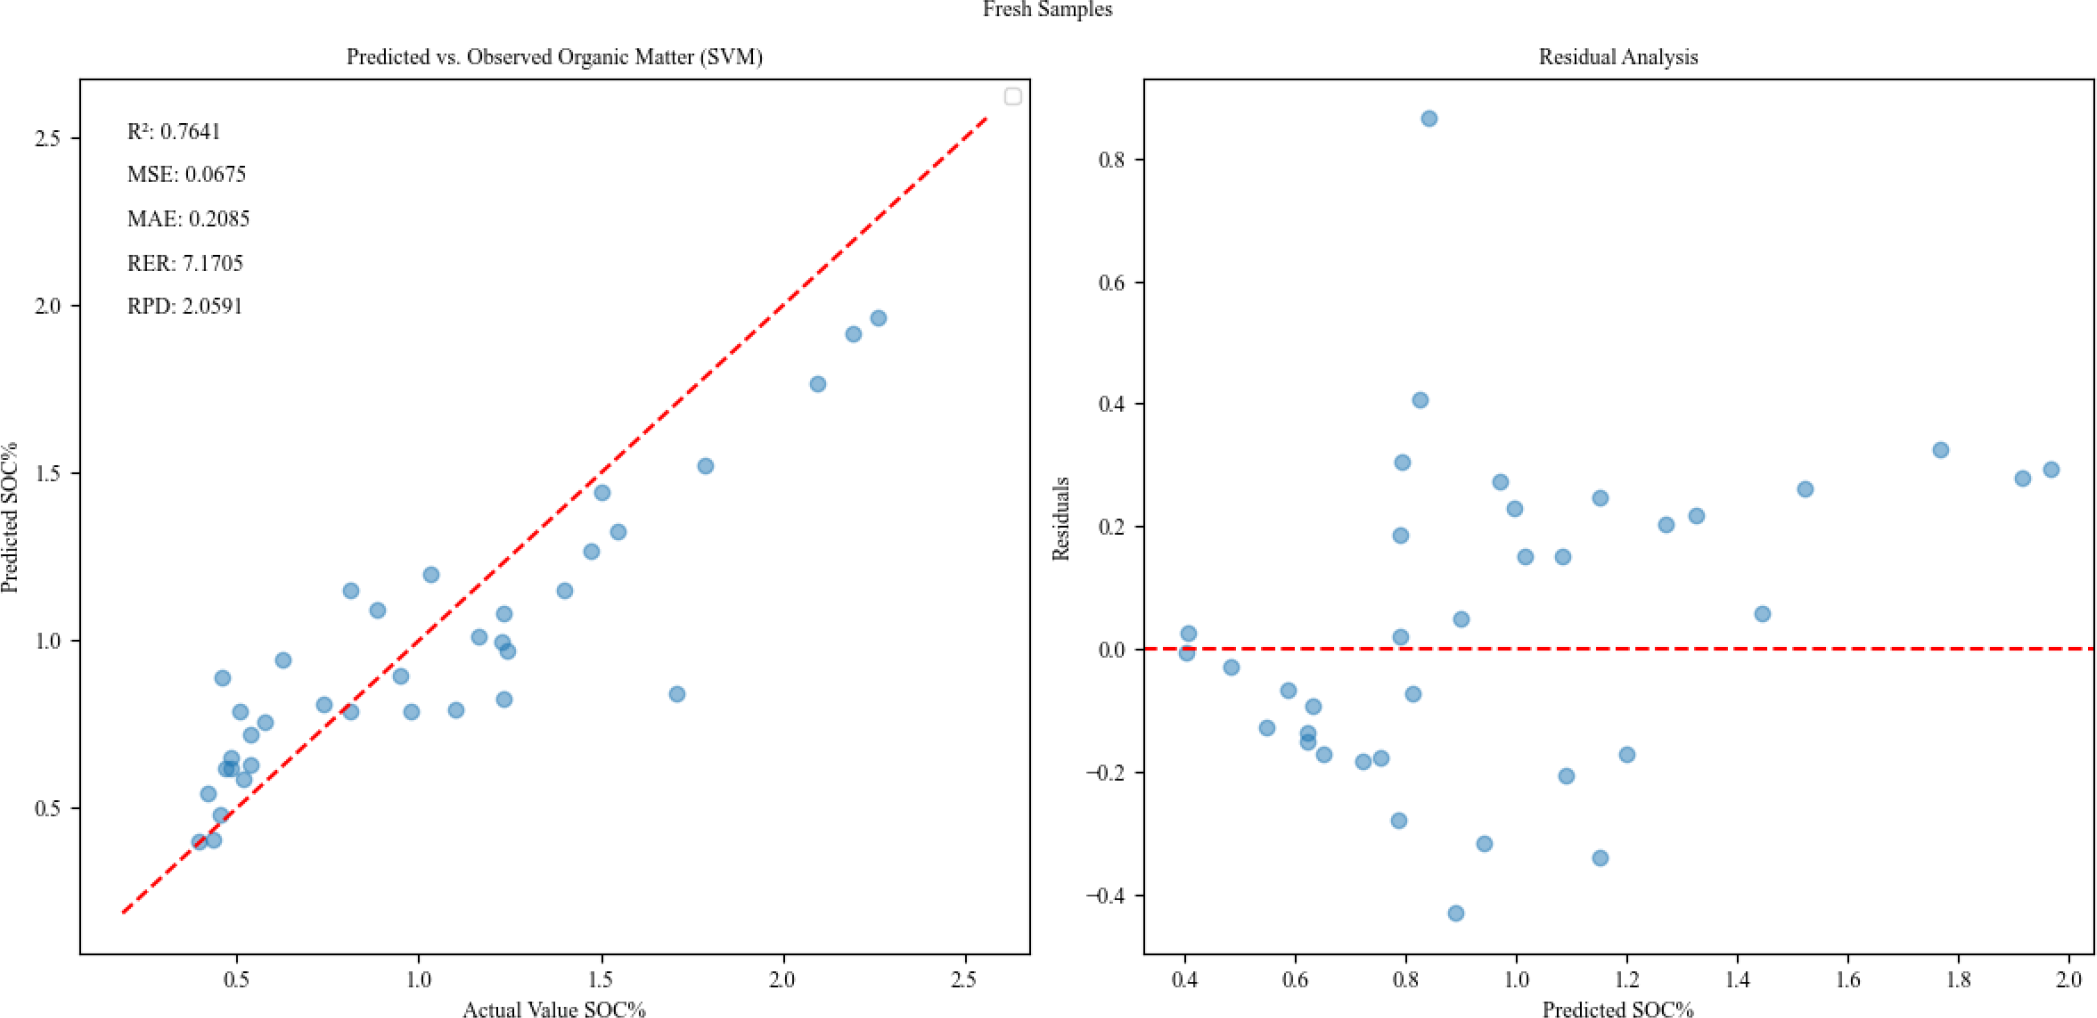 R2 - Coefficient of Determination; MSE - Mean Squared Error; MAE - Mean Absolute Error; RER - Range Error Ratio and RPD - Ratio of Performance to Deviation
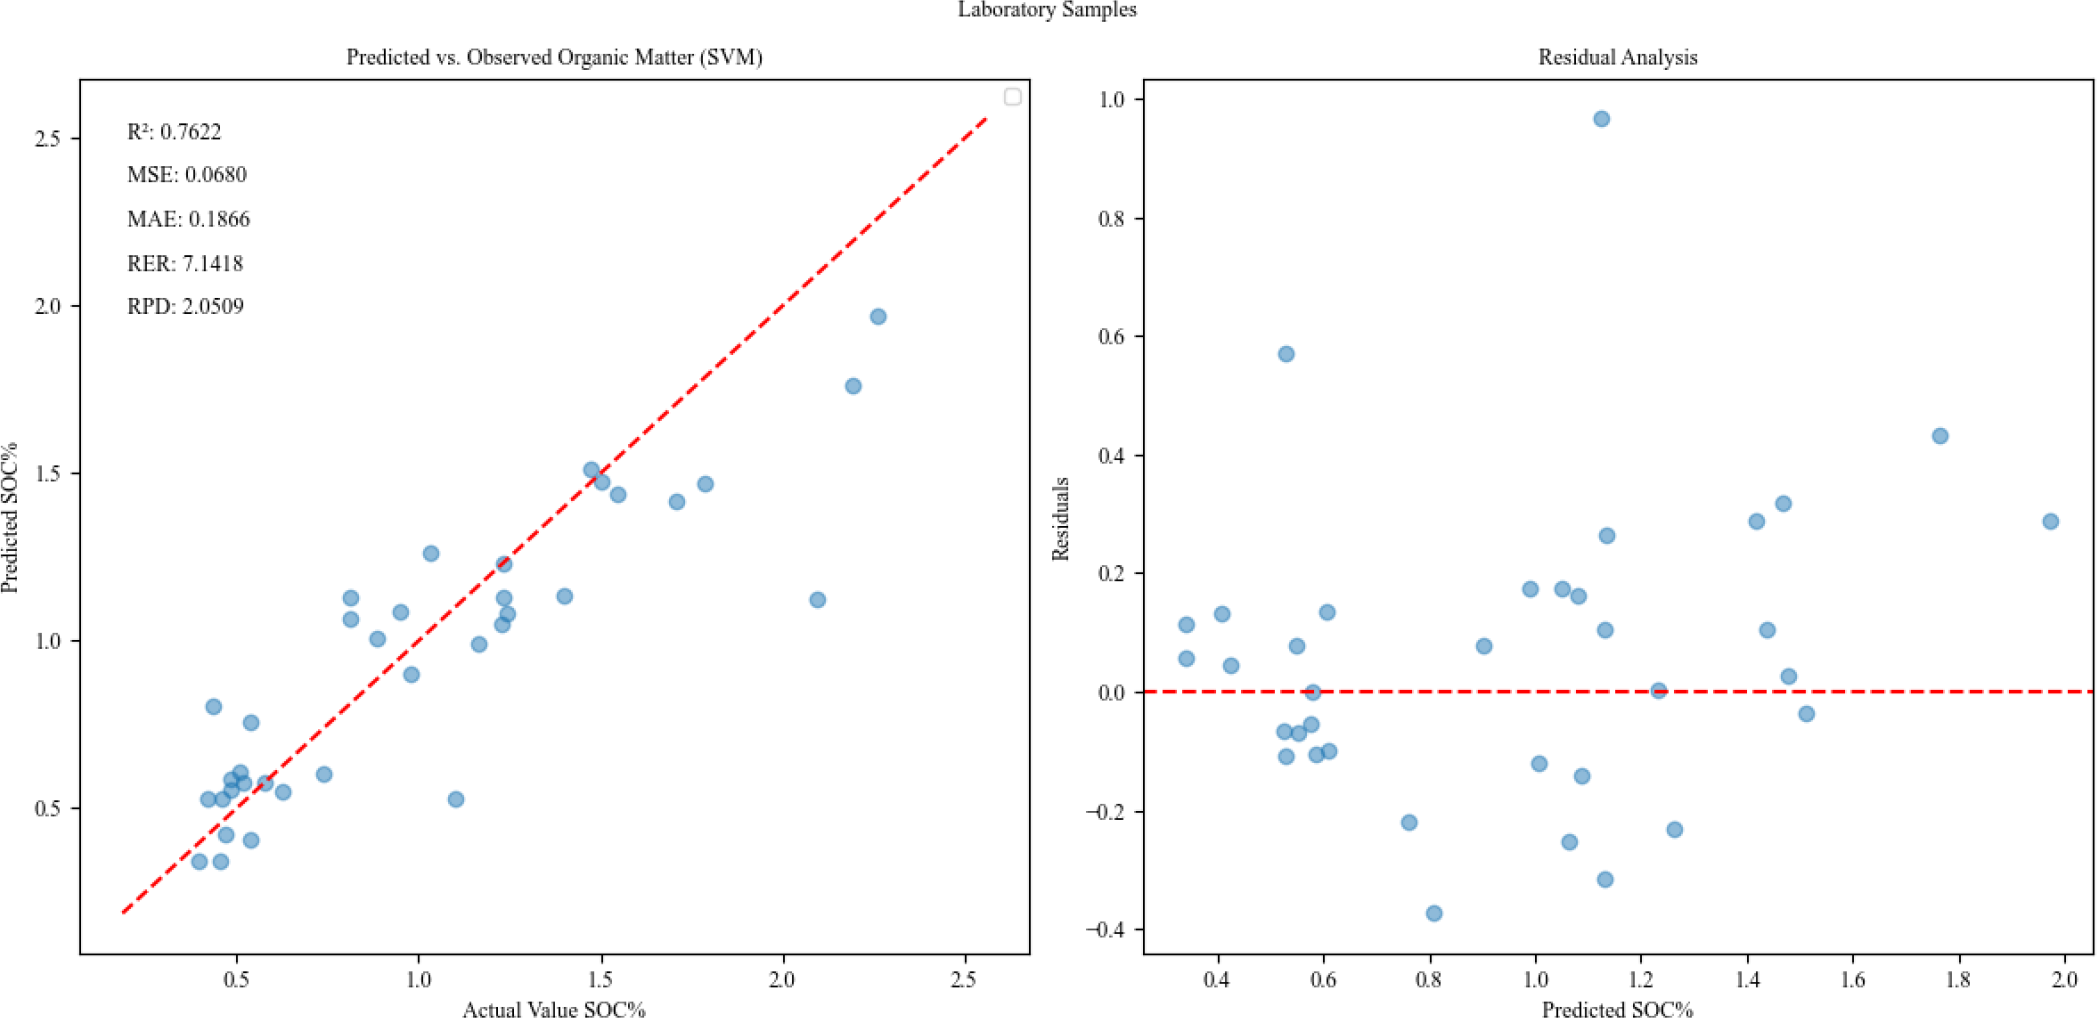 R2 - Coefficient of Determination; MSE - Mean Squared Error; MAE - Mean Absolute Error; RER - Range Error Ratio and RPD - Ratio of Performance to Deviation