 Fault diagnosis system with machine learning and cloud processing for a photovoltaic solar system1
ABSTRACT
Photovoltaic solar energy plays an important role in renewable energy, but its performance can be affected by operational issues such as partial shading and soiling accumulation on the modules. In this context, intelligent monitoring strategies are essential for identifying faults and assessing performance. This study aimed to develop and implement a cloud-enabled intelligent fault inference system for a photovoltaic installation, using locally acquired electrical and environmental data, preprocessed prior to cloud-based inference. The model was trained using machine learning and artificial neural network techniques with real experimental data collected at the photovoltaic plant of the Laboratory of Physics and Renewable Energy at the University of Pernambuco, Petrolina Campus. The neural network predictions were integrated into a web-based platform for data visualization, parameter analysis, and automated operational alerts. The system showed high precision in identifying the evaluated conditions, with Mean Square Error on the order of 10⁻2, Mean Absolute Error between 5.33 and 5.40%, and coefficients of determination (R2) ranging from 99.74 to 99.76%. These results indicate the potential of the proposed approach to support monitoring and predictive maintenance of photovoltaic systems.
Key words:
monitoring; artificial neural networks; energy efficiency
HIGHLIGHTS:
An intelligent system detects solar panel faults with an accuracy exceeding 99%.
Cloud monitoring identifies soiling and shading in real-time.
The neural network classifies operational status with a mean error of less than 0.6%.
RESUMO
A energia solar fotovoltaica desempenha um papel importante no panorama das energias renováveis, porém seu desempenho pode ser reduzido por condições operacionais adversas, como sombreamento parcial e acúmulo de sujidade nos módulos. Nesse contexto, estratégias de monitoramento inteligente são essenciais para auxiliar na identificação de falhas e na avaliação de desempenho. Este estudo teve como objetivo desenvolver e implementar um sistema inteligente de inferência de falhas baseado em nuvem para uma instalação fotovoltaica, utilizando dados elétricos e ambientais adquiridos localmente e pré-processados antes da inferência em nuvem. O modelo foi treinado com técnicas de aprendizado de máquina e redes neurais artificiais, empregando dados reais obtidos na planta fotovoltaica experimental do Laboratório de Física e Energias Renováveis da Universidade de Pernambuco - Campus Petrolina. As predições geradas pela rede neural foram integradas a uma plataforma web para visualização, análise de parâmetros e emissão automática de alertas operacionais. O sistema alcançou alta precisão na identificação das condições avaliadas, apresentando erro quadrático médio na ordem de 10⁻2, erro absoluto médio entre 5,33 e 5,40% e coeficiente de determinação (R2) entre 99,74 e 99,76%. Estes resultados evidenciam o potencial da abordagem proposta para apoiar estratégias de monitoramento e manutenção preditiva em sistemas fotovoltaicos.
Palavras-chave:
monitoramento; redes neurais artificiais; eficiência energética
INTRODUCTION
Brazil’s electricity matrix is predominantly powered by renewable sources. Photovoltaic (PV) solar energy has gained prominence, with an expressive 68.1% growth between 2022 and 2023 (BRASIL, 2024). Such growth is based on the socio-environmental advantages of solar energy, a renewable and abundant source with zero direct greenhouse gas emissions during its operation (Rezende, 2019), thereby consolidating its contribution to the country’s sustainability.
Adverse weather conditions, especially in regions with low rainfall indices, favor the buildup of dirt, reducing the capture of solar radiation and, consequently, the energy generation (Costa et al., 2019). Evidence from semiarid regions reinforces this concern: Souza et al. (2022) showed that extended periods without rainfall can lead to significant performance losses in PV modules due to natural soiling. Thus, continuous monitoring of photovoltaic modules becomes essential to mitigate these factors.
Latreche et al. (2022) demonstrate that placing current and voltage sensors along the strings enables detection of faults-such as short circuits, open circuits, and shading-by observing variations in the measured quantities. Similarly, Aboshady & Taha (2021) report that using current transducers and the rate of change of array power enables the detection and classification of several types of PV faults, with reduced sensor requirements and high responsiveness under different irradiance levels.
In recent years, artificial intelligence (AI) has been increasingly incorporated into photovoltaic monitoring systems to enhance fault detection. Machine learning models have been employed to identify anomalies based exclusively on electrical parameters, such as current, voltage, and power, reducing reliance on additional sensors. Studies such as Liu et al. (2018) show that data-driven neural network models can learn the electrical behavior of photovoltaic modules and reliably distinguish normal operation from fault conditions, improving diagnostic accuracy. This approach enables precise identification of anomaly types, supports targeted maintenance, and helps minimize system downtime.
The adoption of Artificial Neural Networks (ANNs) in PV monitoring applications is supported by recent evidence showing that ANN models can outperform deeper neural architectures in error metrics such as Mean Square Error (MSE), Root Mean Square Error (RMSE), and Mean Absolute Error (MAE), while maintaining high-explained variance (Coşgun, 2025). These results indicate that shallow neural architectures are not only computationally efficient but also highly effective for capturing nonlinear relationships in photovoltaic systems. This makes ANNs particularly suitable for real-time monitoring frameworks based on experimental data, such as those involving shading and soiling conditions.
However, many diagnostic approaches still rely on additional electrical sensors, which increase installation costs and limit the scalability of monitoring infrastructure. In addition, few studies integrate the entire operational chain-data acquisition, preprocessing, fault inference, cloud-based execution, and visualization-into a single, end-to-end monitoring framework. There is also a shortage of applied investigations that, using real, systematically collected data, evaluate the behavior of PV systems under controlled shading and soiling conditions. These gaps highlight the need for a practical, integrated, and experimentally validated monitoring approach.
Thus, this study aimed to develop and implement a cloud-enabled intelligent fault-inference system for a photovoltaic system, using locally acquired and preprocessed data to detect failures caused by shading and soiling. The framework integrates data analysis, visualization, automatic alerts, and reporting tools to support performance assessment. The hypothesis is that an artificial neural network trained under controlled experimental conditions can accurately identify operational anomalies, distinguishing abnormal behaviors, such as partial shading and dirt accumulation, from normal operation.
MATERIAL AND METHODS
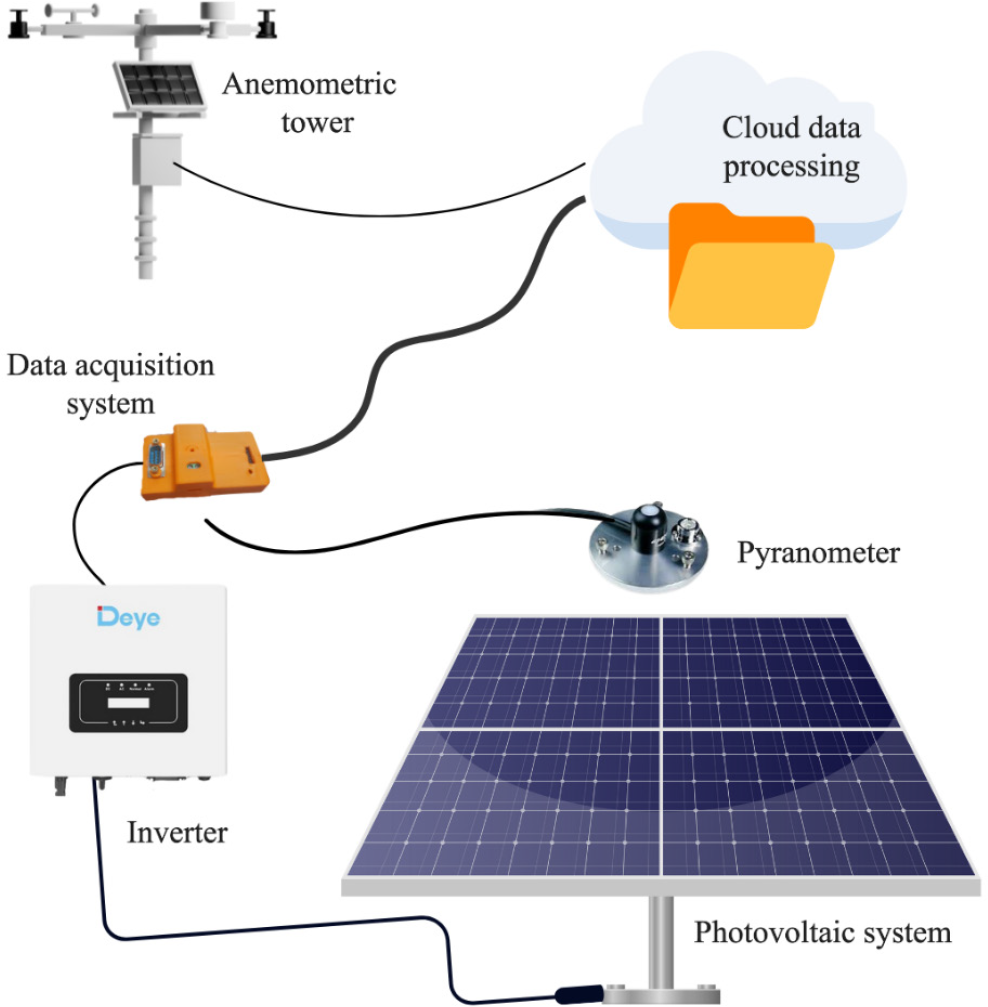
The monitoring infrastructure used in this study is shown in Figure 1 and corresponds to the system already installed at the Laboratory of Physics and Renewable Energy of the University of Pernambuco. It consists of a photovoltaic array connected to a Deye inverter, a meteorological station equipped with an anemometer tower, and a local data-acquisition module. A pyranometer was installed next to the photovoltaic modules to measure incident solar irradiance directly on the array plane. This infrastructure provided the electrical and environmental variables used in the controlled shading and soiling experiments.

Description of the monitoring infrastructure and data-processing flow used in the experiment
The raw data were preprocessed locally and subsequently transmitted to the cloud, where an artificial neural network-implemented by the authors-was used to classify operational conditions and detect anomalies. The cloud-based model produced the operational states (“Inverter Status” and “System Status”), which were then made available through a web interface and the SolarAI Monitor mobile application.
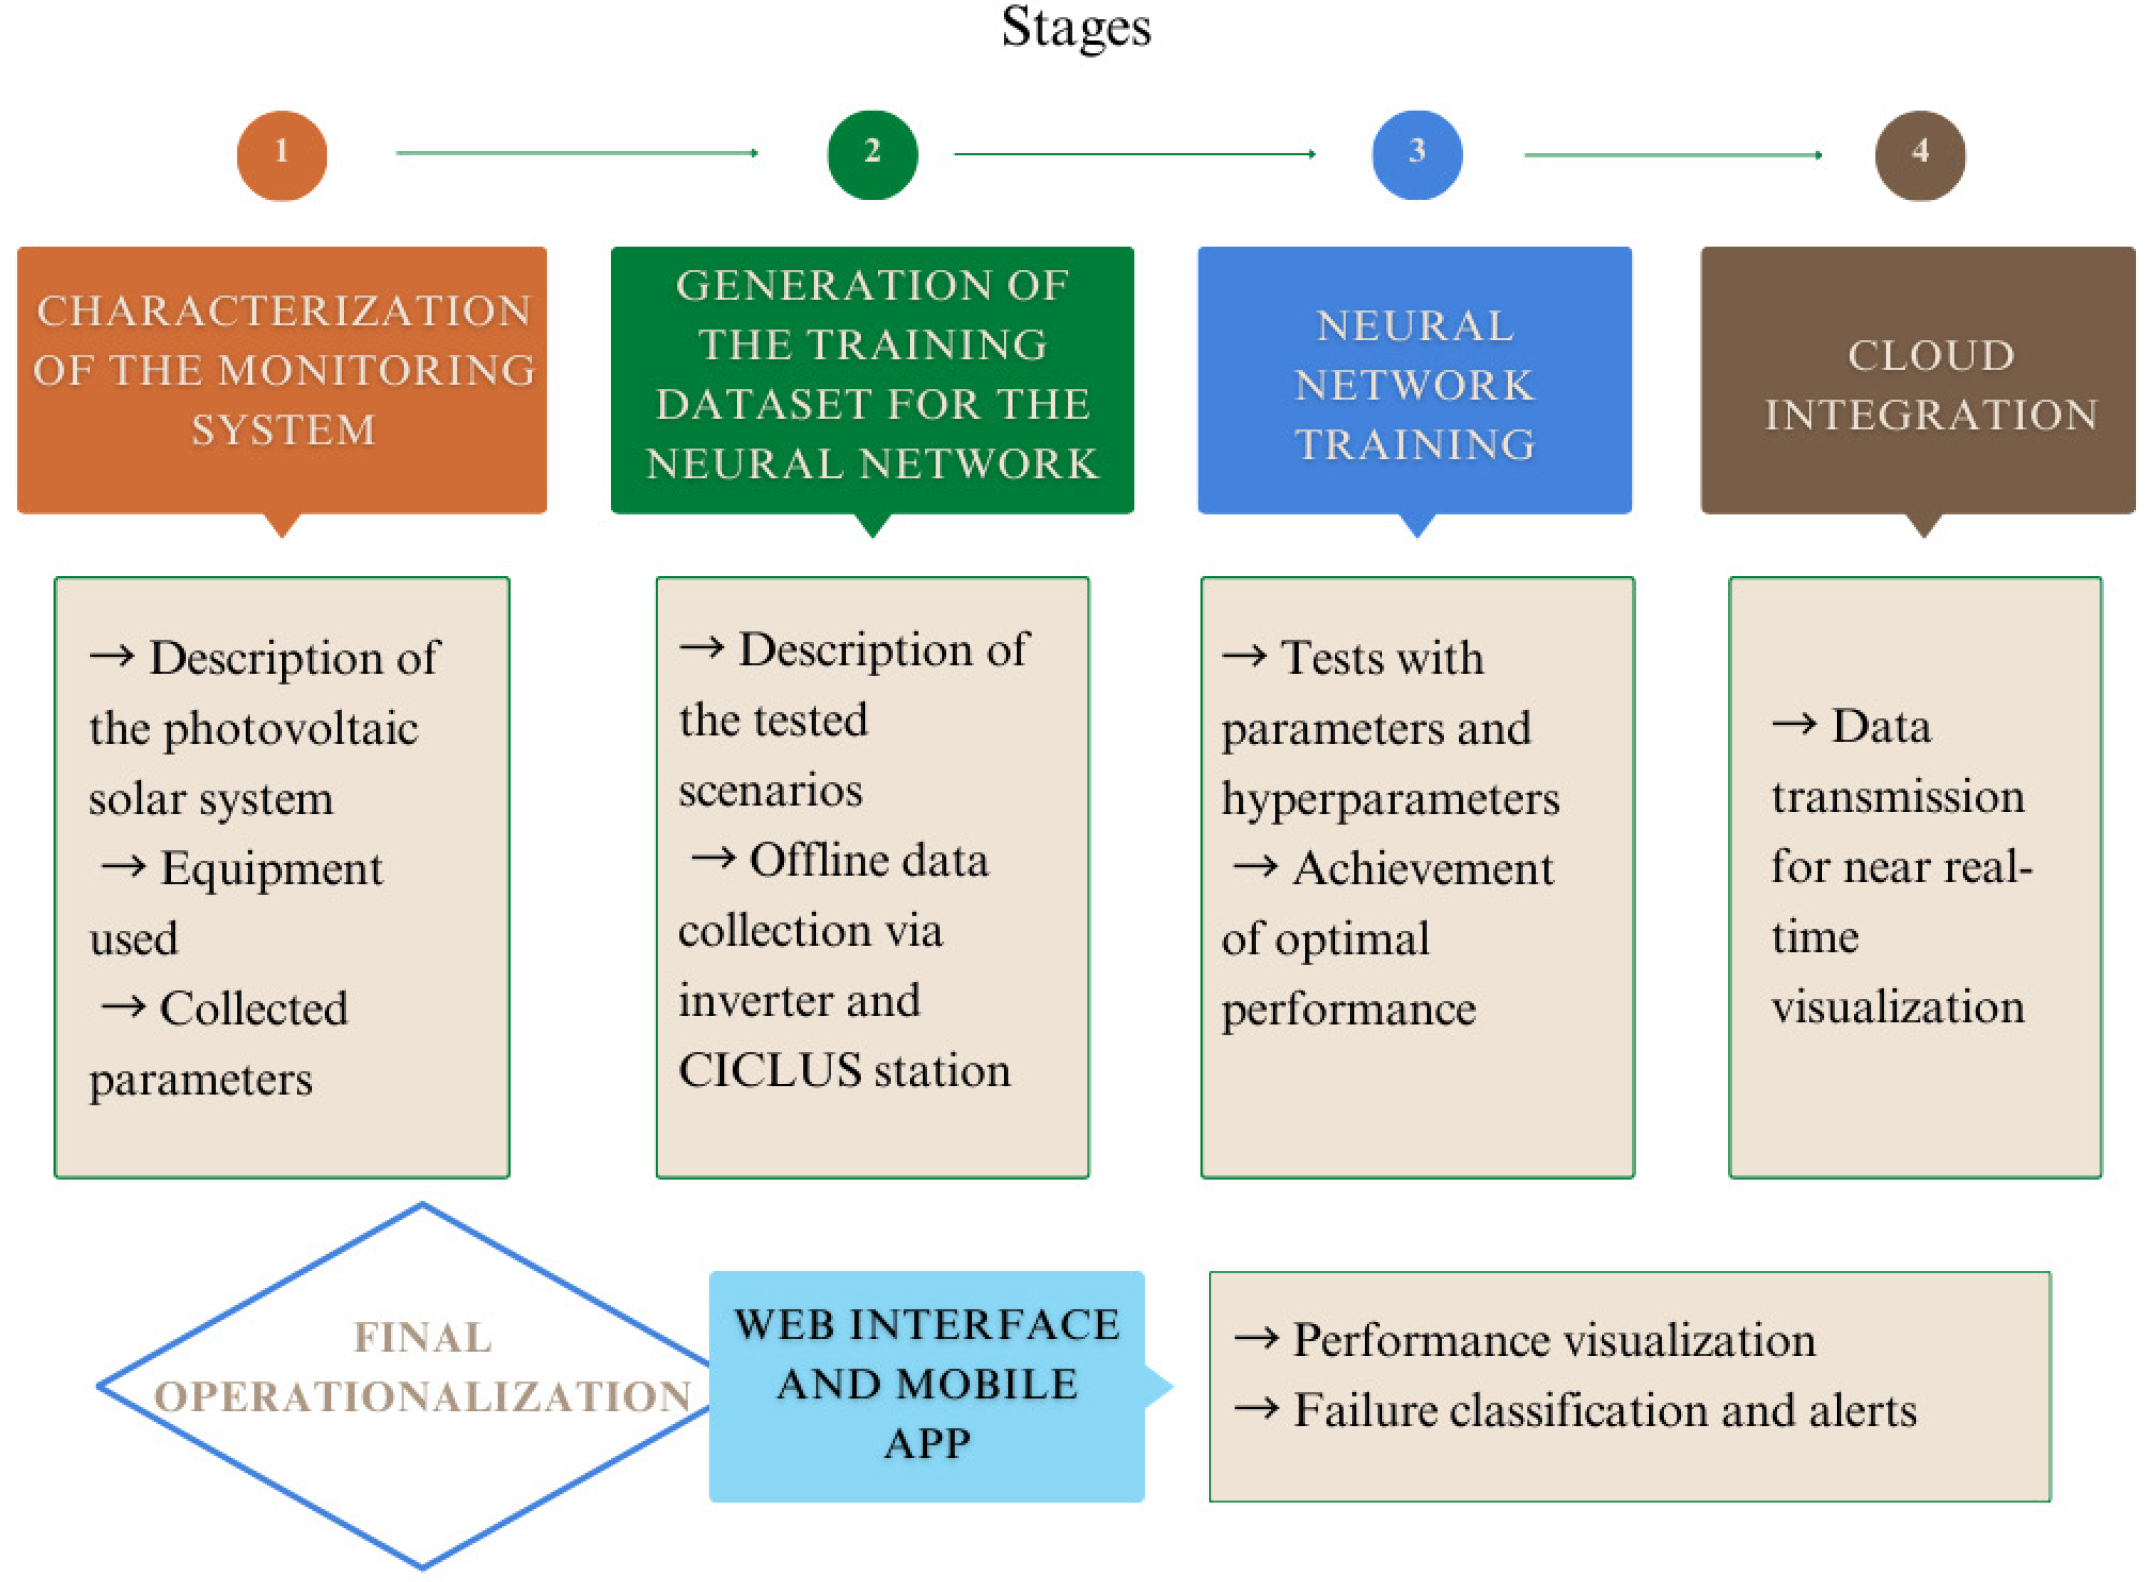
The computational components of the monitoring system, including the data-processing pipeline, the artificial neural network model, and the visualization and alert interfaces, were developed by researchers at the Laboratory of Physics and Renewable Energies at the University of Pernambuco. The system architecture was organized into four stages to optimize performance, as illustrated in Figure 2.
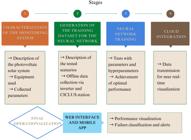
The equipment used in the monitoring process was characterized, with specific hardware features and functionalities suitable for monitoring applications that enable manipulation and modification of electrical and meteorological variables. The monitored solar system consisted of 24 solar panels arranged in a 3 × 8 configuration, model KC50T (Kyocera), with a total power output of approximately 1.3 kW. It was equipped with a Deye Sun 3k Solar Inverter, whose specifications are presented in Table 1, coupled to a datalogger device that collected, processed, and transmitted the inverter’s data in real time.
The data collected by the datalogger are listed in Table 2, from which parameters were selected based on their relevance to the process of detecting and classifying failures.
DC voltage and current indicate the voltage and electrical charge generated by solar panels, enabling the identification of losses caused by soiling, shading, or module failures. DC power reflects solar energy capture before conversion to alternating current (AC) and serves as a key parameter for measuring system efficiency. At the inverter output, AC voltage, current, and frequency in phase R ensure that the energy injected into the grid meets regulatory standards, preventing damage to connected equipment.
The total active power at the AC output indicates the useful energy supplied to the grid, while cumulative and daily active energy production enable system performance monitoring over time and identification of seasonal variations or unexpected losses. Additionally, the AC inverter radiator temperature is a critical factor, as elevated temperatures can reduce efficiency and indicate the need for ventilation or maintenance. Monitoring these parameters enables fault detection, energy generation optimization, and ensures the safety and reliability of the photovoltaic system.
Environmental data were collected using sensors for solar radiation, wind speed and direction, rainfall, ambient temperature, atmospheric pressure, and relative air humidity installed on the CICLUS meteorological station. This autonomous station includes integrated anemometer, wind vane, pluviometer, thermometer, barometer, and hygrometer sensors, manufactured by WRFCOMERCIAL. The data collected by the CICLUS meteorological station are highlighted in Table 3.
The collected data enables the identification of optimal system operation and assists in preventive system maintenance. The use of meteorological variables enables comparison of energy production with climatic conditions, identifying trends and patterns, such as efficiency reduction on cloudy days or during high temperatures.
The objective of this stage is to create a training database by computing all data obtained from combinations between meteorological variables (provided by the CICLUS Meteorological Station) and electrical variables (collected by the inverter datalogger). For this training, the variables described in Tables 2 and 3 were used as inputs. Four scenarios were implemented: system in full operation with clean panels (scenario 1), soiling (scenario 2), 25% shading affecting 6 panels (scenario 3), and 40% shading affecting approximately 9.6 panels (scenario 4).
The first scenario occurred after cleaning the solar panels. A total of 2,162 data points (meteorological and electrical) were collected, with measurements taken every minute from sunrise to sunset. Arosh et al. (2023) note that passive Non-Uniform Illumination (NUI) is caused by dust accumulation on photovoltaic modules and by shading from tall buildings, trees, and other obstructions. A soiling test was performed to simulate the first fault type. Dry soil was applied to the modules through manual sieving at approximately 1.5 m from the panels. Since the modules are located approximately 2 m from the ground, wind action favored dust dispersion, forming a visibly uniform layer. This method allowed a realistic simulation of natural soiling and characterization of system behavior under NUI influence.
For neural network training regarding partial shading, 25 and 40% of the system were considered shaded using a screen positioned over the panels. After collecting data from the 25% shading scenario, the screen arrangement was modified to simulate 40% shading. It should be noted that the same time interval (every minute) and number of records (2,162 data points) were considered in all simulations. A total of 8,648 records were obtained with data from the four statuses (clean, soiled, 25% shading, and 40% shading).
Table 4 presents the Inverter Status, automatically defined by the inverter, and the System Status, categorized by the authors based on the tests performed. The Inverter Status indicates the inverter’s functional state, generally tied to the time of day and communication with solar modules. The System Status describes the operational conditions of photovoltaic modules, accounting for factors such as soiling and shading. Both sets of information are essential for evaluating the performance and efficiency of the solar photovoltaic system.
Operational classes used in the neural network model, with categories, numerical codes, and descriptions
Thus, it was possible to establish sufficient parameters for Neural Network training. The complete database is recorded in Sobral et al. (2025).
The method for predicting “Inverter Status” and “System Status” was based on Machine Learning and Neural Networks, following the methodology of Barbosa et al. (2025), though adapted here to the photovoltaic context. Data catalogued in the datalogger and from the CICLUS meteorological database were combined to train the neural network, as described in the previous stages.
The neural network inputs were defined as the meteorological and electrical variables described in Tables 2 and 3, with the expected outputs being “Inverter Status” and “System Status” to obtain insights into system operation and generate alerts when the system exhibits poor performance due to shading or soiling.
The database was divided into training and test sets, with 20% of the data reserved for the test set. Normalization between 0 and 1 was applied using MinMax Scaler to ensure the data were on the same scale. The parameters and hyperparameters shown in Table 5 were defined for Neural Network (MLP) training, including the number of epochs, hidden layer size, activation function (ReLU), and optimization algorithm (Adam), as described by Barbosa et al. (2025).
Configuration parameters adopted in the training and evaluation of the proposed neural network model
After exhaustive tests evaluating the model’s convergence time and prediction quality during training, it was possible to determine the optimal number of neurons and hidden layers for the neural network. This process allowed reducing the model’s convergence time without compromising predictive performance.
In the second stage, multiple empirical analyses were conducted to minimize the network size, following the recommendations of Labach et al. (2019). Different hyperparameters were systematically varied, such as number of hidden layers (1 to 9), neurons per layer (10 to 100), maximum training epochs (10 to 100), learning rate (0.001 to 1), activation function (ReLU, sigmoid, tanh, softmax), batch size (10 to 200), and percentage of samples used for training (5 to 30%).
This exploratory search enabled identifying the configuration that offered the best balance between model complexity, convergence time, and prediction accuracy. Table 5 presents the final hyperparameters adopted for the neural network model.
The neural network model was trained using the Keras library, with different parameters such as activation function, hidden layers, and optimizer. Functions were implemented to generate graphs showing the evolution of Mean Squared Error (MSE) during training and comparisons between actual and predicted values for outputs. A loop is performed that compares predictions with actual values, identifying and counting errors.
Finally, functions are used to calculate confidence intervals based on predicted and actual values. Additional metrics, including Mean Square Error (MSE), Mean Absolute Error (MAE), Coefficient of Determination (R2), and Explained Variance Score (EVS), were calculated to evaluate model performance. In general, the literature on power prediction and PV diagnostics supports the use of metrics such as MAE, MSE, and RMSE as central criteria for evaluating the reliability and accuracy of predictive models (Hamad et al., 2025; Kumar et al., 2025).
In addition to regression-based metrics, a confusion matrix was used to evaluate the neural network’s ability to correctly distinguish between normal operation and fault conditions, specifically shading and soiling events. For this purpose, the model’s continuous output was thresholded to generate categorical predictions, which were then compared with the true class labels. The confusion matrix summarizes the distribution of true positives, true negatives, false positives, and false negatives, allowing the assessment of misclassification patterns. These metrics provide an additional layer of validation by revealing how consistently the network detects anomaly events beyond the regression error measures.
Because the Neural Network was trained with the Keras library, the trained model was converted to TensorFlow.js. A Python script was employed to transform the model into a web-compatible format, removing unnecessary operations and grouping the weights into smaller files, which benefits cloud deployment.
After the conversion, the model was loaded in JavaScript using the tf.loadLayersModel(url) function, enabling direct execution in web applications. TensorFlow.js provides two main APIs: the Ops API for low-level tensor operations and the Layers API, which is fully compatible with the Keras API. In this study, the Layers API was adopted for its suitability for building feedforward neural networks and for its portability between Python and web environments.
Electrical and environmental data were initially extracted from the local monitoring systems - the PV inverter and the meteorological station - and stored locally. Before being sent to the cloud, the dataset underwent local preprocessing, including cleaning, filtering, and organization, to ensure consistency and quality. After preprocessing, the data were transmitted via Webservice to the cloud environment, where they were used as input to the neural network model implemented with TensorFlow.js. Thus, the system operates under a cloud-enabled architecture in which data preparation occurs locally, and inference is performed remotely.
The user interface, on the client side, as described by Iepsen (2018), was developed using HTML5 and styled with CSS, with support from the Metro 4 UI Framework, which offers a modern aesthetic inspired by the Windows visual language and facilitates the creation of responsive and interactive components. Popular libraries, such as jQuery (for DOM manipulation and AJAX requests) and Chart.js (for generating dynamic charts from the loaded data), were incorporated to complement the visual and dynamic elements.
The project also uses the Bootstrap framework, leveraging its bundled components, such as modals, buttons, and the responsive grid system, which contribute to visual standardization and page organization across up to 12 columns. Additionally, integration with DataTables makes data tables interactive, with automatic sorting, filtering, and pagination.
Finally, an alert system was incorporated into the interface to notify the user of conditions associated with partial shading or soiling, aiming to support decision-making on corrective actions and to improve the operational efficiency of the photovoltaic system.
RESULTS AND DISCUSSION
Following data collection and classification, Figure 3 was generated to present the power output dispersion of the photovoltaic system throughout the day under different operational conditions. The situations were differentiated by colors: blue represents the system with clean panels (ideal condition), brown indicates panels with soiling, black represents 25% shading, and red represents 40% shading.
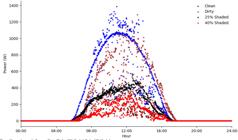
Dispersion of photovoltaic power output throughout the day under different system operating conditions (clean, soiled, and shaded panels)
The power points follow a characteristic bell-shaped curve, with higher generation during central daylight hours, expected behavior for photovoltaic systems (Figure 3). The clean condition (blue) shows the highest power values, reaching peak values close to 1400 W, confirming proper system operation. Although the nominal power of the array is 1300 W, such instantaneous values are expected in real conditions due to irradiance levels occasionally exceeding 1000 W m-2 and lower cell temperatures, which increase module efficiency. Minor measurement noise may also contribute to these peaks, without affecting the overall behavior of the curve.
Soiling (brown) reduces the system’s power output. Although the overall shape of the curve remains similar to the clean condition, the points remain consistently below the blue curve, demonstrating uniform losses throughout the day. This behavior is consistent with the findings reported by Souza et al. (2022), who evaluated photovoltaic modules in the Brazilian semiarid region and showed that more than 15 consecutive rainless days already lead to a noticeable reduction in system efficiency. According to those authors, the output power decreased by 18.72% after 70 days of natural soiling, highlighting the significant impact of dirt accumulation on PV performance.
Shading has an even more significant impact; dispersion is greater with 25% shading (black), and power is visibly lower than in both clean and soiled conditions, especially during peak irradiation hours. The 40% shading (red) presents the lowest power values, with a high concentration of points below 400 W and many near zero, even during solar peak hours. Despite some overlap between statuses, particularly during low-irradiance periods, the differences become more pronounced during peak solar hours, when the effects of soiling and shading are more evident.
The behavior of this graph reinforces the importance of keeping modules clean and free from obstructions, while justifying the adoption of monitoring and alert systems to identify performance losses associated with these conditions. The analyzed data confirm that soiling and shading significantly affect module power output, especially during peak irradiation hours. These effects are consistent with the literature, which describes soiling and partial shading as temporary faults that directly affect PV efficiency and can be identified using advanced diagnostic techniques such as thermography and artificial intelligence (El-Banby et al., 2023).
Figure 4 shows the evolution of the Mean Square Error (MSE), which decreases sharply during the first epochs and converges to approximately 10--2 at the end of training. Since the MSE is dimensionless in this context, this reduction reflects the low discrepancy between predicted and actual values. The convergence behavior indicates that the model effectively learned the nonlinear patterns present in the experimental dataset.
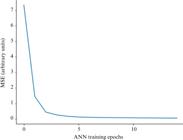
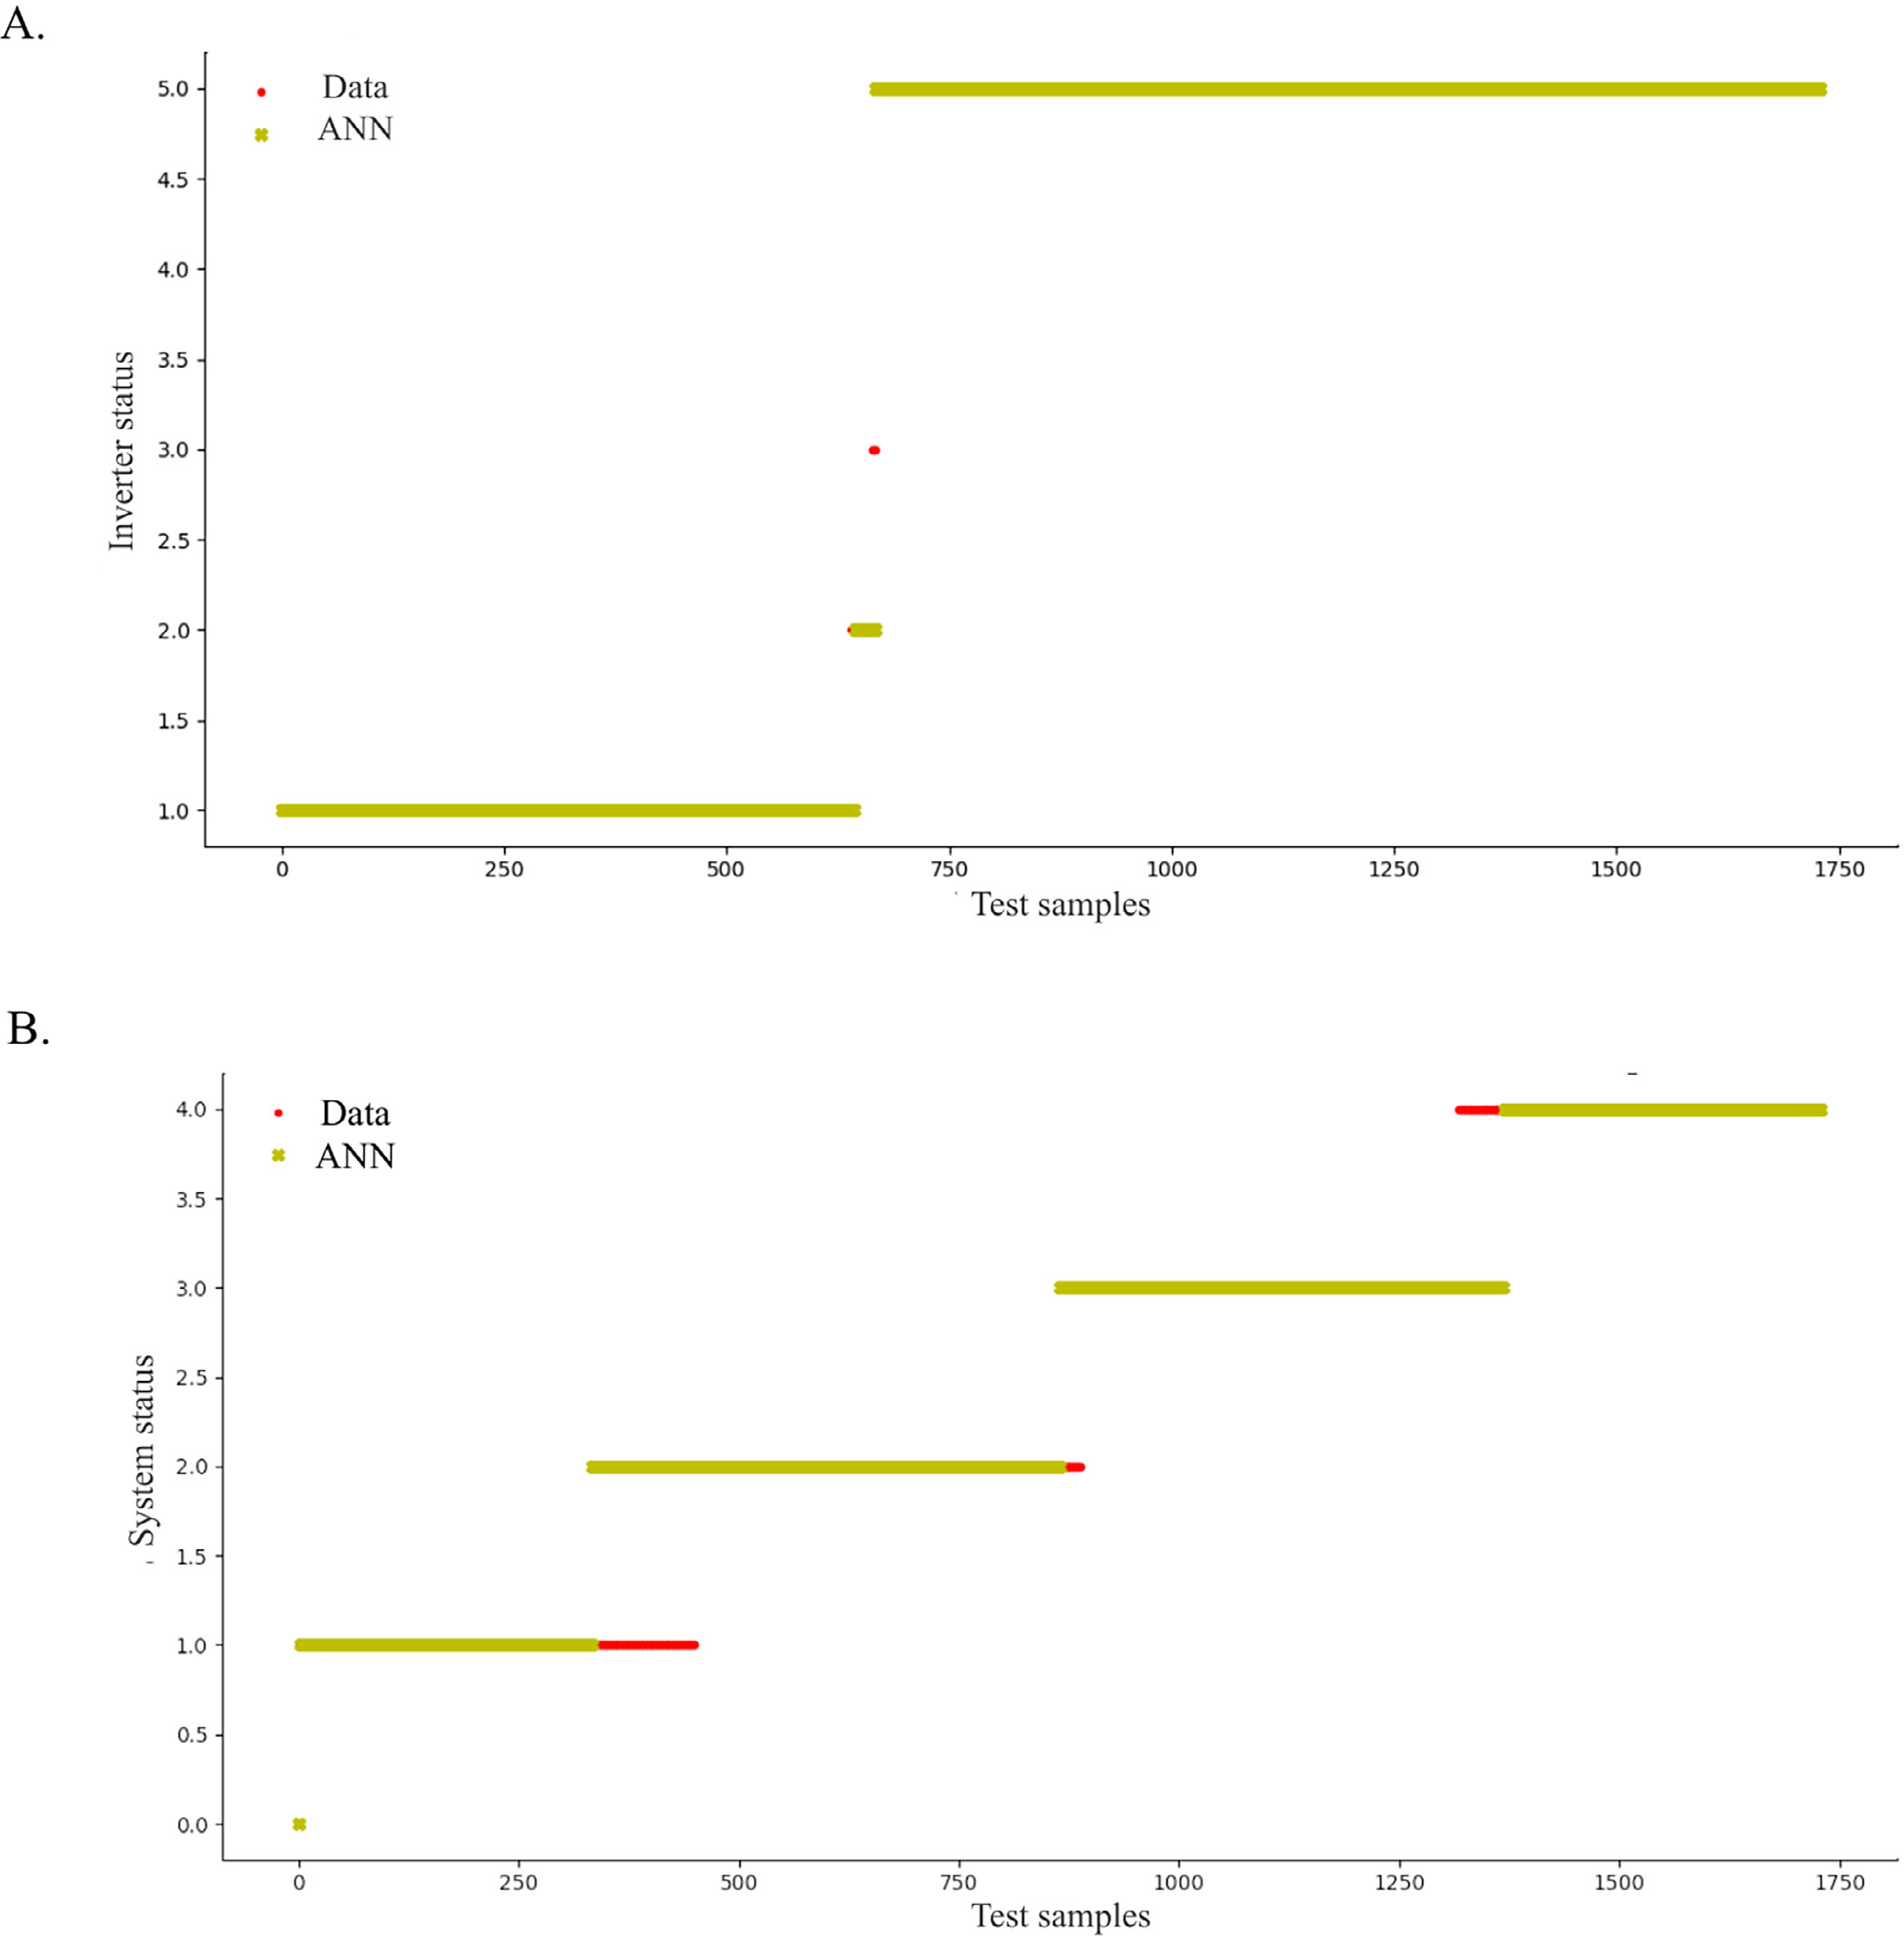
Figure 5A presents the comparison between the measured data (red) and the Artificial Neural Network (ANN) predictions (yellow) for the Inverter Status. Figure 5B shows the corresponding comparison for the System Status. In both subfigures, the strong overlap between predicted and observed values indicates that the model consistently reproduced the operational classes during testing.

Measured data (red) and Artificial Neural Network (ANN) predictions (yellow) for the classification outputs: (A) Inverter Status; (B) System Status
The evaluated metrics indicate that the model performed well under the controlled conditions of this study. This behavior is consistent with the recent literature on photovoltaic system modeling, which emphasizes the importance of proper hyperparameter selection and validation procedures to ensure strong generalization in neural networks applied to energy systems (Coşgun, 2025).
The MSE obtained in training and testing remained at low values (on the order of 10⁻2), indicating a small quadratic discrepancy between predicted and measured values, in accordance with studies on photovoltaic performance assessment reporting reduced MSE as an indicator of well-fitted models (Yousif et al., 2017; Hassan et al., 2024). The MAE values, kept between 5.33 and 5.40%, indicate that the absolute prediction errors were small relative to the operational range considered. Modeling and fault-detection studies in photovoltaic systems report absolute errors of similar magnitude as evidence of good agreement between model outputs and measurements, with errors typically confined to a few percent (Madeti & Singh, 2018; Hassan et al., 2024; Hamad et al., 2025).
The high R2 and EVS values, ranging from 99.74 to 99.76%, indicate that the model explained nearly all the variability in the test dataset. Forecasting and simulation studies of photovoltaic systems, particularly under well-controlled conditions, frequently report coefficients of determination close to 1 as evidence of strong correlation between predicted and observed values and good descriptive capability of the model (Yousif et al., 2017; Shah et al., 2021; Hassan et al., 2024; Aryal et al., 2025).
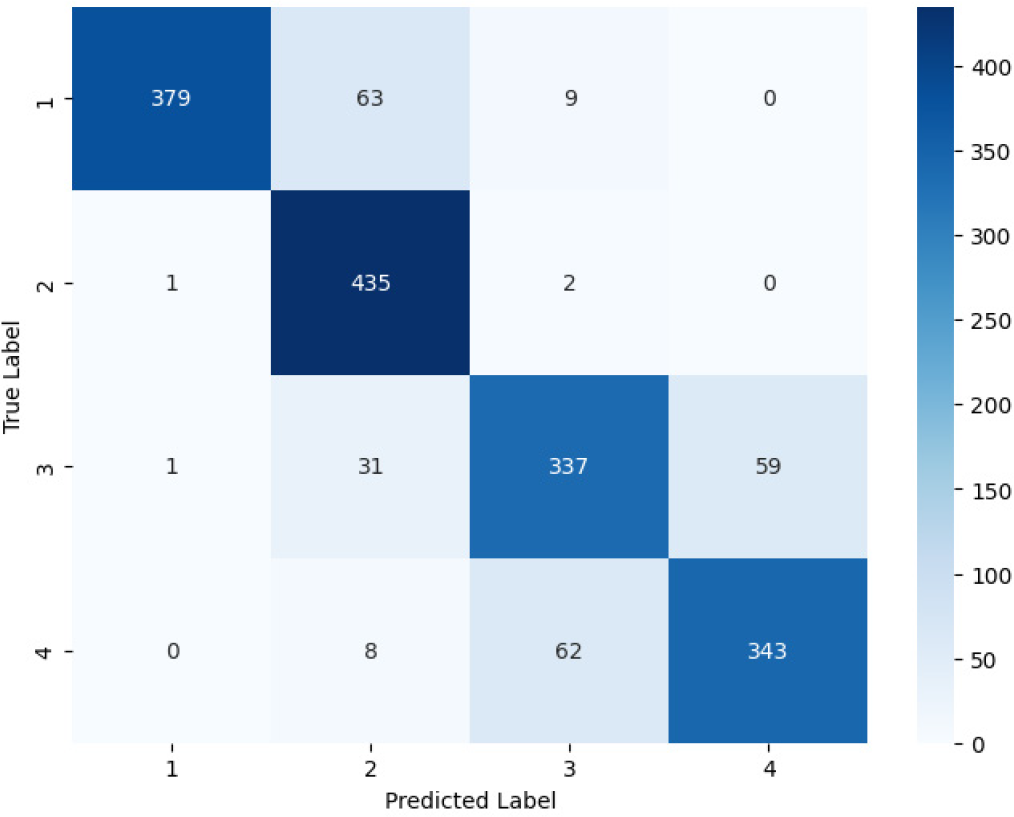
Figure 6 presents the confusion matrix obtained for the trained model, providing a detailed view of its behavior across the evaluated operating conditions. This visualization allows assessment of how accurately each class was identified, as well as the specific patterns of misclassification across clean, soiled, and shaded modules. By examining the distribution of true and predicted labels, it is possible to understand not only the classifier‘s overall performance but also its strengths and limitations in distinguishing similar fault conditions.
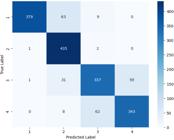
Confusion matrix for the classification model showing the performance across the four operational categories of the photovoltaic system: (1) Clean; (2) Dirty; (3) 25% Shading; (4) 40% Shading
The confusion matrix (Figure 6) provides additional evidence of the model’s behavior across the evaluated operating conditions. The “Dirty” class showed the highest sensitivity (99.3%), indicating that the network effectively identifies soiling-related losses. However, 14% of clean samples were misclassified as dirty, suggesting difficulty in distinguishing naturally low-irradiance moments from mild soiling when only electrical variables are used. For shading, the model accurately detected its presence, with no confusion between clean modules and severely shaded modules.
However, a bidirectional confusion between 25 and 40% shading (13-15%) was observed, indicating that the model reliably identifies shading but struggles to discriminate its intensity. This limitation is consistent with the literature, which reports that even advanced AI-based models may exhibit overlap when classifying similar operational conditions (El-Banby et al., 2023).
It is important to note that these results reflect the model’s performance under controlled laboratory conditions, with well-defined experimental scenarios and data preprocessing stages. Additional validation in operational environments, with natural variability and non-controlled disturbances, is required to confirm the generalization capacity of the model.
A web and mobile interface were developed to display the neural network outputs and issue alerts for shadingand soiling-related cases. These tools facilitate visualization of the model’s inferences, although the operational use of such alerts still depends on future validation under field conditions.
Stage 4, which involves the insertion of the machine learning-based model in the cloud for real-time operation, ensured that predictions were efficiently visualized and accessed remotely. The neural network was implemented in the cloud, so only the catalogued information still needs to be accessed offline, processed, and sent to the cloud.
The SunCloud AI application - Autonomous monitoring of a solar plant with cloud-based AI, registration BR512025000712-4 (Góis et al., 2025) - was developed as a web and mobile platform primarily for the visualization and analysis of data processed by the neural network. Its structure combines classic web languages, as presented by Miletto & Bertagnolli (2014), including PHP on the backend and HTML, CSS, and JavaScript on the frontend, resulting in a lightweight, responsive, and functional application.
According to Iepsen (2018), web systems integrate technologies that run on both the client and server sides. In this project, PHP was used on the server side to implement application logic, authenticate users, and manage navigation across key functionalities, including the control panel, login module, and detailed parameter visualization screens.
The monitoring interface was designed to operate on the client side, without requiring intermediate servers for data visualization. The dashboard displays the main electrical parameters of the photovoltaic plant - voltage, current, and power - in near real time and enables the visualization of environmental variables. This provides users with a comprehensive view of the system’s operational conditions and of the inferences generated by the AI model.
This study advances the field of photovoltaic monitoring by demonstrating that a cloud-enabled neural network architecture can accurately identify performance losses from soiling and partial shading using only electrical and environmental data collected under controlled experimental conditions. The work contributes methodologically by integrating a trained neural model into a lightweight web platform capable of generating near-real-time operational alerts, demonstrating that intelligent diagnostic tools can be deployed without specialized hardware or high-performance servers.
From an application perspective, the system provides evidence that data-driven models can support early fault identification and maintenance planning in small-scale PV plants, helping bridge the gap between laboratory-level machine-learning studies and practical monitoring needs in real installations. The results reinforce the feasibility of combining cloud computing and AI to support energy optimization and reliability improvement in photovoltaic systems, offering a replicable framework for future research and field-scale validation.
For future study, it is suggested developing hardware that enables full integration between the monitoring system and the cloud infrastructure. Due to technical constraints encountered during the project, this integration could not yet be implemented.
CONCLUSIONS
-
1. The system identifies losses caused by soiling and shading with high precision, presenting a Mean Square Error (MSE) on the order of 10⁻2, a Mean Absolute Error (MAE) between 5.33 and 5.40%, and coefficients of determination above 99.7%, although confusion between 25 and 40% shading levels was observed. The neural-network-based architecture with cloud processing is technically viable for automatic diagnostics in photovoltaic plants, producing consistent results under controlled conditions.
-
2. The web platform enabled integrated visualization of electrical and environmental parameters and the issuance of operational alerts, contributing to predictive maintenance strategies.
-
3. Full automation of the data flow is still required; it is recommended integrating the acquisition hardware, performing field testing, and expanding the range of diagnosed faults to increase the system’s applicability.
-
1
Research developed at Universidade de Pernambuco, Petrolina, PE, Brazil.
-
Financing statement:
This research was financially supported by the Conselho Nacional de Desenvolvimento Científico e Tecnológico (CNPq) through the Academic Master’s and Doctorate Program for Innovation (MAI/DAI) in partnership with LACTRON (Process: 130933/2023-6).
-
Ref. 299907
Acknowledgments:
The authors express their gratitude to the National Council for Scientific and Technological Development (CNPq) for the financial support provided through Call No. 12/2020 - Academic Master’s and Doctoral Program for Innovation (MAI/DAI), and for the Master’s scholarships awarded (Grants No. 130933/2023-6 and 131462/2024-5). This work was also supported by the Academic Strengthening Program (PFA) of the University of Pernambuco (UPE). Additionally, this study was financed in part by the Coordenação de Aperfeiçoamento de Pessoal de Nível Superior (CAPES) - Finance Code 001, through the Postgraduate Program in Environmental Science and Technology at the University of Pernambuco.
Data Availability Statement:
The data underlying the findings of this study are available as follows: Patent: Góis, A. R. S.; Barbosa, P. F. C.; Lima Júnior, C. de; Sobral, M. S. M.; Barbosa, T. C. SunCloud AI - Monitoramento autônomo de usina solar com IA em nuvem. Patent BR512025000712-4, 2025. Dataset: Sobral, M. S. M.; Lima Júnior, C. de; Barbosa, P. F. C. Dataset of Photovoltaic Performance and Meteorological Variables from the Solar Inverter and CICLUS Station at UPE. 2025. https://doi.org/10.21227/fwmw-zg91. Researchers can access the dataset via the provided DOI.
LITERATURE CITED
-
Aboshady, F. M.; Taha, I. B. M. Fault detection and classification scheme for PV system using array power and cross-strings differential currents. IEEE Access, [S. l.], v.9, p112655-112669, 2021. https://doi.org/10.1109/access.2021.3104007
» https://doi.org/10.1109/access.2021.3104007 -
Arosh, S. et al. Composite imagery-based non-uniform illumination sensing for system health monitoring of solar power plants. Journal of Solar Energy Engineering, v.145, 011009, 2023. https://doi.org/10.1115/1.4054921
» https://doi.org/10.1115/1.4054921 -
Aryal, T. et al. Active learning of microgrid frequency dynamics using neural ordinary differential equations. IET Energy Systems Integration, v.7, e70020, 2025. https://doi.org/10.1049/esi2.70020
» https://doi.org/10.1049/esi2.70020 -
Barbosa, P. F. C. et al. A multi-protocol energy optimization method for an adaptable wireless MAC system through machine learning. Annals of Telecommunications, v.80, p.1-15, 2025. https://doi.org/10.1007/s12243-023-01004-2
» https://doi.org/10.1007/s12243-023-01004-2 -
BRASIL - Ministério de Minas e Energia (MME); Empresa de Pesquisa Energética (EPE). Anuário Estatístico de Energia Elétrica 2024: Ano base 2023. Rio de Janeiro: EPE, 2024. Available on: <https://www.epe.gov.br/pt/publicacoes-dados-abertos/publicacoes/balanco-energetico-nacional-2024>. Accessed on: Dec. 2024.
» https://www.epe.gov.br/pt/publicacoes-dados-abertos/publicacoes/balanco-energetico-nacional-2024 -
Coşgun, A. Enhancing photovoltaic energy output predictions using ANN and DNN: a hyperparameter optimization approach. Energies, v.18, 174564, 2025. https://doi.org/10.3390/en18174564
» https://doi.org/10.3390/en18174564 -
Costa, S. C. S. et al. Caracterização físico-química da sujidade depositada sobre módulos fotovoltaicos instalados em zonas climáticas de Minas Gerais. In: Rezende, J. O. (org.). A importância da energia solar para o desenvolvimento sustentável. Ponta Grossa: Atena Editora, 2019. Cap.8, p.105-118. https://doi.org/10.22533/at.ed.0031903099
» https://doi.org/10.22533/at.ed.0031903099 -
El-Banby, G. M. et al. Photovoltaic system fault detection techniques: a review. Neural Computing and Applications, v.35, p.24829-24842, 2023. https://doi.org/10.1007/s00521-023-09041-7
» https://doi.org/10.1007/s00521-023-09041-7 - Góis, A. R. S. et al. SunCloud AI - Monitoramento autônomo de usina solar com IA em nuvem. Patent BR512025000712-4, 2025.
-
Hamad, S. et al. Evaluating machine learning models comprehensively for predicting maximum power from photovoltaic systems. Scientific Reports, v.15, 10750, 2025. https://doi.org/10.1038/s41598-025-91044-6
» https://doi.org/10.1038/s41598-025-91044-6 -
Hassan, I. et al. Explainable deep learning model for grid-connected photovoltaic system performance assessment for improving system reliability. IEEE Access, v.12, p.120729-120746, 2024. https://doi.org/10.1109/access.2024.3452778
» https://doi.org/10.1109/access.2024.3452778 - Iepsen, E. F. Lógica de programação e Algoritmos com JavaScript. 1.ed. São Paulo: Novatec Editora, 2018. 354p.
-
Kumar, D. et al. Optimizing photovoltaic soiling loss predictions in Louisiana: a comparative study of measured and modeled data using a novel approach. Progress in Photovoltaics: Research and Applications, v.33, p.560-579, 2025. https://doi.org/10.1002/pip.3891
» https://doi.org/10.1002/pip.3891 -
Labach, A. et al. Survey of dropout methods for deep neural networks. ArXiv preprint, 2019. https://doi.org/10.48550/arXiv.1904.13310
» https://doi.org/10.48550/arXiv.1904.13310 -
Latreche, S. et al. Sensors placement for the faults detection and isolation based on bridge linked configuration of photovoltaic array. Electrical Engineering and Electromechanics, v.2022, p.41-46, 2022. https://doi.org/10.20998/2074-272X.2022.5.07
» https://doi.org/10.20998/2074-272X.2022.5.07 -
Liu, G. et al. Condition classification and performance of mismatched photovoltaic arrays via a pre-filtered Elman neural network decision making tool. Solar Energy, v.173, p.1011-1024, 2018. https://doi.org/10.1016/j.solener.2018.08.044
» https://doi.org/10.1016/j.solener.2018.08.044 -
Madeti, S.; Singh, S. Modeling of PV system based on experimental data for fault detection using kNN method. Solar Energy, v.173, p.139-151, 2018. https://doi.org/10.1016/j.solener.2018.07.038
» https://doi.org/10.1016/j.solener.2018.07.038 - Miletto, E. M.; Bertagnolli, S. C. Desenvolvimento de Software II - Introdução ao desenvolvimento Web com HTML, CSS, JavaScript e PHP - Eixo: Informação e comunicação. 1.ed. Porto Alegre: Bookman, 2014. 276p.
-
Rezende, J. O. A importância da energia solar para o desenvolvimento sustentável. 1.ed. Ponta Grossa: Atena Editora, 2019. 21p. https://doi.org/10.22533/at.ed.003190309
» https://doi.org/10.22533/at.ed.003190309 -
Shah, A. et al. A novel prediction error-based power forecasting scheme for real pv system using pvusa model: A grey box-based neural network approach. IEEE Access, v.9, p.87196-87206, 2021. https://doi.org/10.1109/access.2021.3088906
» https://doi.org/10.1109/access.2021.3088906 -
Sobral, M. S. M. et al. Dataset do desempenho fotovoltaico e variáveis meteorológicas do inversor solar e estação CICLUS na UPE. IEEE Dataport, 2025. https://doi.org/10.21227/fwmw-zg91
» https://doi.org/10.21227/fwmw-zg91 -
Souza, T. L. S. de. et al. Dirt on photovoltaic modules and efficient energy generation in the Brazilian semiarid. Revista Brasileira de Engenharia Agrícola e Ambiental, v.26, p.321-326, 2022. http://dx.doi.org/10.1590/1807-1929/agriambi.v26n5p321-326
» http://dx.doi.org/10.1590/1807-1929/agriambi.v26n5p321-326 -
Yousif, J. et al. Predictive models for photovoltaic electricity production in hot weather conditions. Energies, v.10, 971, 2017. https://doi.org/10.3390/en10070971
» https://doi.org/10.3390/en10070971
Edited by
-
Editors:
Ítalo Herbet Lucena Cavalcante & Carlos Alberto Vieira de Azevedo