
 Breakpoint in leaf appearance of cut sunflower genotypes: a bilinear model of the phyllochron1
ABSTRACT
The phyllochron is a key developmental parameter used to predict leaf appearance in crop simulation models. This study estimated the phyllochron of field-grown cut sunflower genotypes across tropical, subtropical, and temperate environments using single-linear and bilinear models, and tested the hypothesis that a distinct breakpoint reflects a change in phyllochron during ontogeny. Leaf appearance was monitored in twelve genotypes across multiple trials conducted between 2020 and 2023 in Brazil and Italy. The phyllochron was estimated using linear and bilinear regressions relating leaf number to accumulated thermal time and expressed in °C day per leaf. Field observations revealed a breakpoint in leaf appearance, with a longer phyllochron up to stage V6 (34.87 °C day per leaf) and a shorter phyllochron from stage V7 onward (21.82 °C day per leaf). This shift was associated with changes in leaf phyllotaxy and the onset of stem elongation. Phyllochron phases were consistent across genotypes and influenced by environmental factors, particularly air temperature, whereas planting method showed no significant effect. These findings improve understanding of phyllochron dynamics and provide an ecophysiological basis for incorporating a bilinear chronological response function into process-based models for cut sunflower.
Key words:
Helianthus annuus L.; cut flower; development; phenology; thermal time
HIGHLIGHTS:
Cut sunflower exhibits two distinct phyllochron phases: an early phase (V1-V6) and a late phase (V7 to final leaf number).
The shift in phyllochron coincides with changes in phyllotaxy and the onset of stem elongation.
A bilinear chronological response function better describes leaf appearance in process-based models for cut sunflower.
RESUMO
Filocrono é uma importante variável de desenvolvimento que pode ser utilizada para estimar a aparência de folhas em modelos de simulação de culturas agrícolas. O objetivo deste trabalho foi estimar o filocrono usando um modelo linear e um bilinear em genótipos de girassol de corte cultivados a campo em ambiente tropical, subtropical e temperados, e testar a hipótese de ponto de inflexão como indicador na mudança do filocrono durante a ontogenia. O número de folhas de doze genótipos foram observados em múltiplos ensaios conduzidos de 2020 a 2023 em diferentes locais do Brasil, América do Sul, e um local na Itália, Europa. O filocrono foi estimado por regressão linear e bilinear entre o número de folhas e o tempo térmico acumulado, e expresso em °C dia por folha. Observações realizadas a campo identificaram um ponto de inflexão no aparecimento de folhas, resultando em um filocrono maior até o estágio V6 (34.87 °C dia por folha) e menor após o estágio V7 (21.82 °C dia por folha). Essa mudança no filocrono está relacionada com a filotaxia das folhas e a elongação da haste. As fases do filocrono são consistentes entre genótipos e influenciadas por fatores ambientais que variam entre locais, como a temperautra do ar. Os métodos de plantio não influenciam o filocrono. Estes resultados contribuem no entendimento do filocrono e fornece uma base ecofisiológica para desenvolver uma função cronológica de resposta em modelos baseados em processos para girassol de corte.
Palavras-chave:
Helianthus annuus L.; flor de corte; desenvolvimento; fenologia; tempo térmico
INTRODUCTION
Helianthus annuus L. (sunflower) is an annual dicotyledonous species of the family Asteraceae, native to temperate regions of North America (Baldotto & Baldotto, 2015). Although initially cultivated as an oilseed crop, sunflower has been used as an ornamental plant for more than 200 years (Kutschera & Briggs, 2016). Its importance has increased in recent years, with a growing number of genotypes available for gardening, potted cultivation, and cut-flower production, making it a major crop in floriculture (Shatoori et al., 2021; Puttha et al., 2023).
Sunflower growth and development have been extensively described in the literature (Alves et al., 2025). Schneiter & Miller (1981) classified its developmental cycle into distinctive vegetative and reproductive phases. The vegetative phase is characterized by leaf emergence (Buffon et al., 2022), and final leaf number depends on both the rate of primordium formation at the stem apical meristem and the rate of leaf appearance (Tenorio et al., 2017).
Temperature is a key environmental factor controlling leaf appearance in sunflower (Tomiozzo et al., 2025) and in other floriculture crops such as Eustoma grandiflorum (Raf.) Shinners (Höhn et al., 2023) and Dahlia sp. (Fernandes et al., 2023). For sunflower, the base temperature for leaf appearance is 4 °C (Villalobos & Ritchie, 1992). Temperatures outside the lower and upper thresholds can affect plant physiology and morphology, influencing respiration, photosynthesis, leaf emergence, and ultimately plant growth, leaf area, and yield (Castro & Farias, 2005; Mehmood et al., 2023).
Thermal time (TT, °C per day) is widely used to quantify the effect of temperature on plant development (Streck et al., 2009; Ongaratto et al., 2020). Under a linear relationship between leaf appearance (leaves per stem) and TT, the phyllochron corresponds to the thermal time required for the appearance of successive leaves on a stem, expressed in °C day per leaf (Wilhelm & McMaster, 1995; Plancade et al., 2023). It is estimated as the inverse of the slope of the linear regression, providing a simple and effective modeling approach (Aiken, 2005).
Sadras & Villalobos (1993) reported an inflection point at the sixth leaf, indicating a breakpoint in leaf appearance between the V6 and V7 stages, consistent with Villalobos & Ritchie (1992). However, the mechanisms underlying this shift in cut sunflower remain poorly understood. A single phyllochron may not adequately represent leaf appearance dynamics, and a bilinear model, comprising one regression from V1 to V6 stages and another from V7 to Vn, has been proposed (Aiken, 2005). This shift is hypothesized to coincide with a change in phyllotaxis from opposite to alternate leaves (Schneiter & Miller, 1981; Sadras & Villalobos, 1993). Similar breakpoints have been observed in other species, such as Fragaria × ananassa (Rosa et al., 2011) and Opuntia stricta Haw. (Silva et al., 2023).
Understanding phyllochron in floriculture crops is essential for describing ecophysiological processes related to plant development. In sunflower, evaluating elite genotypes across different environments and management practices can provide useful information for growers, support crop management practices, and improve crop modeling (Casadebaig et al., 2011; Tomasi et al., 2024; Tomiozzo et al., 2025). Therefore, this study aimed to (i) estimate the phyllochron using single-linear and bilinear models in field-grown cut sunflower genotypes across different sowing dates and locations and (ii) to investigate the relationship between the breakpoint and changes in phyllochron.
MATERIAL AND METHODS
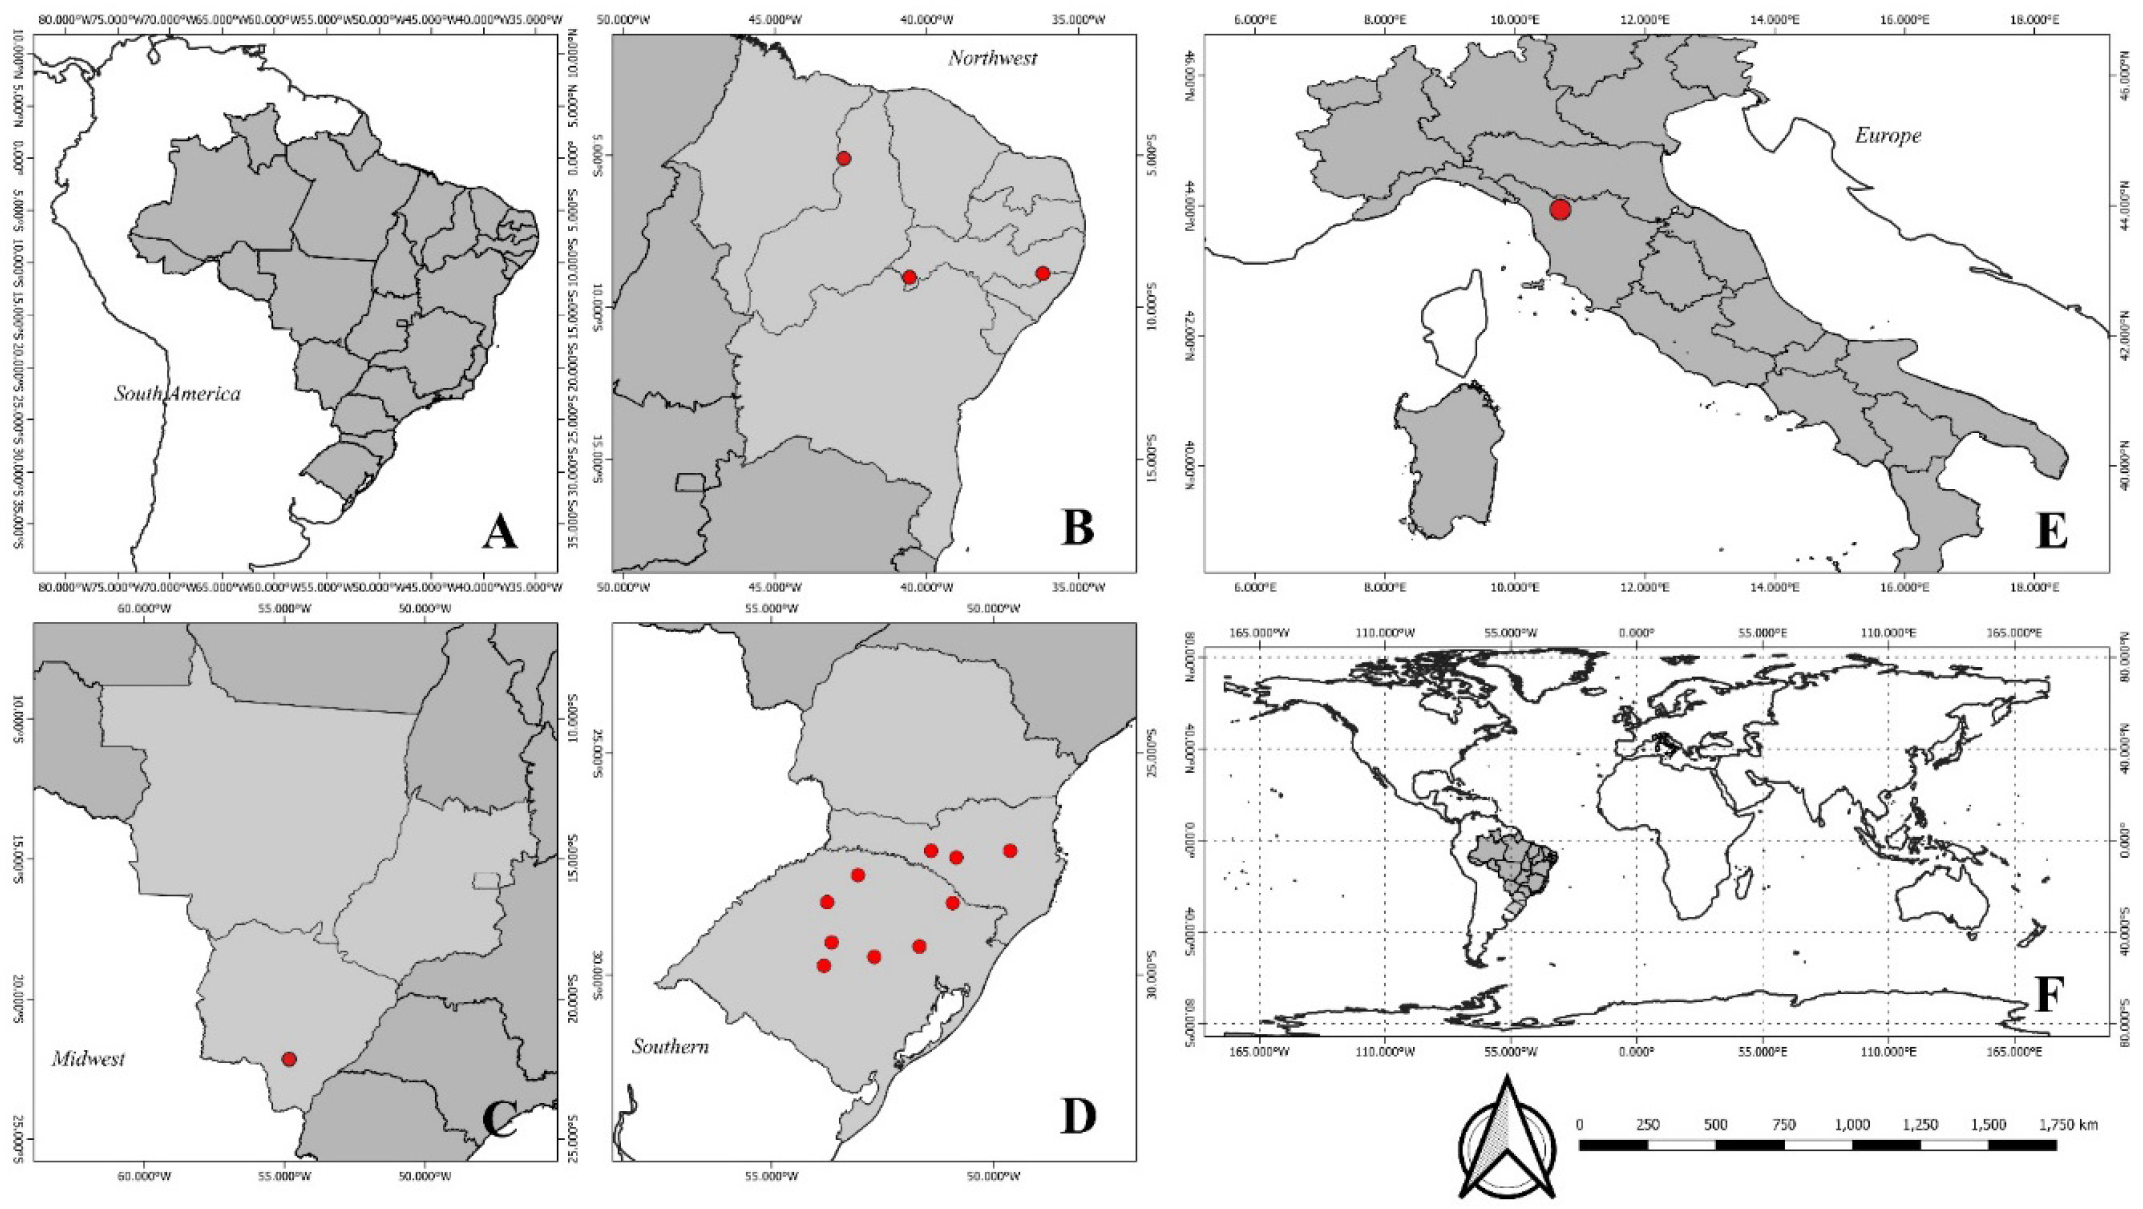
The data used in this study were obtained from on-farm field trials conducted over four years (2020-2023) at multiple locations and sowing dates to evaluate leaf appearance rates in cut sunflower genotypes, allowing the assessment of both genotypic performance and environmental effects. The study sites were located in the Northeast, Midwest, and Southern regions of Brazil and in Tuscany, Italy (Figure 1). In Brazil, the experimental regions span two climatic zones: tropical and subtropical (Table 1). Tropical climates cover approximately 81.4% of the country and are characterized by high temperatures (> 18 oC) with distinct wet and dry seasons. Southern Brazil is located south of the Tropic of Capricorn and exhibits a humid subtropical climate (Cfa, no dry season) according to the Köppen classification (Alvares et al., 2013). According to Blasi et al. (2014), the study site in Italy is situated in an Apennine province with temperate climate, where the minimum temperature in the coldest month is below 3 °C and maximum temperatures may exceed 30 °C in the hottest month.
Characterization of cut sunflower genotypes evaluated in field trials conducted over four years (2020-2023) in Brazil and one year (2023) in Italy, comprising the dataset analyzed in this study
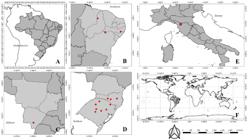
Geographic distribution of field trials evaluating cut sunflower genotypes in Brazil (A), including the Northeast (B), Midwest (C), and Southern (D) regions; in Tuscany, Italy (E); and (F) a global map indicating the continental locations of the study sites
Twelve Helianthus annuus L. genotypes developed for cut-flower production were obtained from private international breeding companies. Table 1 presents the distribution of genotypes across locations.
Trials conducted in Brazil followed the standardized management practices. Sowing was performed in plastic trays filled with commercial substrate and maintained under protected conditions until transplanting to the field, which occurred when the first pair of true leaves reached a blade length of approximately 2 cm and plants exhibited well-developed root systems. Plots were prepared with standardized basal fertilization consisting of 500 g m-2 of limestone (when required) and 50 g m-2 of NPK (05-20-20), applied and incorporated into the soil. Each plot was 1 m wide and 0.25-0.30 m high. Plant density was 32 plants m-2, arranged in four rows spaced 0.20 m apart, with 0.125 m between plants within rows. Topdressing fertilization was applied 10 to 15 days after transplanting using 25 g m-2 of potassium chloride (KCl) and 25 g m-2 of urea.
Cultural practices-including pest and disease control as required, manual hoeing for weed control, and drip irrigation to avoid soil water deficit- were carried out according to Tomiozzo et al. (2024). Each plot was staked at the four corners using bamboo stakes or wooden slats, and raffia strings were installed at 2-3 heights as plants grew during development.
The field trial conducted in Pescia, Tuscany, Italy, followed the same general methodology as the Brazilian trials, with adaptations to local conditions. Plants were grown in 0.80 m2 plots, with 30 plants arranged in three rows spaced 0.20 m apart and 0.125 m between plants within rows. Each plot received 50 g of 16-9-12 NPK fertilizer at transplanting and 50 g of 18-46 NP fertilizer applied 28 days after transplanting as side dressing.
An additional subtrial was conducted in Santa Maria (Rio Grande do Sul state, Southern Brazil) from August to November 2020 to evaluate the effect of planting method (direct sowing vs. transplanting) on phyllochron. Six genotypes (AG-01, AO-02, MO-03, SO-06, VO-09, VT-11) were evaluated in a factorial randomized complete block design with four replications. Crop management followed the same practices adopted in the other Brazilian trials.
Plants located in the central rows were tagged with colored wires one week after transplanting. The number of tagged plants varied from 10 to 24 per trial. Accumulated leaf number (ALN) on the main stem was recorded once or twice per week from V1 (first true leaf) until the final leaf number (FLN), which occurred near the R4 stage (Schneiter & Miller, 1981). A leaf was considered emerged when its blade reached at least 2 cm (Simon et al., 2025), resulting in a high-resolution dataset for ALN.
Different methods can be used to calculate thermal time (Streck et al., 2009). In this study, it was calculated using the method described by Rosa et al. (2009) and Delatorre et al. (2022). Daily thermal time (DTT, °C day) was estimated using the equations (Eqs. 1 to 4) proposed by Arnold (1960) and Gilmore Jr. & Rogers (1985):
The cardinal temperatures for sunflower development (Tb, Topt, and TB) were defined as 4, 28 and 40 °C, respectively (Villalobos et al., 1996). Accumulated thermal time (ATT, °C day) was calculated as the sum of daily thermal time values (ATT = ∑DTT) (Streck et al., 2008). Weather data in Brazil were obtained from meteorological stations of the Brazilian National Institute of Meteorology or nearby private stations, whereas data for Italy were obtained from the meteorological station at the Research Centre for Vegetable and Ornamental Crops (CREA-OF). Mean daily air temperature (Tmean) was calculated as the average of the daily minimum and maximum temperatures.
For all genotypes, the phyllochron (PHYL, °C day per leaf was calculated as the inverse of the slope (1/b) of the linear regression between accumulated leaf number (ALN, dependent variable) and ATT (independent variable) (Streck et al., 2009). Three phyllochron values were estimated and defined as single, early, and late phases. The single phyllochron (PHYLsingle) was estimated using leaf appearance from V1 to the final leaf number (FLN). Early and late phyllochrons were obtained by dividing leaf appearance into two phases: from V1 to V6 (PHYLearly), and from V7 to FLN (PHYLlate), as proposed by Villalobos & Ritchie (1992).
Phyllochron data were grouped by season (spring, summer, autumn, and winter), location, and genotype. The Shapiro-Wilk (p ≤ 0.05) and Levene’s tests (p ≤ 0.05) were used to assess normality and homogeneity of variances, respectively. Given that the datasets did not meet these assumptions, they were analyzed using the Kruskall-Wallis nonparametric test, followed by Dunn’s post-hoc test with Bonferroni adjustment. The effects of location, season, and genotype effects were evaluated for each phyllochron phase. Descriptive statistics, including measures of central tendency (mean and median) and dispersion, were also calculated.
To compare phyllochron phases between different planting methods in the additional trial conducted in Santa Maria (Rio Grande do Sul, Brazil), datasets that met the assumptions of normality and homogeneity were subjected to analysis of variance (ANOVA). When significant, means were compared using Tukey’s test at 5% probability. All statistical analyses were performed using RStudio (R Core Team, 2024).
RESULTS AND DISCUSSION
The multi-location, multi-year field trials conducted across different environments in Brazil and Italy enabled a comprehensive evaluation of leaf appearance in cut sunflower genotypes under diverse edaphoclimatic conditions, management practices, and variations in temperature and photoperiod (Table 2). Temperature varied from -2.0 °C in Vacaria (below the base temperature for sunflower) to 37.7 °C in Santa Maria (close to the upper cardinal temperature). Photoperiod (P) varied from 10.2 to 13.5 hours across growing seasons, particularly in subtropical regions, where photoperiod changes with seasonal temperature variation.
Sowing and transplanting dates (dd/mm/yyyy), minimum (TMin), maximum (TMax), and mean air temperature (Tmean), and photoperiod (P) at experimental sites in Brazil (2020-2023) and Italy (2023)
The wide range of meteorological conditions addressed limitations of previous studies on sunflower phyllochron (Villalobos & Ritchie, 1992). By using a robust dataset encompassing multiple genotypes and environments, this study applied a more comprehensive analysis of phyllochron patterns. Exposing plants to diverse growing conditions enhances the reliability of inferences regarding growth and development processes and supports the use of thermal time as a measure of biological time (Streck et al., 2008).
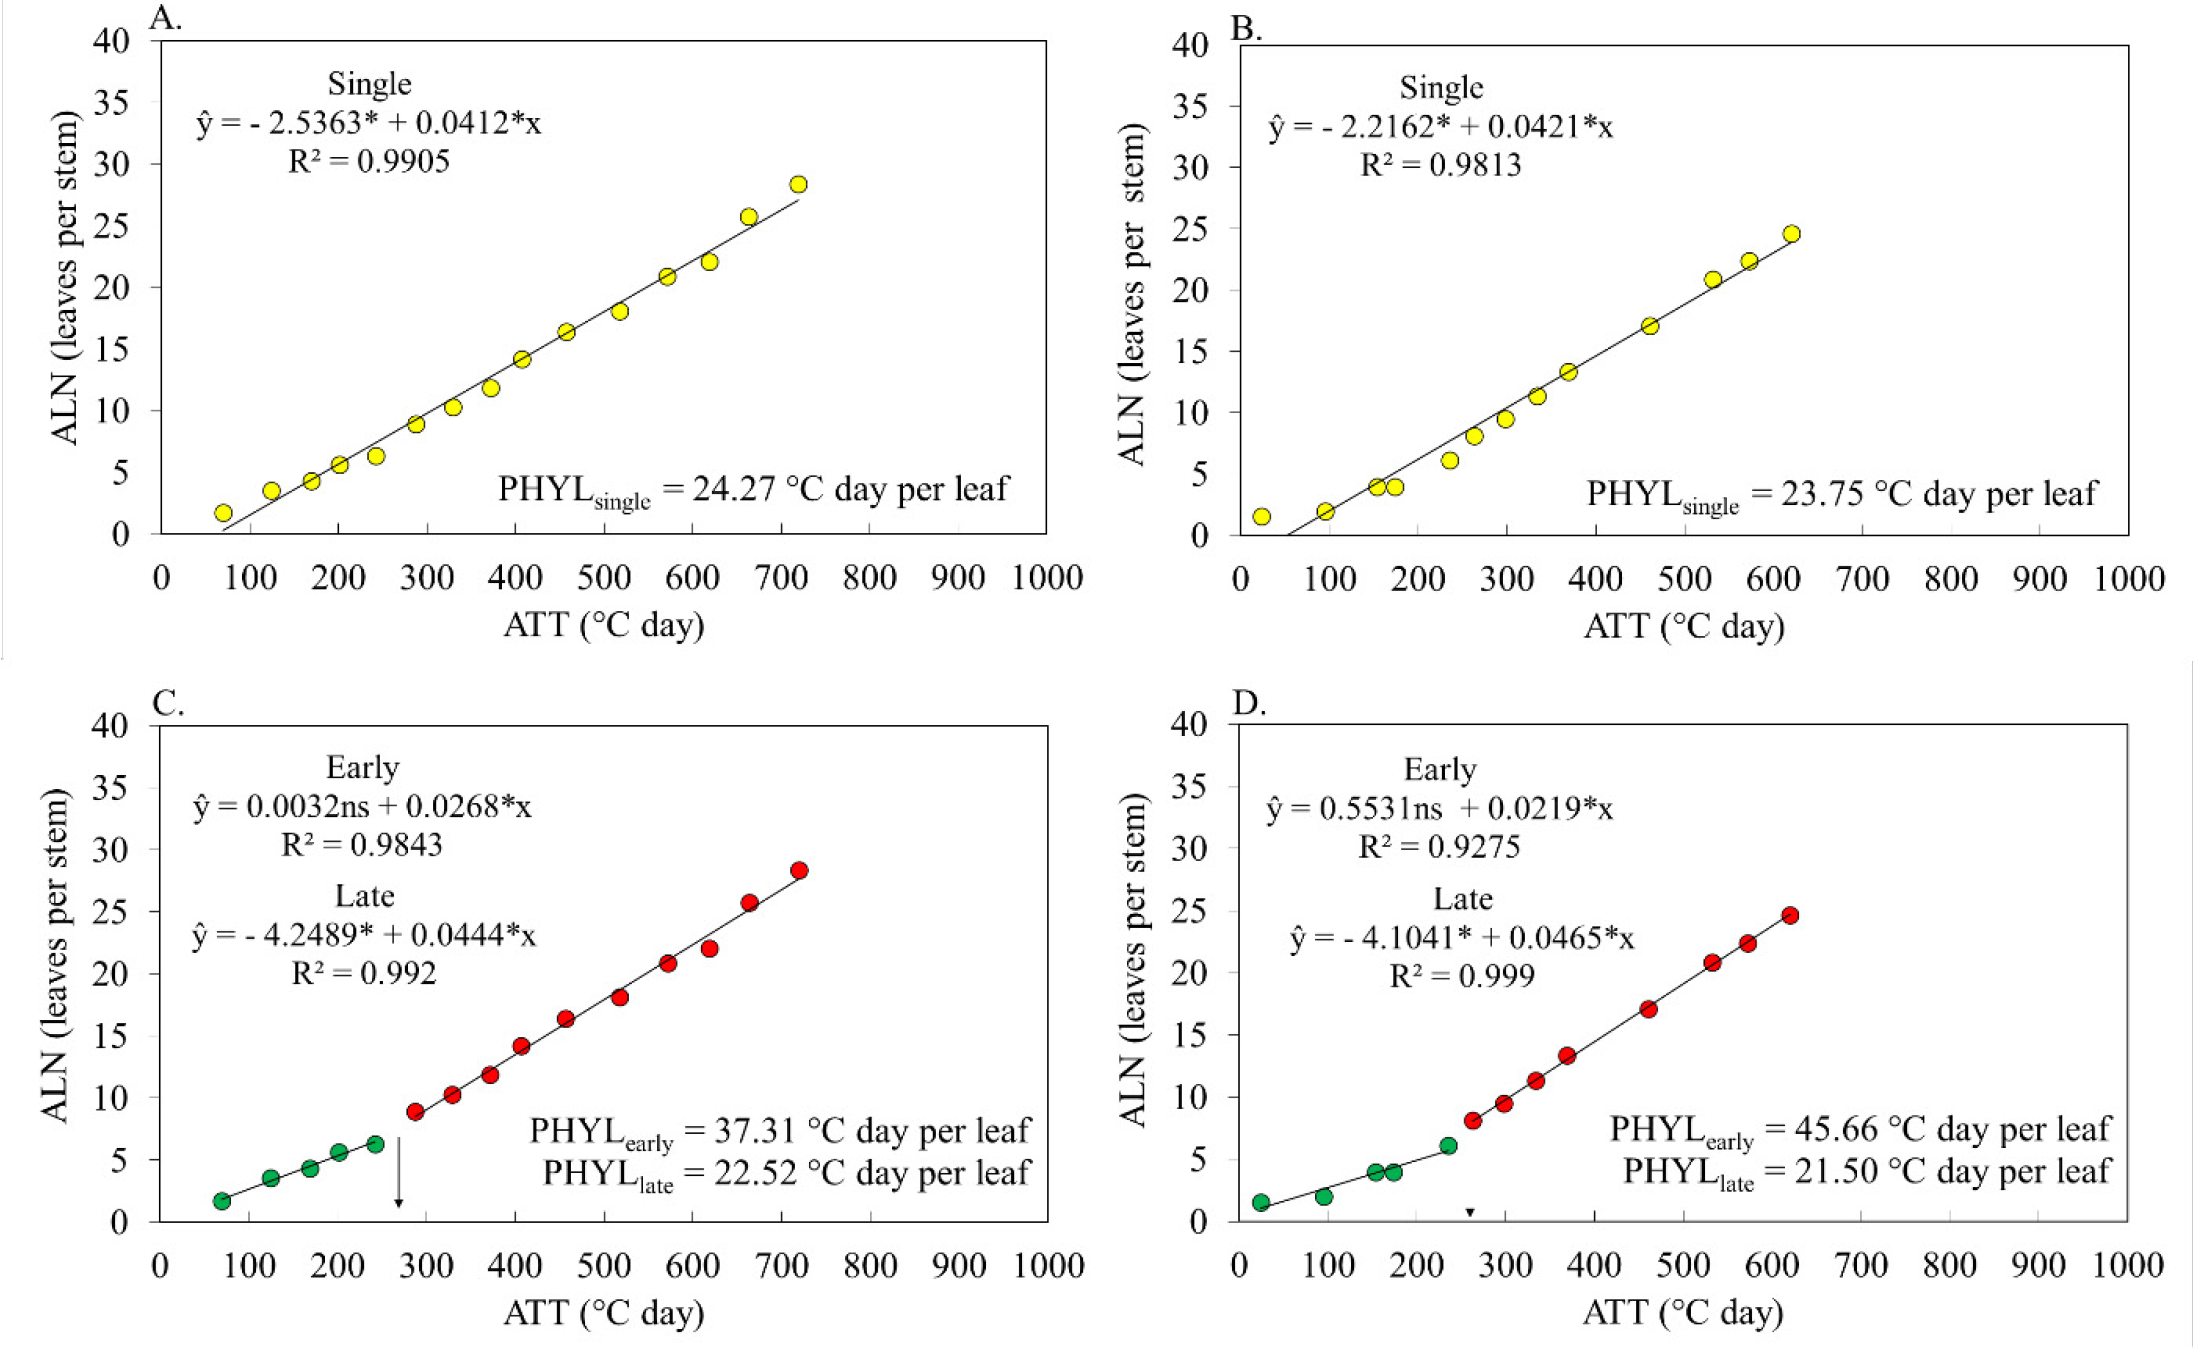
Figure 2 shows the relationship between ALN and ATT for both single and bilinear phyllochron models. Examples include genotype AO-02 in Brazil (sown on 06/08/2020; Figure 2A) and genotype AG-01 in Italy (sown on 28/02/2023; Figure 2B), as well as the corresponding bilinear relationships with a breakpoint between V6 and V7 (Figures 2C and D). A strong linear relationship between ALN and ATT was observed, with coefficients of determination (R2) exceeding 0.90 across genotypes, locations, sowing dates, and phyllochron phases. The phyllochron breakpoint consistently occurred between 200 and 300 °C day across environments and genotypes, indicating a stable pattern. These results suggest that temperature is the main driver of leaf appearance and confirm that estimating phyllochron as the inverse of the regression slope is an appropriate approach (Streck et al., 2009; Rosa et al., 2011).
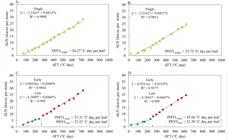
Relationship between accumulated leaf number per stem (ALN, leaves per stem) and accumulated thermal time (ATT, °C day) for cut sunflower genotypes AO-02 (A, C) and under contrasting environments in Brazil and Italy. Panels A and B represent single-phase models, whereas panels C and D show bilinear models with a breakpoint between V6 and V7
Previous studies have shown that leaf appearance is better described using two phyllochron phases rather than a single phase (Aiken, 2005). Similar patterns have been reported in other species. In strawberry (Fragaria × ananassa Duch.), separating vegetative and reproductive phyllochron phases improved the representation of leaf development dynamics (Rosa et al., 2011). In long-cycle crops such as sugarcane (Saccharum officinarum L). and forage cactus (Opuntia stricta Haw), distinct early and late phyllochron phases have also been identified (Streck et al., 2010; Silva et al., 2023). Likewise, soybean (Glycine max. (L.) Merr) exhibits distinct plastochron phases (Porta et al., 2024), indicating that phase differentiation is a common feature of plant development.
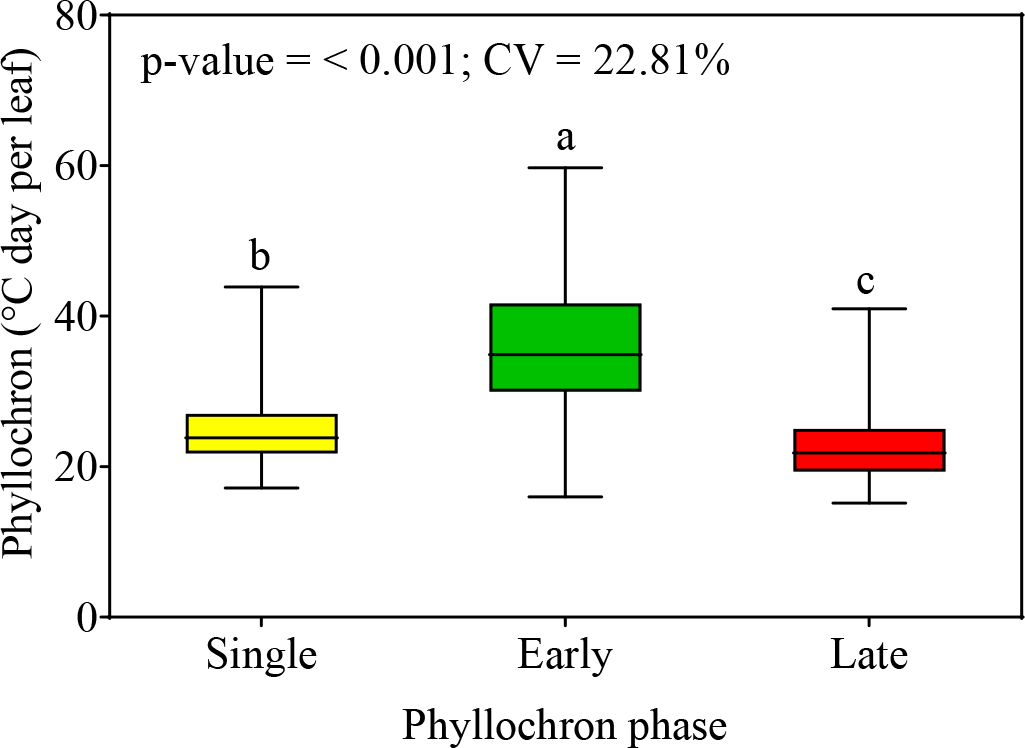
The dataset did not meet the assumptions of normality (Shapiro-Wilk, p ≤ 2.2 × 10⁻¹⁶) or homogeneity of variances (Levene’s test, p = 0.0002). Therefore, phyllochron values were summarized using medians and interquartile ranges (Figure 3). Significant differences among phyllochron phases (Figure 3) were detected using the Kruskall-Wallis test (p ≤ 2.2 × 10⁻¹⁶). The early phase showed the highest median phyllochron (34.87 °C day per leaf), followed by the single phase (23.83 °C day per leaf) and the late phase (21.82 °C day per leaf), indicating the relationship PHYLearly > PHYLsingle > PHYLlate.
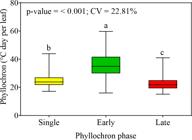
Distribution of phyllochron phases in cut sunflower, based on pooled data from field trials conducted in Brazil (2020-2023) and Italy (2023)
Phyllochron values varied among phases, with interquartile ranges of 21 to 27 °C day per leaf for the single phase, 30 to 42 °C day per leaf for the early phase, and 19 to 25 °C day per leaf for the late phase (Figure 3). These results are consistent with those reported by Villalobos & Ritchie (1992), who found values of 20 to 25 °C day per leaf for the single phase, 35 to 43 °C day per leaf for the early phase (up to six leaves), and 18 to 29 °C day per leaf for the late phase (from seven leaves onward). Higher phyllochron values indicate a greater thermal time requirement for the appearance of successive leaves. Accordingly, leaf emergence in cut sunflower is slower during the early phase (V1-V6) and faster during the late phase (from V7 onward). Conversely, grasses such as rice (Oryza sativa L.) (Streck et al., 2008) and sorghum (Sorghum bicolor L.) (Clerget et al., 2008) exhibit the opposite pattern, with a faster early phase and slower late phase.
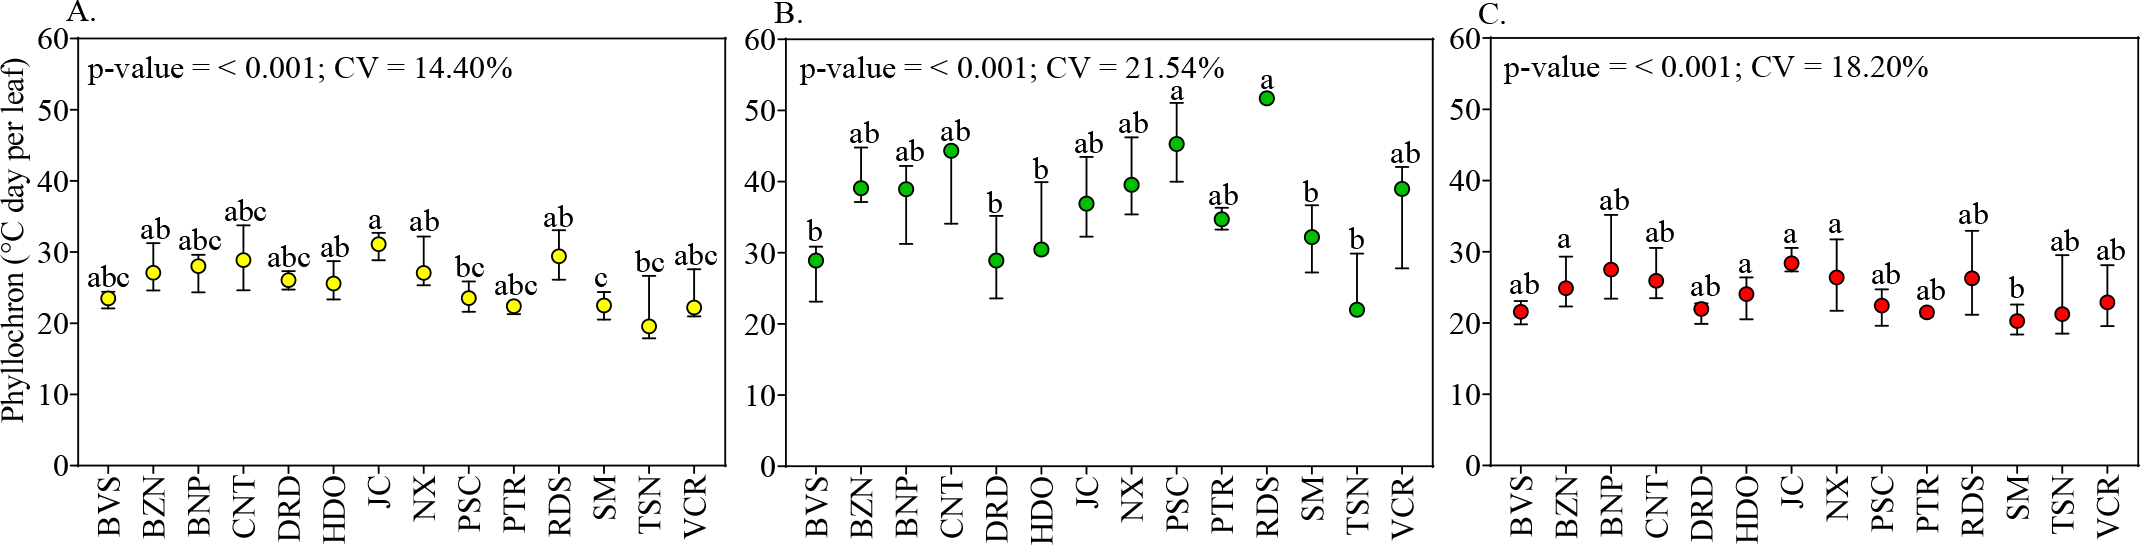
The effects of location, season, and genotype were analyzed for each phase. Kruskall-Wallis and Dunn’s post hoc tests revealed significant differences among locations (Figure 4). For the single phyllochron, Canhotinho and Júlio de Castilhos differed from Pescia, Santa Maria and Teresina, while Santa Maria differed from Rio do Sul, Novo Xingú, Herval D’Oeste, and Bozano (Figure 4A). Median values ranged from 22.49 °C day per leaf (Santa Maria) to 31.10 °C day per leaf (Júlio de Castilhos).
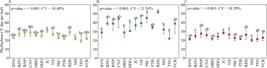
Median phyllochron and interquartile range for cut sunflower across locations for each phyllochron phase (A: single; B: early; and C: late) based on field trials conducted in Brazil (2020-2023) and Italy (2023)
From the early phyllochron (Figure 4B), Rio do Sul (51.17 °C day per leaf) and Pescia (45.30 °C day per leaf) showed the highest values and differed significantly from Boa Vista do Sul (28.92 °C day per leaf), Herval D’Oeste (30.46 °C day per leaf), Santa Maria (32.31 °C day per leaf), Dourados (28.92 °C day per leaf), and Teresina (21.99 °C day per leaf). For the late phyllochron (Figure 4C), the lowest median value was observed in Santa Maria (20.27 °C day per leaf), differing from locations with higher values, including Herval D’Oeste (24.06 °C day per leaf), Júlio de Castilhos (28.38 °C day per leaf), Novo Xingú (26.41 °C day per leaf), and Bozano (24.88 °C day per leaf) (Figure 4C).
Differences in phyllochron were primarily associated with location, reflecting environmental variability, particularly temperature. Variations in sowing dates and environments resulted in substantial differences in the thermal conditions experienced by the plants, particularly in southern Brazil, where fluctuations in temperature, photoperiod, and radiation are more pronounced (Tomiozzo et al., 2025). These factors contributed to the greater variability in phyllochron observed across locations. In Pescia (Italy), sowing at the end of winter 2023 exposed plants to temperatures close to or below the base temperature (4 °C) during early development. These conditions reduced leaf appearance rates, resulting in higher early phyllochron values and an extended vegetative phase. Consequently, the breakpoint occurred at approximately 50 days after transplanting, prolonging the crop cycle and delaying harvest until early summer.
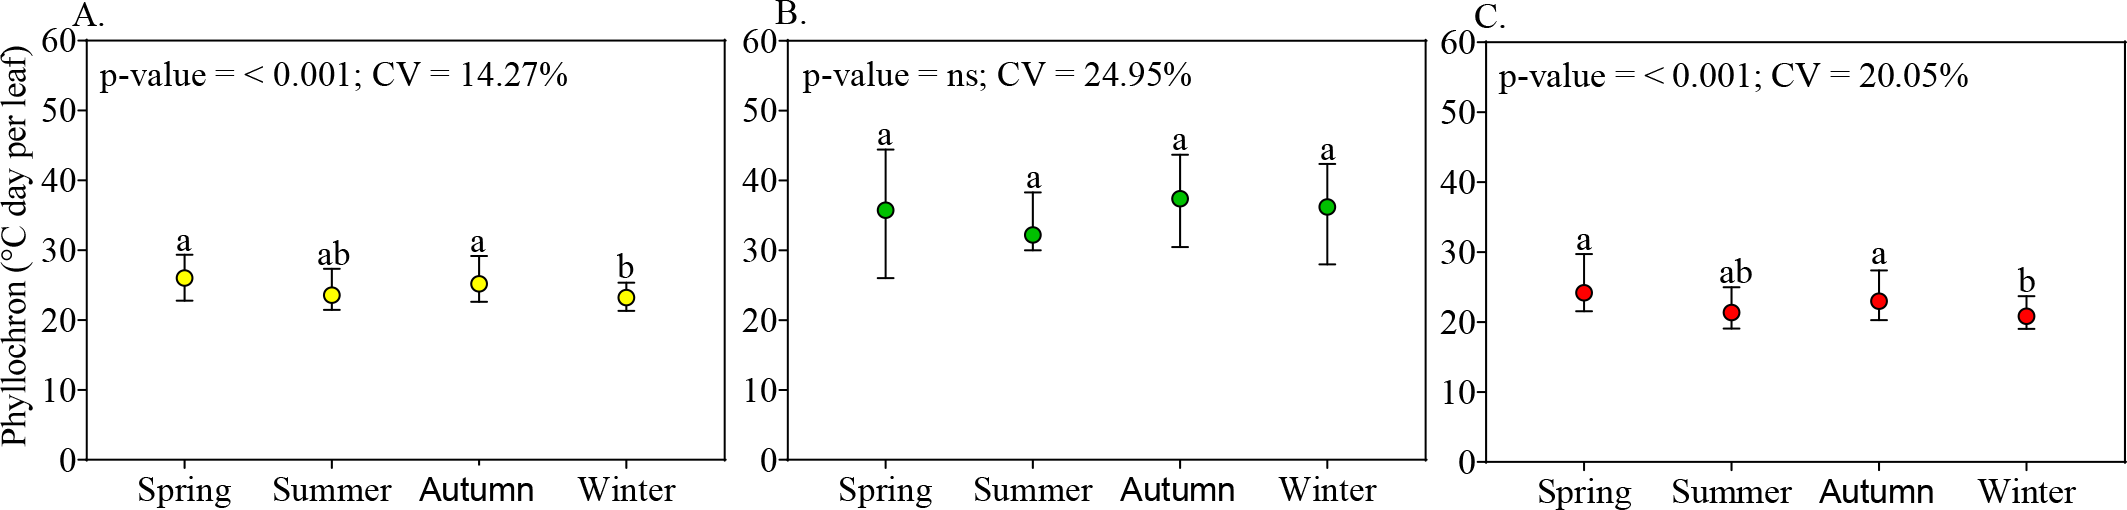
Seasonal effects were observed for the single (Figure 5A) and late (Figure 5C) phyllochron phases. According to Dunn’s test, phyllochron values for crops sown in autumn and spring differed from those sown in winter. The single phyllochron ranged from 23.22 °C day per leaf in winter to 26.09 °C day per leaf in spring, while the late phyllochron ranged from 20.82 °C day per leaf in winter to 24.41 °C day per leaf in spring. No significant seasonal differences were observed for the early phyllochron (Figure 5B), with values ranging from 32.21 °C day per leaf in summer to 37.39 °C day per leaf in autumn.
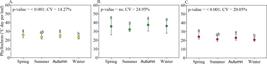
Median phyllochron and interquartile range for cut sunflower across seasons (spring, summer, autumn, and winter) and phyllochron phases (A: single; B: early; and C: late), based on field trials conducted in Brazil (2020-2023) and Italy (2023)
The lower phyllochron values observed in winter compared with spring can be explained by the criteria used to assign trials to seasons. In Brazilian trials, although sowing began in winter, transplanting often occurred late in the season, allowing part of the crop cycle to develop under spring conditions with higher temperatures. Similarly, late-summer sowing extended into autumn. This is reflected in the wide temperature ranges reported in Table 2. Additionally, locations such as Petrolina, Teresina, Canhotinho, and Dourados were grouped according to planting date, despite lacking well-defined seasonal variation, unlike subtropical regions in southern Brazil. This may have contributed to the observed seasonal patterns. These results indicate that crop development is more strongly driven by actual thermal conditions during the growing period than by calendar-based seasonal classification. Therefore, phenological analyses and agronomic recommendations should prioritize accumulated thermal time over season.
No significant differences among genotypes were detected for early phyllochron (Figure 6B) (Kruskal-Wallis test, p = 0.2872), with values ranging from 27.2 °C day per leaf for FA-04 to 40.30 °C day per leaf for MP-06. By contrast, significant differences were observed for the single (p = 0.0002) and late (p = 0.0181) phyllochron phase. The lowest single phyllochron value was observed for genotype VT-11 (21.40 °C day per leaf), which differed from SO-06 (25.15 °C day per leaf) and VC-12 (24.30 °C day per leaf), respectively (Figure 6A). However, Dunn’s post hoc test with Bonferroni adjustment showed no significant pairwise differences among genotypes for late phyllochron (Figure 6C).
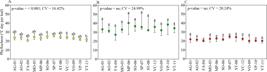
Median phyllochron and interquartile range for cut sunflower across genotypes and phyllochron phases (A: single; B: early; and C: late), based on field trials conducted in Brazil (2020-2023) and Italy (2023)
Genotypic differences in the single phyllochron have also been reported by Valentim et al. (2025) in southwestern Mato Grosso state, Brazil. The variation observed in the present study may be associated with greater variability during the early phyllochron (Figure 6B), as indicated by the wider interquartile range compared with the other phases. This suggests that the early phase is more sensitive to environmental conditions. Although no significant genotypic differences were detected for early and late phyllochron, all genotypes exhibited a faster leaf appearance rate during the late phase, reflected by lower phyllochron values. This acceleration likely contributes to increased leaf number and leaf area index before flowering, enhancing solar radiation interception and influencing physiological processes and yield components (Rosa et al., 2011). However, the relationship between the vegetative-to-reproductive phase transition and phyllochron remains unclear and warrants further investigation.
To evaluate the effect of planting method, direct sowing and transplanting were compared. Previous studies have shown that transplanting can accelerate sunflower development by up to 16 days relative to direct sowing (Ahmad et al., 2020). In the present study, residuals met the assumptions of normality (Shapiro-Wilk, p = 0.1974) and homogeneity of variances (Levene’s test, p = 0.4735). Analysis of variance (ANOVA) indicated significant effects of planting method, genotype, and phyllochron phase. Transplanting resulted in a higher phyllochron value (29.15 °C day per leaf) compared with direct sowing (27.38 °C day per leaf) (Table 3).
Means of phyllochron (°C day per leaf) for planting method and for the interaction between genotype and phyllochron phase (PHYLsingle: V1-Vn; PHYLearly: V1-V6; PHYLlate: V7-Vn) across six cut sunflower genotypes in a trial conducted in Santa Maria, RS, Brazil (2020)
No significant interactions were observed for planting method × genotype × phyllochron phase (p = 0.9179) or for the two-way interactions involving planting methods (p > 0.70). Conversely, the interaction between genotype and phyllochron phases was significant (p = 0.0005), indicating differential responses among genotypes across developmental phases.
Phyllochron differed among developmental phases, with PHYLearly consistently showing the highest values (Table 3). While PHYLsingle did not vary significantly among genotypes (23.78-25.93 °C day per leaf), both PHYLearly and PHYLlate exhibited genotypic variation. Genotype ‘AG-01’ showed the highest early phyllochron (41.76 °C day per leaf), whereas ‘SO-06’ had the highest late phyllochron (23.91 °C day per leaf). Conversely, genotype VO-09 recorded the lowest values in both phases (34.34 and 19.36°C days per leaf, respectively), indicating a shorter developmental cycle associated with lower ATT requirement.
Genotypes ‘AG-01’, ‘MO-03’, and ‘VO-09’ differed significantly between PHYLsingle and PHYLlate and, for ‘AO-02’, ‘SO-06’, and ‘VT-11’, these values were not significantly different according to Tukey’s test. These results suggest that the planting method did not significantly influence leaf appearance dynamics, thereby rejecting the initial hypothesis. Both direct sowing and transplanting ensured adequate crop establishment without affecting early plant development. This is critical because, during these initial stages, the first pair of true leaves develops from the plumule inside the seed and is highly sensitive to temperature (optimal range 15-35 °C) and water availability (Sghaier et al., 2023).
In wheat (Triticum aestivum L.), seed reserves accelerate the appearance rate of the first two leaves, and subsequent leaves appear more slowly, since each leaf tip must traverse a greater distance through the elongating whorl before emergence (Streck et al., 2003). In sunflower, early development is strongly influenced by seed reserves, which support germination and early seedling development until the cotyledons and first leaves expand and photosynthetic activity increases (Erbaş et al., 2016). Up to the V6 stage, leaves emerge in opposite pairs with limited internode elongation, beginning only when the first pair of true leaves is approximately 2 to 3 cm long (Garrison, 1973). As leaf expansion progresses, subtle internode elongation occurs to facilitate the emergence of the next pair. From V7 onward, leaf arrangement becomes alternate and stem elongation accelerates, following a sigmoidal growth pattern (Seiler, 1997). As the crop approaches the R1 stage (bud appearance), internode elongation increases rapidly, peaking near the R4 stage, when the final leaf number is reached.
The transition in leaf phyllotaxis (from opposite pairs to alternate single leaves) at V6 and V7 has been hypothesized to underlie changes in phyllochron in sunflower (Sadras & Villalobos, 1993). Phyllochron variation may also be associated with stem elongation; i.e. ontogeny, represented by the combined effects of phyllotaxy shifts and stem elongation, explains the breakpoint and the differences observed between phyllochron phases in cut sunflower. Garrison (1973) concluded that orderly shoot growth patterns reflect a close relationship between leaf and stem development in sunflower. In maize (Zea mays L.) and winter wheat (Triticum aestivum L.), changes in phyllochron occur around the transition from vegetative to reproductive phase, indicating a link between the breakpoint and reproductive organ development (Santos et al., 2022; Xu et al., 2023). This study provides a deeper investigation into leaf development dynamics in cut sunflower genotypes. A key novelty is that phenological scales for sunflower, such as Schneiter & Miller (1981) and the BBCH scale (Meier, 2018), may be overly simplistic and do not adequately describe the role of stem elongation in the growth and development of cut sunflower genotypes, nor do they capture the nuanced relationship with leaf and bud appearance dynamics.
Furthermore, this study refines the range of phyllochron values for modern cut sunflower genotypes, improving the parameterization of leaf appearance models. The bilinear relationship between leaf number and thermal time highlights changes in leaf appearance rate (LAR), particularly the increase in leaf appearance from V7 onward. Several sunflower simulation models already incorporate bilinear functions to estimate leaf appearance using the phyllochron approach (Villalobos et al., 1996; Casadebaig et al., 2011). These models use thermal time to relate development to temperature, providing a more robust descriptor than calendar time. However, plant development is not strictly linear with temperature. From a physiological perspective, developmental rates follow a non-linear response governed by cardinal temperatures and influenced by environmental factors such as temperature and photoperiod (Xue et al., 2004; Setiyono et al., 2007).
Therefore, non-linear approaches may better represent leaf appearance dynamics in cut sunflower, as previously demonstrated for wheat (Triticum aestivum L.) (Paff et al., 2023). Incorporating a chronological response function that accounts for the breakpoint in leaf appearance into process-based models may improve predictive accuracy. This approach would provide a more realistic and biologically meaningful prediction of leaf appearance, as proposed for wheat by Streck et al. (2003). Ultimately, integrating ecophysiological processes into crop models for cut sunflower genotypes can improve management recommendations and support decision-making across different production environments (Pasquel et al., 2022; Cardoso et al., 2025).
CONCLUSIONS
-
1. A breakpoint between the V6 and V7 stages was identified in cut sunflower genotypes, confirming a bilinear relationship between accumulated leaf number and thermal time. Two consistent phyllochron phases were observed: an early phase (34.87 °C days per leaf) and a late phase (21.82 °C days per leaf).
-
2. Phyllochron varied with genotype, location, and growing season, indicating both genetic and environmental control on leaf appearance rate, whereas planting method had no significant effect.
-
3. These results provide a physiological basis for incorporating a bilinear chronological response function into process-based models to improve the prediction of leaf appearance in cut sunflower.
-
1
Research conducted in Brazil and Italy
-
Funding statement:
This study was supported by the Coordenação de Aperfeiçoamento de Pessoal de Nível Superior (CAPES), which provided a doctoral scholarship, and by Conselho Nacional de Desenvolvimento Científico e Tecnológico (CNPq) through Process 200233/2022-2 for the Sandwich Doctorate Program in Italy.
-
Ref. 299732
Acknowledgments:
The authors would like to thank to the Brazilian Partner Institutes and the Research Centre for Vegetable and Ornamental Crops (CREA-OF) - Pescia/Italy for their collaborative supporting data collection.
Data Availability Statement:
The authors declare that no supplementary data underlie this study.
LITERATURE CITED
-
Ahmad, S. et al. Evaluation of different production systems in combination with foliar sulphur application for sunflower (Helianthus annuus L.) under arid climatic conditions of Pakistan. Sarhad Journal of Agriculture, v.36, p.1266-1278, 2020. http://dx.doi.org/10.17582/journal.sja/2020/36.4.1266.1278
» http://dx.doi.org/10.17582/journal.sja/2020/36.4.1266.1278 -
Aiken, R. M. Applying thermal time scales to sunflower development. Agronomy Journal, v.97, p.746-754, 2005. https://doi.org/10.2134/agronj2004.0181
» https://doi.org/10.2134/agronj2004.0181 -
Alvares, C. A. et al. Köppen’s climate classification map for Brazil. Meteorologische Zeitschrift, v.22, p.711-728, 2013. https://doi.org/10.1127/0941-2948/2013/0507
» https://doi.org/10.1127/0941-2948/2013/0507 -
Alves, L. Z. et al. Cut sunflower as an alternative income in the southern Agreste of Pernambuco. Ornamental Horticulture, v.31, e312818, 2025. https://doi.org/10.1590/2447-536X.v31.e312818
» https://doi.org/10.1590/2447-536X.v31.e312818 - Arnold, C. Y. Maximum-minimum temperatures as a basis for computing heat units. Journal of the American Society for Horticultural Sciences, v.76, p.682-692, 1960.
-
Baldotto, L. E. B.; Baldotto, M. A. Growth and production of ornamental sunflower grown in the field in response to application of humic acids. Ciência Rural, v.45, p.1000-1005, 2015. https://doi.org/10.1590/0103-8478cr20140050
» https://doi.org/10.1590/0103-8478cr20140050 -
Blasi, C. et al. Classification and mapping of the ecoregions of Italy. Plant Biosystems - An International Journal Dealing with All Aspects of Plant Biology, v.148, p.1255-1345, 2014. https://doi.org/10.1080/11263504.2014.985756
» https://doi.org/10.1080/11263504.2014.985756 -
Buffon, P. A. et al. A phenological scale of statice. Annals of Applied Biology, v.181, p.275-287, 2022. https://doi.org/10.1111/aab.12765
» https://doi.org/10.1111/aab.12765 -
Cardoso, P. D. S. et al. Assessing the WE Streck model for predicting leaf emergence in spring wheat. Revista Brasileira de Engenharia Agrícola e Ambiental, v.29, p.1 10, 2025. https://doi.org/10.1590/1807-1929/agriambi.v29n7e288168
» https://doi.org/10.1590/1807-1929/agriambi.v29n7e288168 -
Casadebaig, P. et al. SUNFLO, a model to simulate genotype-specific performance of the sunflower crop in contrasting environments. Agricultural and Forest Meteorology, v.151, p.163-178, 2011. https://doi.org/10.1016/j.agrformet.2010.09.012
» https://doi.org/10.1016/j.agrformet.2010.09.012 - Castro, C. de; Farias, J. R. B. Ecofisiologia do girassol. In: Leite, R.M.V.B. de C. et al. (ed). Girassol no Brasil. Londrina: Embrapa Soja, 2005. Cap.9. p.163-218.
-
Clerget, B. et al. Variability of phyllochron, plastochron and rate of increase in height in photoperiod-sensitive sorghum varieties. Annals of Botany, v.101, p.579-594, 2008. https://doi.org/10.1093/aob/mcm327
» https://doi.org/10.1093/aob/mcm327 -
Delatorre, C. A. et al. Oat development in response to temperature. Ciência Rural, v.52, e20210198, 2022. https://doi.org/10.1590/0103-8478cr20210198
» https://doi.org/10.1590/0103-8478cr20210198 - Erbaş, S. et al. Mobilization of seeds reserves during germination and early seedling growth of two sunflower cultivars. Journal of Applied Botany and Food Quality, v.89, p.217-222, 2016.
-
Fernandes, M. et al. Determining the phyllochron and the final leaf pair number in on-farm cut dahlia cultivars. Ornamental Horticulture, v.29, p.299-312, 2023. https://doi.org/10.1590/2447-536X.v29i2.2650
» https://doi.org/10.1590/2447-536X.v29i2.2650 -
Garrison, R. The growth and development of internodes in Helianthus. Botanical Gazette, v.134, p.246-255, 1973. http://www.jstor.org/stable/2473686
» http://www.jstor.org/stable/2473686 -
Gilmore Jr., E. C.; Rogers, J. S. Heat units as a method of measuring maturity in corn. Agronomy Journal, v.50, p.611-615, 1958. https://doi.org/10.2134/agronj1958.00021962005000100014x
» https://doi.org/10.2134/agronj1958.00021962005000100014x -
Höhn, D. et al. Base temperature estimates for lisianthus cultivars grown in different planting seasons. Pesquisa Agropecuária Brasileira, v.58, e03447, 2023. https://doi.org/10.1590/S1678-3921.pab2023.v58.03447
» https://doi.org/10.1590/S1678-3921.pab2023.v58.03447 -
Kutschera, U.; Briggs, W. R. Phototropic solar tracking in sunflower plants: an integrative perspective. Annals of Botany, v.117, p.1-8, 2016. https://doi.org/10.1093/aob/mcv141
» https://doi.org/10.1093/aob/mcv141 -
Mehmood, M. et al. Effect of high temperature stress on pollen grains in sunflower (Helianthus annuus L.) inbred lines. Brazilian Archives of Biology and Technology, v.66, e23220927, 2023. https://doi.org/10.1590/1678-4324-2023220927
» https://doi.org/10.1590/1678-4324-2023220927 -
Meier, U. Growth stages of mono - and dicotyledonous plants: Open Agrar Repositorium, Quedlinburg: Julius Kühn-Institut (JKI), 2018. 204p. BBCH Monograph. https://doi.org/10.5073/20180906-074619
» https://doi.org/10.5073/20180906-074619 -
Ongaratto, F. et al. Canopy structure and morphogenesis of Italian ryegrass intercropped with red clover under cutting intervals determined by thermal sum. Ciência Rural, v.50, e20190989, 2020. https://doi.org/10.1590/0103-8478cr20190989
» https://doi.org/10.1590/0103-8478cr20190989 -
Paff, K. et al. A comparison of wheat leaf-appearance rate submodules for DSSAT CROPSIM-CERES (CSCER). Ecological Modelling, v.482, e110406, 2023. https://doi.org/10.1016/j.ecolmodel.2023.110406
» https://doi.org/10.1016/j.ecolmodel.2023.110406 -
Pasquel, D. et al. A review of methods to evaluate crop model performance at multiple and changing spatial scales. Precision Agriculture, v.23, p.1489-1513, 2022. https://doi.org/10.1007/s11119-022-09885-4
» https://doi.org/10.1007/s11119-022-09885-4 -
Plancade, S. et al. A successive time-to-event model of phyllochron dynamics for hypothesis testing: Application to the analysis of genetic and environmental effects in maize. Plant Methods, v.19, e24477, 2023. https://doi.org/10.1186/s13007-023-01029-7
» https://doi.org/10.1186/s13007-023-01029-7 -
Porta, F. D. et al. Improving understanding of the plastochron of determinate and indeterminate soybean cultivars. Revista Brasileira de Engenharia Agrícola e Ambiental, v.28, e278299, 2024. https://doi.org/10.1590/1807-1929/agriambi.v28n10e278299
» https://doi.org/10.1590/1807-1929/agriambi.v28n10e278299 -
Puttha, R. et al. Exploring the potential of sunflowers: Agronomy, applications, and opportunities within bio-circular-green economy. Horticulturae, v.9, 1079, 2023. https://doi.org/10.3390/horticulturae9101079
» https://doi.org/10.3390/horticulturae9101079 -
R Core Team Development. R: A language and environment for statistical computing. 2019. Available on: https://www.r-project.org/ Accessed on: Feb. 2024.
» https://www.r-project.org/ -
Rosa, H. T. et al. Base temperature for leaf appearance and phyllochron of selected strawberry cultivars in a subtropical environment. Bragantia, v.70, p.939-945, 2011. https://doi.org/10.1590/S0006-87052011000400029
» https://doi.org/10.1590/S0006-87052011000400029 -
Rosa, H. T. et al. Métodos de soma térmica e datas de semeadura na determinação de filocrono de cultivares de trigo. Pesquisa Agropecuária Brasileira, v.44, p.1374-1382, 2009. https://doi.org/10.1590/S0100-204X2009001100002
» https://doi.org/10.1590/S0100-204X2009001100002 -
Sadras, V. O.; Villalobos, F. J. Floral initiation, leaf initiation and leaf appearance in sunflower. Field Crops Research, v.33, p.449-457, 1993. https://doi.org/10.1016/0378-4290(93)90165-J
» https://doi.org/10.1016/0378-4290(93)90165-J -
Santos, C. L. dos. et al. Maize leaf appearance rates: A synthesis from the United States corn belt. Frontiers in Plant Science, v.13, 872738, 2022. https://doi.org/10.3389/fpls.2022.872738
» https://doi.org/10.3389/fpls.2022.872738 -
Schneiter, A. A.; Miller, J. F. Description of sunflower growth stages. Crop Science, v.21, p.901-903, 1981. https://doi.org/10.2135/cropsci1981.0011183X002100060024x
» https://doi.org/10.2135/cropsci1981.0011183X002100060024x -
Seiler, G. J. Anatomy and morphology of sunflower. In: Schneiter, A. A. (ed.). Sunflower technology and production. Madison: Soil Science Society of America, 1997. Cap.3, p.67-111. Agronomy Monograph No. 35. https://doi.org/10.2134/agronmonogr35.c3
» https://doi.org/10.2134/agronmonogr35.c3 -
Setiyono, T. D. et al. Understanding and modeling the effect of temperature and daylength on soybean phenology under high-yield conditions. Field Crops Research, v.100, p.257-271, 2007. https://doi.org/10.1016/j.fcr.2006.07.011
» https://doi.org/10.1016/j.fcr.2006.07.011 -
Sghaier, A. H. etal. Germinationand seedling developmentresponses of sunflower (Helianthus annuus L.) seeds to temperature and different levels of water availability. Agriculture, v.13, 608, 2023. https://doi.org/10.3390/agriculture13030608
» https://doi.org/10.3390/agriculture13030608 -
Shatoori, M. M. et al. Correlation between vase life and biochemical parameters in ornamental sunflower (Helianthus annuus L.) affected by spraying chemical materials during the growth stages. Journal of Plant Growth Regulation, v.40, p.179-186, 2021. https://doi.org/10.1007/s00344-020-10088-2
» https://doi.org/10.1007/s00344-020-10088-2 -
Simon, M. L. et al. Quantifying the effect of soil water deficit on transpiration, growth, development, and quality of cut sunflower. Ornamental Horticulture, v.31, e312920, 2025. https://doi.org/10.1590/2447-536X.v31.e312920
» https://doi.org/10.1590/2447-536X.v31.e312920 -
Silva, G. I. N. et al. Combined agricultural practices in millet and cactus: phyllochron, structural characteristics and relations with yield. Scientia Agricola, v.80, e20220046, 2023. http://doi.org/10.1590/1678-992X-2022-0046
» http://doi.org/10.1590/1678-992X-2022-0046 -
Streck, N. A. et al. Base temperature for leaf appearance and phyllochron of the BRS Missões maize variety. Ciência Rural, v.39, p.224-227, 2009. https://doi.org/10.1590/S0103-84782009000100035
» https://doi.org/10.1590/S0103-84782009000100035 -
Streck, N. A. et al. Incorporating a chronology response into the prediction of leaf appearance rate in winter wheat. Annals of Botany, v.92, p.181-190, 2003. https://doi.org/10.1093/aob/mcg121
» https://doi.org/10.1093/aob/mcg121 -
Streck, N. A. et al. Leaf development and growth of selected sugarcane clones in a subtropical environment. Pesquisa Agropecuária Brasileira, v.45, p.1049-1057, 2010. https://doi.org/10.1590/S0100-204X2010001000001
» https://doi.org/10.1590/S0100-204X2010001000001 -
Streck, N. A. et al. Simulating leaf appearance in rice. Agronomy Journal, v.100, p.490-501, 2008. https://doi.org/10.2134/agronj2007.0156
» https://doi.org/10.2134/agronj2007.0156 -
Tenorio, F. M. et al. Co-ordination between primordium formation and leaf appearance in soybean (Glycine max) as influenced by temperature. Field Crops Research, v.210, p.197-206, 2017. https://doi.org/10.1016/j.fcr.2017.03.015
» https://doi.org/10.1016/j.fcr.2017.03.015 -
Tomasi, T. C. et al. Plant density and location: Optimization of growth and quality of cut sunflower in tropical and subtropical environments. Plants, v.13, 2810, 2024. https://doi.org/10.3390/plants13192810
» https://doi.org/10.3390/plants13192810 -
Tomiozzo, R. et al. Development, growth, and flower production of cut sunflower under tropical, subtropical, and temperate environments. Horticulture, Environment and Biotechnology, v.66, p.1203-1222, 2025. https://doi.org/10.1007/s13580-025-00714-x
» https://doi.org/10.1007/s13580-025-00714-x - Tomiozzo, R. et al. Girassol de corte: inovação e sustentabilidade na floricultura moderna. vol.1. Santa Maria: Editora GR, 2024. 320p.
-
Valentim, S. M. S. et al. Thermal sum and phyllochron of cut sunflower genotypes in southwestern Mato Grosso, Brazil. Ciência e Agrotecnologia, v.49, e017024, 2025. https://doi.org/10.1590/1413-7054202549017024
» https://doi.org/10.1590/1413-7054202549017024 -
Villalobos, F. J.; Ritchie, J. T. The effect of temperature on leaf emergence rates of sunflower genotypes. Field Crops Research, v.29, p.37-46, 1992. https://doi.org/10.1016/0378-4290(92)90074-J
» https://doi.org/10.1016/0378-4290(92)90074-J -
Villalobos, F. J. et al. OILCROP-SUN: A development, growth, and yield model of the sunflower crop a development, growth, and yield model of the sunflower crop. Agronomy Journal, v.88, p.403-415, 1996. https://doi.org/10.2134/agronj1996.00021962008800030008x
» https://doi.org/10.2134/agronj1996.00021962008800030008x -
Wilhelm, W. W.; McMaster, G. S. Importance of the phyllochron in studying development and growth in grasses. Crop Science, v.35, p.1-3, 1995. https://doi.org/10.2135/cropsci1995.0011183X003500010001x
» https://doi.org/10.2135/cropsci1995.0011183X003500010001x -
Xu, H. et al. Quantitative analysis of maize leaf collar appearance rates. Plant Physiology and Biochemistry, v.196, p.454-462, 2023. https://doi.org/10.1016/j.plaphy.2023.01.016
» https://doi.org/10.1016/j.plaphy.2023.01.016 -
Xue, Q. et al. Predicting leaf appearance in field-grown winter wheat: evaluating linear and non-linear models. Ecological modelling, v.175, p.261-270, 2004. https://doi.org/10.1016/j.ecolmodel.2003.10.018
» https://doi.org/10.1016/j.ecolmodel.2003.10.018
Edited by
-
Editors:
Antônio Gustavo de Luna Souto & Hans Raj Gheyi

 ns - Not significant; * - Significant at p ≤ 0.05. Figures A and B illustrate the single phyllochron (yellow circle), whereas figures C and D illustrate the early (green circle) and late (red circle) phyllochron phases
 Solid lines inside the boxes represent medians, and different lowercase letters indicate significant differences according to Dunn’s post hoc test at 5% probability. p-values and coefficients of variation (CV = %) are shown in the figure
 Different lowercase letters within each panel indicate significant differences according to Dunn’s post hoc test at 5% probability. p-values and coefficients of variation (CV, %) are presented in the figure for each phyllochron phase. Abbreviations: Boa Vista do Sul (BVS), Bozano (BZN), Brunópolis (BNP), Canhotinho (CNT), Dourados (DRD), Herval D’Oeste (HDO), Júlio de Castilhos (JC), Novo Xingú (NX), Pescia (PSC), Petrolina (PTR), Rio do Sul (RDS), Santa Maria (SM), Teresina (TSN), and Vacaria (VCR)
 Different lowercase letters within each panel indicate significant differences according to Dunn’s post hoc test at 5% probability. p-values and coefficients of variation (CV, %) are presented for each phyllochron phase
 Different lowercase letters within each panel indicate significant differences according to Dunn’s post hoc test at 5% probability. p-values and coefficients of variation (CV, %) are presented for each phyllochron phase