 Design of solar greenhouse environmental monitoring and control on the basis of multinode data fusion
ABSTRACT
Greenhouse environmental regulation can create an optimal environment for the growth of greenhouse crops and effectively improve their production conditions. This study aimed to develop an intelligent monitoring and control system for solar greenhouses on the basis of multisensor data fusion by integrating long range (LoRa) and WiFi communication technologies to increase the accuracy and reliability of environmental regulation. A median filtering algorithm and an adaptive weighted average data fusion algorithm were designed to improve the reliability of the data involved in the control system. A segmented control strategy was adopted to achieve automatic control of the solar greenhouse environment. Tests on data transmission and communication, analysis of the data fusion effect, and greenhouse temperature control tes ts based on the segmented control strategy were carried out for this system. The results showed that the success rate of data transmission of the system reached 99.8% and that the execution accuracy of the actuators was over 99%. Under the traditional single-node control strategy, the temperature was within the suitable range 41.96% of the time. Compared with the traditional single-node control strategy, the segmented control strategy based on data fusion maintained the temperature within the suitable range for 13.28% longer.
Key words:
solar greenhouse; internet of things; LoRa; cloud platform; data fusion algorithm
HIGHLIGHTS:
Multiple node sensors collected data via a dual protocol (LoRa-WiFi) with 99.8% data transfer success rate.
Adaptive weighted data fusion reduced the temperature and humidity errors to ± 0.21 °C and ± 3.55%, respectively.
The adaptive multinode fusion control strategy extended the time within the optimal temperature range by 13.28%.
RESUMO
A regulação ambiental das estufas pode criar um ambiente ótimo para o crescimento das culturas em estufa e melhorar eficazmente as condições de produção das culturas. Este estudo teve como objetivo desenvolver um sistema inteligente de monitorização e controlo para estufas solares baseado na fusão de dados multi-sensor, integrando as tecnologias de comunicação long range (LoRa) e WiFi, para melhorar a precisão e a fiabilidade da regulação ambiental. Foi concebido um algoritmo de fusão de dados de filtragem mediana e de média ponderada adaptativa para melhorar a fiabilidade dos dados envolvidos no sistema de controlo. A estratégia de controle segmentado é adoptada para realizar o controle automático do ambiente da estufa solar. Foram efetuados testes de transmissão e comunicação de dados, análise do efeito da fusão de dados e testes de controle da temperatura da estufa com base na estratégia de controle segmentado para este sistema. Verificou-se que a taxa de sucesso da transmissão de dados do sistema atinge 99,8% e a precisão de execução dos actuadores é superior a 99%. Com a estratégia tradicional de controle de nó único, a temperatura está dentro do intervalo adequado em 41,96% do tempo. Em comparação com a estratégia de controle tradicional de nó único, a gama de temperaturas adequada da estratégia de controle segmentada baseada na fusão de dados aumentou 13,28%.
Palavras-chave:
estufa solar; internet das coisas; LoRa; plataforma na nuvem; algoritmo de fusão de dados
Introduction
Solar greenhouses have been developed rapidly as crop cultivation facilities in northern China because of their low construction and operating costs and have become the mainstay of protected agriculture in China (Tan et al., 2024; Cheng et al., 2024). In 2022, the area of greenhouses in China was approximately 1.862 million hectares, and the investment scale reached 10.0708 billion dollars. Currently, China ranks first in the world in terms of greenhouse area (Guo et al., 2024). Therefore, the development of protected agriculture is an important symbol of agricultural modernization and an important construction task for the development of modern agriculture. Greenhouse environmental monitoring and control systems based on the Internet of Things technological framework, which are efficient modern agricultural production facilities with informatization, have realized basic parameter collection and basic control. Smart agriculture relies mostly on large amounts of effective data, such as environmental data, crop growth data, and other data (Shaikh et al., 2022). Hence, data collection is crucial in the field of smart agriculture (Moshou et al., 2014; Felisberto et al., 2014; Sousa et al., 2023). Therefore, the use of wireless communication networks for multisensor data fusion in smart greenhouse environmental monitoring and control is necessary.
To improve the accuracy and reliability of solar greenhouse control systems, researchers have combined multiple technologies to construct greenhouse environmental monitoring systems. ZigBee communication technology (Sujono et al., 2024), general packet radio service (GPRS) communication technology (Zhang et al., 2023), WiFi communication technology (Patil et al., 2022), etc., have been widely used in solar greenhouses, but they have disadvantages such as short communication distances, high costs, and high power consumption. Long range (LoRa) has strong anti-interference ability and high receiving sensitivity and meets low power consumption requirements (Luo et al., 2023; Huang et al., 2024). It is widely used in solar greenhouses. Sung et al. (2022) designed a greenhouse environmental measurement and monitoring system through Bluetooth wireless communication with LoRa, which consists of an Arduino LoRa extension board, temperature and humidity sensors, and CO2 sensors. The results show that the environmental data from the sensors can be output to the serial screen of the Arduino, the screen of a smartphone, and the user interface of Node Red through the system sensor nodes. Ruipeng et al. (2024) proposed a data fusion algorithm for the optimal tracking of nodes in agricultural wireless sensor networks. The dynamic time warping (DTW) algorithm was introduced into the fuzzy association algorithm, and a data fusion model based on the improved fuzzy association algorithm was constructed. The algorithm can better eliminate the influence of abnormal data from faulty sensors on the fusion results and obtain a fusion value that truly reflects the condition of the agricultural environment, thus reducing the production cost of redundant monitoring equipment and guaranteeing the quality of information in the wireless sensor network (WSN). However, the aforementioned studies focused primarily on data acquisition and fusion and neglected the integration of adaptive control strategies based on multisensor data. This gap limits the ability of their approaches to dynamically regulate greenhouse environments with high reliability.
To address the limitations of incomplete data and unreliable control strategies in existing solar greenhouse systems, this study proposes a solar greenhouse environmental monitoring and control system based on multisensor data fusion. The system integrates LoRa and WiFi communication technologies to enable stable data transmission, employs a median filtering algorithm and an adaptive weighted average fusion algorithm to increase data reliability, and adopts a segmented control strategy for precise environmental regulation. Thus, this study aimed to develop an intelligent monitoring and control system for solar greenhouses on the basis of multisensor data fusion by integrating LoRa and WiFi communication technologies to increase the accuracy and reliability of environmental regulation.
Material and Methods
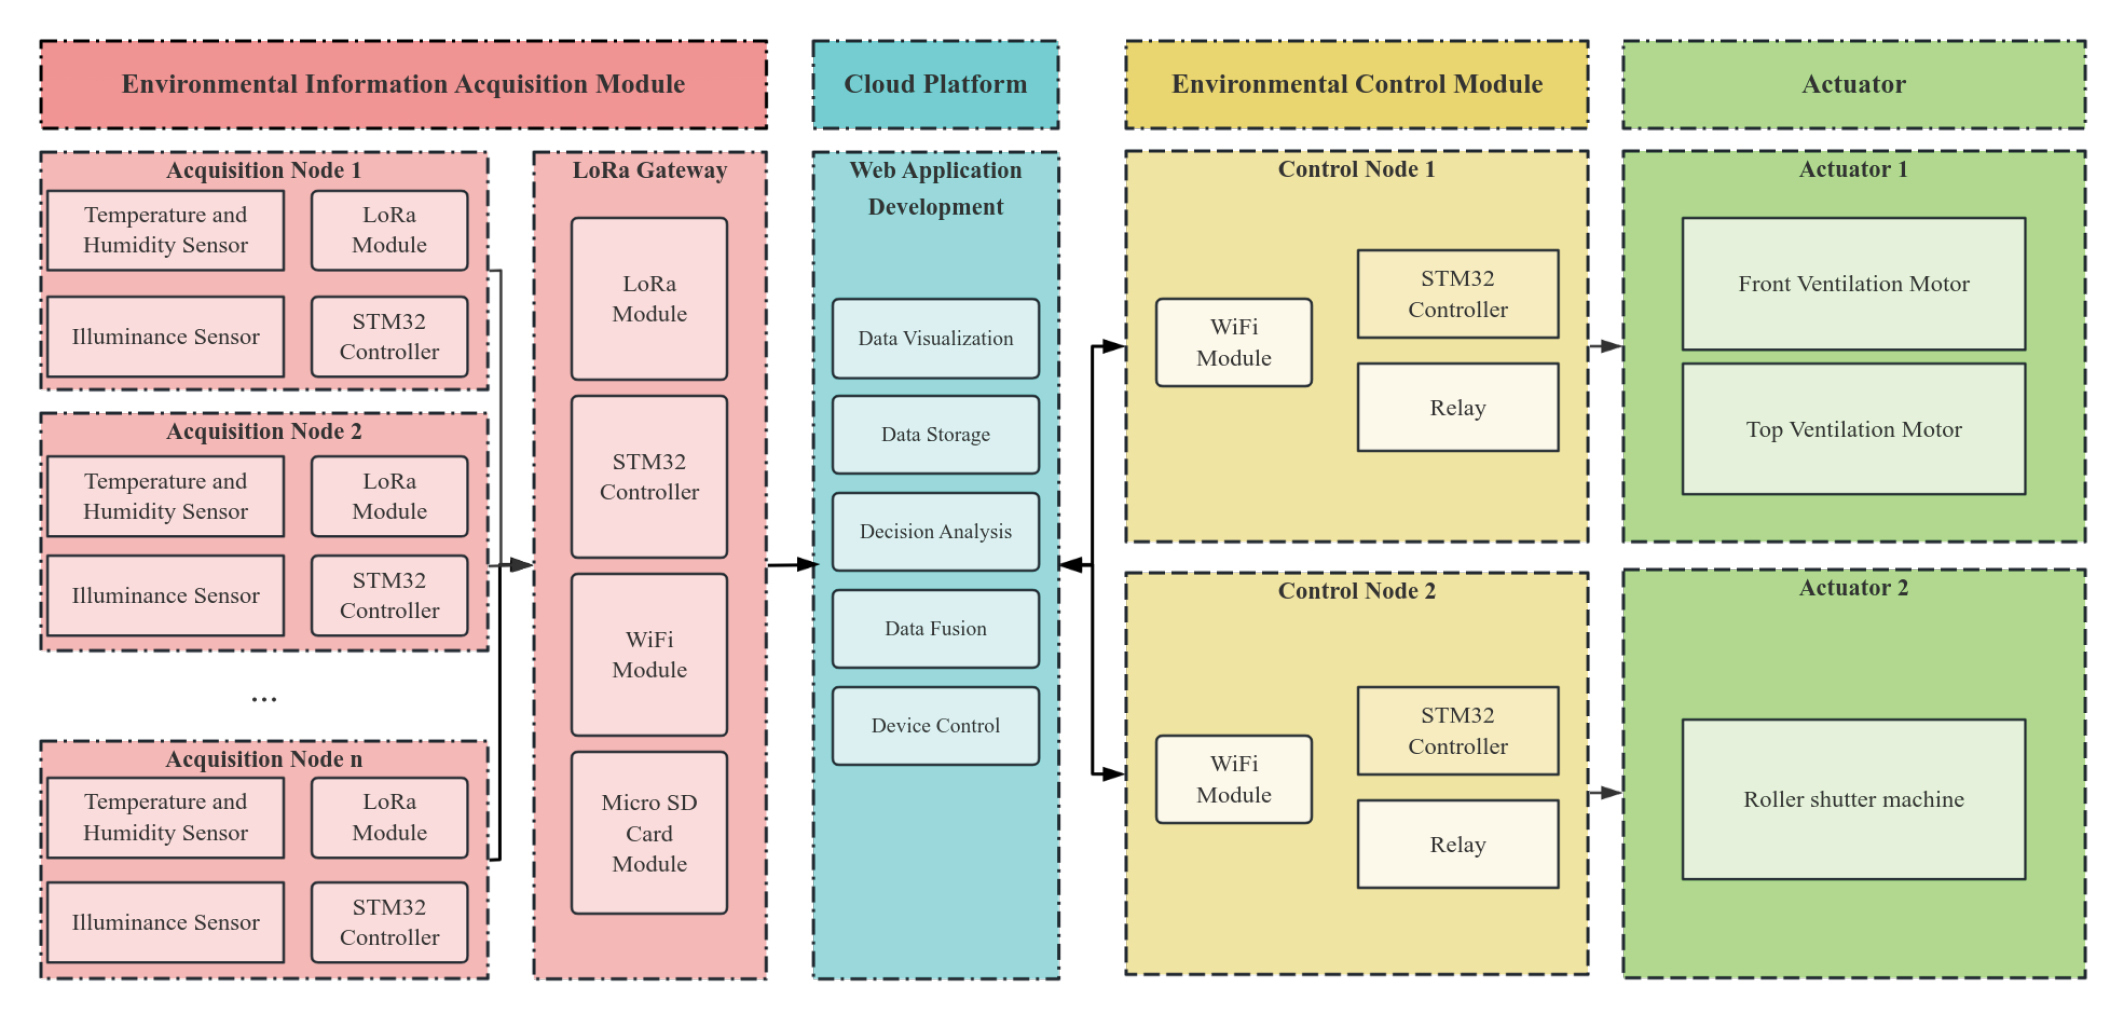
The system consists of four parts: an environmental information collection module, an environmental control module, a cloud platform, and an actuator module. The overall framework is shown in Figure 1. The development of the system began in March 2024 and was completed in July 2024. The system was deployed and tested at the Sanping Teaching Practice Base in Toutunhe District, Urumqi city, Xinjiang, China (87°21’ E, 43° 56’ N, altitude 769.3 m). This location is characterized by a typical continental climate with significant diurnal temperature variations and provided an ideal environment for evaluating the system’s performance under real-world conditions. The environmental information collection module includes collection nodes and a LoRa gateway. The LoRa module is connected to a STM32 microcontroller (STMicroelectronics), which is a 32-bit ARM-based microcontroller that is widely used in embedded systems, through the TTL method, and the controller is connected to collection devices such as temperature and humidity sensors and illuminance sensors. The LoRa gateway sets the relevant parameters of the module, and the collection nodes and the LoRa gateway can form a communication network to realize data transmission through the LoRa and WiFi modules. The environmental control module includes control nodes 1 and 2. Each node takes the STM32 controller as the core and connects to the actuators through relays to control the actuators. Each actuator includes a front ventilation motor, a top ventilation motor, and a roller shutter machine, which adjust the environment according to instructions. The cloud platform realizes data visualization, data storage, data fusion, decision analysis, and device control functions via a developed web application.
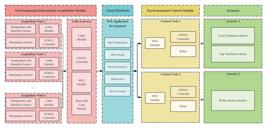
The mainstream terminal device communication modules were selected on the basis of Mathew et al. (2023) and Aldhaheri et al. (2024) and include the ATK-LORA-01 communication module of Zhengdian, Atom, with communication frequency bands that range from 410 to 441 MHz and communication distances that vary from 3 kilometers to 5 kilometers. The module is widely used in IoT (Internet of Things) applications because of its low power consumption, long-range communication capabilities, and cost-effectiveness.
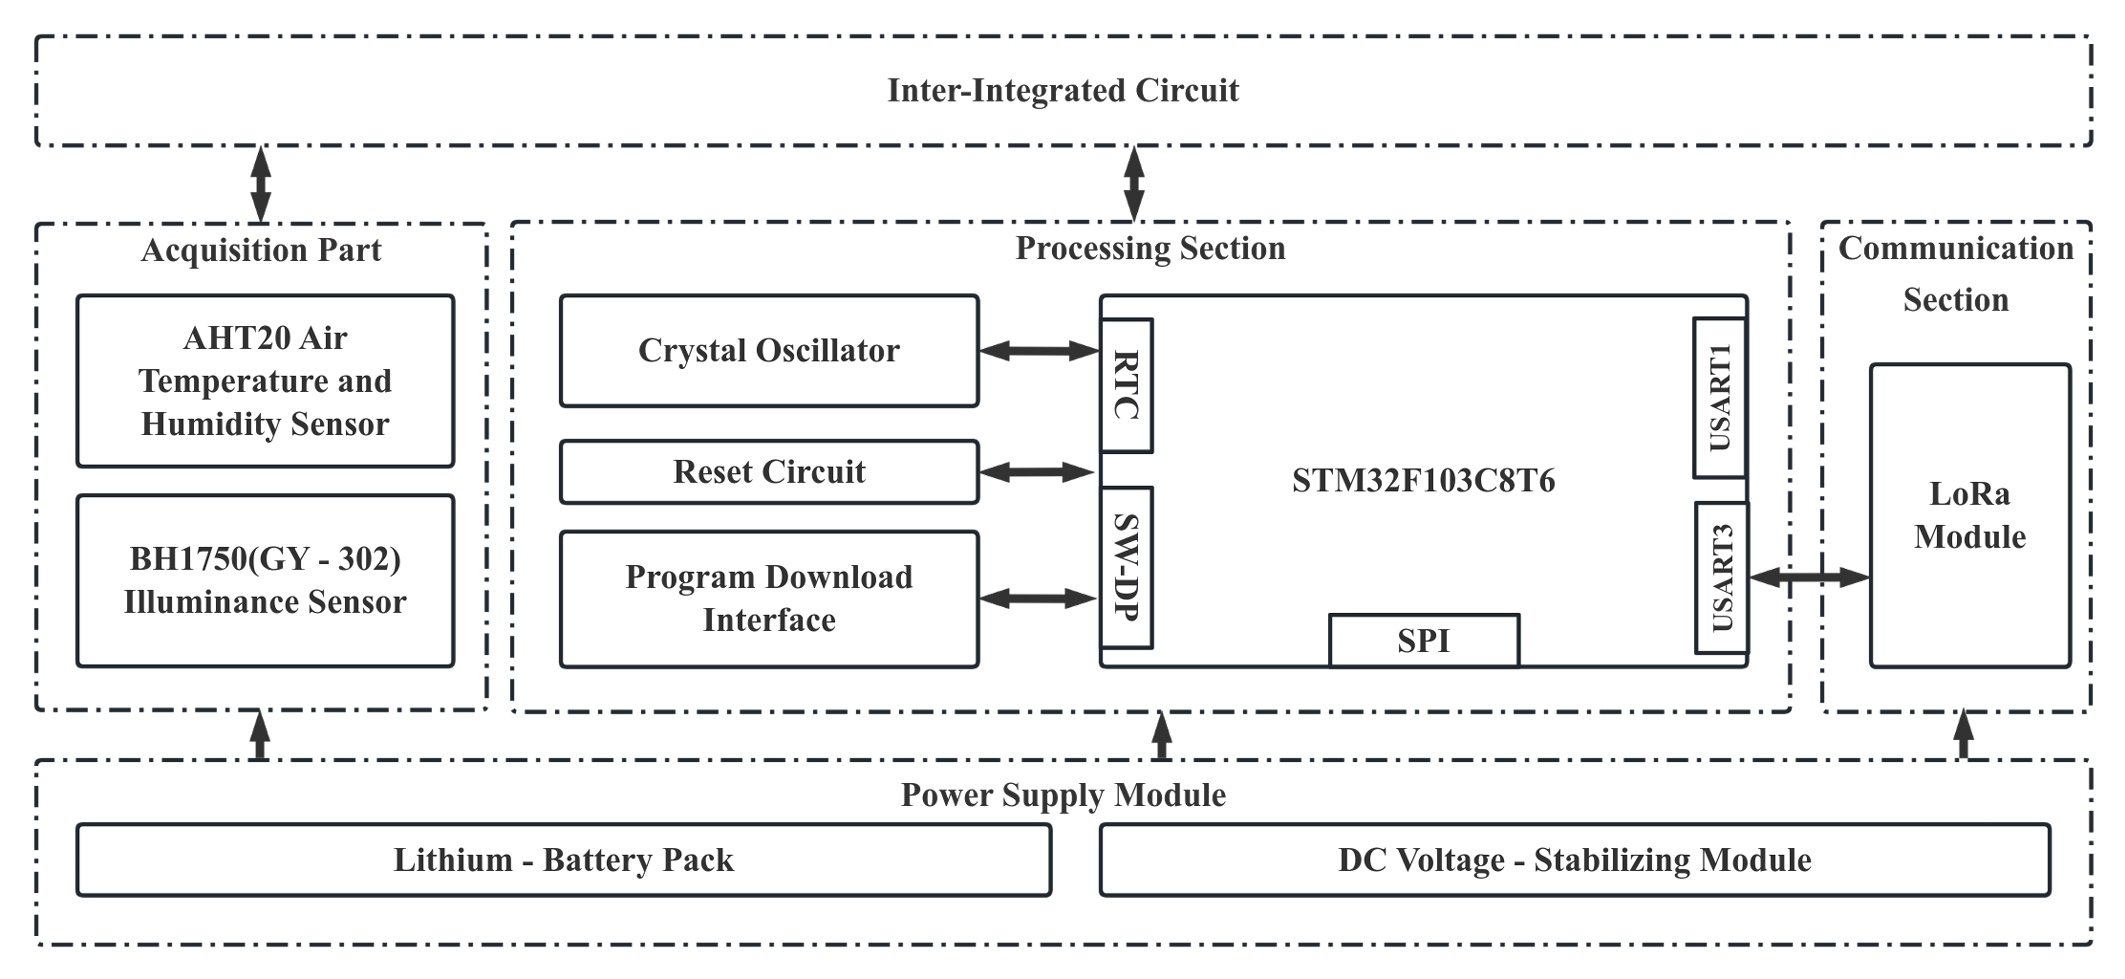
The environmental collection module includes collection nodes and a LoRa gateway. The collection nodes of the system consist of environmental factor sensors and communication modules and are responsible mainly for regularly collecting environmental parameters in the solar greenhouse. The environmental factor sensors use an AHT20 high-precision I2C air temperature and humidity sensor and a BH1750 (GY-302) illuminance sensor to collect the temperature, humidity, and illumination in the greenhouse. The AHT20 air temperature and humidity sensor has a relatively low cost. By using this sensor, the cost can be effectively controlled while ensuring the basic temperature and humidity measurement functions. The BH1750 (GY-302) sensor can cover various light conditions from weak to strong light in the solar greenhouse, has a working voltage of 3.3 V, is small in size, has a low power consumption and cost, has simple and convenient communication and occupies fewer hardware resources. The key indicators of the environmental parameters are shown in Table 1.
Considering that the wiring of the wired power supply line in a solar greenhouse is relatively complex, a 7.4 V, 12000 mAh lithium battery pack is used to provide all the working power for the nodes. A hardware block diagram of an environmental monitoring node is shown in Figure 2.
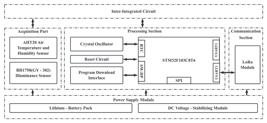
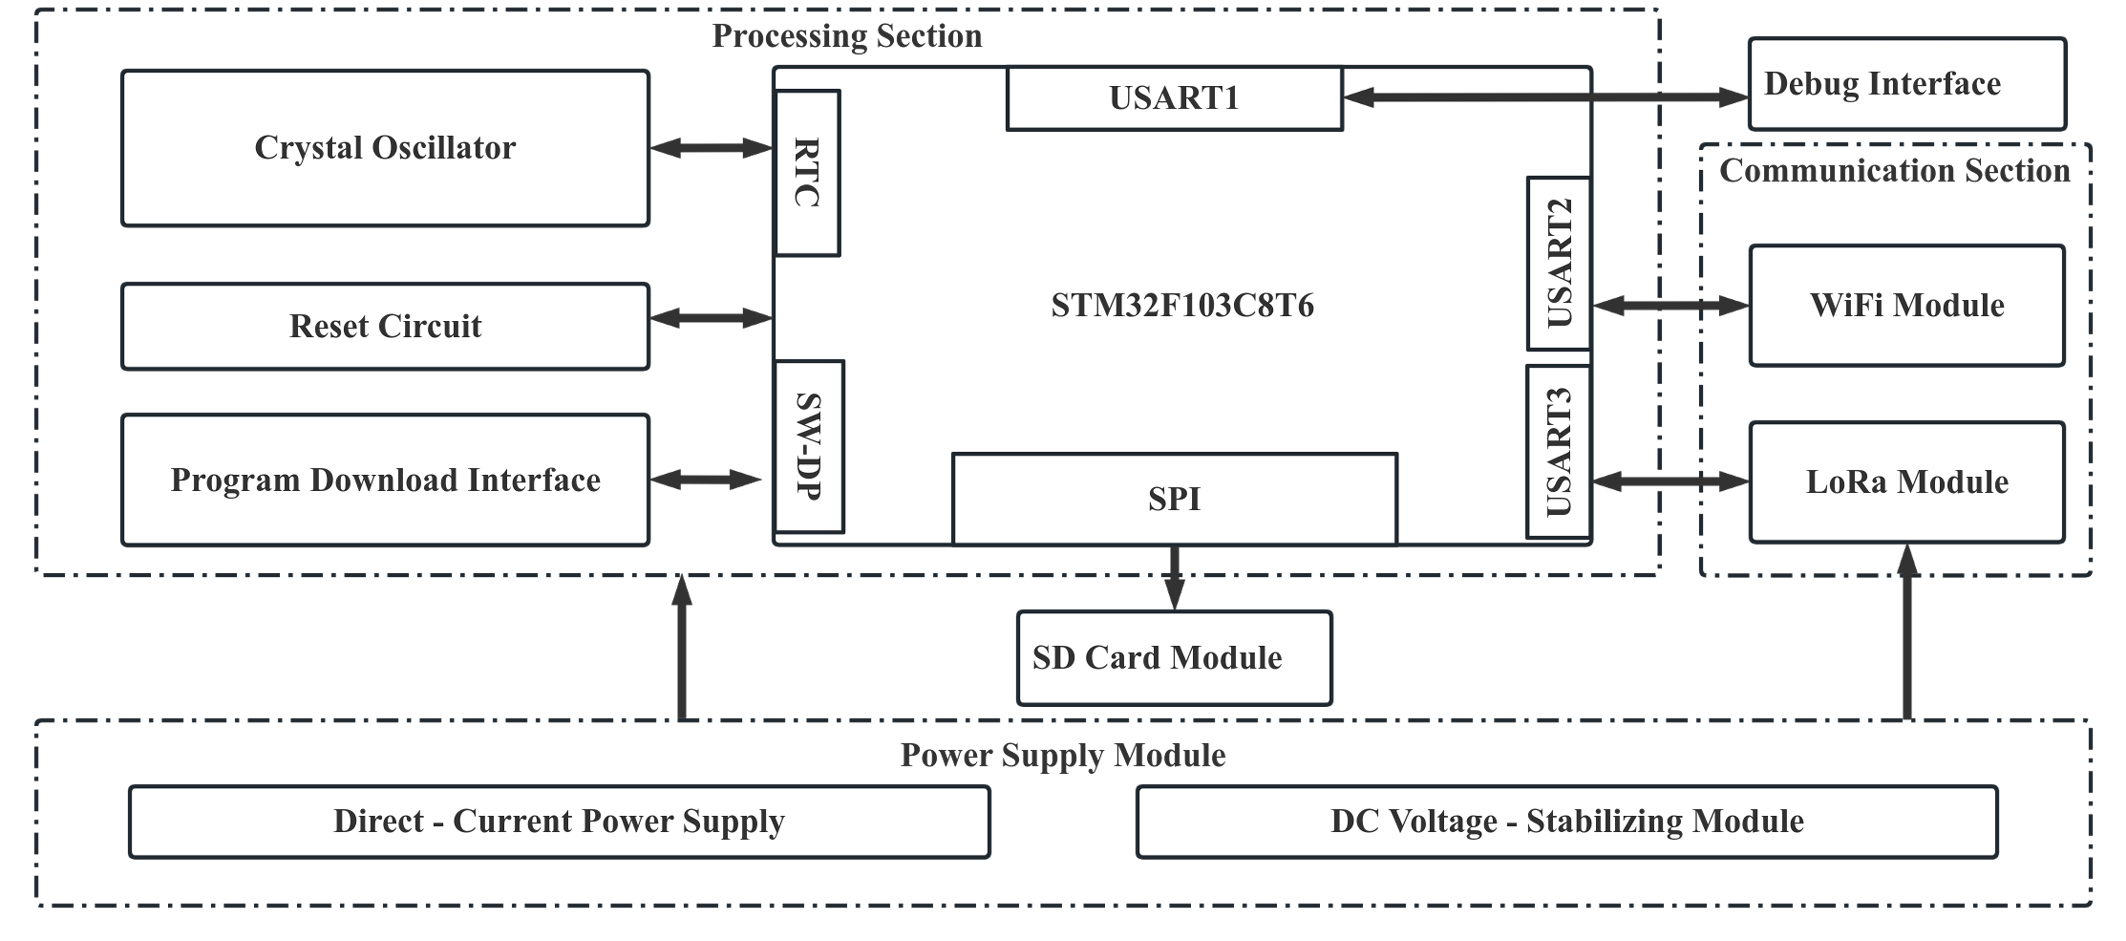
The LoRa gateway acts as a coordinator in the LoRa network. The gateway assigns appropriate working parameters to the collection devices to enable them to access the LoRa network smoothly. When receiving data sent by multiple LoRa terminal devices simultaneously, the gateway performs preliminary processing on the data, verifies the integrity of the data, and then forwards the data to the cloud platform. The gateway adopts a modular design scheme in which different functional parts are divided into multiple independently operable modules. Each module has a clear function and interface and has the significant advantages of flexible assembly and easy upgrade and maintenance. The gateway is responsible mainly for the four key tasks of data sending, receiving, parsing, and storage. When the networking is successful, the gateway can parse the identification information and environmental parameter information of the collection devices from the received data and upload the data. An SD card is connected to the STM32 controller through the SPI method to realize the data storage function. The power supply part of the gateway bottom plate is set to voltages of 5 V and 3.3 V. The bottom plate is connected to the LoRa communication module and the WiFi radio frequency module to realize data aggregation and transceiver functions. Therefore, the gateway bottom plate, which is an important carrier of the entire gateway function, has an important position in the design. A hardware block diagram of the LoRa gateway is shown in Figure 3.
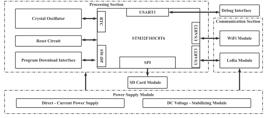
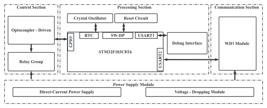
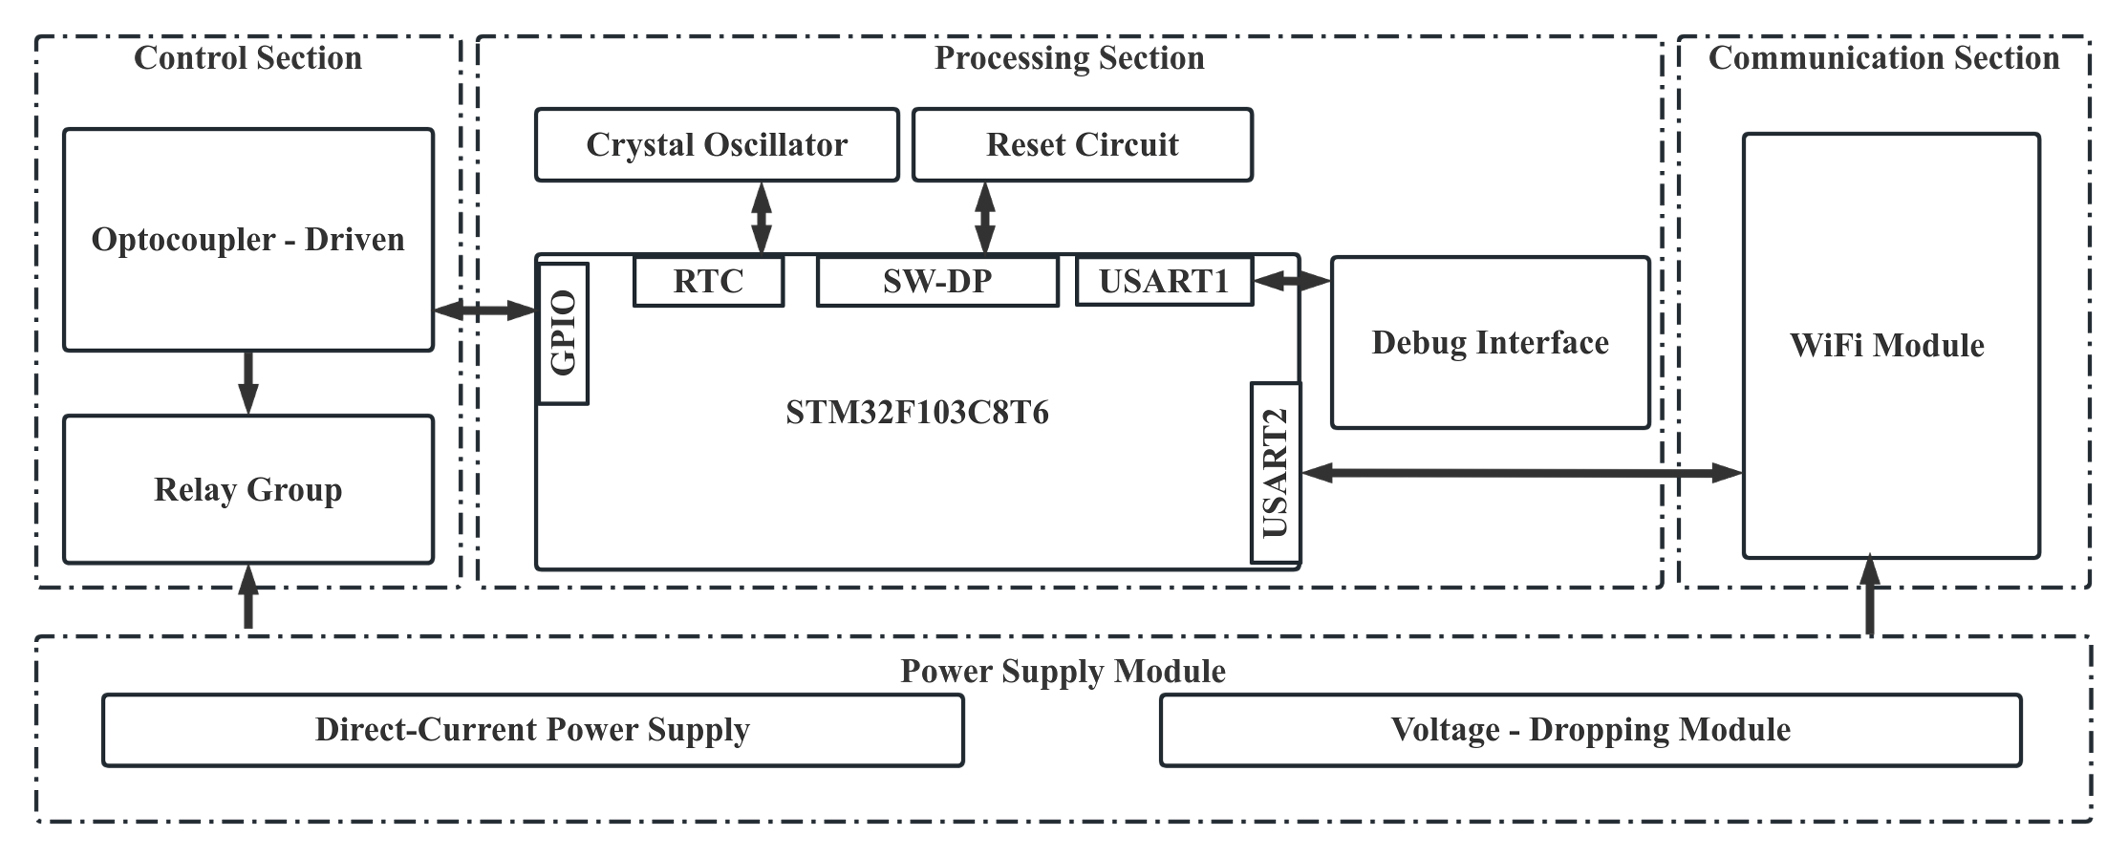
The environmental control devices are controlled indirectly by relays, and a Songle relay SRD-5VDC-SL-C (with an operating voltage of 5 V and a rated current of 10 A) is selected. The STM32 microcontroller is connected to the relays through the WiFi module, and the FL817C opto-coupled isolation chip is used to ensure signal stability. The power supply module contains a 5 V DC power supply and a step-down module that outputs 3.3 V to meet the needs of each module. The hardware framework of the environmental control module is shown in Figure 4.
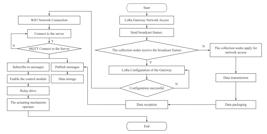
The embedded software of the system is required to realize the functions of data collection, data transmission and storage, and control instruction reception of the system hardware. After the system is networked, collection nodes receive instructions from the LoRa gateway to collect greenhouse environmental data periodically. Outside the collection period, the nodes enter a sleep state. The collected data are sent to the LoRa gateway, transferred to the cloud server via the WiFi module and saved to the SD card. A timer controls the collection cycle. The control module reports its status, parses instructions, operates relays to control actuators, and reports actuator states to the cloud. A flowchart of the embedded software is shown in Figure 5.
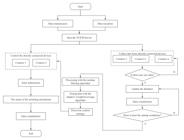
The cloud platform communicates with control and collection devices via the TCP/IP protocol. It collects data, issues instructions, and processes data by using the median filtering and adaptive weighted average algorithms. The segmented control strategy analyzes and decides on operations and then issues commands. It can also receive user control instructions through the web application or the front end of the mini-program and issue control commands to the actuators. A flowchart is shown in Figure 6.
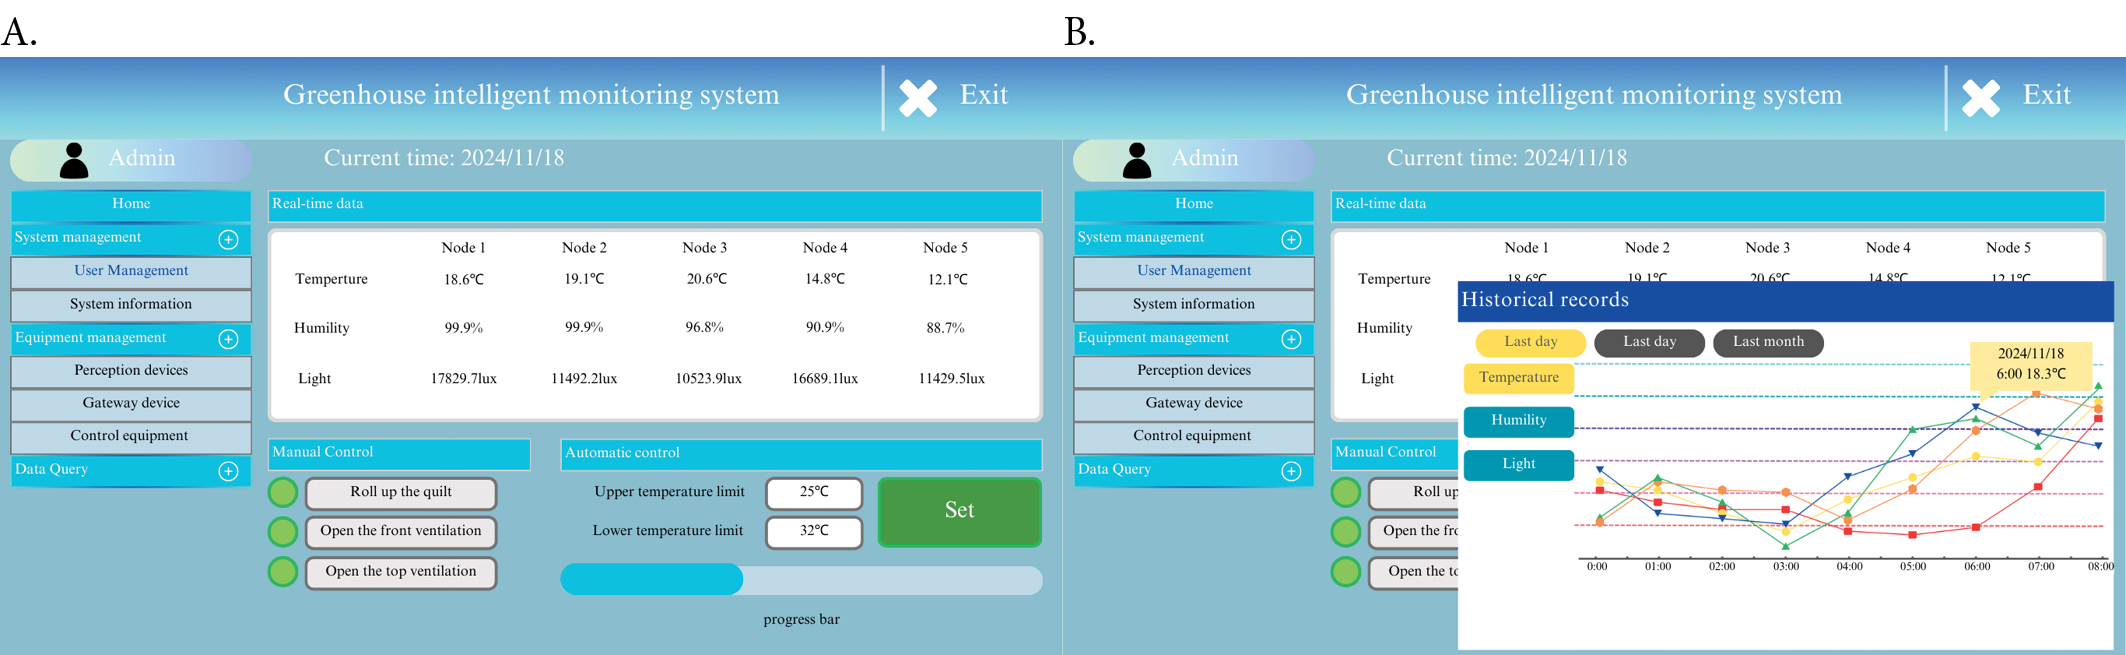
The web application software interface is shown in Figure 7. When the username and password are correctly entered, the corresponding management interface can be entered. The management interface is divided into a parameter display area, a message reception area, an instruction input area, and a working status display area. The seven buttons that correspond to the greenhouse actuators to be controlled are used to set the parameters of the control terminal, display the status information sent by the control terminal, and query historical data. The software can perform manual control, which is convenient for managing different working scenarios.
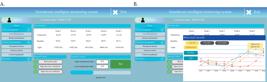
Interface of the web application software: (A) displays the management interface, and (B) displays the historical data interface
During the measurement process of multiple temperature, humidity and illuminance sensors, owing to the influence of various factors, the original collected data may contain noise, deviations, and uncertainty. The median filtering method can effectively filter out the fluctuation interference caused by accidental factors and the unstable performance of the front sampler; thus, it has an especially good filtering effect on the measured parameters that change slowly, such as temperature and humidity.
The air temperature data collected by multiple sensors in the system are processed by the median filtering algorithm. The time series of the temperature data collected by a single sensor is expressed in Eq. 1.
where:
t - number of temperature data collected by the sensor.
The node obtains the sensor data every 5 minutes and filters the data every 30 minutes. Therefore, t= 6. The window length c is set to 3. The 6 data points are sorted according to their numerical values. The sorted data are expressed in Eq. 2.
where:
x1 ’, x2 ’, …, x6 ’ - sorted temperature data sequence after median filtering.
The number that corresponds to the center point after sorting is taken as the filtering output. The window is shifted forward by one position, and the aforementioned steps are repeated until the entire signal has been processed. The median filtering formula is presented as Eq. 3.
where:
v - half of the window length c; and
I - index of the current data point in the sequence.
The processed data are expressed in Eq. (4).
where:
y1, y2, …, y6 - filtered temperature data sequence after median filtering.
After the sensor data are processed by the median filtering algorithm, the error is small, and the sensor data can be fused. According to the real-time performance of data processing, the data are automatically optimized and processed. The adaptive weighted average fusion algorithm is used to fuse the temperature data of the solar greenhouse. The adaptive weighted average fusion algorithm adaptively finds the corresponding weights according to the minimum mean square error algorithm, and the sum of the products of each measured value and the weight is the fusion value. The estimation model of the adaptive weighted average fusion algorithm is shown in Figure 8.
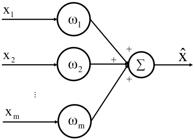
Adaptive weighted average fusion algorithm estimation model with variance-based dynamic weight assignment
The data processing results are denoted as y1, y2, …, y6, and the weights are denoted as ω1, ω2, …, ω6. The fusion value of the adaptive weighted average fusion algorithm is calculated via Eq. 5.
where:
ωp - weight of the p-th sensor; and,
Σp=1 m6 ωp = 1 - contraint that ensures that the weights sum to one.
The variances of the sensors are denoted as σ1 2, σ2 2, …, σ6 2. The sensors are placed at different positions in the greenhouse, thus the different sensors are considered to be independent of each other, and the sensor temperature data y1, y2, …, y6 are independent of each other. Therefore, the result of Eq. 6 for the expected value is 0.
where:
p - 1, 2, …, 6; and,
q - 1, 2, …, 6, p ≠ q.
The mean square error is given by Eq. 7.
where:
σ2 - total mean square error; and,
σp 2 - variance of the p-th sensor.
The weight that corresponds to the minimum mean square error is calculated via Eq. 8.
where:
σ2 - total mean square error; and,
m - total number of sensors (m = 6).
The data fusion result for multiple sensors can be obtained via substitution into Eq. 5.
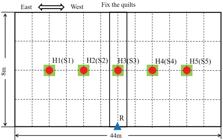
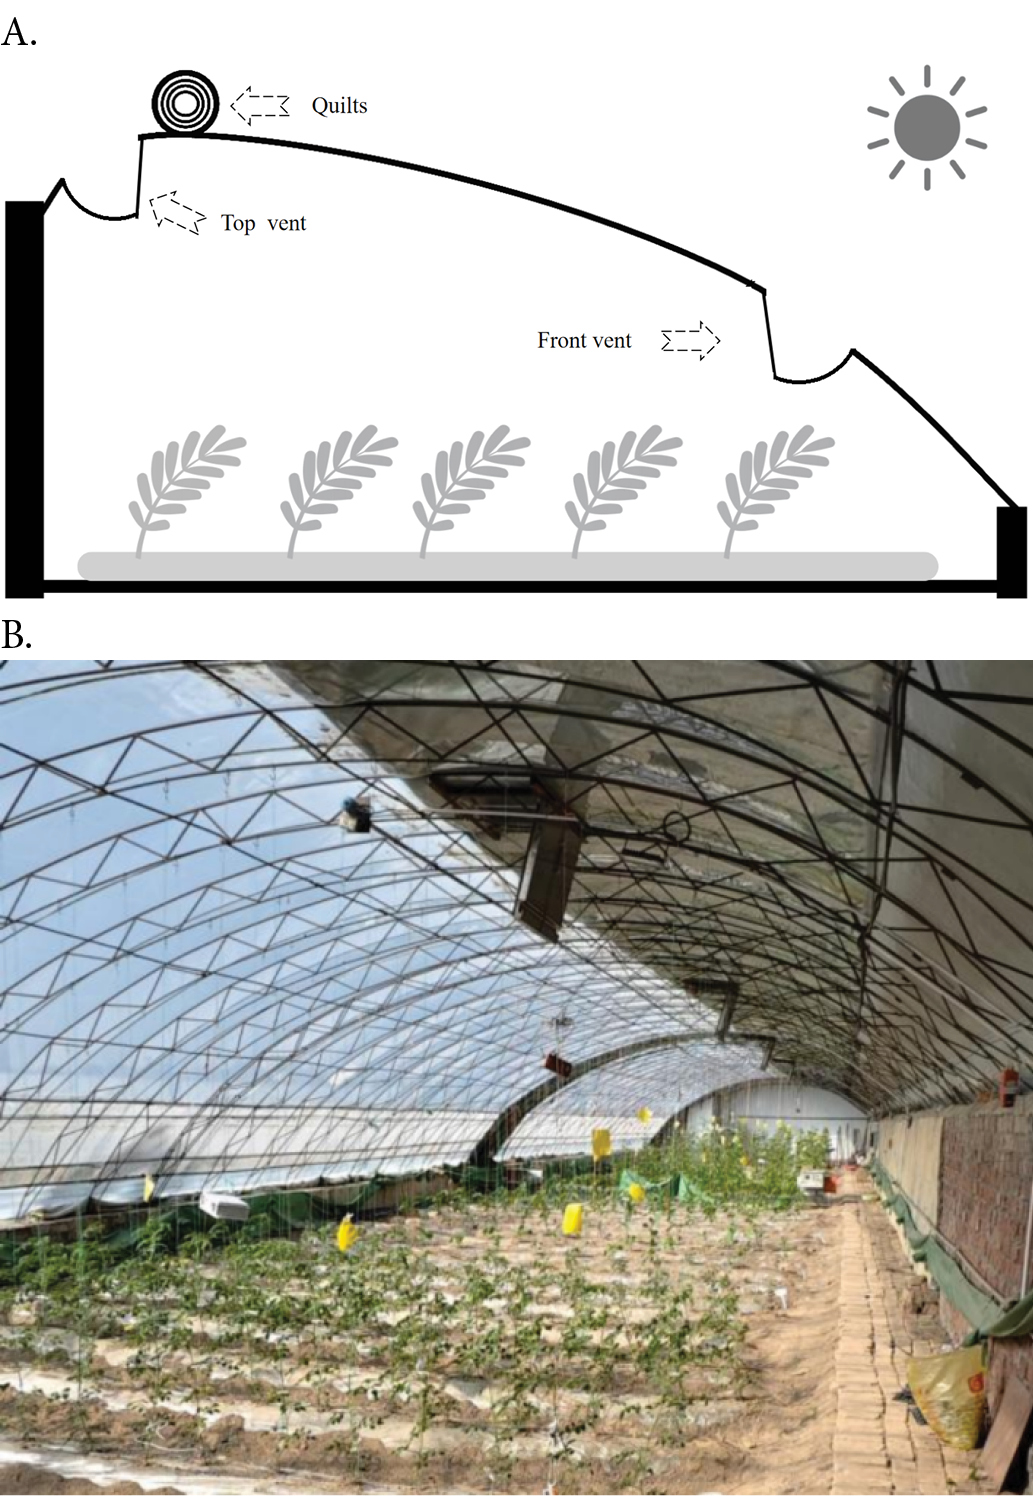
The solar greenhouse that was used in this study is located at the Sanping Teaching Practice Base in Toutunhe District, Urumqi city, Xinjiang (87° 21’ E, 43° 56’ N). The solar greenhouse is a single-story steel pipe structure without a rear slope, with a span of 8 m and a length of 44 m. The greenhouse is equipped with two types of actuators, namely, three-phase AC motors and DC motors, which are used to control the quilt and vents, respectively. The tomato planting area in the greenhouse is 333 m², and the planting spacing is 40 cm. During this study, the tomatoes were in the flowering and fruit setting stage, and the suitable temperature range for the greenhouse was 20-25 °C. The structure of the solar greenhouse is shown in Figure 9; more specifically, a structural diagram of the solar greenhouse is shown in Figure 9A, and the whole solar greenhouse is shown in Figure 9B.

To fully assess the reliability and effectiveness of the proposed system, four tests were conducted in September 2024: a data transmission and communication test, a sensor accuracy test, a data fusion effect test, and a greenhouse temperature control test based on segmented control strategies.
The data transmission and communication test was conducted from September 1 to 3, 2024, to ensure that the sensor monitoring locations could accurately capture the overall environmental information of the solar greenhouse, reduce temperature information errors, and improve the detection accuracy for greenhouse environmental parameters. The test was designed according to the methodologies proposed in agricultural IoT studies (Spachos et al., 2019) and included two environments: an open area and the solar greenhouse. Five Lora collection nodes simultaneously sent 1000 packets of size 128 bytes to the Lora gateway to test the data packet loss rates at different distances. During the test in the solar greenhouse, tomato plants were used as natural obstacles to simulate the actual signal fading environment. Packet loss rates were calculated on the basis of the ratio of received packets to total sent packets. The tool SSCOM V5.13.1 was used for packet capture. The packet loss rate is calculated by Eq. 9:
where:
P - packet loss rate;
Ns - total number of packets sent; and,
Nr - number of packets received.
To verify the accuracy of the sensor node data, a sensor accuracy test was conducted. At the east, middle, and west sides of the solar greenhouse and at a height of 1.2 m from the ground inside the greenhouse, five environmental collection nodes and five Vantage GSP-6 temperature and humidity recorders were placed to collect data synchronously at 5 min intervals from 0:00 to 23:55 on September 20, 2024. The deployment of the LoRa gateway, collection nodes, and temperature and humidity recorders is shown in Figure 10.
The maximum deviation of temperature and humidity is calculated as shown in Eq. 10.
where:
yi - sensor value; and,
yi - record value.
To evaluate the effectiveness of the filtering algorithm, the RMSE index was chosen in this study as a criterion for evaluating the noise reduction effect on the temperature data, and the RMSE calculation formula is shown in Eq. 11.
where:
n - number of data points;
yi - original data; and,
yi - denoised data.
Experiments on the effect of data fusion were carried out to assess the performance improvement of the adaptive weighted average fusion algorithm with respect to traditional methods. The data source was the temperature data of the five nodes after processing by the median filtering algorithm, and the processed data were fused using the adaptive weighted average data fusion algorithm. The fusion window size was set to 30 min. The data measured by the five sensors were divided into eight groups. The adaptive weighted average data fusion algorithm calculates the fusion value when the mean square error is the smallest. Therefore, the commonly used mean square error and root mean square error could not be used to analyze the results. Therefore, the MAE and MAPE were used to evaluate and compare the performance results of the adaptive weighted average fusion algorithm and the arithmetic average fusion algorithm after fusion.
The MAE is a measure of absolute deviation, and the MAPE is a measure of relative deviation. The smaller the value is, the better the fusion effect. The calculation formula for the MAE is presented as Eq. (12), and the calculation formula for the MAPE is presented as Eq. (13).
where:
yi - data processing result; and,
yi - fusion value.
To verify the effectiveness of the segmented control strategy in maintaining the optimal temperature range, two control modes were tested on September 19, 2024, and September 20, 2024: a single-node control mode and a multinode fusion control mode. Single-node control uses data from a central node to drive the actuators. Multinode fusion control controls the actuators on the basis of the fused data from the five nodes.
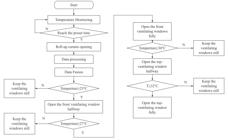
In the greenhouse temperature control experiment based on the segmented control strategy, the ventilation equipment of the solar greenhouse was a 24 V DC motor. The greenhouse opened and closed the vents according to the indoor temperature, and the opening range was determined by the running time of the motor. The DC motor was equipped with safety limit protection to prevent the rope from being too tight or too loose and to ensure the safety and reliability of the system. The ventilation of the solar greenhouse included top vents and front vents, which were controlled in segments according to different temperature thresholds. The control flowchart is shown in Figure 11. The roller shutter machine of the greenhouse was high-voltage equipment that was powered by 380 V AC. A three-phase AC solid-state relay was used to control the forward rotation, reverse rotation, and stopping of the roller shutter motor.
During the test, the temperature was recorded at 5-minute intervals, the percentage of time that the temperature was in the optimal range was calculated, and the matching rate between the actuator command and the actual state was recorded.
Results and Discussion
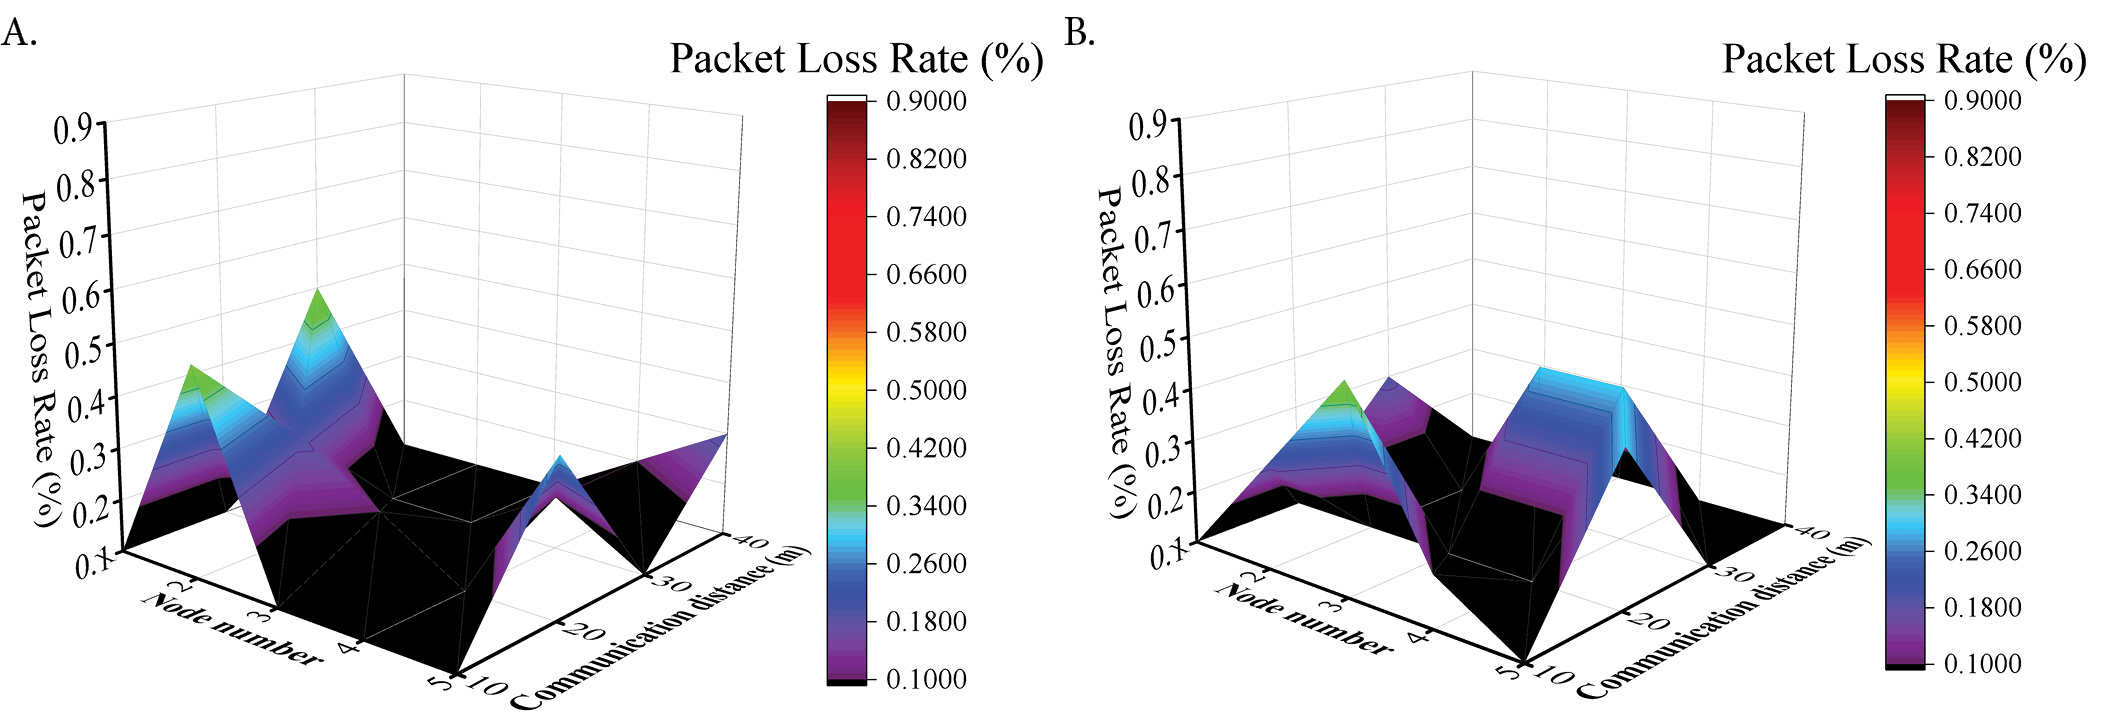
According to the communication test results shown in Figure 12A, the LoRa communication module had a very low packet loss rate in open areas, which ranged from 0 to 0.4%. This result proves the reliability of LoRa for long-distance transmission in unobstructed environments and is in line with the findings of Liu et al. (2023), who achieved a packet loss rate of less than 1% under similar conditions. In the solar greenhouse, when the distance was 20 m, the data transmission success rates of collection nodes 1-5 reached 100, 100, 100, 100, and 99.7%, respectively. When the distance reached 40 m, the success rates were 100, 100, 100, 99.8, and 100%, respectively, and the test results are shown in Figure 12B. The growth of crops had little impact on the communication environment, and the LoRa network could transmit data in the solar greenhouse.
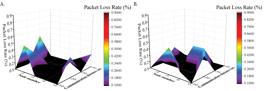
Communication packet loss rate as a function of node number and communication distance. (A) Open field test results and (B) in-house test results
To analyze the LoRa and WiFi dual-protocol communication network, the same nodes were selected. The distances between the nodes and the gateway were 10, 20, 30, and 40 m. When the LoRa network and the WiFi network were simultaneously enabled, 100 data packets were sent to the gateway, and the communication success rate of the gateway was analyzed. The statistics of the packet loss rate of the communication network are shown in Table 2.
As shown in Table 2, when LoRa and WiFi worked simultaneously, the average success rate of uploading the aggregated data packets reached 99.8%. Compared with existing LoRa-based monitoring systems, the system proposed in this paper demonstrates superior low packet loss performance in vegetation environments. For example, the system by Van Truong et al. (2021) relies on a full-duplex relay node with a fixed gateway layout and has a packet loss rate of 1% over a 4 km transmission distance. However, this design has stringent gateway location requirements and does not consider the shading effect of dense vegetation. In contrast, the system proposed in this paper has a packet loss rate of only 0.6% in a 40 m greenhouse environment, which is significantly better than those of similar systems. This advantage stems from the dual-protocol coordination mechanism: LoRa (sub-GHz band) realizes long-distance interference-resistant transmission through spread spectrum technology, whereas WiFi (2.4 GHz) focuses on high-frequency cloud interactions, and the division of labor between the two avoids frequency band congestion. Notably, Fibriani employed ZigBee and 3G/4G cellular networks in their greenhouse monitoring system, which suffered from a 2% packet loss rate, and the LoRa-WiFi hybrid architecture reduced the packet loss rate by 20%, thus providing a more scalable solution for agricultural IoT applications while achieving reliability (Fibriani et al., 2020).
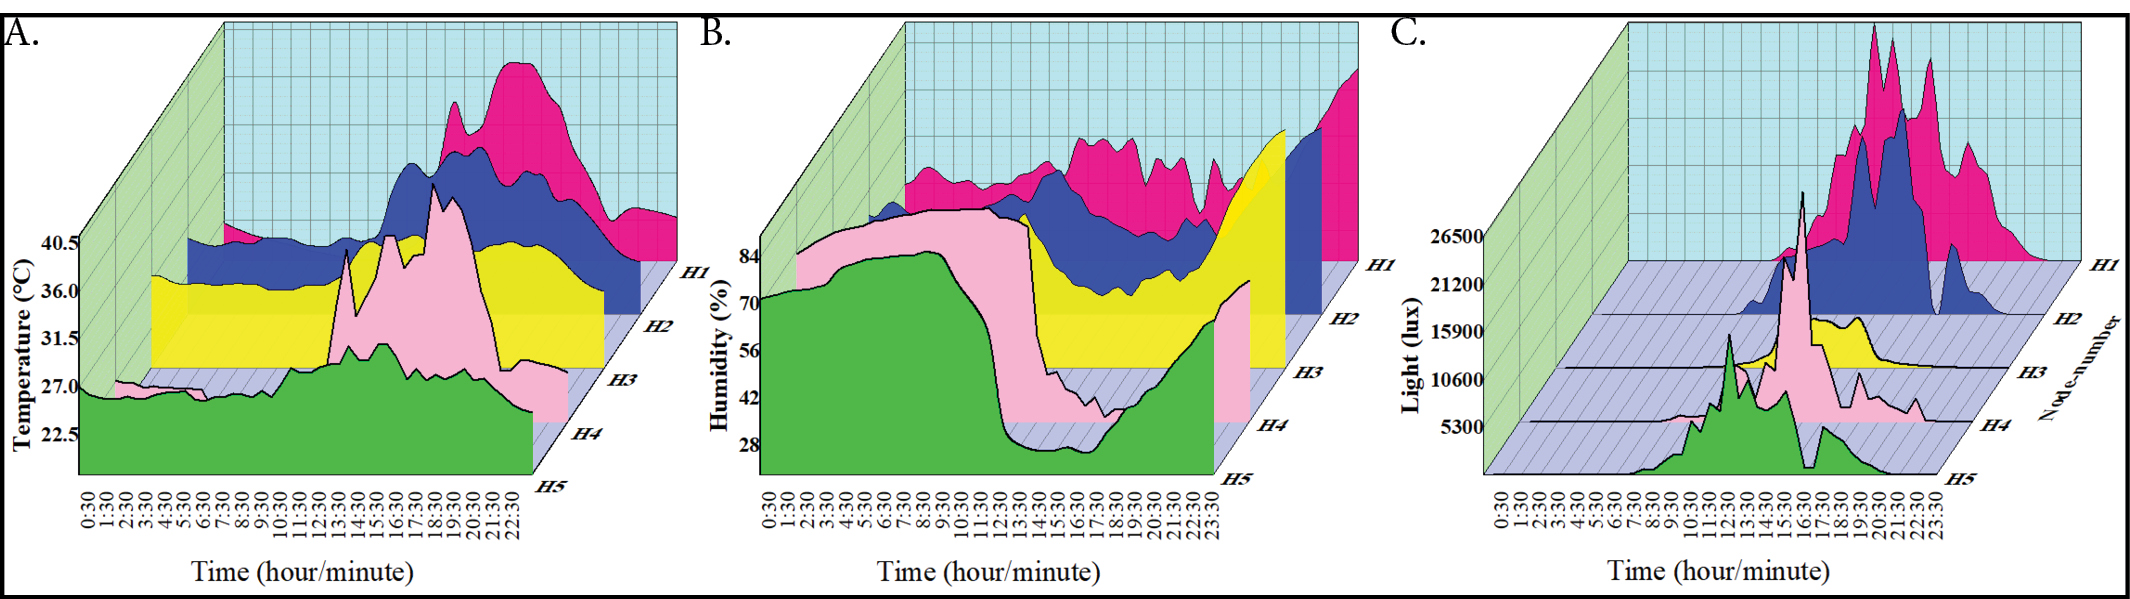
The system collected various environmental factors in the solar greenhouse from 0:00 to 23:55 on September 20, 2024. In Figure 12, the variations in temperature, humidity, and illuminance are illustrated in subplots (Figure 13A), (Figure 13B), and (Figure 13C), respectively.
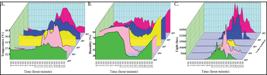
Changes in various environmental factors in the solar greenhouse: (A) Temperature (°C), (B) humidity (%), and (C) illuminance (lux). Data were collected from 0:00 to 23:55 on September 20, 2024
Figure 13 shows the continuous variations in the environmental parameters of temperature, humidity, and light intensity over a 24-hour period. The consistency between the sensor data and the natural circadian cycle, with temperatures peaking at noon and decreasing at night, accords with the expected environmental pattern of a solar greenhouse (Gao et al., 2023). As shown in Figure 13C, the peak light level of the H3 sensor located below the quilt (shown in Figure 10) was significantly lower than those of the other nodes, which is a normal phenomenon caused by physical shading and is consistent with actual environmental conditions. The LoRa module was able to maintain stable communication under the conditions of quilt occlusion. Research has shown that wireless signals obscured by obstacles such as plants in their path can affect the propagation environment (Tang et al., 2019). The system proposed in this paper overcomes this problem through sub-GHz LoRa technology, and the H3 node still transmit stably under the double shading of metal and quilt, which highlights the advantages of band selection. This finding verifies that the system not only maintains stable communication but also accurately captures dynamic environmental changes.
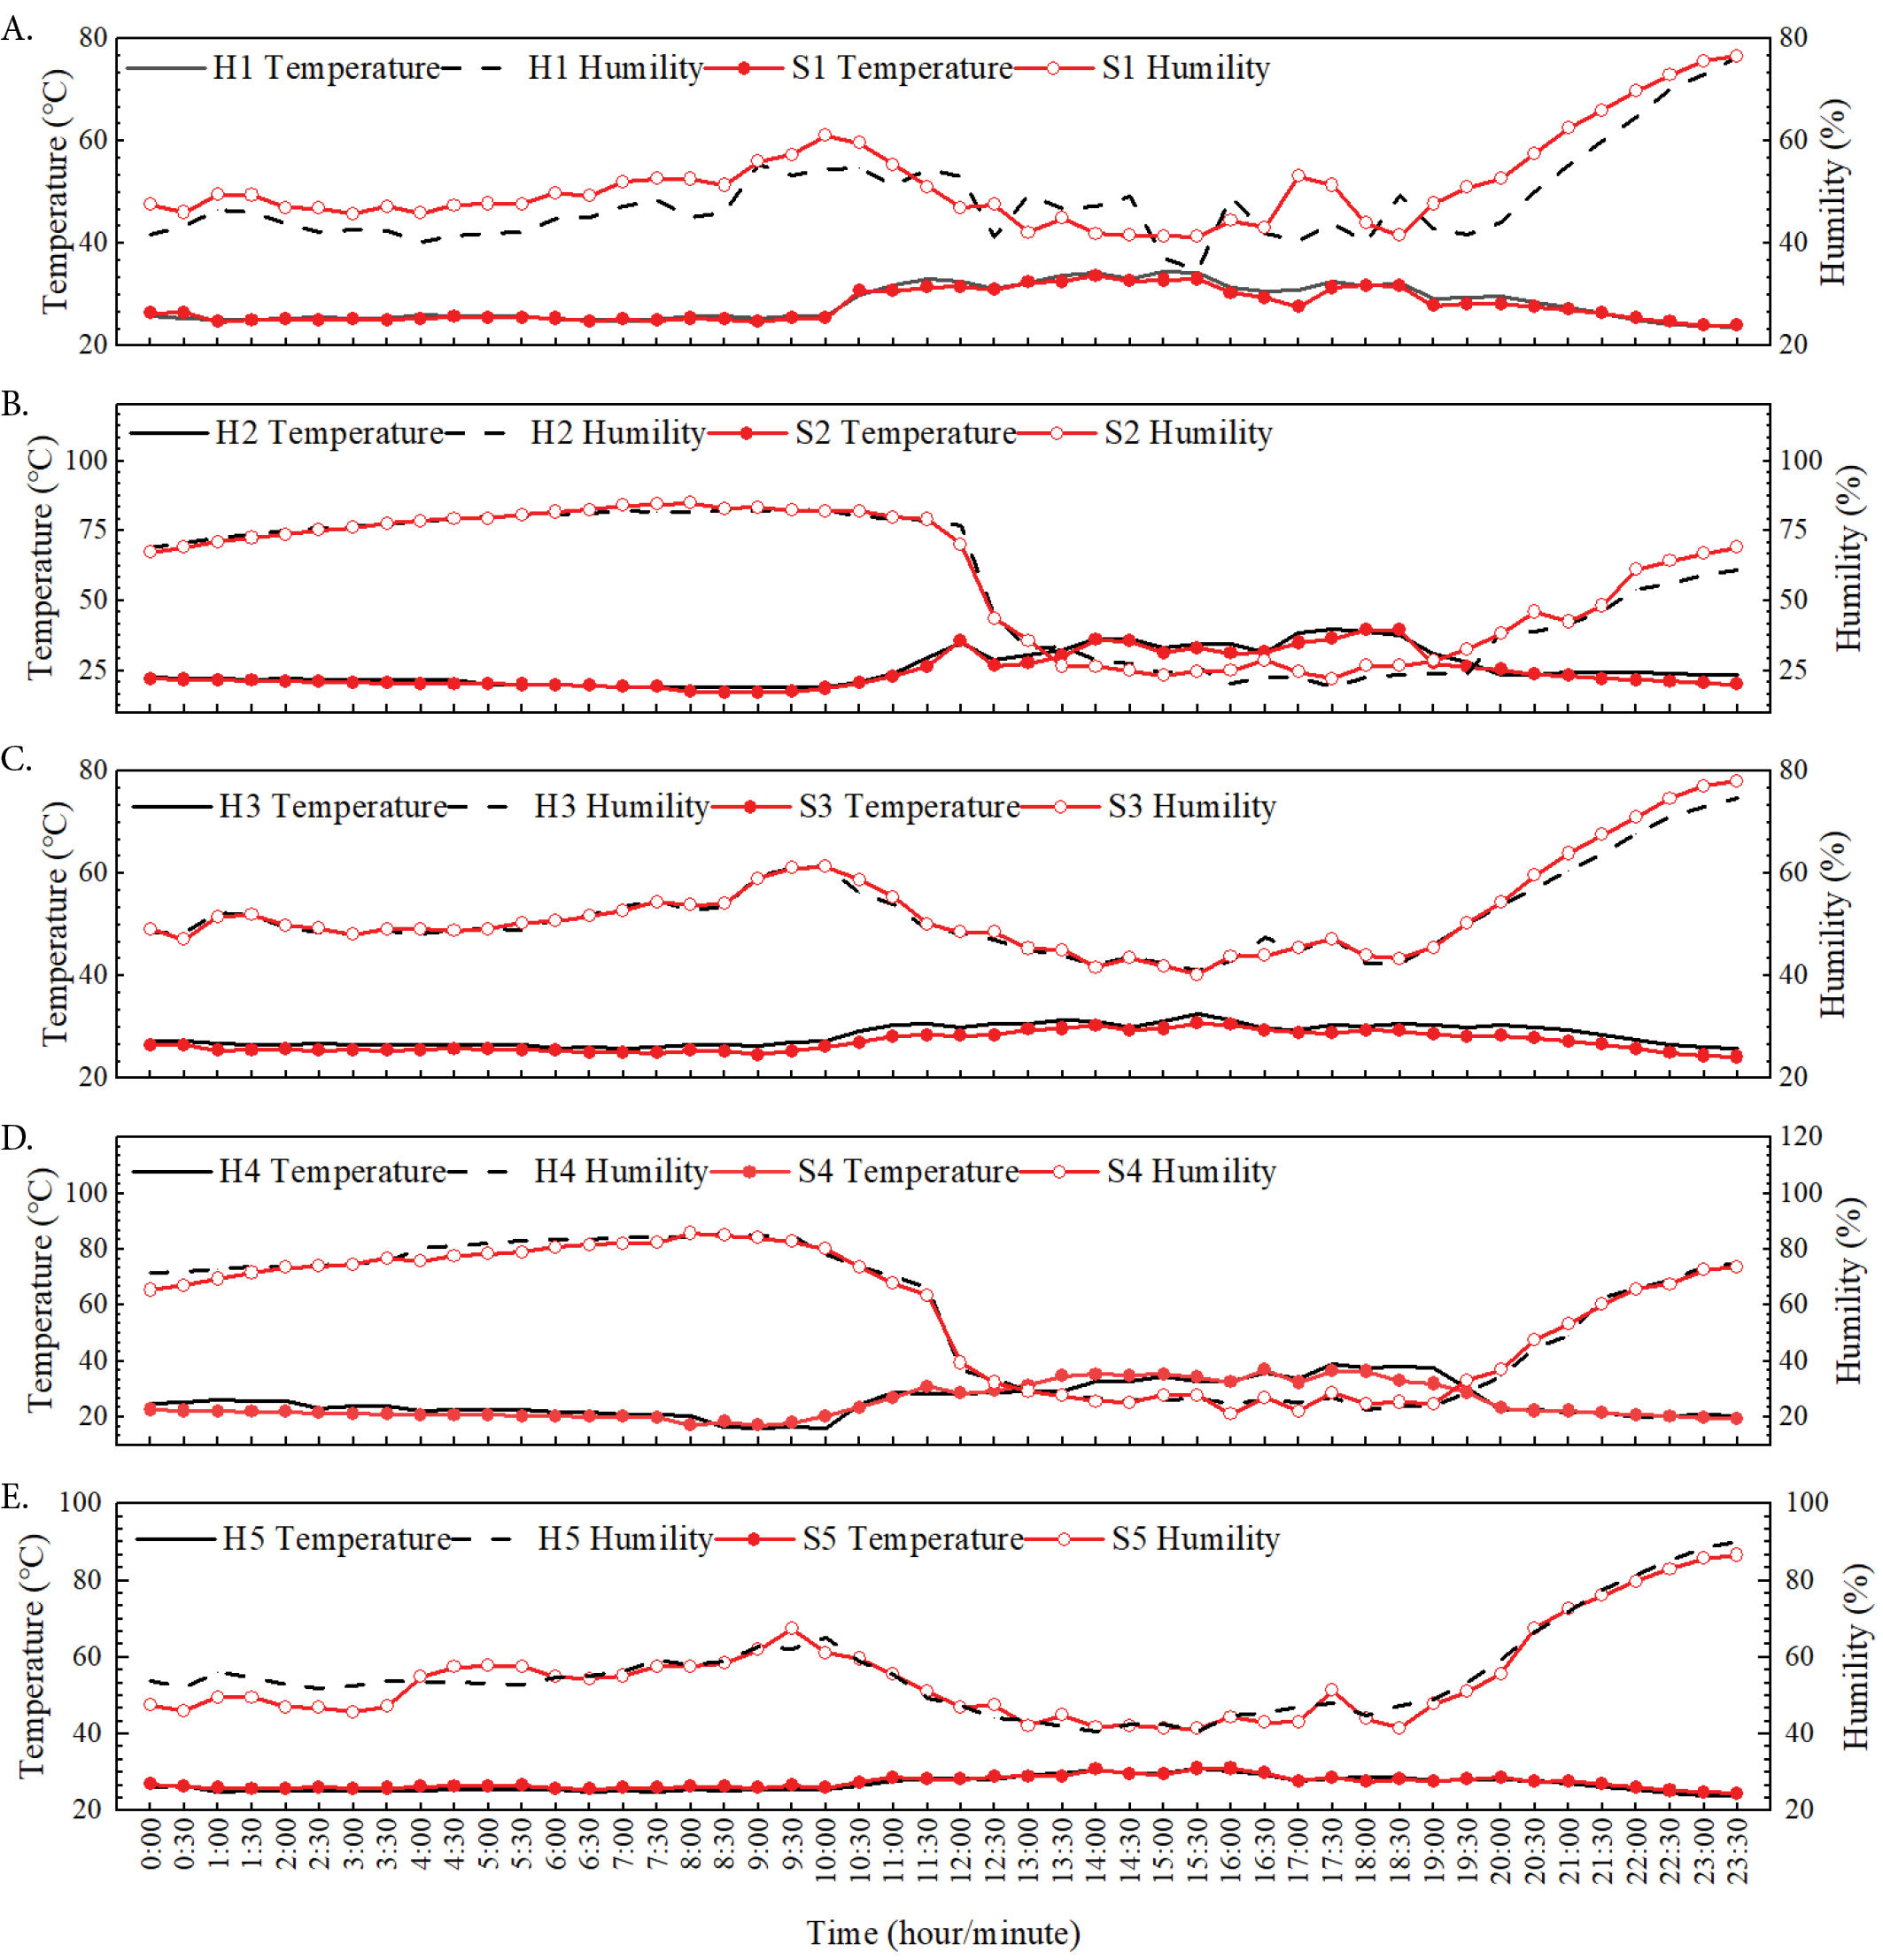
In addition, the recorders collected the temperature and humidity in the solar greenhouse from 0:00 to 23:55 on September 20, 2024. A comparison of the parameters of each node and the recorder is shown in Figure 14A-14E, which illustrates the temperature and humidity error distributions for nodes H1-H5, respectively.
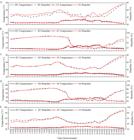
Comparison of monitoring data records: (A) Node H1 temperature error, (B) node H2 temperature error, (C) node H3 temperature error, (D) node H4 temperature error, and (E) node H5 temperature error
Figure 14A (node H1) and Figure 14D (node H4) show periodic spikes in temperature deviations, especially from 10:00-14:00 h, owing to the presence of direct sunlight at the node locations, which affected the accuracy of the sensors. Figure 14B (node H2) shows similar daytime fluctuations, which were influenced by airflow dynamics from neighboring vents, with a slightly higher maximum error of 3.4 °C. In contrast, Figure 14C (node H3) shows the smallest deviation, with a maximum value of 2.3 °C, owing to its location in the center of the greenhouse quilt, which buffered it against environmental extremes. Figure 14E (node H5) shows the most consistent performance, with a maximum error of 1.2 °C, because the node was located in the sheltered area, where airflow disturbances were minimal.
To evaluate the consistency between the sensor nodes and reference instruments, deviations in the temperature and humidity measurements were analyzed. The deviations of the collection results are shown in Table 3.
Temperature and humidity deviations between the sensor nodes (H1-H5) and reference recorders
Table 3 shows the results of the sensor accuracy tests, which indicate that the system maintained a high level of accuracy: the average temperature and humidity errors were ± 0.21 °C and ± 3.55% RH, respectively; however, localized variations were observed, with node H1 recording a humidity deviation of 12.5% RH owing to the ambient conditions of the temperature measurement point, which was located near the entrance of the greenhouse (Yang et al., 2022).
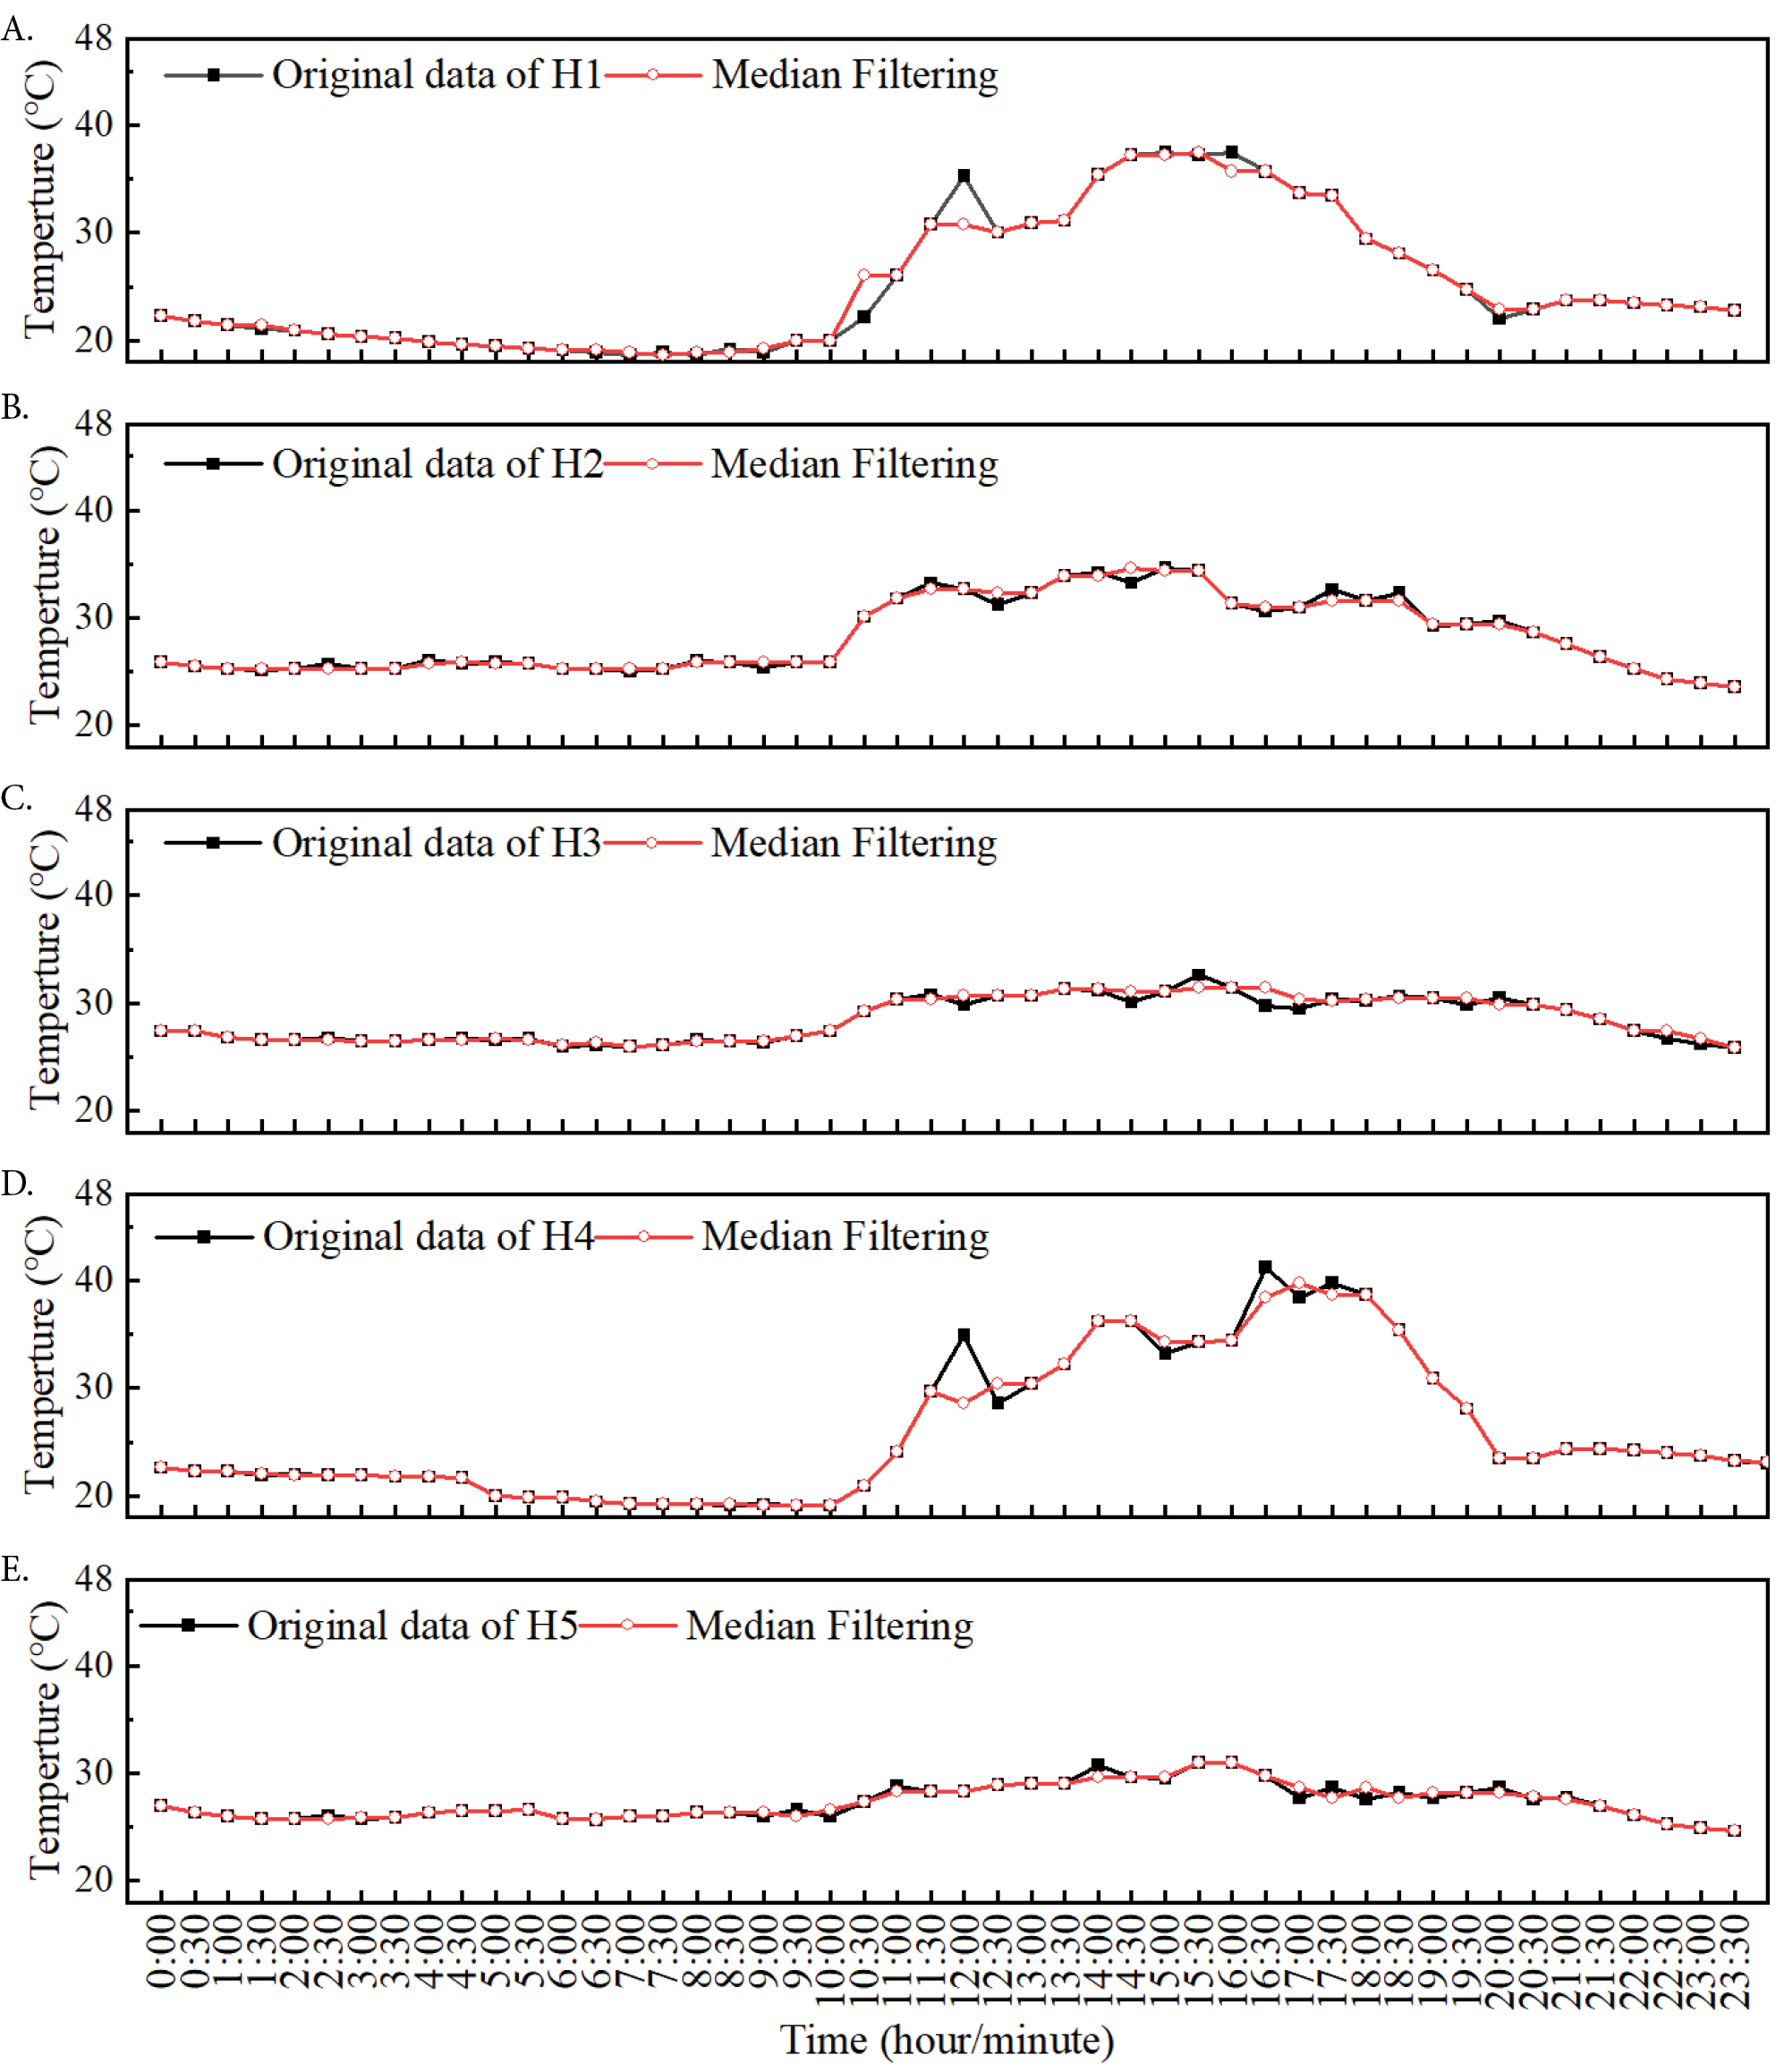
To evaluate the effectiveness of data preprocessing and fusion, raw temperature data from a single sensor were first processed using the median filtering algorithm. Figures 15A-15E compare the raw and median-filtered temperature data for single sensor nodes H1-H5, respectively.
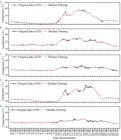
Comparison of raw and filtered temperature data for the five sensor nodes (H1-H5): (A) node H1, (B) node H2, (C) node H3, (D) node H4, and (E) node H5
Figures 15A through 15E show a comparison of the raw and filtered temperature data for the five sensor nodes H1-H5. Figure 15A shows that the raw data of node H1 fluctuate significantly from 10:00-14:00 h, with a maximum deviation of 3.2 °C. Filtering eliminated the transient spike of ±2 °C. Figure 15B shows that the raw data of node 2 have an abnormal peak of 3.4 °C at 15:00 h, the trend stabilizes after filtering, and the filtered data are slightly higher than the center node. Figure 15C shows that the raw node H3 data contain high-frequency noise, and the maximum deviation was reduced to 2.3 °C after filtering. Figure 15D shows that node H4 had the highest raw data fluctuations, with a maximum deviation of 4.1 °C, and filtering reduced the noise in the data by approximately 60%. Figure 15E shows that node H5 had the smallest amount of noise in the raw data, with a maximum deviation of 1.2 °C.
Figure 15 shows that median filtering can filter out the outliers caused by measurement errors, random interference and other factors well while retaining the original values of unfiltered data to better reflect the temperature trend. According to Eq. 5, the value of the RMSE was 0.4442, which was 56.1% lower than that of Jin, which proves that median filtering effectively reduced the noise in the greenhouse temperature data, and the filtered data show a smoother trend, which indicates the improved reliability of the filtered data (Jin et al., 2021).
A comparison of the MAPEs and MAEs of the different fusion methods for the temperature fusion values is shown in Table 4. According to the above error comparison, the MAPE and MAE of the adaptive weighted average data fusion algorithm were the smallest. Owing to the differences between similar sensor data, the arithmetic average fusion algorithm performed relatively poorly. According to the algorithm, the fused value x was calculated to adjust the environmental parameters.
Comparison of the MAPEs (mean absolute percentage errors) and MAEs (mean absolute errors) of the temperature fusion values obtained via different fusion methods
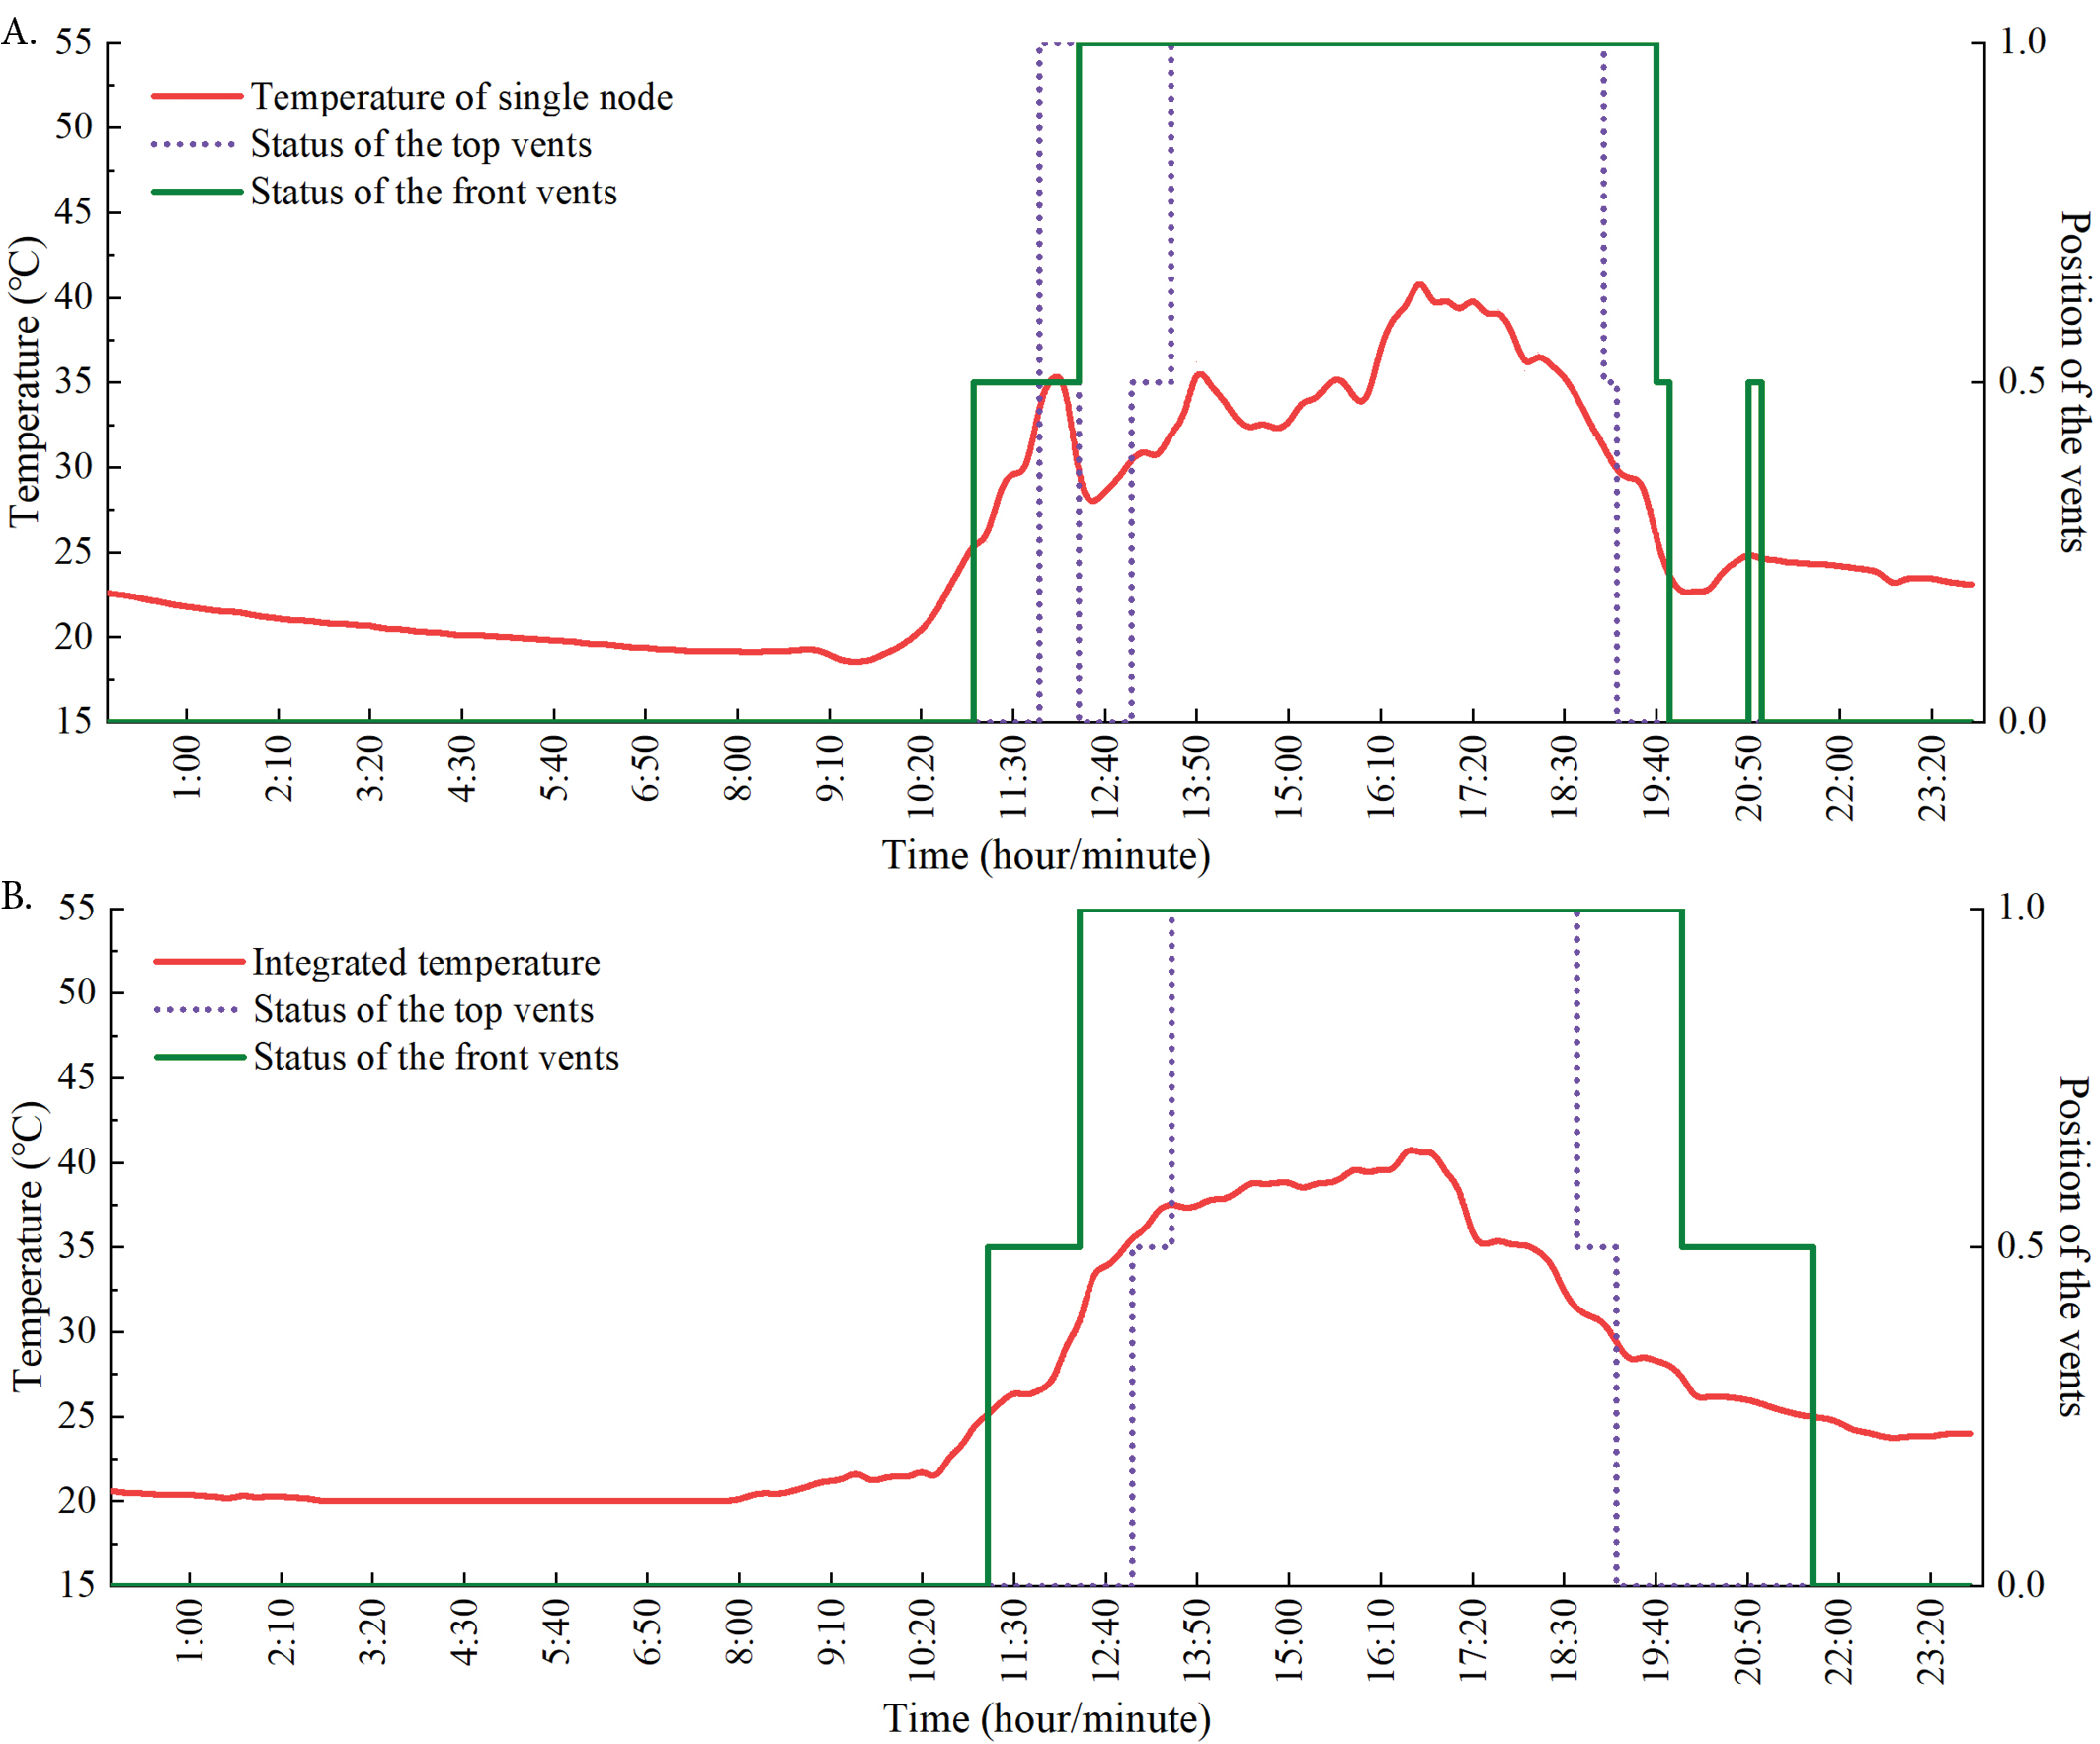
The data obtained on September 19 and September 20, 2024, were analyzed and evaluated. The system used the traditional single-node segmented control strategy and the multinode adaptive weighted average data fusion algorithm segmented control strategy to control the temperature in the solar greenhouse. The control results are shown in Figure 16.
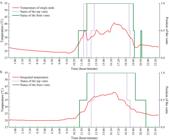
Temperature as a function of time for a single node (A) and the fused temperature control results (B)
Figure 16A shows that the traditional single-node segmented control strategy effectively reduced the temperature inside the greenhouse during the day, and the time when the temperature was in the suitable range accounted for 41.96% of the entire day. However, owing to the limited temperature sensing range of the single-node sensor, the control decision of the system was inaccurate, and the control equipment operated at a low temperature at night. Figure 16B shows that, compared with the traditional single-sensor control strategy, the control strategy of the system that uses the multisensor adaptive weighted average data fusion algorithm increased the time when the temperature was within the suitable range by 13.28%. In the actual control process, the temperature fluctuation was gentle, and the control accuracy was high. The execution accuracy and regulation accuracy of the actuators reached over 99%. The adaptive weighted fusion algorithm dynamically prioritizes sensors with lower variance; for example, nodes near vents are assigned reduced weights at night because of higher data fluctuations caused by airflow, thereby effectively minimizing outliers and improving data reliability. This approach outperforms the single-node control strategy proposed by Su et al. (Su et al., 2021), which lacks the ability to account for spatial temperature variations. Specifically, the edge areas of a greenhouse, owing to their proximity to vents, walls, or shading, typically experience significant temperature anomalies that affect crop growth but are difficult to monitor by a single-node system. This ensures more accurate and reliable control decisions, particularly in complex environments with heterogeneous microclimates.
Conclusions
-
The long range (LoRa)-WiFi dual-protocol communication network achieved a data transmission success rate of 99.8% in multinode environmental monitoring of a solar greenhouse.
-
The accuracy of the sensors was verified, with average temperature error of ± 0.21 °C and humidity error of ± 3.55%, which meets the requirements of practical applications.
-
Median filtering effectively reduced the temperature noise with RMSE of 1.196 °C, and the actuator execution accuracy exceeded 99%.
-
Compared with the traditional single-node control strategy, the multinode adaptive weighted average data fusion algorithm extended the time in the suitable temperature range (20-25 °C) by 13.28%.
Literature Cited
-
Aldhaheri, L.; Alshehhi, N.; Manzil, I. I. J.; Khalil, R. A.; Javaid, S.; Saeed, N.; Alouini, M. S. LoRa communication for agriculture 4.0: opportunities, challenges, and future directions. IEEE Internet of Things Journal. v.2409, e11200, 2024. https://doi.org/10.1109/JIOT.2024.3486369
» https://doi.org/10.1109/JIOT.2024.3486369 -
Cheng, W.; Wang, C.; Wang, Y.; Cheng, M.; Qiao, P.; Liu, Z. Study of the thermal environment and marginal effects of a sunken solar greenhouse. Engenharia Agrícola, v.44, e20230168, 2024. https://doi.org/10.1590/1809-4430-Eng.Agric.v44e20230168/2024
» https://doi.org/10.1590/1809-4430-Eng.Agric.v44e20230168/2024 -
Felisberto, F.; Fdez-Riverola, F.; Pereira, A. A ubiquitous and low-cost solution for movement monitoring and accident detection based on sensor fusion. Sensors, v.14, p.8961-8983, 2014. https://doi.org/10.3390/s140508961
» https://doi.org/10.3390/s140508961 -
Fibriani, I.; Bayu, A.; Ciptaning, P. Analisa sistem monitoring greenhouse berbasis internet of things (IoT) pada Jaringan 4G LTE. SinarFe7, v3, p.1-6, 2020. https://journal.fortei7.org/index.php/sinarFe7/article/view/295
» https://journal.fortei7.org/index.php/sinarFe7/article/view/295 -
Gao, M.; Wu, Q.; Li, J.; Wang, B.; Zhou, Z.; Liu, C.; Wang, D. Temperature prediction of solar greenhouse based on NARX regression neural network. Scientific Reports, v.13, e1563, 2023. https://doi.org/10.1038/s41598-022-24072-1
» https://doi.org/10.1038/s41598-022-24072-1 -
Guo, B.; Zhou, B.; Zhang, Z.; Li, K.; Wang, J.; Chen, J.; Papadakis, G. A critical review of the status of current greenhouse technology in China and development prospects. Applied Sciences, v.14, e5952, 2024. https://doi.org/10.3390/app14135952
» https://doi.org/10.3390/app14135952 -
Huang, Q.; Zhao, M.; Li, L.; Han, J.; Liu, L. Design and performance analysis of integrated sensing and communication scheme based on LoRa signals. AEU-International Journal of Electronics and Communications, v.187, e155559, 2024. https://doi.org/10.1016/j.aeue.2024.155559
» https://doi.org/10.1016/j.aeue.2024.155559 -
Jin, X.-B.; Zheng, W.-Z.; Kong, J.-L.; Wang, X.-Y.; Zuo, M.; Zhang, Q.-C.; Lin, S. Deep-learning temporal predictor via bidirectional self-attentive encoder-decoder Framework for IOT-Based environmental sensing in intelligent greenhouse. Agriculture, v11, e802, 2021. https://doi.org/10.3390/agriculture11080802
» https://doi.org/10.3390/agriculture11080802 -
Li, Y. Testing and analysis on the spatial and temporal distribution of light intensity and CO2 concentration in solar greenhouse. Sustainability, v.15, e7001, 2023. https://doi.org/10.3390/su15087001
» https://doi.org/10.3390/su15087001 -
Liu, Z.; Li, Y.; Zhao, L.; Liang, R.; Wang, P. Comparative evaluation of the performance of ZigBee and LoRa wireless networks in building environment. Electronics, v.11, e3560, 2022. https://doi.org/10.3390/electronics11213560
» https://doi.org/10.3390/electronics11213560 -
Luo, H.; Ruan, Z.; Xiao, L. 2.4 GHz LoRa wireless technology for Internet of Things: An experimental study. Journal of Circuits, Systems and Computers, v.32, e2350101, 2023. https://doi.org/10.1142/S0218126623501013
» https://doi.org/10.1142/S0218126623501013 -
Mathew, T. E.; Sabu, A.; Sengan, S.; Sathiamoorthy, J.; Prasanth, A. Microclimate monitoring system for irrigation water optimization using IoT. Measurement: Sensors, v.27, e100727, 2023. https://doi.org/10.1016/j.measen.2023.100727
» https://doi.org/10.1016/j.measen.2023.100727 -
Moshou, D.; Pantazi, X. E.; Kateris, D.; Gravalos, I. Water stress detection based on optical multisensor fusion with a least squares support vector machine classifier. Biosystems Engineering, v.117, p.15-22, 2014. https://doi.org/10.1016/j.biosystemseng.2013.07.008
» https://doi.org/10.1016/j.biosystemseng.2013.07.008 -
Patil, K. M.; Sunil, K. IOT based wireless networking infrastructure for greenhouse management through web application using ESP8266. Turkish Online Journal of Qualitative Inquiry, v.7, p.01, 2022. https://tojqi.net/index.php/journal/article/view/1189
» https://tojqi.net/index.php/journal/article/view/1189 -
Ruipeng, T.; Jianbu, Y.; Jianrui, T.; Aridas, N. K.; Talip, M. S. A. Design of agricultural wireless sensor network node optimization method based on improved data fusion algorithm. PloS one, v.19, e0308845, 2024. https://doi.org/10.1371/journal.pone.0308845
» https://doi.org/10.1371/journal.pone.0308845 -
Shaikh, F. K.; Karim, S.; Zeadally, S.; Nebhen, J. Recent trends in internet-of-things-enabled sensor technologies for smart agriculture. IEEE Internet of Things Journal , v.9, p.23583-23598, 2022. https://doi.org/10.1109/JIOT.2022.3210154
» https://doi.org/10.1109/JIOT.2022.3210154 -
Sousa, E. D. T. D. S.; Queiroz, D. M. D.; Coelho, A. L. D. F.; Valente, D. S. M. Development of a portable multisensor platform for soil map. Revista Ciência Agronômica, v.54, e20217886, 2023. https://doi.org/10.5935/1806-6690.20230008
» https://doi.org/10.5935/1806-6690.20230008 -
Spachos, P.; Gregori, S. Integration of wireless sensor networks and smart uavs for precision viticulture. IEEE Internet Computing, v.23, p.8-16, 2019. https://doi.org/10.1109/TMC.2022.3193499
» https://doi.org/10.1109/TMC.2022.3193499 -
Su, J. S.; Murugan, R.; Nagarjun, M.; Praveen, A. K. IOT based greenhouse monitoring and controlling system. In Journal of Physics: Conference Series. IOP Publishing, v.1916, e012062, 2021. https://doi.org/10.1088/1742-6596/1916/1/012062
» https://doi.org/10.1088/1742-6596/1916/1/012062 -
Sujono, H.; Nainggolan, R. W. P. Drip irrigation control system based on mamdani fuzzy logic and internet of things (IoT). Przegląd Elektrotechniczny, v.1, p.65-69, 2024. https://doi.org/10.15199/48.2024.01.13
» https://doi.org/10.15199/48.2024.01.13 -
Sung, B. H.; Cho, Y. Y. Design of a greenhouse monitoring system using arduino and wireless communication. Journal of Bio-Environment Control, v.31, p.452-459, 2022. https://doi.org/10.12791/KSBEC.2022.31.4.452
» https://doi.org/10.12791/KSBEC.2022.31.4.452 -
Tan, F.; Zhang, L.; Zhao, Y.; Bai, F.; Zhang, J.; Gyilbag, A. Climatic suitability and development potential of facility agriculture at county-level in China. Science of The Total Environment, v.955, e177108, 2024. https://doi.org/10.1016/j.scitotenv.2024.177108
» https://doi.org/10.1016/j.scitotenv.2024.177108 -
Tang, W.; Ma, X.; Wei, J.; Wang, Z. Measurement and analysis of near-ground propagation models under different terrains for wireless sensor networks. Sensors, v.19, e1901, 2019. https://doi.org/10.3390/s19081901
» https://doi.org/10.3390/s19081901 -
Van Truong, T.; Nayyar, A.; Masud, M. A novel air quality monitoring and improvement system based on wireless sensor and actuator networks using LoRa communication. PeerJ Computer Science, v7, e711, 2021. https://doi.org/10.7717/peerjcs.711/table-1
» https://doi.org/10.7717/peerjcs.711/table-1 -
Yang, S.; Liu, X.; Liu, S.; Chen, X.; Cao, Y. Real-Time temperature distribution monitoring in Chinese solar greenhouse using virtual LAN. Agronomy, v.12, e1565, 2022. https://doi.org/10.3390/agronomy12071565
» https://doi.org/10.3390/agronomy12071565
-
1 Research developed at Xinjiang Agricultural University, New Energy College, Xinjiang Uygur Autonomous Region, Urumqi, China
-
Supplementary documents
There are no supplementary sources.
-
Financing statement
This study was supported by the Research on Key Technologies for High-Efficiency Utilization of Solar Energy and Intelligent Management of Greenhouses in Desert Areas (Grant No. 2023B02020), the Project of the Science and Technology Innovation Team (Tianshan Innovation Team), and Xinjiang Smart Agricultural Information Perception Technology Innovation (Grant No. 2022TSYCTD0011).
There are no supplementary sources.

 LoRa (long range) - a low-power, long-range wireless communication technology; STM (STM32 microcontroller - a 32-bit ARM-based microcontroller developed by STMicroelectronics
 AHT20 - Sensor type and version; BH1750 (GY-302) - Sensor model and development board model, RTC - Real time clock; SW-DP - Serial wire debug port; SPI - Serial peripheral interface, and USART - Universal synchronous/asynchronous receiver/transmitter
 RTC - Real time clock; SW-DP - Serial wire debug port; SPI - Serial peripheral interface, and USART - Universal synchronous/asynchronous receiver/transmitter
 GPIO - General-purpose input/output; RTC - Real time clock; SW-DP - Serial wireless debug port; SPI - Serial peripheral interface, and USART - Universal synchronous/asynchronous receiver/transmitter
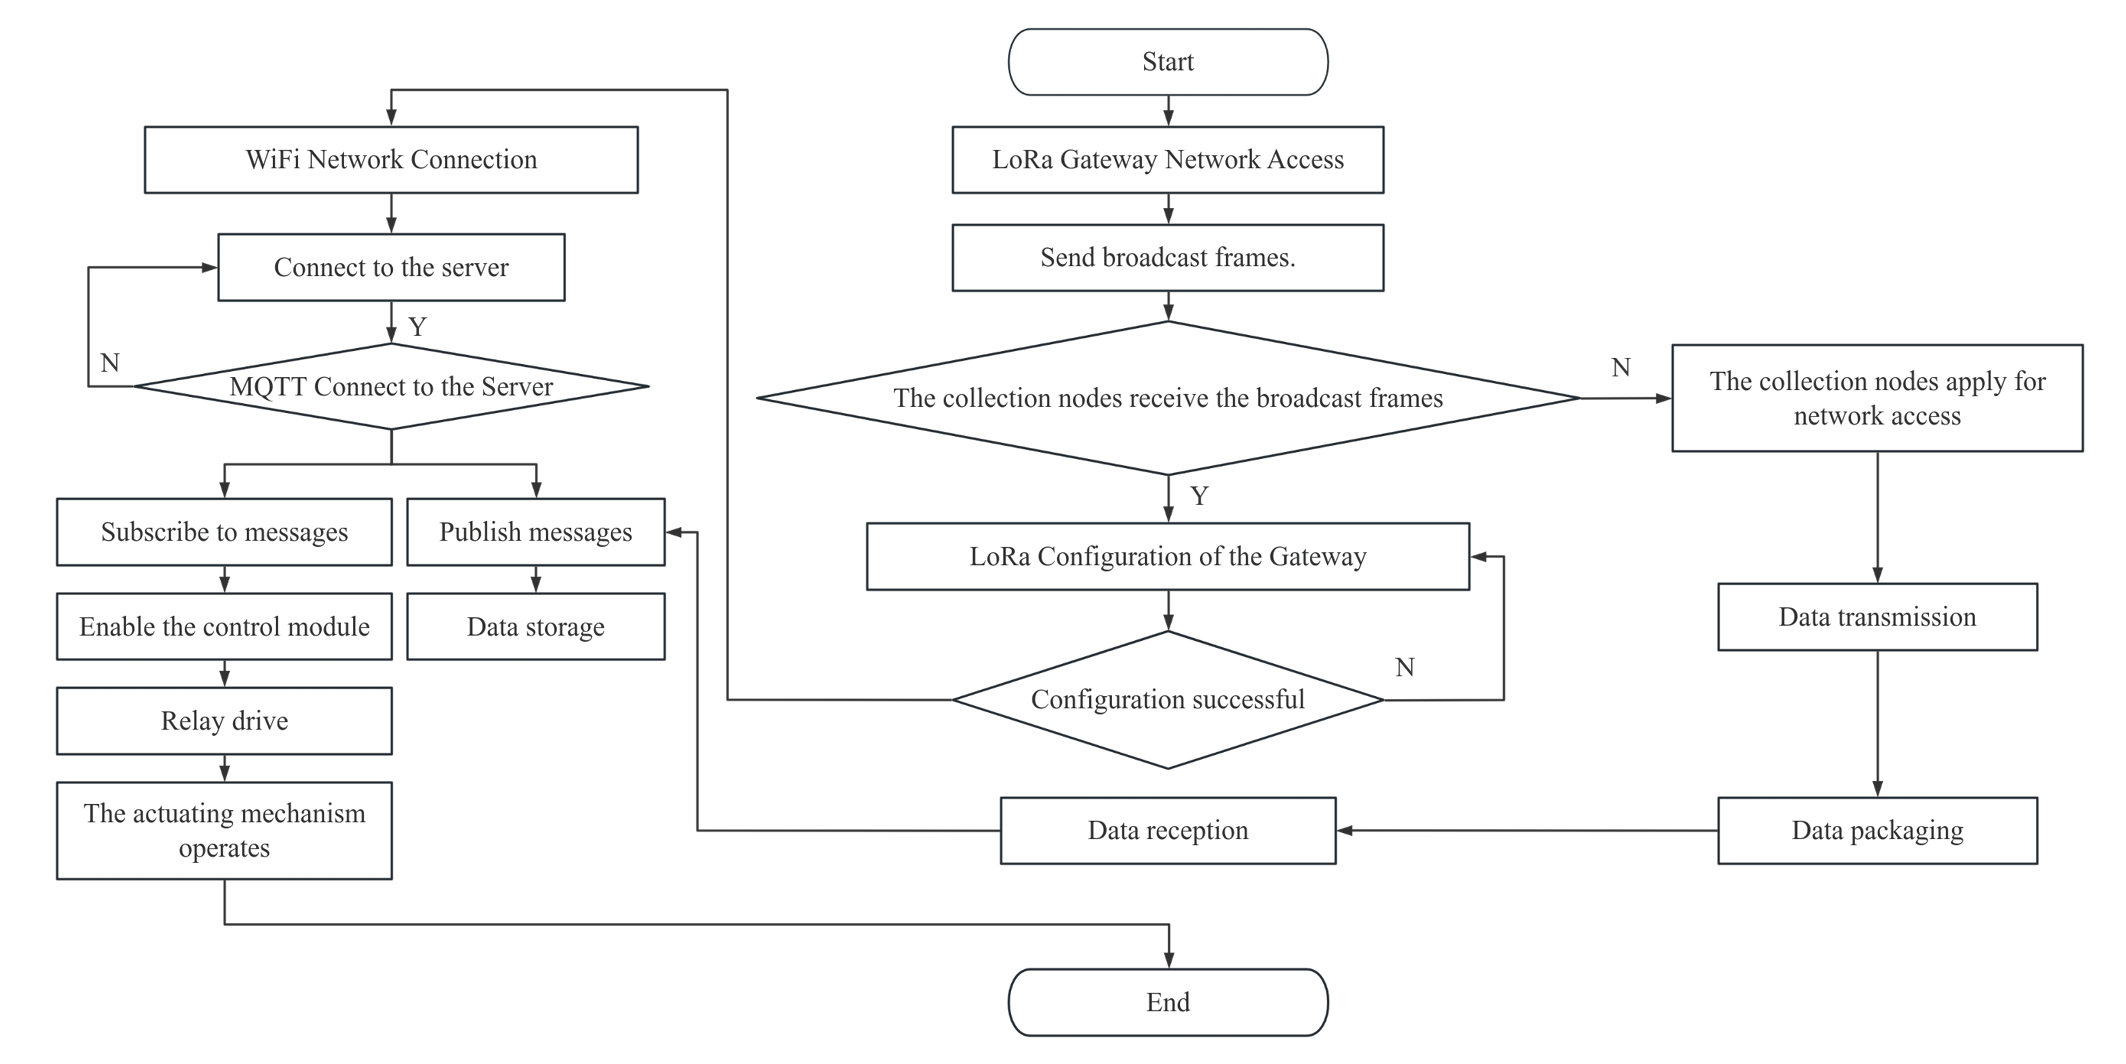 N - No; Y - Yes
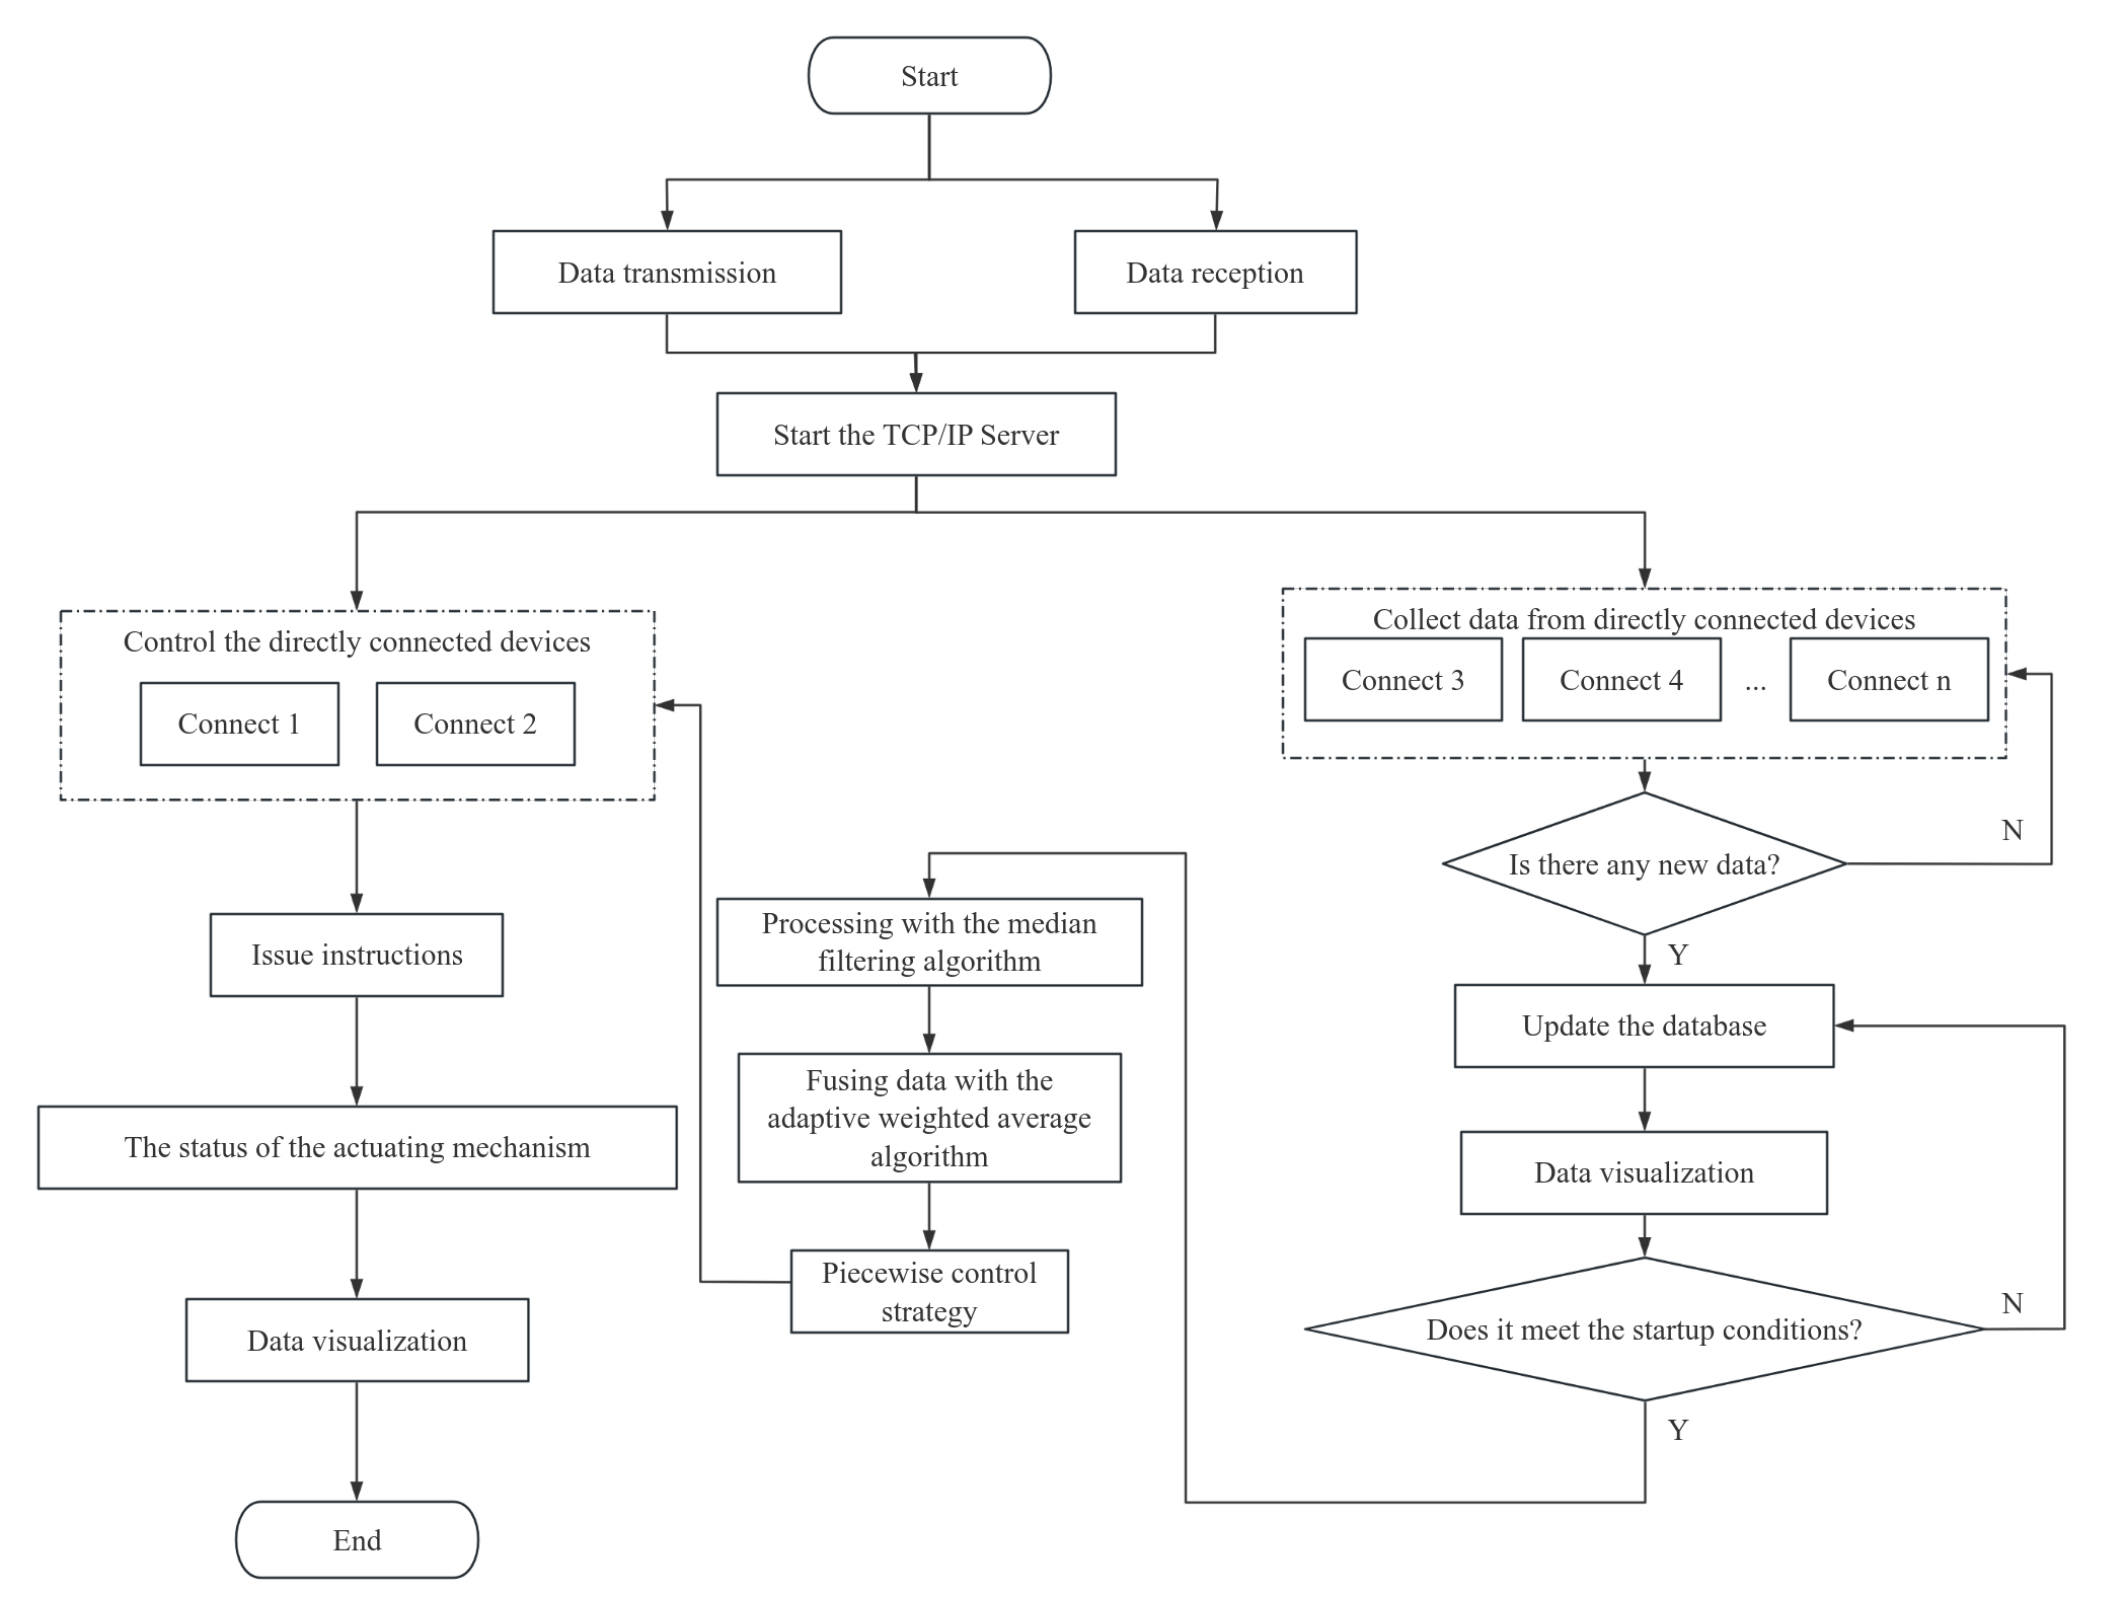 N - No; Y - Yes
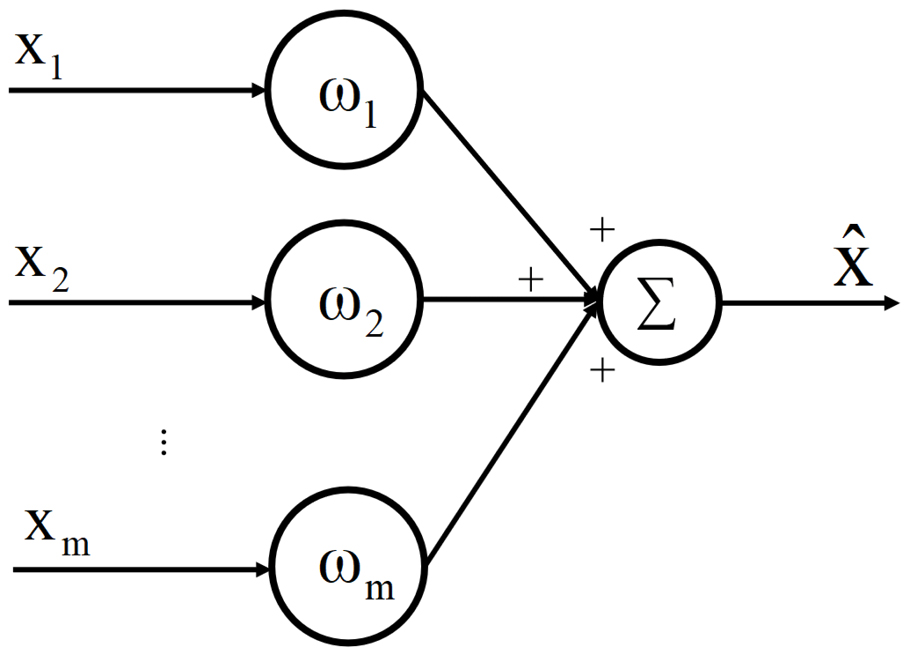 xp - Input data of the p-th sensor (p=1, 2..., m), ωp - weight of the p-th sensor (p=1, 2..., m), Ʃ - summation operator, and x -fusion output value
 H1-H5 (red circles) - collection nodes, S1-S5 (green squares) - temperature and humidity recorders, and R (blue triangle) - LoRa gateway
 N - No; Y -Yes