 Reference flow modeling for MATOPIBA region: A hydrological regionalization approach1
ABSTRACT
The MATOPIBA region, covering parts of Maranhão, Tocantins, Piauí and Bahia states, Brazil, is a new agricultural frontier. Estimating streamflow is challeging due to inconsistent historical data and focus on large rivers. Hydrological regionalization, which transfers informations between similar basins, offers a solution. This study developed reference flow models using data from 83 streamflow gauging stations to calculate flows (Qmespr, Q90espr, Q95espr, Q7.10espr), converted to specific flows (L s-1 km-2). Annual rainfall per basin was interpolated via ordinary kriging, ranging from 889.5 mm per year in Bahia and Piauí to 1,829 mm per year in Tocantins and Maranhão. Cluster analysis using morphometric variables (drainage density, main river length, slope, compactness coefficient, centroid coordinates) and rainfall identified seven homogeneous regions. Multiple linear regression models were fitted per region, with best models selected via Akaike Information Criterion (AIC) and statistical tests. A total of 28 equations (four per region) were generated, with drainage density present in all. The performance of the models, evaluated via Willmott’s index (d > 0.85), Nash-Sutcliffe efficiency (NSE > 0.70), PBIAS (< 15%), and R2 (> 0.70), was classified mostly as «very good» or «good,». Lower accuracy occured in clusters 3, 6, and 7 due to rainfall variability, basin dispersion, and river length ranges. These models support estimation of reference streamflows in ungauged basins, aiding water resources management, irrigation planning, drought mitigation, and sustainable agriculture. Future improvements could include seasonal rainfall analysis, more gauging stations, and remote sensing variables. The regionalization approach may be extended to other Brazilian biomes.
Key words:
hydrology; kriging; GIS; geostatistics; multiple-regression
HIGHLIGHTS:
Seven hydrologically homogeneous regions were identified in the MATOPIBA region.
Four reference flow models were developed for each homogeneous region.
The models showed strong predictive performance, supporting informed water resources management decisions.
RESUMO
A região do MATOPIBA, abrangendo parte do Maranhão, Tocantins, Piauí e Bahia, é uma nova fronteira agrícola no Brasil. Estimar a vazão é desafiador devido a dados históricos inconsistentes e foco em grandes rios. A regionalização hidrológica, que transfere informações entre bacias semelhantes, oferece uma solução. Este estudo desenvolveu modelos de vazão usando dados de 83 postos fluviométricos para calcular as vazões de referência (Qmespr, Q90espr, Q95espr, Q7.10espr), convertidas em vazões especificas (L s-1 km-2). A precipitação anual por bacia foi interpolada via krigagem ordinária, variando de 889,5 mm por ano na Bahia e Piauí a 1.829 mm por ano em Tocantins e Maranhão. A análise de clusters, considerando variáveis morfométricas (densidade de drenagem, comprimento do rio principal, declividade, coeficiente de compacidade, coordenadas do centroide) e precipitação, identificou sete regiões homogêneas. Modelos de regressão linear múltipla foram ajustados por região, com os melhores selecionados pelo Critério de Informação de Akaike e testes estatisticos. Foram geradas um total de 28 equações (quatro por região), com densidade de drenagem presente em todas elas. O desempenho dos modelos, avaliado pelo índice de Willmott (d > 0,85), eficiência de Nash-Sutcliffe (NSE > 0,70), PBIAS (< 15%) e R2 (> 0,70), foi classificado principalmente como “muito bom” ou “bom”. Menor precisão ocorreu nos clusters 3, 6 e 7 devido à variabilidade de precipitação, dispersão das bacias e amplitudes de comprimento dos rios. Esses modelos auxiliam na estimativa de vazões de referência em bacias hidrográficas não monitoradas, contribuindo para a gestão de recursos hídricos, o planejamento de irrigação, a mitigação da seca e a agricultura sustentável. Melhorias futuras poderão incluir análises sazonais de precipitação, mais estações de medição e variáveis de sensoriamento remoto. A abordagem de regionalização pode ser estendida a outros biomas brasileiros.
Palavras-chave:
hidrologia; krigagem; SIG; geoestatística; regressão multivariada
INTRODUCTION
The MATOPIBA region-spanning the states of Maranhão, Tocantins, Piauí, and Bahia-has emerged as Brazil’s fastest-growing agricultural frontier (Batista et al., 2023). Responsible for approximately 8% of national corn (Zea mays) and 13% of soybean (Glycine max) production (CONAB, 2023), its rapid expansion, driven by large-scale mechanized agriculture, has substantially altered the Cerrado biome. This land-use intensification has increased pressure on local water resources, particularly in areas frequently affected by drought (Evangelista et al., 2017; Lima et al., 2023; Ranke et al., 2025). As agricultural, industrial, and urban demands increasingly compete for limited water supplies, accurate streamflow estimation becomes essential for sustainable water allocation, irrigation planning, and environmental management.
Hydrological models play a central role in simulating hydrological processes and supporting water resources decision-making (Xiong & Zeng, 2019; Kittel et al., 2020). However, their reliability depends on robust calibration, which remains challenging in data-scarce regions (He et al., 2011; Mizukami et al., 2017; Guo et al., 2020). In MATOPIBA, monitoring stations are concentrated along major rivers, leaving many smaller tributaries and headwater basins ungauged. This limited spatial coverage constrains the application of conventional hydrological modeling approaches and reinforces the need for reliable regionalization methods.
Hydrological regionalization transfers information from gauged to ungauged basins based on spatial, physical, or statistical similarities (Yang et al., 2020, Duarte et al., 2024). The main approaches include spatial proximity (SP), which assumes that geographically adjacent basins exhibit similar hydrological responses; physical similarity (PS), which relies on morphometric and climatic attributes; and multiple regression (MR), which links streamflow indices to basin descriptors (Guo et al., 2020; Yang et al., 2020; Xu et al., 2022). Comparative studies indicate that SP performs well in hydrologically uniform regions but poorly across strong climatic gradients; PS yields reliable results when basin attributes are adequately characterized; and MR offers greater flexibility and interpretability, particularly when combined with geostatistically interpolated rainfall data (Yang et al., 2020; Fenicia et al., 2022).
Practical applications in Brazil and worldwide demonstrate the effectiveness of regionalization techniques. In the São Francisco River basin, Silva et al. (2009) applied MR models incorporating rainfall and drainage density to support water-permit allocation during drought periods. In Rio Grande do Sul, Beskow et al. (2016) combined artificial neural networks with MR to estimate Q90, resulting in a 25% improvement in irrigation scheduling accuracy in ungauged areas. At the global scale, Beck et al. (2020) employed large-scale parameter regionalization to simulate streamflow in more than 4,000 headwater catchments. In the Tocantins River basin, Rodrigues et al. (2021) applied PS-based models to estimate Q90, supporting the licensing of small hydropower plants.
Despite these advances, MATOPIBA still lacks an integrated regionalization framework tailored to its environmental complexity. The region spans three biomes-Cerrado, Caatinga, and Amazon transition zones-with annual rainfall ranging from approximately 800 to over 2,000 mm and highly variable drainage characteristics. Existing flow estimates are often derived from sparse datasets or generalized national-scale models that fail to capture local hydrological behavior. This study addresses this gap by developing reference flow models (Qm, Q90, Q95, and Q7,10) for hydrologically homogeneous regions within MATOPIBA.
The study aimed to: (i) estimate mean annual rainfall using ordinary kriging; (ii) delineate hydrologically homogeneous regions through cluster analysis; (iii) develop PS- and MR-based regionalization equations; and (iv) evaluate model performance using robust statistical metrics. The resulting models aim to support irrigation planning, environmental flow assessment, drought forecasting, and water-use permitting, thereby strengthening climate-resilient water governance in the region.
MATERIAL AND METHODS
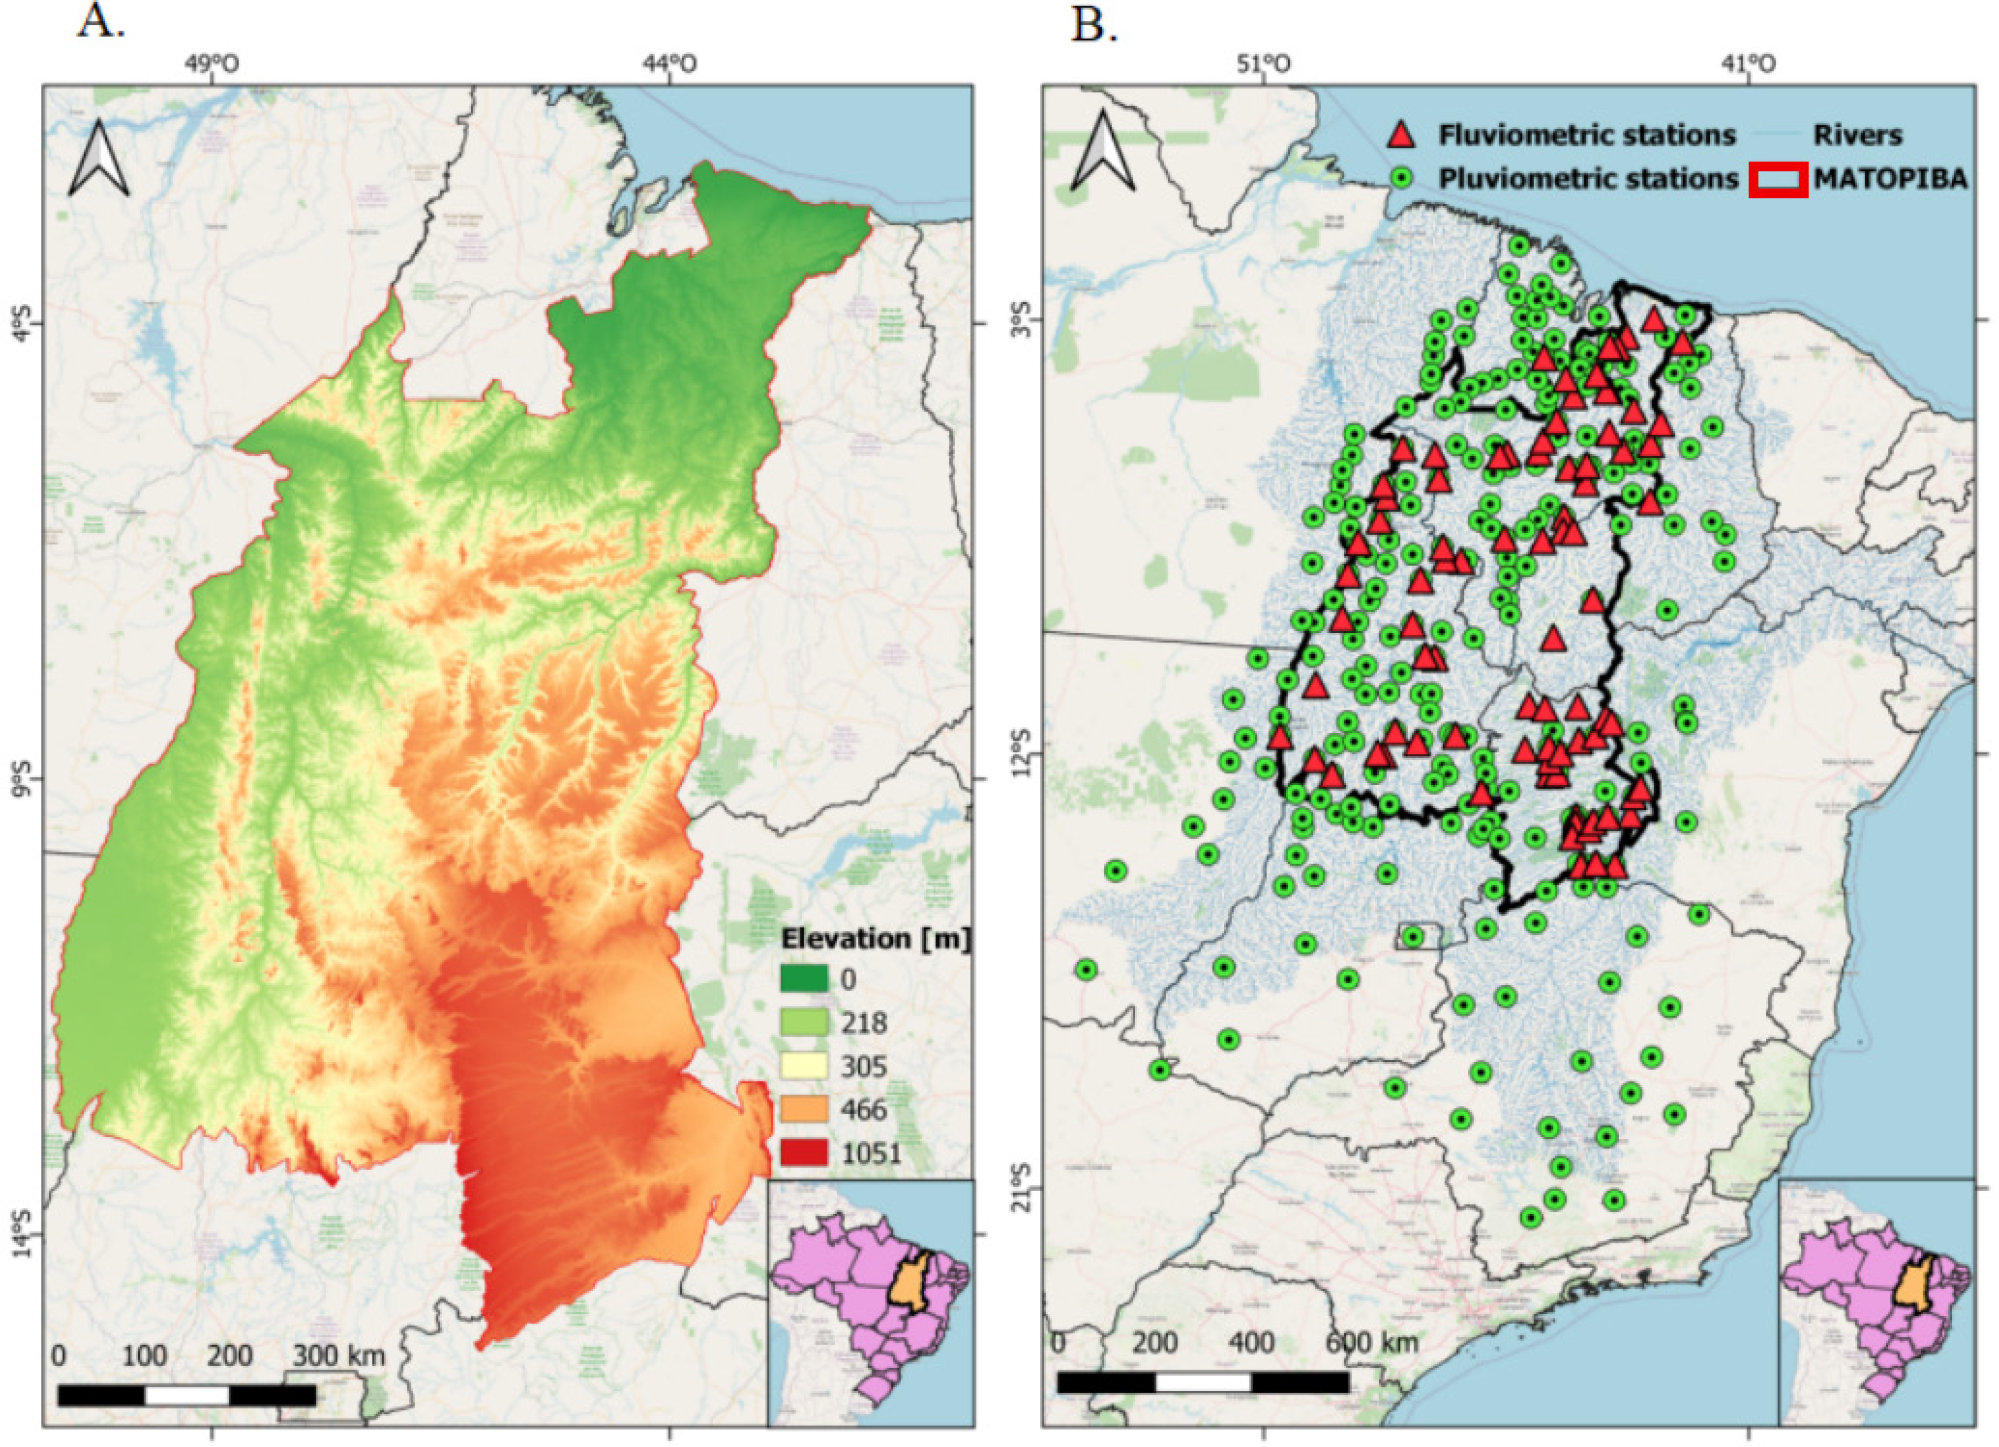
The study was conducted in the MATOPIBA region (Figure 1), which encompasses parts of four Brazilian states and covers an area of approximately 730,000 km2, with elevations ranging from 0 to 1,051 m above sea level. The region is located between latitudes 2° 30′ S and 15° 15′ S and longitudes 43° 00′ W and 50° 00′ W. According to the Köppen-Geiger climate classification (Peel et al., 2007), the region is predominantly characterized by a humid tropical climate with a dry winter (Aw), with mean monthly temperatures between 25 and 27 °C and mean annual rainfall ranging from 800 to 2,000 mm. Rainfall exhibits a well-defined seasonal pattern, with a dry period from June to September and a rainy period from October to May (Nascimento & Novais, 2015).
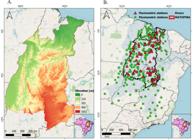
Delimitation of the MATOPIBA region (A) and spatial distribution of streamflow and rainfall gauging stations used in this study (B)
Daily rainfall data (mm per day) and mean daily streamflow data (m3 s⁻1) were obtained from historical records of rainfall and streamflow gauging stations within the study area, accessed through the HIDROWEB platform of the National Information System on Water Resources (SNIRH), maintained by the National Water and Sanitation Agency. Selection criteria included stations with at least 30 years of data and a maximum of 20% missing observations per year, restricting the analysis period to 1980-2023. After applying these filters, 83 streamflow gauging stations and 262 rainfall stations were selected, of which 143 were located within the MATOPIBA limits and 119 in surrounding areas. Figure 1B illustrates the spatial distribution of the stations used in this study.
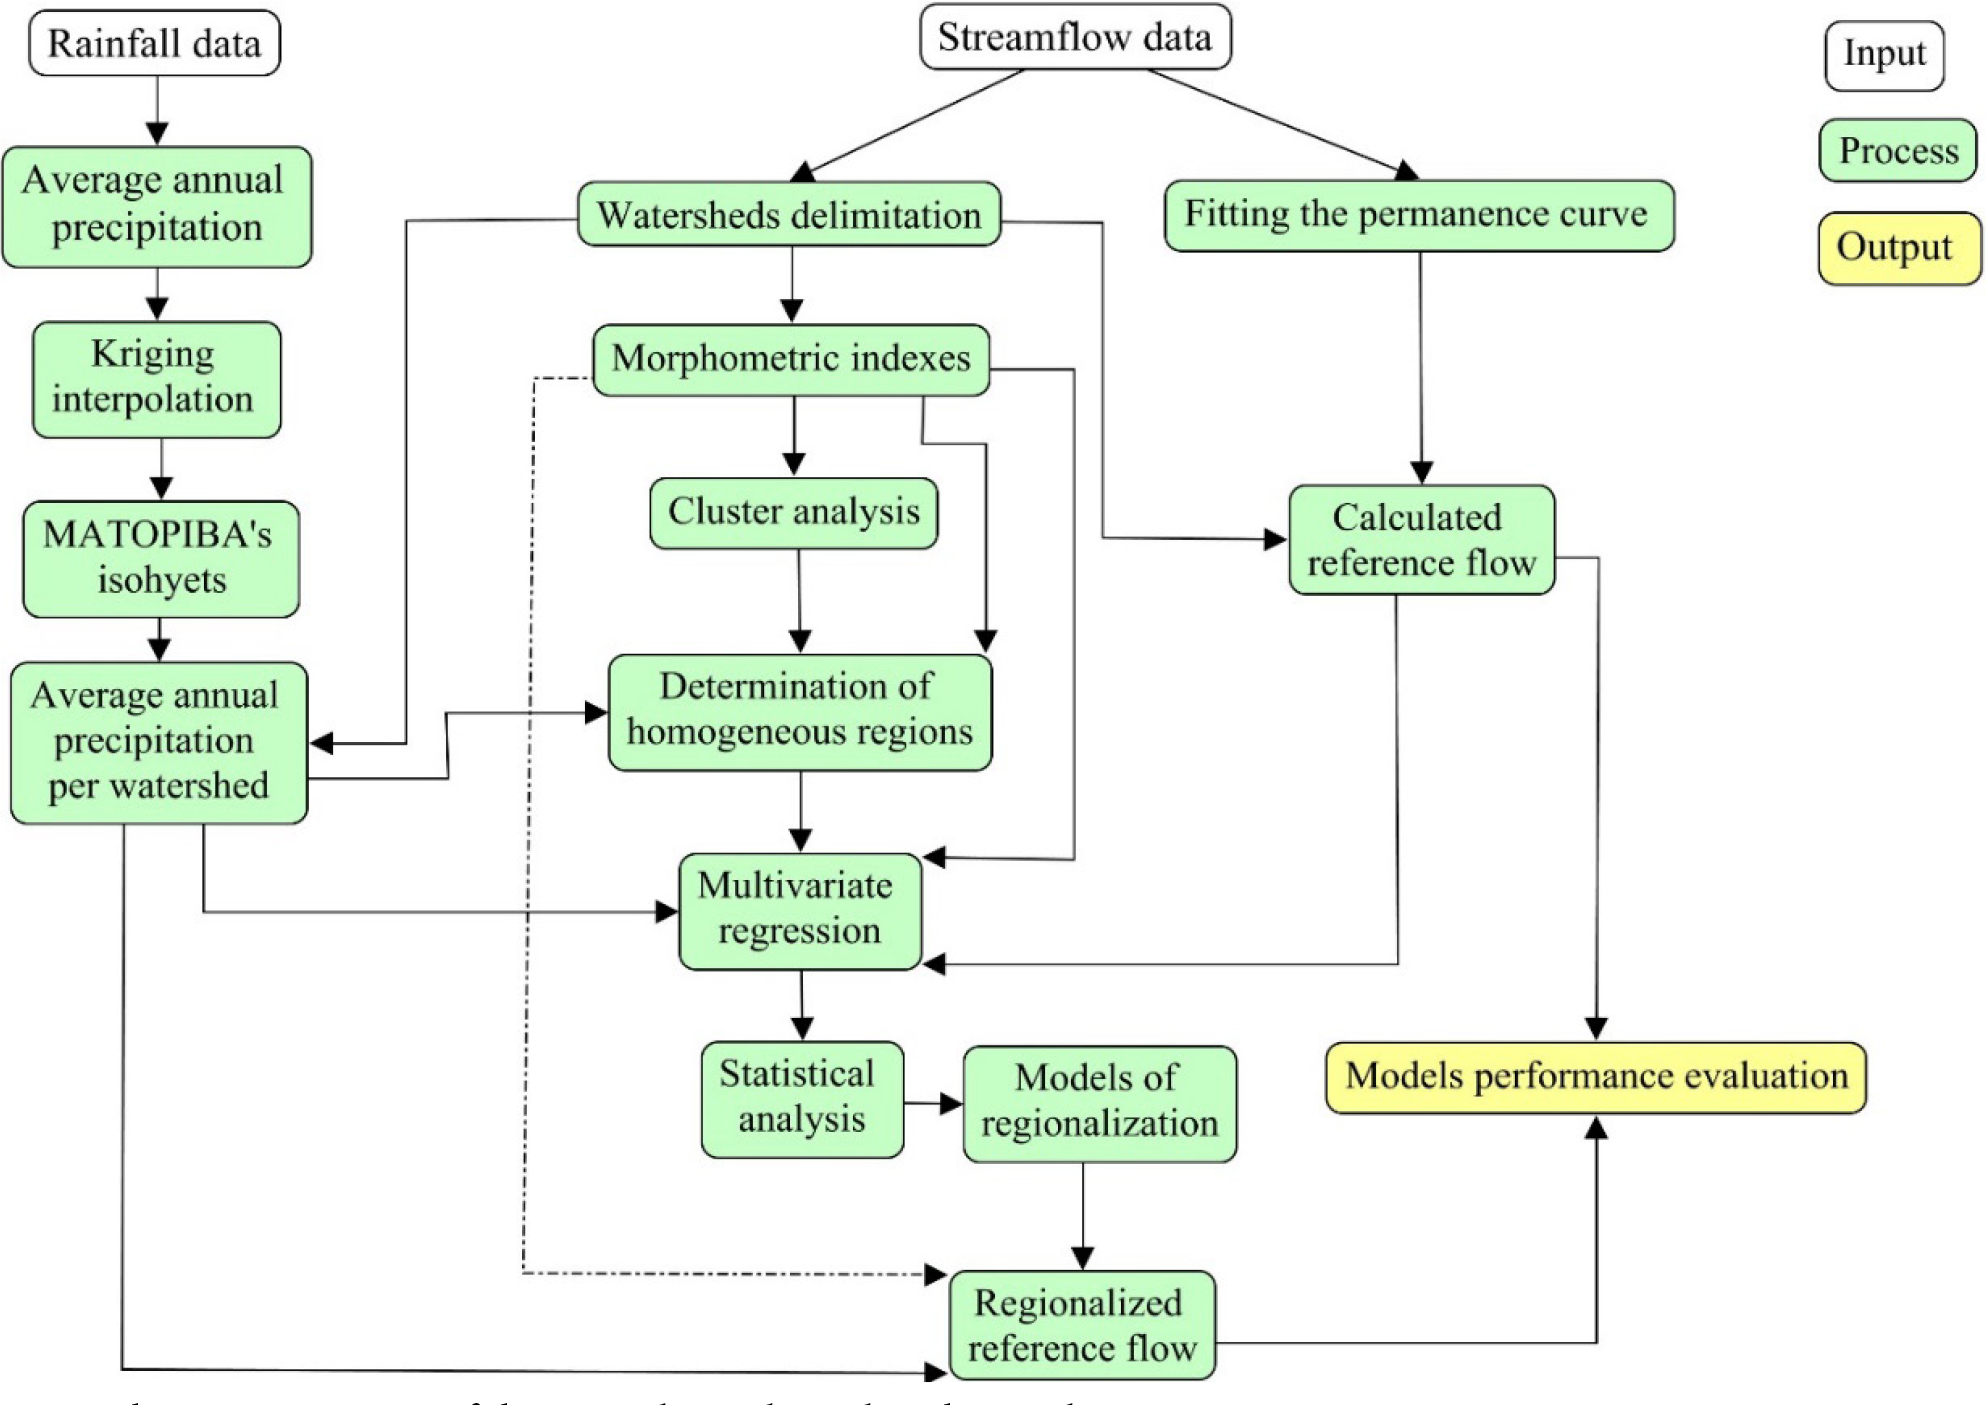
Figure 2 illustrates the conceptual framework of the regionalization procedure. Mean annual rainfall was calculated for each rainfall gauge using RStudio software. Experimental semivariograms were computed to obtain interpolation parameters for ordinary kriging, using QGIS version 3.16.11 with GRASS GIS 7.8.5. These tools were also employed to delineate the contribution area of each streamflow gauging station.
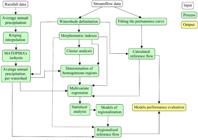
The SisCAH 1.0 software (SisCAH, 2022) was applied to generate flow-duration curves for each streamflow gauging station, enabling the calculation of reference streamflow indices commonly adopted in Brazil: Qm (long-term mean flow, m3 s⁻1), Q90 (flow exceeded 90% of the time, m3 s⁻1), Q95 (flow exceeded 95% of the time, m3 s⁻1), and Q7.10 (minimum average flow of seven consecutive days with a 10-year return period, m3 s⁻1). To facilitate comparisons, reference flows were converted to specific flows (L s⁻1 km⁻2) by dividing each flow value by the corresponding drainage area (Ribeiro et al., 2022).
Missing rainfall data were filled using the regional weighting (RW) method, as described by Paulhus & Kohler (1952), Bertoni & Tucci (2007), and Sabino & Souza (2023).
Mean annual rainfall per watershed was estimated using the isohyetal method (lines of equal rainfall). This approach consists of calculating a weighted average of rainfall values, based on the area occupied by each isohyet within the contribution area of each streamflow gauging station (Wolff & Duarte, 2021).
Morphometric characteristics of each basin were derived by delineating watershed boundaries using QGIS. This procedure allowed the estimation of drainage area, main channel length, total channel network length, and UTM (Universal Transverse Mercator) coordinates of the basin centroid (Rai et al., 2017). Morphometric indices were calculated as follows:
-
• Drainage density (Dd, km km⁻2) was defined as the ratio between the total length of the drainage network and the basin area;
-
• The Gravelius compactness coefficient (Gcc, dimensionless) describes basin shape by comparing the basin perimeter with that of a circle of equal area;
-
• The main channel slope (Is, m km⁻1) was calculated as the ratio between the elevation difference from source to outlet and the channel length.
To identify hydrologically homogeneous regions, morphometric indices and mean annual rainfall were used as input variables in a cluster analysis (Nishimura et al., 2022), performed in RStudio using the packages stats, cluster, factoextra, and NbClust.
Cluster analysis is a technique used to group similar elements and identify differences among them (Santiago et al., 2022; Charles et al., 2024). Similarity or dissimilarity between elements was quantified using the Manhattan distance (city-block distance), calculated as the sum of absolute differences between corresponding variables, equivalent to distances measured along orthogonal axes. This metric is less sensitive to outliers and is expressed in Eq. 1:
Where:
dij - representes the aggregated distance or difference between elements i and j;
xik and xjk - represent the values of the k-th variable for elements i and j, respectively;
p - denotes the total number of variables included in the distance calculation; and,
R - is the set of indices satisfying the condition r ≥ 1.
For the cluster analysis, a hierarchical method was adopted because it allows flexibility in the number of groups while incorporating the researcher’s knowledge of regional characteristics. In this approach, hierarchical clustering algorithms are constructed from a similarity or dissimilarity matrix, in which the most similar pair of elements is successively identified and merged.
Ward’s method (Ward, 1963) is a general classification algorithm that progressively groups n elements by minimizing an objective function at each of the (n - 2) merging steps. This algorithm is based on minimizing the loss of information resulting from grouping variables, quantified by the sum of square deviations of individual elements from the mean values of their assigned clusters. Ward’s method is particularly suitable because it relies on a statistically rigorous criterion and typically produces clusters with high internal homogeneity, comparable to those obtained using the farthest-neighbor method.
In the subsequent step, regression equations were developed to estimate streamflow for each hydrologically homogeneous region. The same variables used in the cluster analysis were adopted as independent variables in the multiple linear regression models.
Initially, a full model incorporating all available variables was fitted to estimate specific streamflow (Chang & Boyer, 1977). During this stage, models were developed to estimate Qmespr, Q90espr, Q95espr, and Q7.10espr. Eq. 2 presents the general form of the base model used for these calculations:
Where:
Qmespr - is the regionalized specific long-term mean flow rate (L s-1 km-2);
Dd - is the drainage density (km km-2);
L - is the length of the main channel (km);
Is - is the mean slope of the main channel (m km-1);
Gcc - is the Gravelius compactness coefficient (dimensionless);
P - is the total annual basin rainfall (mm per year);
Cx and Cy - are the UTM coordinates of the basin centroid (m); and,
a, b, c, d, e, f, and g - are the regression coefficients.
The same equation served as the basis for defining models to estimate the regionalized specific flow rates of Q90, Q95, and Q7,10. For each hydrologically homogeneous region, the optimal model was selected using the Akaike Information Criterion (AIC) through a backward elimination procedure, starting with a full model that included all candidate variables and sequentially removing variables until the lowest AIC value was obtained.
RStudio software was used to evaluate model residuals and verify the statistical assumptions of multiple linear regression, including: (i) normality assessed using the Shapiro-Wilk test (Shapiro & Wilk, 1965); (ii) independence of residuals evaluated using the Durbin-Watson test (Durbin & Watson, 1950); (iii) homoscedasticity examined using the Breusch-Pagan test (Breusch & Pagan, 1970); and (iv) multicollinearity assessed following Fox & Monette (1992). Model performance was evaluated by comparing estimated and observed streamflow values at each gauging station using the SisCAH software (Computational System for Hydrological Analyses), developed by the Water Resources Research Group (GPRH) at the Federal University of Viçosa (UFV), located in Viçosa, Minas Gerais state, Brazil.
Performance evaluation followed the guidelines proposed by Moriasi et al. (2015), which recommend the application of four quantitative statistical metrics: (i) Willmott’s concordance index (d) (Willmott, 1981); (ii) Nash-Sutcliffe efficiency (NSE) (Nash & Sutcliffe, 1970); (iii) percent bias (PBIAS); and (iv) coefficient of determination (R2).
Model performance was classified as very good, good, satisfactory, or unsatisfactory based on the qualitative criteria and corresponding quantitative thresholds proposed by Moriasi et al. (2015) (Table 1).
Qualitative performance criteria and quantitative thresholds for evaluating hydrological regionalization models
RESULTS AND DISCUSSION
Drainage areas were delineated for each previously described streamflow gauging station. Station 28850000, located in Araguatins, Tocantins state, on the Araguaia River, presented the largest drainage area, totaling 382,077.13 km2. In contrast, station 34230000, located in Monte Alegre do Piauí, Piauí state, on the Contrato Stream, showed the smallest drainage area, with an area of 801.65 km2.
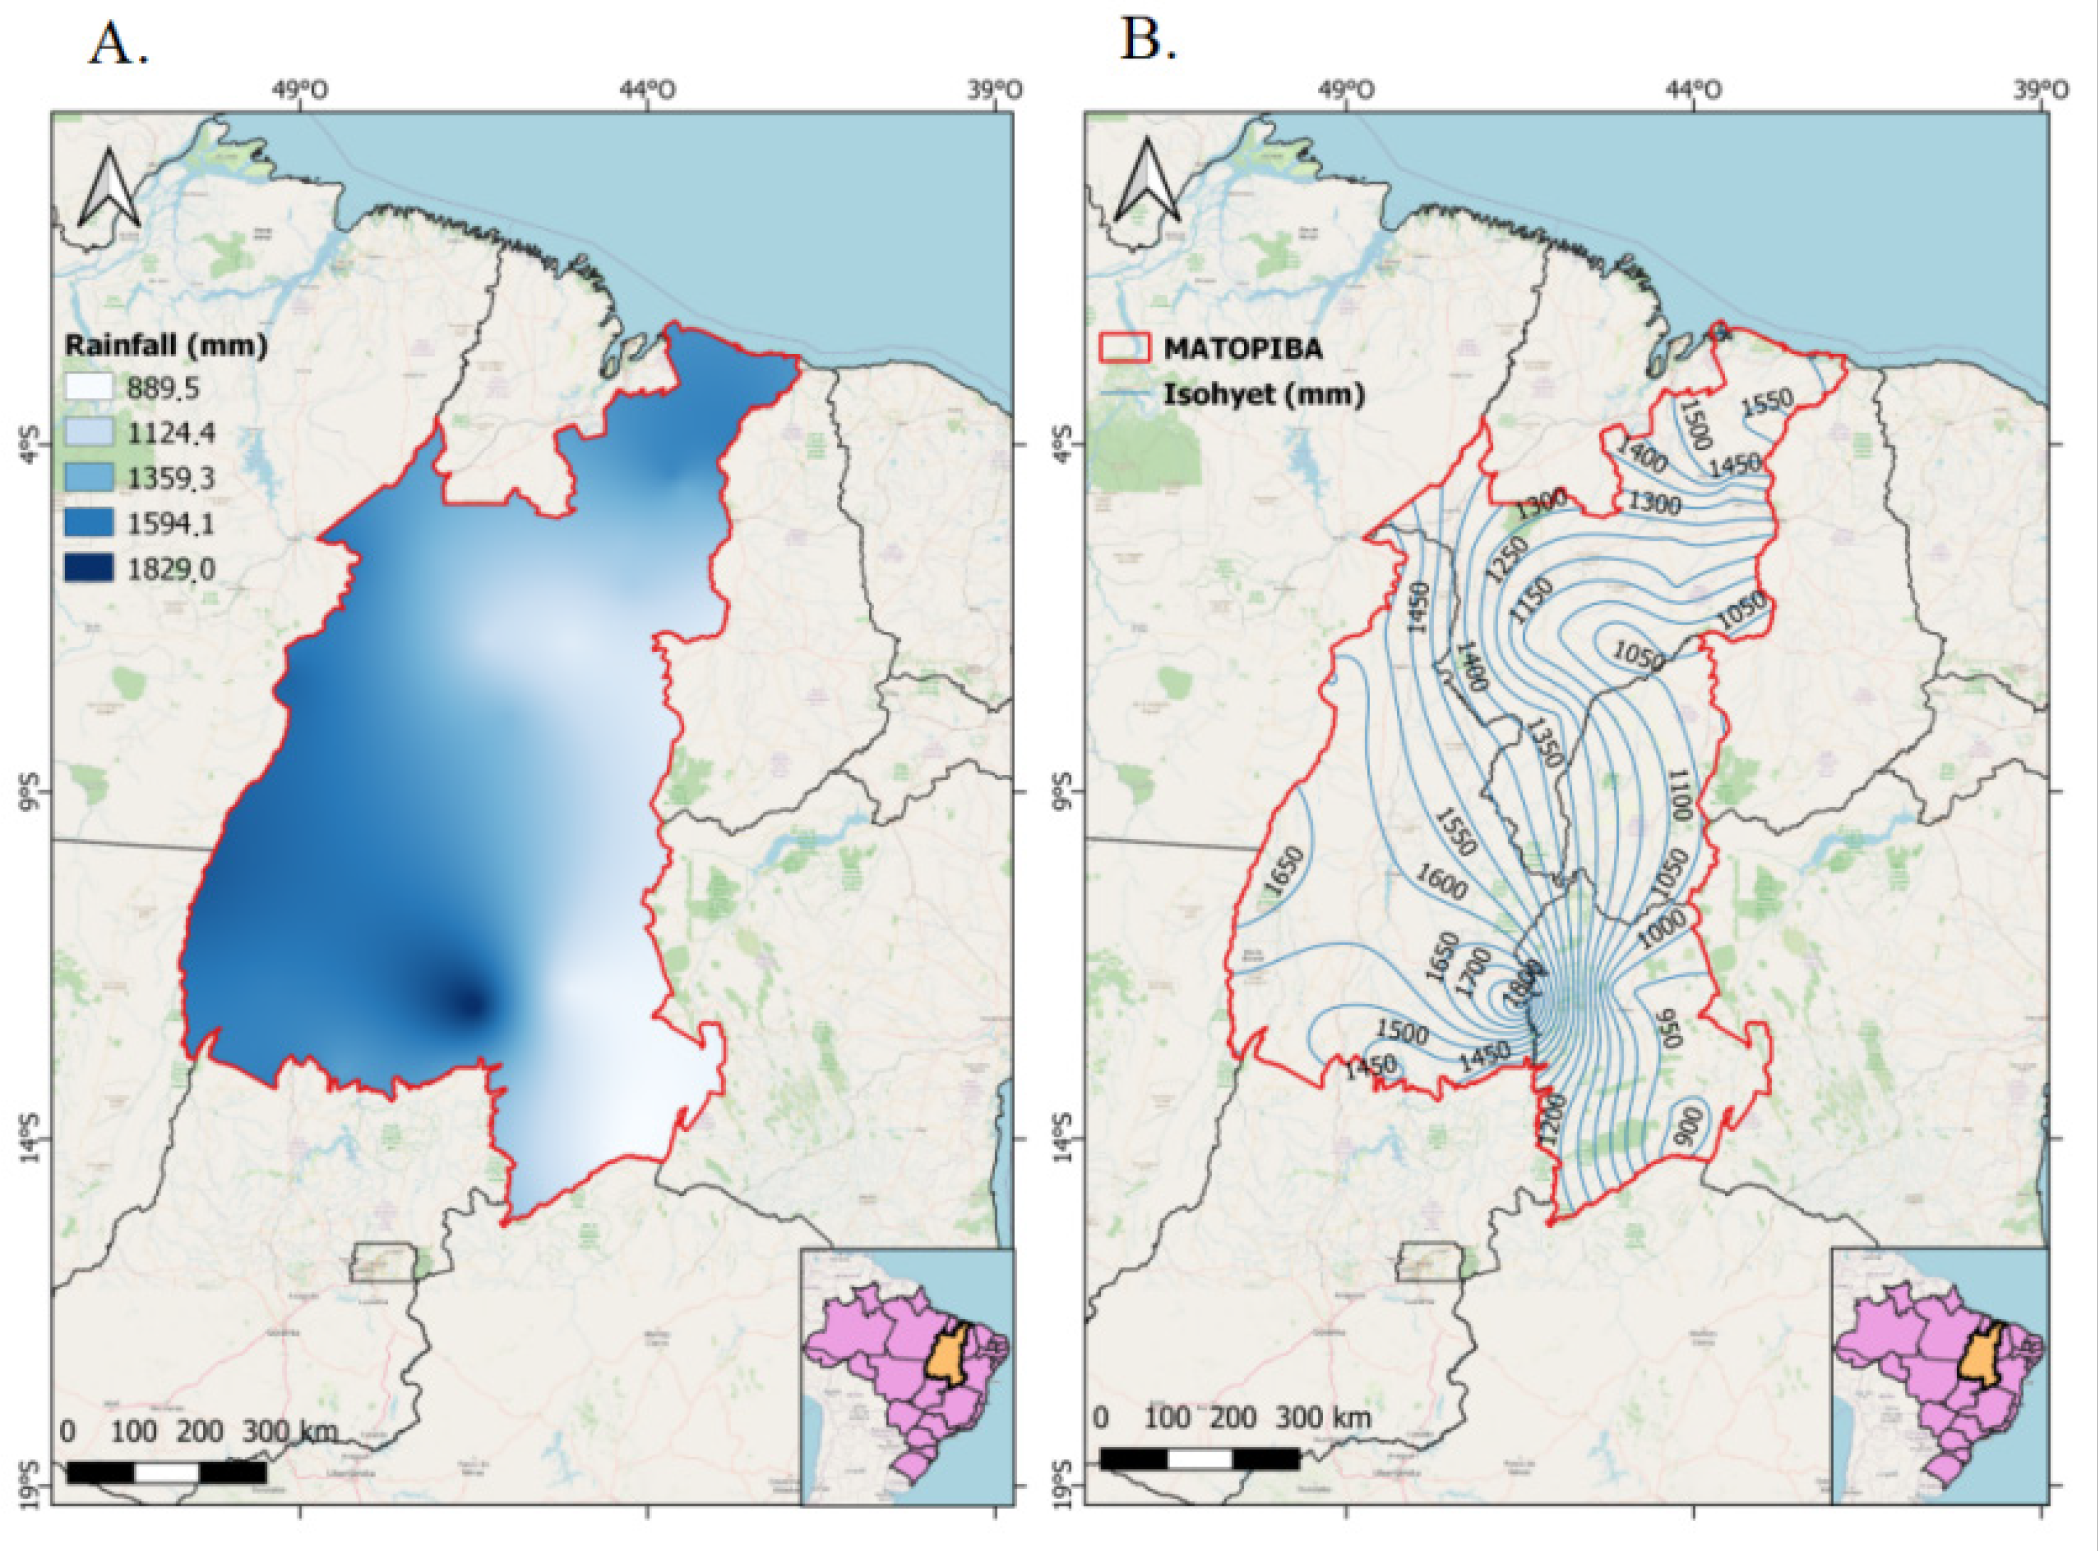
The parameters of the semivariogram (nugget effect, contribution, and range) as well as the fitted Matérn model for rainfall interpolation by ordinary kriging were obtained through semivariogram analysis of rainfall data (Shapiro & Wilk, 1965). Figure 3A displays the resulting rainfall interpolation map, while Figure 3B presents the isohyets derived from this map. Spatial interpolation indicates that mean annual rainfall across the region ranges from 889.5 mm per year in Bahia and Piauí to 1,829 mm per year in Tocantins and Maranhão. Using the isohyetal and basin delineation maps, mean annual rainfall was then calculated for each drainage area.
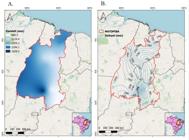
Spatial distribution of rainfall interpolated by ordinary kriging (A) and corresponding 50-mm isohyet lines in the MATOPIBA region (B)
The rainfall interpolation results are consistent with those reported by Kodama (1993) for the region, which indicated that the highest rainfall volumes occur in areas of lower elevation due to convective processes driven by hot, humid air masses originating from the Amazon region and moving toward higher latitudes. In contrast, lower rainfall volumes are observed in higher-altitude areas located within the Brazilian semi-arid zone, which is less directly influenced by this climatic mechanism (Manke et al., 2022).
Cluster analysis was applied to delineate hydrologically homogeneous regions based on multiple independent variables, including the UTM latitude and longitude of basin centroids, mean slope of the main channel, drainage density, main channel length, Gravelius compactness coefficient, and mean annual rainfall within each contribution area.
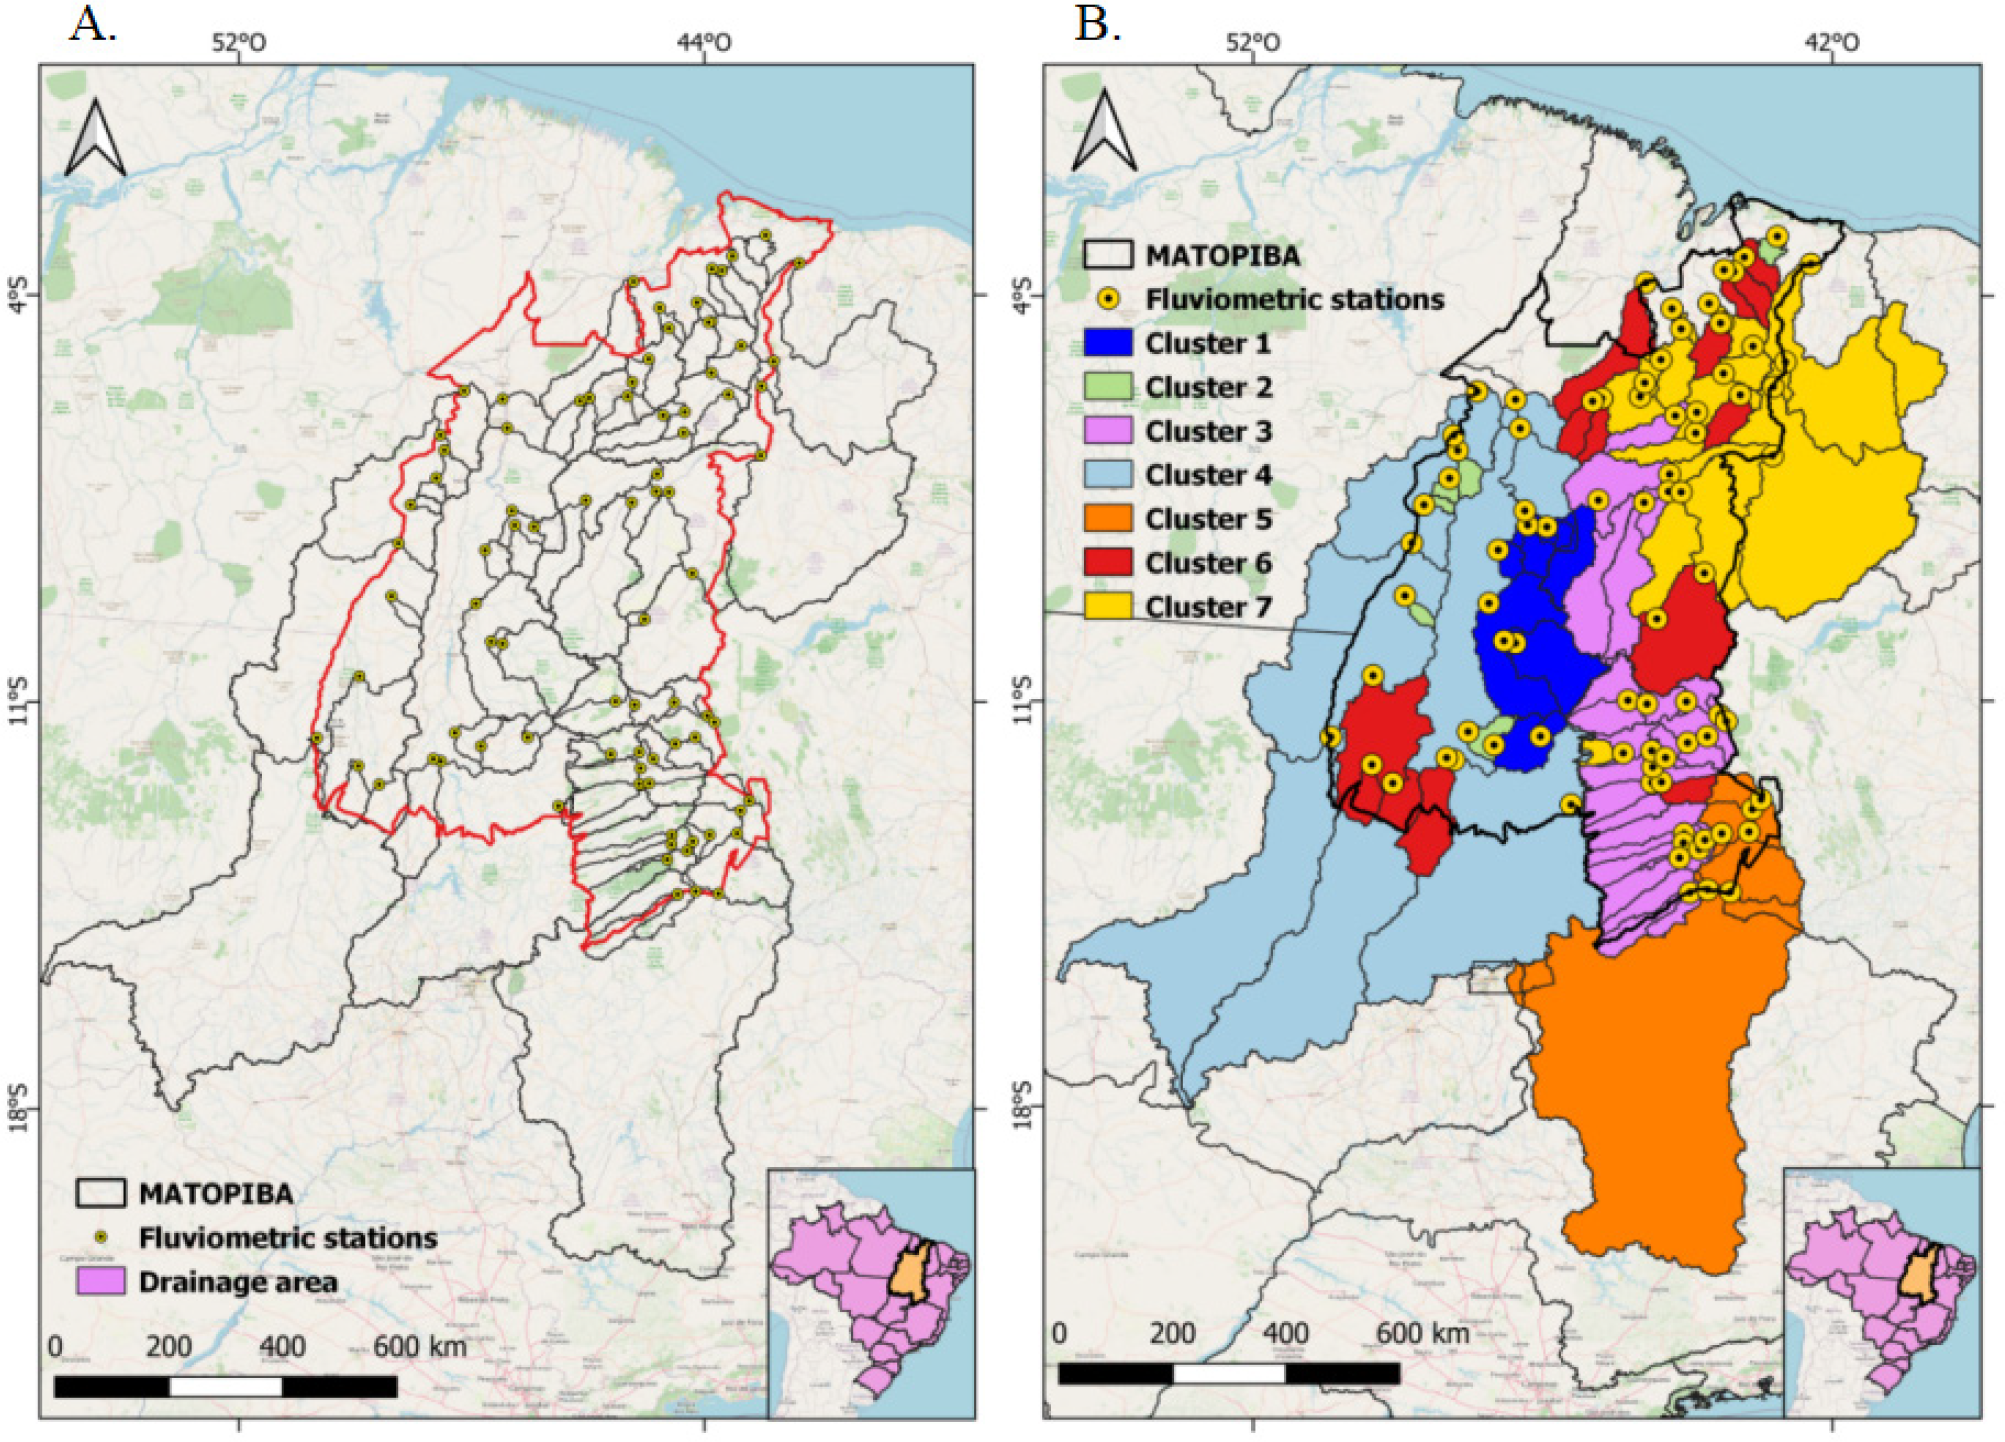
Table 2 presents drainage area values for each streamflow gauging station within the study area, while basin delineations are illustrated in Figure 4. Basins assigned to clusters 4, 5, and 7 exhibit the largest drainage areas, which is explained by the location of their headwaters outside the MATOPIBA boundaries.
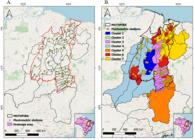
Streamflow gauging stations in MATOPIBA region (A) and drainage area and hydrologically homogeneous regions based on cluster analysis (B)
The hierarchical analysis indicated that the optimal number of clusters was four; however, owing to the spatial extent of the study area and the presence of three distinct Brazilian biomes, one hierarchical level was further subdivided, resulting in the delineation of seven hydrologically homogeneous regions for MATOPIBA. Figure 4B illustrates the spatial distribution of these clusters across the study area.
Although the study area encompasses a large and environmentally diverse region with three different biomes, the number of hydrologically homogeneous regions remains relatively limited. Approximately 33.4% of MATOPIBA consists of gently rolling terrain with slopes ranging from 3 to 10%, while 42.4% is characterized by plateaus and tablelands with slopes between 0 and 5% (IPABHI, 2019). Despite this variability, basins within individual clusters are spatially proximate, with the exception of cluster 6, which exhibits greater dispersion.
Multiple linear regression was employed to develop models for estimating reference streamflow within each hydrologically homogeneous region. Regressions were performed independently for the seven delineated regions using different combinations of independent variables (Dd, L, Is, Gcc, P, Cx, and Cy) and dependent variables (Qmespr, Q90espr, Q95espr, and Q7.10espr). Model selection was based on Student’s t-test at a significance level of p ≤ 0.05. Four regionalization equations were derived for each region, resulting in a total of 28 equations. Table 3 summarizes the coefficients of determination and additional performance indices for each equation.
Regression equation parameters for regionalized specific flow estimation in each hydrologically homogeneous region
The developed models did not exhibit a consistent pattern regarding the choice of independent variables, as some variables were excluded due to lack of statistical significance (p ≤ 0.05) or multicollinearity with other predictors. This outcome indicates the absence of a standardized approach for developing hydrological regionalization models.
Across the MATOPIBA regions, the regionalization models showed no uniform structure in terms of explanatory variables, except for drainage density (Dd), which was included in all models. A review of previous streamflow regionalization studies likewise suggests that no clear rule exists for selecting explanatory (independent) variables to be incorporated into streamflow estimation models.
Baena et al. (2004) developed streamflow regionalization models for the Paraíba do Sul River basin using five morphometric variables and total annual rainfall, concluding that basin area and drainage density strongly influenced Q95espr. Silva et al. (2009) evaluated five morphometric parameters and rainfall in the São Francisco River basin and identified drainage density and total annual rainfall as significant predictors of Q7.10espr. In Rio Grande do Sul, Beskow et al. (2016) applied artificial intelligence techniques for Q90espr regionalization and identified drainage area as the sole relevant explanatory variable, a result also reported by Rodrigues et al. (2021) for the Tocantins River basin. According to Charles et al. (2024), increasing the number of gauging stations and incorporating region-specific morphometric and climatic variables can improve model performance. In the present study, drainage density emerged as the most recurrent independent variable, likely reflecting the influence of regional relief on rainfall distribution and runoff generation.
The qualitative classification presented in Table 4 was applied to interpret model performance, with evaluation indices defined in Table 1.
Performance classification criteria for regionalized specific flows based on statistical indices recommended for hydrological regionalization models
The regionalization models performed satisfactorily for most clusters; however, reduced performance was observed for clusters 3, 6, and 7. In cluster 3, wide variability in rainfall distribution and latitude contributed to increased heterogeneity, which likely affected model accuracy. For cluster 6, weaker performance was associated with greater dispersion of basin characteristics within the group, reflecting the spatial distribution of basins that compose this cluster. The lower predictive performance observed for cluster 7 is attributed to the wide range of main channel lengths, which reduced model accuracy.
As shown in Table 3, the combined drainage area of clusters 3, 6, and 7 accounts for 35.3% of the total drainage area represented by streamflow gauging stations within the MATOPIBA boundaries. This finding highlights the importance of considering the applicability limits of the proposed models when estimating streamflow in areas corresponding to these regions (Odusanya et al., 2022).
The regionalization models developed for long-term mean specific flow (Qmespr) showed good agreement with observed values, with performance indices predominantly classified as very good or good. Nevertheless, models for hydrologically homogeneous regions 3 and 6 exhibited lower performance, with NSE and R2 values below 0.70. These results indicate reduced predictive capability, likely influenced by rainfall variability and latitude range in region 3 (Panthi et al., 2021) and by basin dispersion in region 6.
Models developed for other reference flows (Q90espr, Q95espr and Q7.10espr) exhibited performance patterns similar to those observed for Qmespr. However, reduced predictive capacity persisted for regions 3, 6, and 7, which can be attributed to factors such as variability in main channel length, ranging from 42.5 to 1,556.7 km.
CONCLUSIONS
-
1. The hydrological regionalization of the MATOPIBA region identified seven distinct hydrologically homogeneous regions, highlighting the climatic and hydrological diversity of the area. These findings provide important support for sustainable planning, integrated water resources management, and mitigation of regional environmental impacts.
-
2. The models developed in this study exhibited satisfactory agreement, accuracy, precision, and representation of mean flow magnitudes, as well as good performance across the evaluation indices used to compare observed and estimated streamflow values.
-
3. Further studies are recommended to enhance model performance, including seasonal rainfall analyses to enable development of season-specific models, as well as incorporation of additional streamflow gauging stations and new independent variables potentially correlated with river discharge in the region.
-
1
Research developed at Universidade de São Paulo/Escola Superior de Agricultura Luiz de Queiroz, Piracicaba, SP, Brazil.
-
Financing statement:
The Coordination for the Improvement of Higher Education Personnel (CAPES; grant no. 33002037023P0/2021) and the São Paulo Research Foundation (FAPESP; grant no. 2019/07665-4) provided financial support to the Center for Artificial Intelligence (C4AI-USP), in partnership with IBM Corporation and the University of São Paulo.
-
Ref. 295667
Acknowledgments:
The authors thank Mr. Davi de Oliveira Custodio and Mr. Jaime Costa Mota, from Embrapa Territorial, for their technical support and for providing information on the study region. The authors also acknowledge the National Institute of Science, Technology and Engineering for Irrigation (INCT-EI).
Data availability statement:
The authors declare that there are no data underlying the text.
LITERATURE CITED
-
Baena, L. G. N. et al. Regionalização de vazões com base em modelo digital de elevação para a bacia do Rio Paraíba do Sul. Engenharia Agrícola, v.24, p.612-624, 2004. https://doi.org/10.1590/S0100-69162004000300013
» https://doi.org/10.1590/S0100-69162004000300013 -
Batista, M. L. B. et al. Análise fatorial e espacial da modernização agrícola no MATOPIBA. Revista de Economia e Sociologia Rural, v.61, e261413, 2023. https://doi.org/10.1590/1806-9479.2022.261413
» https://doi.org/10.1590/1806-9479.2022.261413 -
Beck, H. E. et al. Global fully distributed parameter regionalization based on observed streamflow from 4,229 headwater catchments. Journal of Geophysical Research: Atmospheres, v.125, e2019JD031485, 2020. https://doi.org/10.1029/2019JD031485
» https://doi.org/10.1029/2019JD031485 - Bertoni, J. C.; Tucci, C. E. M. Precipitação. In: Tucci, C. E. M. Hidrologia: Ciência e aplicação. Porto Alegre: UFRGS. 2007. Cap.7, p.177-241.
-
Beskow, S. et al. Artificial intelligence coupled with seasonality measures for hydrological regionalization of Q90 under Brazilian conditions. Journal of Hydrology, v.541, p.1406-1419, 2016. https://doi.org/10.1016/j.jhydrol.2016.08.046
» https://doi.org/10.1016/j.jhydrol.2016.08.046 -
Breusch, T.; Pagan, A. Simple test for heteroscedasticity and random coefficient variation. Econométrica, v.47, p.1297-1294, 1970. https://dx.doi.org/10.2307/1911963
» https://dx.doi.org/10.2307/1911963 -
Chang, M.; Boyer, D. G. Estimates of low flows using watershed and climatic parameters. Water Resources Research, v.13, p.997-1001, 1977. https://doi.org/10.1029/WR013i006p00997
» https://doi.org/10.1029/WR013i006p00997 -
Charles, T. S. et al. Cluster analysis and hydrological regionalization for Brazilian states. Revista Brasileira de Engenharia Agricola e Ambiental, v.28, e277005, 2024. http://dx.doi.org/10.1590/1807-1929/agriambi.v28n11e277005
» http://dx.doi.org/10.1590/1807-1929/agriambi.v28n11e277005 -
CONAB - Companhia Nacional de Abastecimento. Boletim safra de grãos, Safra 2022/2023. 7° levantamento, abril de 2023, 107p. 2024. Available at: <https://www.conab.gov.br/component/k2/item/download/47017_2cc607edd5428e14b76bd6e988cd358c>. Accessed on: Jul. 2024.
» https://www.conab.gov.br/component/k2/item/download/47017_2cc607edd5428e14b76bd6e988cd358c -
Duarte, S. N. et al. Streamflow regionalization in Brazil: Traditional methods and state of art. Revista Brasileira de Engenharia Agricola e Ambiental, v.28, e276836, 2024. http://dx.doi.org/10.1590/1807-1929/agriambi.v28n9e276836
» http://dx.doi.org/10.1590/1807-1929/agriambi.v28n9e276836 -
Durbin, J.; Watson, G. Testing for serial correlation in least squared regression. Biometrika, v.37, p.409-428, 1950. https://doi.org/10.2307/2332391
» https://doi.org/10.2307/2332391 -
Evangelista, B. A. et al. Zoneamento de risco climático para determinação de épocas de semeadura da soja na região MATOPIBA. Embrapa Pesca e Aquicultura - Boletim de Pesquisa e Desenvolvimento. 2017. 44p. Available at: https://www.embrapa.br/pesca-e-aquicultura/busca-de-publicacoes/-/publicacao/1078131 Accessed on: Jul. 2024.
» https://www.embrapa.br/pesca-e-aquicultura/busca-de-publicacoes/-/publicacao/1078131 -
Fenicia, F.; Meibiner, D.; McDonnell, J. J. Modeling streamflow variability at the regional scale: (2) development of a bespoke distributed conceptual model. Journal of Hydrology, v.605, 127286, 2022. http://doi.org/10.1016/j.jhydrol.2021.127286
» http://doi.org/10.1016/j.jhydrol.2021.127286 -
Fox, J.; Monette, G. Generalized collinearity diagnostics. Journal of American Statistics Association, v.87, p.178-183, 1992. http://doi.org:10.1080/01621459.1992.10475190
» http://doi.org:10.1080/01621459.1992.10475190 -
Guo, Y. et al. Regionalization of hydrological modeling for predicting streamflow in ungauged catchments: a comprehensive review. Wiley Interdisciplinary Reviews-Water, v.8, 1487, 2020. http://doi.org/10.1002/wat2.1487
» http://doi.org/10.1002/wat2.1487 -
He, Y.; Bárdossy, A.; Zehe, E. A review of regionalization for continuous streamflow simulation. Hydrological Earth Systems Science, v.15, p.3539-3552, 2011. http://doi.org/10.5194/hess-15-3539-2011
» http://doi.org/10.5194/hess-15-3539-2011 -
IPABHI - Instituto de Pesquisa e Apoio ao Bioma Hidrográfico. Ciências Ambientais - v.3 - Mapa geomorfológico do MATOPIBA, 2019. Avaiable on: <https://ipabhi.org/arquivos/livro%E2%80%91ciencias-ambientais-vol-3-2019.pdf> Accessed on: Nov 2025.
» https://ipabhi.org/arquivos/livro%E2%80%91ciencias-ambientais-vol-3-2019.pdf -
Kittel, C. M. M. et al. Informing hydrological models of poorly gauged river catchments - A parameter regionalization and calibration approach. Journal of Hydrology, v.587, 124999, 2020. http://doi.org/10.1016/j.jhydrol.2020.124999
» http://doi.org/10.1016/j.jhydrol.2020.124999 -
Kodama, Y. M. Large-scale common features of sub-tropical precipitation zones (the Baiu Frontal Zone, the SPCZ, and the SACZ). Part II: Conditions of the circulations for generating the STCZs. Journal of the Meteorological Society of Japan, v.71, p.581-610, 1993. https://doi.org/10.2151/jmsj1965.71.5_581
» https://doi.org/10.2151/jmsj1965.71.5_581 -
Lima, S. C. de. et al. Response of semiarid vegetation to agricultural drought determined by indices derived from MODIS satellite. Revista Brasileira de Engenharia Agricola e Ambiental, v.27, p.632-642, 2023. http://dx.doi.org/10.1590/1807-1929/agriambi.v27n8p632-642
» http://dx.doi.org/10.1590/1807-1929/agriambi.v27n8p632-642 -
Manke, E. B. et al. Seasonal intensity-duration-frequency relationships for Pelotas, Rio Grande do Sul, Brazil. Revista Brasileira de Engenharia Agricola e Ambiental, v.26, p.85-90, 2022. http://dx.doi.org/10.1590/1807-1929/agriambi.v26n2p85-90
» http://dx.doi.org/10.1590/1807-1929/agriambi.v26n2p85-90 -
Mizukami, N. et al. Towards seamless large-domain parameter estimation for hydrologic models. Water Resources Research, v.53, p.8020-8040, 2017. http://doi.org/10.1002/2017WR020401
» http://doi.org/10.1002/2017WR020401 -
Moriasi, D. N. et al. Hydrologic and water quality models: Performance measures and evaluation criteria. American Society of Agricultural and Biological Engineers, v.58, p.1763-1785, 2015. http://doi.org/10.13031/trans.58.10715
» http://doi.org/10.13031/trans.58.10715 - Nascimento, D.; Novais, G. Clima do Cerrado: Dinâmica atmosférica e características, variabilidade e tipologias climáticas. Revista de Geografia, v.9, e922021, 2020.
-
Nash, J. E.; Sutcliffe, J. V. River flow forecasting through conceptual models: Part 1. A discussion of principles. Journal of Hydrology, v.10, p.282-290, 1970. https://doi.org/10.1016/0022-1694(70)90255-6
» https://doi.org/10.1016/0022-1694(70)90255-6 -
Nishimura, R. et al. Methods for characterizing groundwater resources with sparse in situ data. Hydrology, v.9, 134, 2022. https://doi.org/10.3390/hydrology9080134
» https://doi.org/10.3390/hydrology9080134 -
Odusanya, A. E. et al. Using a regionalization approach to evatuate streamflow simulated by an ecohydrological model calibrated with global land surface evaporation from remote sensing. Journal of Hydrology: Regional Studies, v.40, 101042, 2022. https://doi.org/10.1016/J.EJRH.2022.101042
» https://doi.org/10.1016/J.EJRH.2022.101042 -
Panthi, J. et al. Hydrologic regionalization under data scarcity: Implications for streamflow prediction. Journal of Hydrologic Engineering, v.26, 05021022, 2021. https://doi.org/10.1061/(ASCE)HE.1943-5584.0002121
» https://doi.org/10.1061/(ASCE)HE.1943-5584.0002121 -
Paulhus, J. L. H.; Kohler, M. A. Interpolation of missing precipitation records. Monthly Weather Review, v.80, p.129-133, 1952. https://doi.org/10.1175/1520-0493(1952)080<0129:IOMPR>2.0.CO;2
» https://doi.org/10.1175/1520-0493(1952)080<0129:IOMPR>2.0.CO;2 -
Peel, M. C. et al. Updated world map of the Köppen-Geiger climate classification. Hydrology and Earth System Sciences, v.11, p.1633-1644, 2007. https://doi.org/10.5194/hess-11-1633-2007
» https://doi.org/10.5194/hess-11-1633-2007 -
Rai, P. K. et al. A GIS-based approach in drainage morphometric analysis of Kanhar River Basin, India. Applied Water Science, v.7, p.217-232, 2017. https://link.springer.com/article/10.1007/s13201-014-0238-y
» https://link.springer.com/article/10.1007/s13201-014-0238-y -
Ranke, B. S. et al. Estimating irrigation demand based on seasonal climate forecast. Revista Brasileira de Engenharia Agricola e Ambiental, v.29, e284685, 2025. https://doi.org/10.1590/1807-1929/agriambi.v29n4e284685
» https://doi.org/10.1590/1807-1929/agriambi.v29n4e284685 -
Ribeiro, R. B. et al. Stream flow regiontalization considering water balance with actual evapotranspiration estimated from remote sensing. Journal of Hydrologic Engineering, v.27, 04022012, 2022. https://doi.org/10.1061/(ASCE)HE.1943-5584.0002183
» https://doi.org/10.1061/(ASCE)HE.1943-5584.0002183 -
Rodrigues, J. A. M. et al. Hydrological regionalization of streamflow for the Tocantins River basin in Brazilian Cerrado biome. Revista Ambiente Água, v.16, e2716, 2021. https://doi.org/10.4136/ambi-agua.2716
» https://doi.org/10.4136/ambi-agua.2716 -
Sabino, M.; Souza, A. P. Gap-filling meteorological data series using GapMET software in the state of Mato Grosso, Brazil. Revista Brasileira de Engenharia Agricola e Ambiental, v.27, p.149-156, 2023. http://dx.doi.org/10.1590/1807-1929/agriambi.v27n2p149-156
» http://dx.doi.org/10.1590/1807-1929/agriambi.v27n2p149-156 -
Santiago, D. de B. et al. Interactions of environmental variables and water use efficiency in the Matopiba region via multivariate analysis. Sustainability, v.14, 8758, 2022. http://doi.org/10.3390/su14148758
» http://doi.org/10.3390/su14148758 - Shapiro, S. S.; Wilk, M. B. An analysis of variance test for normality (complete samples). Biometrika, v.52, p.591-611, 1965.
-
Silva, D. D. et al. Avaliação de metodologias de regionalização de vazões mínimas de referência para bacia do Rio São Francisco. Revista Engenharia na Agricultura, v.17, p.392-403, 2009. https://doi.org/10.13083/reveng.v17i5.166
» https://doi.org/10.13083/reveng.v17i5.166 -
SISCAH - Sistema computacional para análise hidrológica. Grupo de Pesquisas em Recursos Hídricos (GPRH - UFV), Viçosa. 2022. Avaiable on: <http://www.gprh.ufv.br/?area=softwares>. Accessed on: Jul. 2024.
» http://www.gprh.ufv.br/?area=softwares -
Ward, J. H. Hierarchical grouping to optimize an objective function. Journal of the American Statistical Association, v.58, p.236-244, 1963. https://doi.org/10.2307/2282967
» https://doi.org/10.2307/2282967 -
Willmott, C. J. On the validation of models. Physical Geography, v.2, p.184-194, 1981. https://doi.org/10.1080/02723646.1981.10642213
» https://doi.org/10.1080/02723646.1981.10642213 -
Wolff, W.; Duarte, S. N. Toward geoestatístical unbiased predictions of flow duration curves at ungauged basins. Advances in Water Resources, v.152, 103915, 2021. https://doi.org/10.1016/J.ADVWATRES.2021.103915
» https://doi.org/10.1016/J.ADVWATRES.2021.103915 -
Xiong, L.; Zeng, L. Impacts of introducing remote sensing soil moisture in calibrating a distributed hydrological model for streamflow simulation. Water, v.11, 666, 2019. http://doi.org/10.3390/w11040666
» http://doi.org/10.3390/w11040666 -
Xu, Z. et al. A two-step calibration framework for hydrological parameter regionalization based on streamflow and remote sensing evapotranspiration. Journal of Hydrology, v.613, 128320, 2022. http://doi.org/10.1016/j.jhydrol.2022.128320
» http://doi.org/10.1016/j.jhydrol.2022.128320 -
Yang, Y. et al. Dependence of regionalization methods on the complexity of hydrological models in multiple climatic regions. Journal of Hydrology, v.582, 124357, 2020. http://doi.org/10.1016/j.jhydrol.2019.124357
» http://doi.org/10.1016/j.jhydrol.2019.124357
Edited by
-
Editors:
Antônio Gustavo de Luna Souto & Carlos Alberto Vieira de Azevedo