 Numerical Simulation with Local Climate Zones of Urban Heat Island in the Metropolitan Area of São Paulo
Abstract
The urban heat island (UHI) is a well-known consequence of urbanization on local climate. This study investigates the UHI in the Metropolitan Area of São Paulo (MASP), focusing on urban morphology and meteorological conditions. We utilized the Weather Research and Forecasting (WRF) model, incorporating the Local Climate Zones (LCZ) classification, to analyze simulations for September from 2014 to 2023. Results reveal a distinct southeast-to-northwest temperature gradient, where locations in the same LCZ class showed different temperatures based on their position. Proximity to the coast on the southeastern side provided cooling effects from the sea and valley-mountain breezes. UHI intensity was greater at night under clear skies and calm winds, peaking around 18:00 LT. The choice of rural reference point had a significant impact on the measured UHI magnitude. Furthermore, densely built-up areas (LCZ 1-3) retained more heat overnight compared to more open zones (LCZ 6, 9). These findings underscore the importance of comprehensive UHI assessments, which must consider urban morphology, meteorological conditions, regional circulation patterns, and the careful selection of rural reference points.
Keywords
urban heat island; Local Climate Zones; WRF
Resumo
A ilha de calor urbana (ICU) é uma das consequências mais conhecidas da urbanização no clima local. Este estudo investiga a ICU na Região Metropolitana de São Paulo (RMSP), com foco na morfologia urbana e nas condições meteorológicas. Para tanto, utilizou-se o modelo Weather Research and Forecasting (WRF) com a metodologia de Zonas Climáticas Locais (ZCL) para executar simulações nos meses de setembro de 2014 a 2023. Os resultados apontam para um gradiente de temperatura de sudeste para noroeste na RMSP, de modo que locais na mesma categoria de ZCL apresentaram temperaturas diferentes segundo a localização. A proximidade com a costa gerou efeitos de resfriamento pelas brisas marítima e de vale-montanha. A intensidade da ICU foi maior à noite sob condições de céu claro e ventos calmos, com pico predominantemente às 18:00 HL. A escolha do ponto de referência rural impactou significativamente a magnitude e o comportamento da ICU. Além disso, áreas densamente construídas (ZCL 1-3) retiveram mais calor durante a noite em comparação com zonas mais abertas (ZCL 6, 9). Estes resultados destacam que investigações de ICU devem considerar a morfologia urbana, as condições meteorológicas, os padrões de circulação regional e a seleção dos pontos de referência rurais.
Palavras-chave
ilha de calor urbana; Zonas Climáticas Locais; WRF
1. Introduction
Urban land cover transformation is a global phenomenon that has intensified in recent decades. Estimates suggest that by the year 2050, approximately 68% of the world's population will be concentrated in urban areas (UN-Habitat, 2022). Rapid and unplanned urbanization causes various environmental impacts and increases risks to urban populations. Climate change further exacerbates these risks by intensifying extreme weather events and natural disasters (IPCC, 2021). The lack of mitigation and adaptation strategies also exacerbates human vulnerability (Dodman et al., 2022).
One of the most recognized consequences of urbanization is the urban heat island (UHI) (Souch and Grimmond, 2006), characterized by higher air temperatures in urban areas compared to surrounding rural regions (Oke, 1987). This phenomenon stems primarily from differences in land cover that alter the energy and radiation balance. Key contributing factors include greater absorption of solar radiation, heat retention within urban canyons, delayed heat release from buildings, and anthropogenic heat emissions (Oke, 1982).
In this regard, urban form and function have a significant influence on the local climate. Characteristics such as building density and height, street width, construction materials, vegetation cover, and the emission of heat and gases shape urban weather and climate patterns. Understanding these interactions is essential for redesigning cities and planning sustainable urban development (Demuzere et al., 2022a).
To classify urban spaces, the Local Climate Zones (LCZ) framework, developed by Stewart and Oke (2012), groups areas based on surface cover characteristics at the horizontal scale. This classification incorporates parameters like sky view factor, building height, built-up percentage, surface permeability, terrain roughness, and albedo.
Beyond morphology, UHI development is also affected by synoptic meteorological conditions. The most favorable scenarios for the development of the UHI typically occur during clear skies and calm winds (Oke et al., 2017; WMO, 2023). Thus, UHI is influenced not only by local features but also by broader-scale atmospheric phenomena, background climate, topography, water bodies, and human activities.
In Brazil, particularly in São Paulo and the Metropolitan Area of São Paulo (MASP), previous studies have documented a wide variability in the temporal and spatial characteristics of the UHI, highlighting the complexity of the phenomenon in coastal and highly heterogeneous urban environments. One recurring point of divergence in the literature concerns the timing of maximum UHI intensity (UHII). While some observational and modeling studies reported predominantly daytime peaks, typically occurring between mid and late afternoon (Ferreira et al., 2012; Ferreira et al., 2013; Lima and Rueda, 2018; Ribeiro et al., 2018), others identified stronger nighttime UHI, often attributed to anthropogenic heat release, urban heat storage, and reduced nocturnal cooling (Freitas et al., 2007; Umezaki, 2020). These contrasting findings suggest a strong sensitivity of UHI temporal behavior to local meteorological conditions, model configuration, and methodological choices.
Another important factor highlighted in previous studies is the influence of mesoscale circulations, particularly the sea breeze, on UHI development in the MASP. Lima and Rueda (2018) and Ribeiro et al. (2018) demonstrated that sea breeze penetration can modulate both the magnitude and timing of UHI, depending on its inland propagation and interaction with urban morphology. In addition, several studies emphasized that UHI intensity is highly sensitive to the choice of rural reference point, with different rural locations leading to substantially different estimates of UHI magnitude and diurnal cycle (Ribeiro et al., 2018; Umezaki, 2020). At the intra-urban scale, recent research adopting the LCZ framework has shown that urban thermal responses vary significantly according to urban form, building density, sky view factor, and vegetation cover, with more compact zones generally exhibiting stronger UHI (Cardoso and Amorim, 2018; Anjos et al., 2020; Hoppe et al., 2022; Ferreira, 2019; Almeida and Ribeiro, 2024).
Taken together, these studies indicate that UHI characteristics in the MASP depend on a combination of atmospheric conditions, rural reference selection, and urban surface representation. However, a comprehensive assessment that integrates these factors using long-term simulations, consistent model validation, and a detailed LCZ-based urban description remains limited. This motivates the present study, which seeks to systematically investigate how urban morphology and meteorological conditions contribute to the spatio-temporal patterns of UHI intensity in the MASP, using the Weather Research and Forecasting (WRF) numerical model.
2. Methodology
2.1. Study area and Local Climate Zones
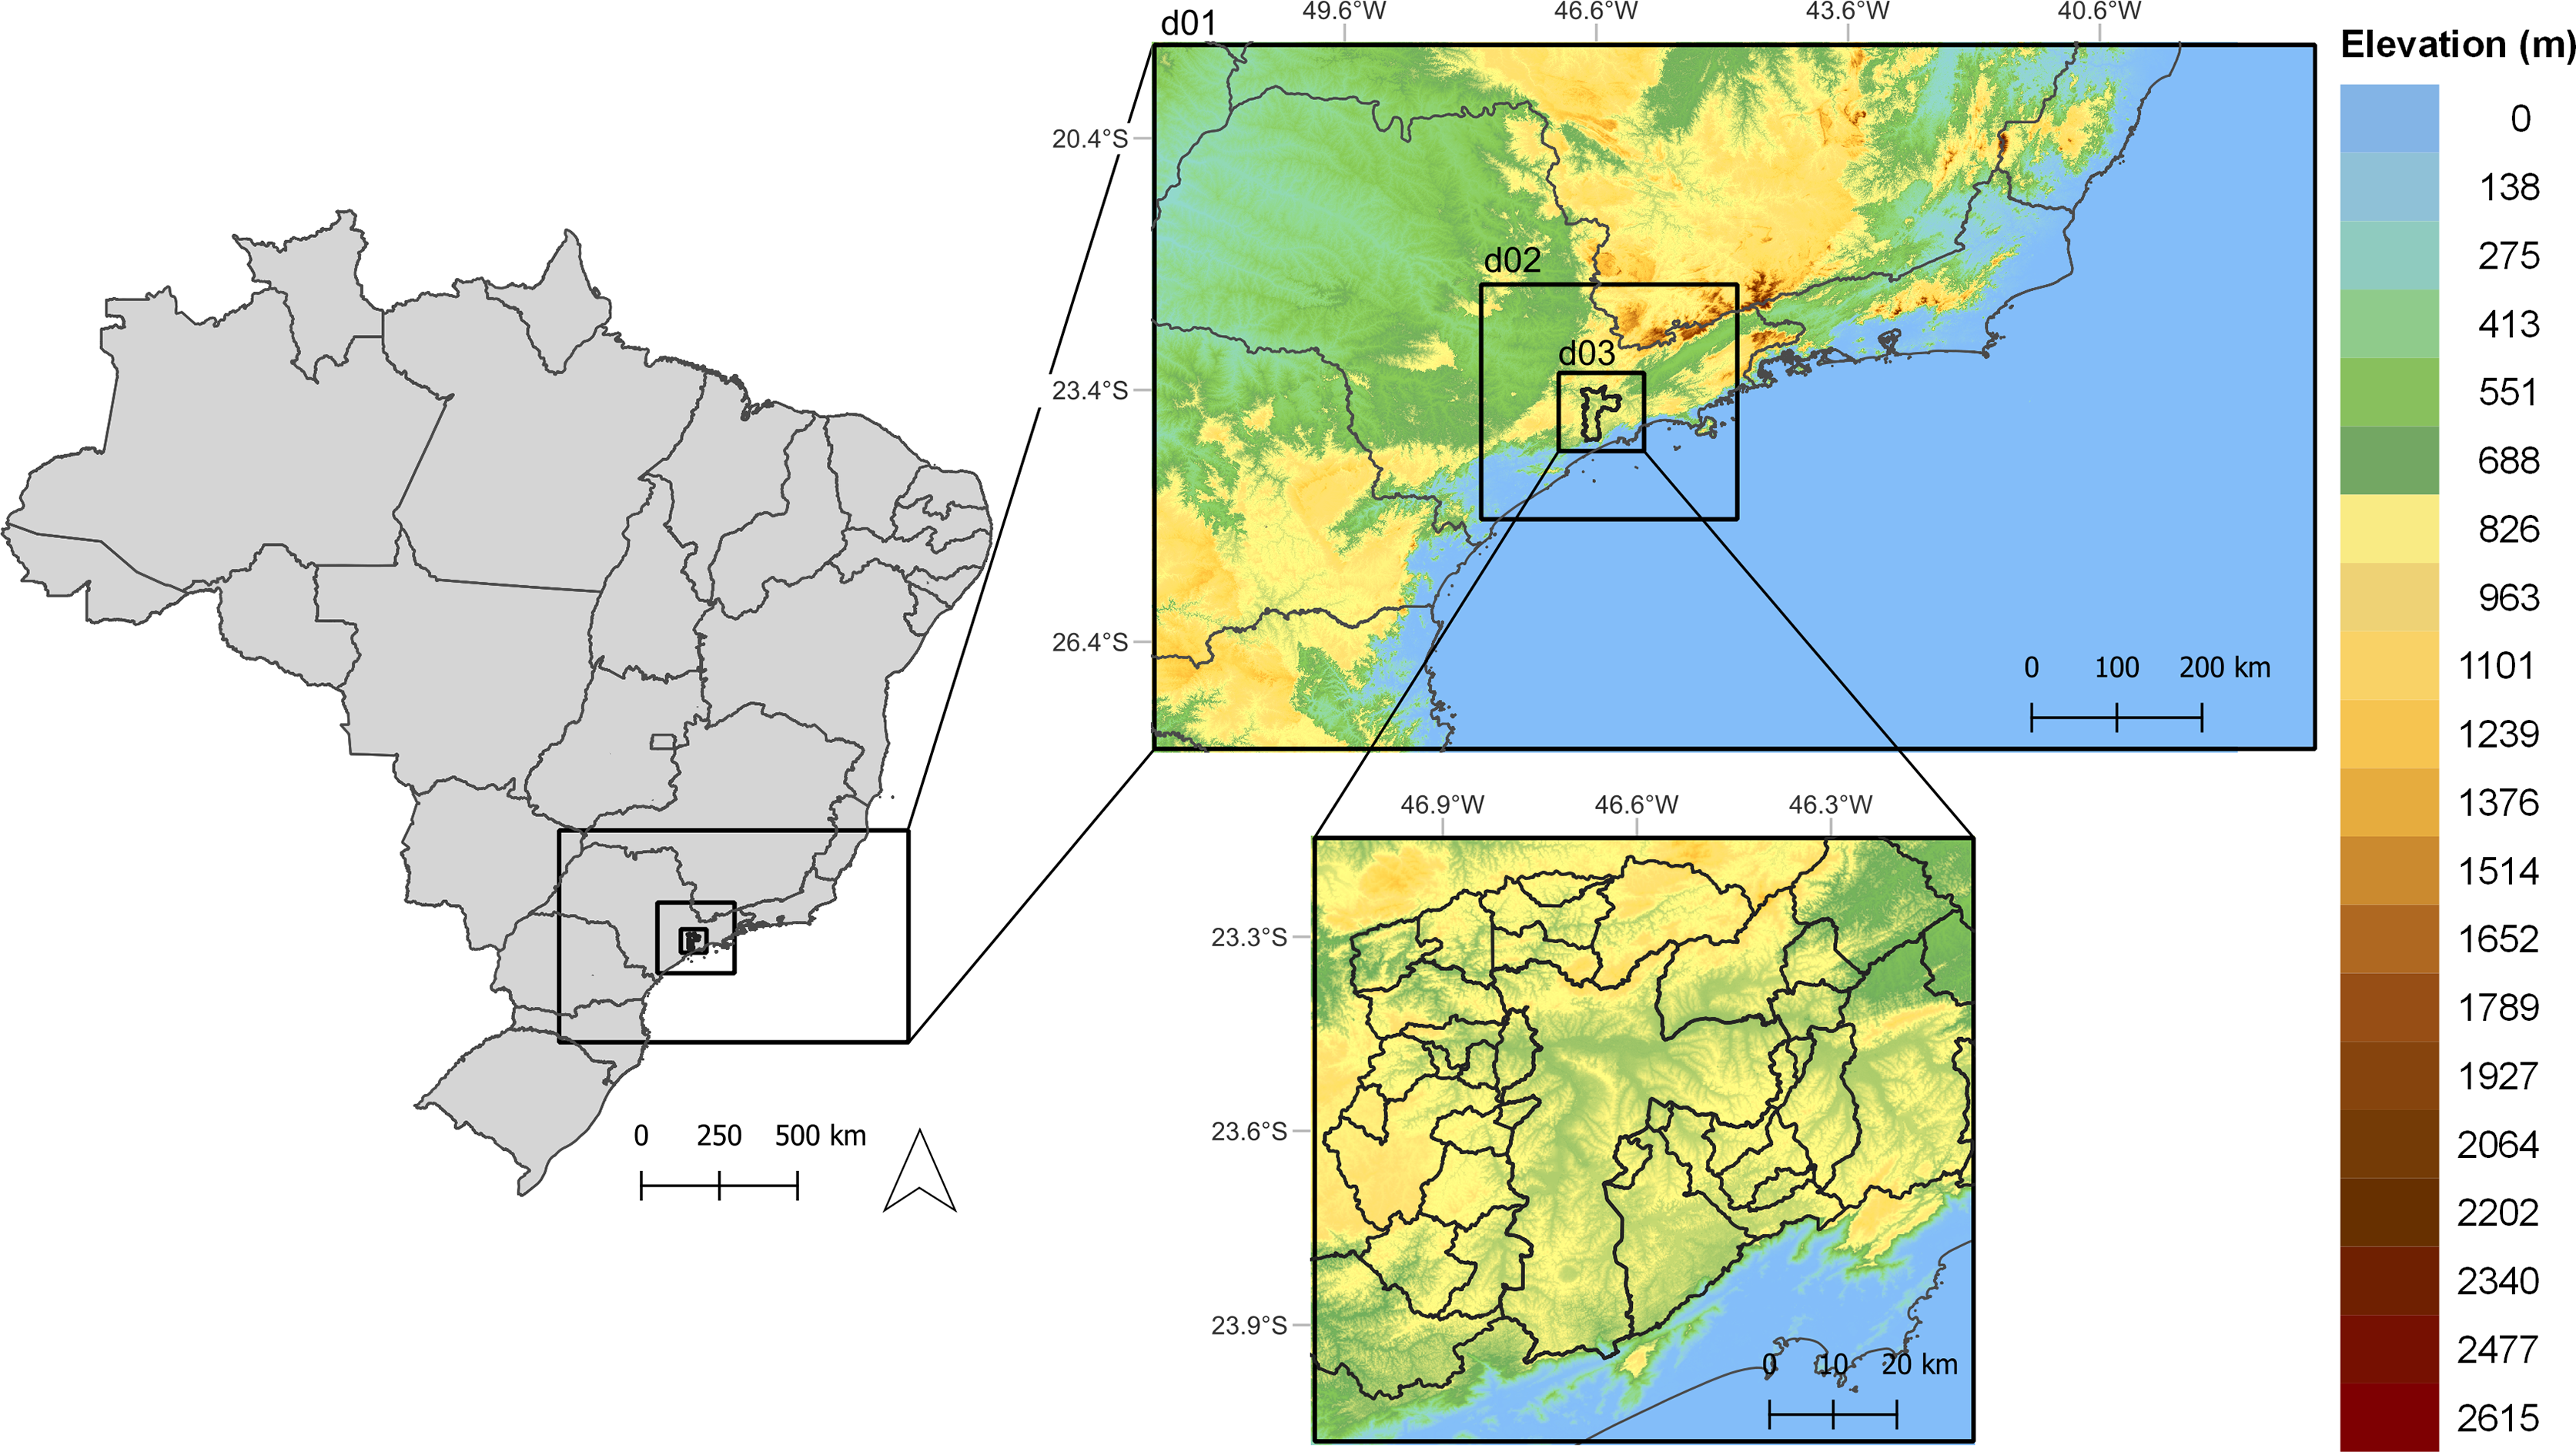
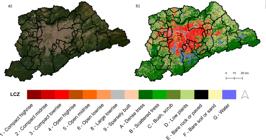
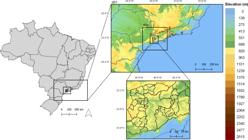
MASP comprises a conurbation of 39 municipalities, including the city of São Paulo (Fig. 1a). Located on the Atlantic Plateau, the area lies at an average altitude of 700 meters. It is approximately 50 km from the Atlantic Ocean. The region's climate is characteristic of Brazilian subtropical zones, with two well-defined seasons: a rainy summer from December to March and a dry winter from June to August (Oliveira et al., 2002).
Due to its proximity to the coast, the MASP is frequently influenced by the penetration of sea breezes, which reach the Atlantic Plateau more than 50% of the day throughout the year (Oliveira et al., 2003). Under these conditions, winds predominantly blow from the southeast, transporting cooler and more humid air toward the region. On average, the sea breeze reaches the southern part of the MASP between 12:00 LT and 14:00 LT and penetrates its interior between 16:00 LT and 21:00 LT (Oliveira et al., 2003; Lima and Rueda, 2018), as the propagation speed tends to be higher over rural areas compared to urbanized zones (Ribeiro et al., 2018).
Mesoscale circulation in the MASP is also influenced by both valley-mountain flows, driven by temperature gradients along slopes, and UHI-induced circulation, marked by surface convergence over the city, upward motion, and subsidence in surrounding areas (Hidalgo et al., 2010). These three patterns may interact, increasing flow complexity.
Local Climate Zone data for the MASP were obtained from the classification map developed by Ferreira (2019), which is representative of 2017 and has a spatial resolution of 100 meters (Fig. 1b). However, since the modeling domain encompasses a broader area than the MASP itself, the global LCZ map by Demuzere et al. (2022a) was employed to cover the rest of the domain. This global dataset also has 100-meter spatial resolution and is representative of 2018.
2.2. The WRF model
The WRF model is an open-source numerical atmospheric model that simulates atmospheric dynamics, thermodynamics, and physical processes, including radiation, precipitation, and convection. It can also incorporate interactions with the ocean, land surface, vegetation, and urban areas (Powers et al., 2017; Skamarock et al., 2021). This study used the Advanced Research WRF (ARW) core, which solves the non-hydrostatic Euler equations for a compressible atmosphere.
2.2.1. Configuration
The study covers the month of September from each year between 2014 and 2023, with each year September simulated as an independent model run. This period is typically associated with higher UHI intensity (Ferreira et al., 2012), especially during dry periods in tropical cities (Roth, 2000). Two global datasets were used as initial and boundary conditions to conduct independent experiments: GFS/FNL (6-hourly) and ERA5 (hourly), both with 0.25° × 0.25° resolution.
Two different databases were adopted to describe the land surface: (1) MODIS land cover (∼1 km), with a single urban class; and (2) LCZ data for urban areas, distinguishing ten urban types while retaining MODIS for vegetated regions. LCZ was integrated into WRF via the WUDAPT-to-WRF (W2W) Python tool (Demuzere et al., 2022b), which replaces the default urban land cover and updates morphological, radiative, and thermal properties. Each database was coupled with a different urban canopy scheme in the simulations.
In September 2023, four experiments (GFS MODIS, GFS LCZ, ERA5 MODIS, ERA5 LCZ) assessed the sensitivity to input datasets. The best-performing setups were used for simulations from 2014 to 2022. WRF v4.3.3 was run from August 27 to September 30 in each year with a 5-day spin-up, using three nested domains (9 km, 3 km, 1 km) and eight physical parameterizations (Fig. 2, Table 1).
Particular attention was given to the urban surface parameterization, as the representation of urban morphology in the model is closely linked to the level of detail provided by the surface input data (Freitas, 2023). In this study, different urban schemes were employed in accordance with the characteristics of the surface datasets used.
The BEP + BEM multilayer scheme was adopted in the LCZ-based simulations because its three-dimensional representation of buildings and inclusion of indoor energy use provide a more detailed description of heat storage, anthropogenic heat release, and building-atmosphere exchanges (Martilli et al., 2002; Salamanca and Martilli, 2009). This approach is commonly used in LCZ-based studies, where the greater morphological complexity of urban classes warrants a more physically detailed parametrization (Mancheno et al., 2024; Franco et al., 2019; Ribeiro et al., 2021).
In contrast, simulations based on MODIS land-use data employed the SLUCM, a simpler and computationally efficient 2D canyon scheme that is well suited to coarser urban classifications and has been extensively used in mesoscale urban climate studies (Chen et al., 2011). In this configuration, the mean building height is defined in the URBPARM.TBL file, with fixed values assigned to MODIS urban class. As a result, building height does not vary spatially within a given category, representing a simplified characterization of urban morphology. Despite this simplification, both schemes (SLUCM and BEP+BEM) have demonstrated success in simulating mesoscale phenomena in urban environments (Franco et al., 2019; Ribeiro et al., 2021).
Adopting different urban parameterizations introduces additional degrees of freedom, which admittedly complicates the task of isolating the effects of surface classification from the urban canopy scheme. Nevertheless, this approach seeks a balance between physical realism and the level of detail provided by the input data, aligning with standard practices in the literature. As such, the results should be interpreted as the integrated impact of both surface representation and urban parameterization.
2.2.2. Model validation
To evaluate the four experiments in September 2023, a Taylor diagram (Taylor, 2001) was used for 2-meter air temperature (T2), 2-meter relative humidity (RH2), and 10-meter wind speed (WS), combining the correlation coefficient, the centered root-mean-square difference (RMSD), and the standard deviation (SD).
For the remaining years, model performance was assessed using the mean absolute error (MAE), the root-mean-square difference (RMSE), and the DPielke index (Hallak and Pereira Filho, 2011; Pielke, 2002; Wilks, 2006). Simulations were considered satisfactory when DPielke < 2, with 0 indicating a perfect match.
Observational data were obtained from eight Cetesb stations - Capão Redondo (LCZ 3), Guarulhos Paço (LCZ 3), Guarulhos Pimentas (LCZ 3), Marginal Tietê Ponte Remédios (LCZ 3), Parque Dom Pedro II (LCZ 8), Pinheiros (LCZ 6), São Bernardo do Campo Centro (LCZ 2), and São Caetano do Sul (LCZ 3) - and from two stations operated by the National Institute of Meteorology (INMET): Interlagos (LCZ 6) and Mirante de Santana (LCZ 3). Two rural stations were also included: Itutinga (representing the southeastern rural point in the following analyses) and Morro Grande (representing the southwestern rural point). Observational data were included based on availability for each year.
2.3. Analysis of meteorological conditions
To identify days favorable for UHI occurrence - i.e., conditions with clear skies and light winds (Oke et al., 2017; WMO, 2023) - a meteorological analysis was conducted for all days in September from 2014 to 2023. This included GOES satellite imagery, synoptic charts from the Brazilian Navy, and data from the automatic INMET station Mirante de Santana.
Based on these observations, the climatological mean for September 2014 to 2023 was calculated for solar radiation, precipitation, air temperature, dew point, relative humidity, wind direction, and wind speed. In this study, “climatological mean” refers to the 10-year average for September rather than the conventional 30-year climatological period. The meteorological variables were then analyzed to classify the days as favorable or unfavorable for UHI formation. Thus, the term “favorable days” refers to those that presented atmospheric conditions conducive to the development of the phenomenon, whereas “unfavorable days” correspond to days in which the meteorological pattern does not support the establishment of the urban heat island.
Daily assessments considered the mean and standard deviation of wind speed, solar radiation, precipitation, and cloud cover. Final classifications were based on a comprehensive analysis integrating all variables and the temporal evolution of weather conditions.
2.4. Urban heat island
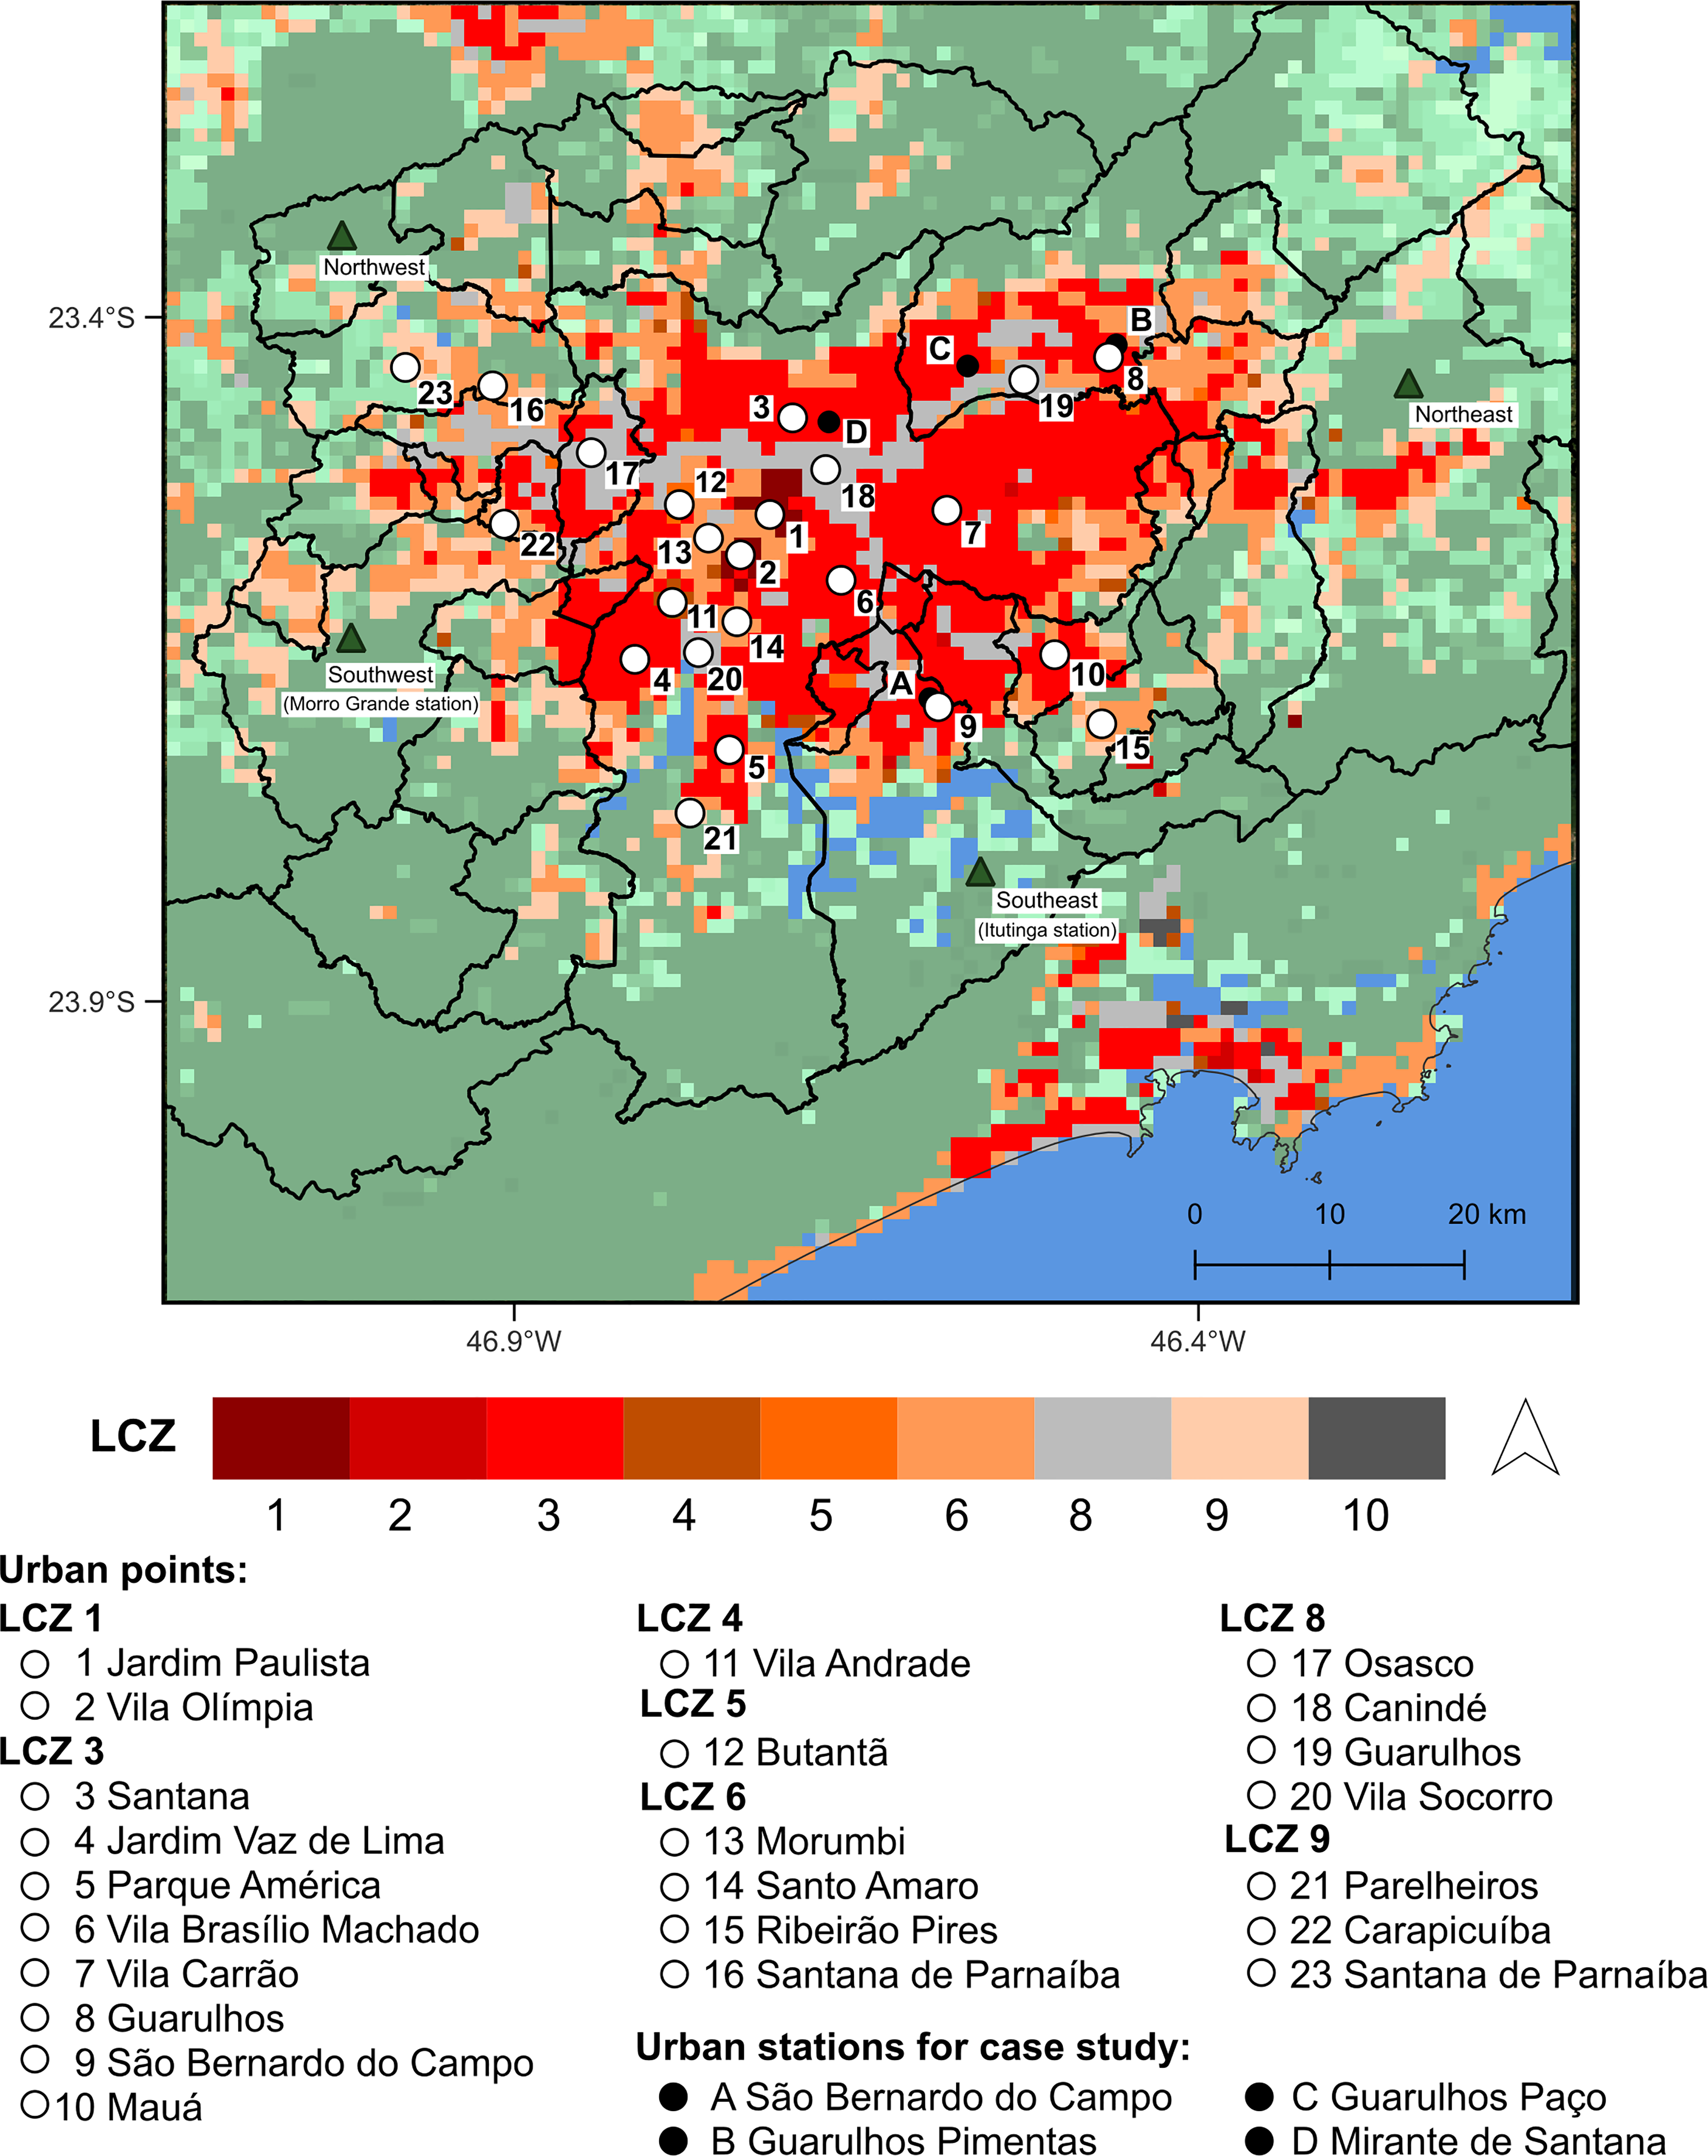
To assess UHI behavior, four rural points surrounding the MASP and 23 urban points across various LCZ were selected (Fig. 3). For LCZ present in multiple locations, points were spatially distributed to capture intra-class variability, acknowledging that each LCZ type is not entirely homogeneous.
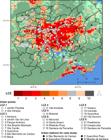
Location of urban and rural points for analysis of the urban heat island, and urban stations for case study.
Urban points with similar patterns were grouped using K-means clustering, an unsupervised algorithm that identifies data structure based on Euclidean distances (MacQueen, 1967). The optimal number of clusters was determined using the elbow method (Kodinariya and Makwana, 2013), which identifies the point at which inertia significantly decreases, allowing for an optimal K to be found, thereby balancing cluster cohesion and generalization. The application of clustering methods to meteorological data has been effectively demonstrated by Silva et al., (2017) and Almeida and Ribeiro (2024).
UHI intensity (or magnitude) was calculated as the synchronous simulated air temperature difference between urban points and each rural reference point, using hourly means for the whole 2014-2023 period. Intensities were classified following García (1995): 0-2 °C (weak UHII), 2-4 °C (moderate UHII), 4-6 °C (strong UHII), and > 6 °C (very strong UHII). Negative intensity values indicate the presence of an urban cool island.
3. Results and discussions
3.1. Days favorable to urban heat island formation
Days favorable to UHI formation were identified based on solar radiation, precipitation, and wind speed. A minimum solar radiation threshold of 2600 kJ m-2 was set, corresponding to the September mean maximum (2014-2023) minus one standard deviation. This value also indicates that, in our dataset, days exceeding this threshold correspond to clear-sky conditions.
Precipitation's diurnal behavior was found to be closely associated with solar radiation data, which reflects the presence or absence of cloud cover. Thus, days with high daily accumulated precipitation were excluded due to the corresponding low solar radiation. A maximum threshold of 3.0 mm day-1 was defined on days considered conducive that presented precipitation, corresponding to low-intensity events which, when evaluated jointly with other meteorological variables, did not compromise the predominantly clear-sky conditions and surface heating essential for UHI development.
For wind speed, a daily mean threshold of 2.2 m s-1 (mean + 1 SD) was applied. However, days exceeding this threshold were still considered conducive if peak wind speeds occurred between 12:00 LT and 17:00 LT and did not surpass 2.5 m s-1.
Based on this analysis, among all days in the study period (September 2014-2023), 157 favorable days were identified, representing 52% of the total.
3.2. Model performance
The use of four experiments (GFS MODIS, GFS LCZ, ERA5 MODIS, and ERA5 LCZ) in the WRF model aimed to evaluate the best combination of forcing and urban representation for the UHI in the MASP. Based on this, it was possible to simulate the entire study period using the configuration with the best statistical results, thereby proceeding with the temporal and spatial analysis of the heat island.
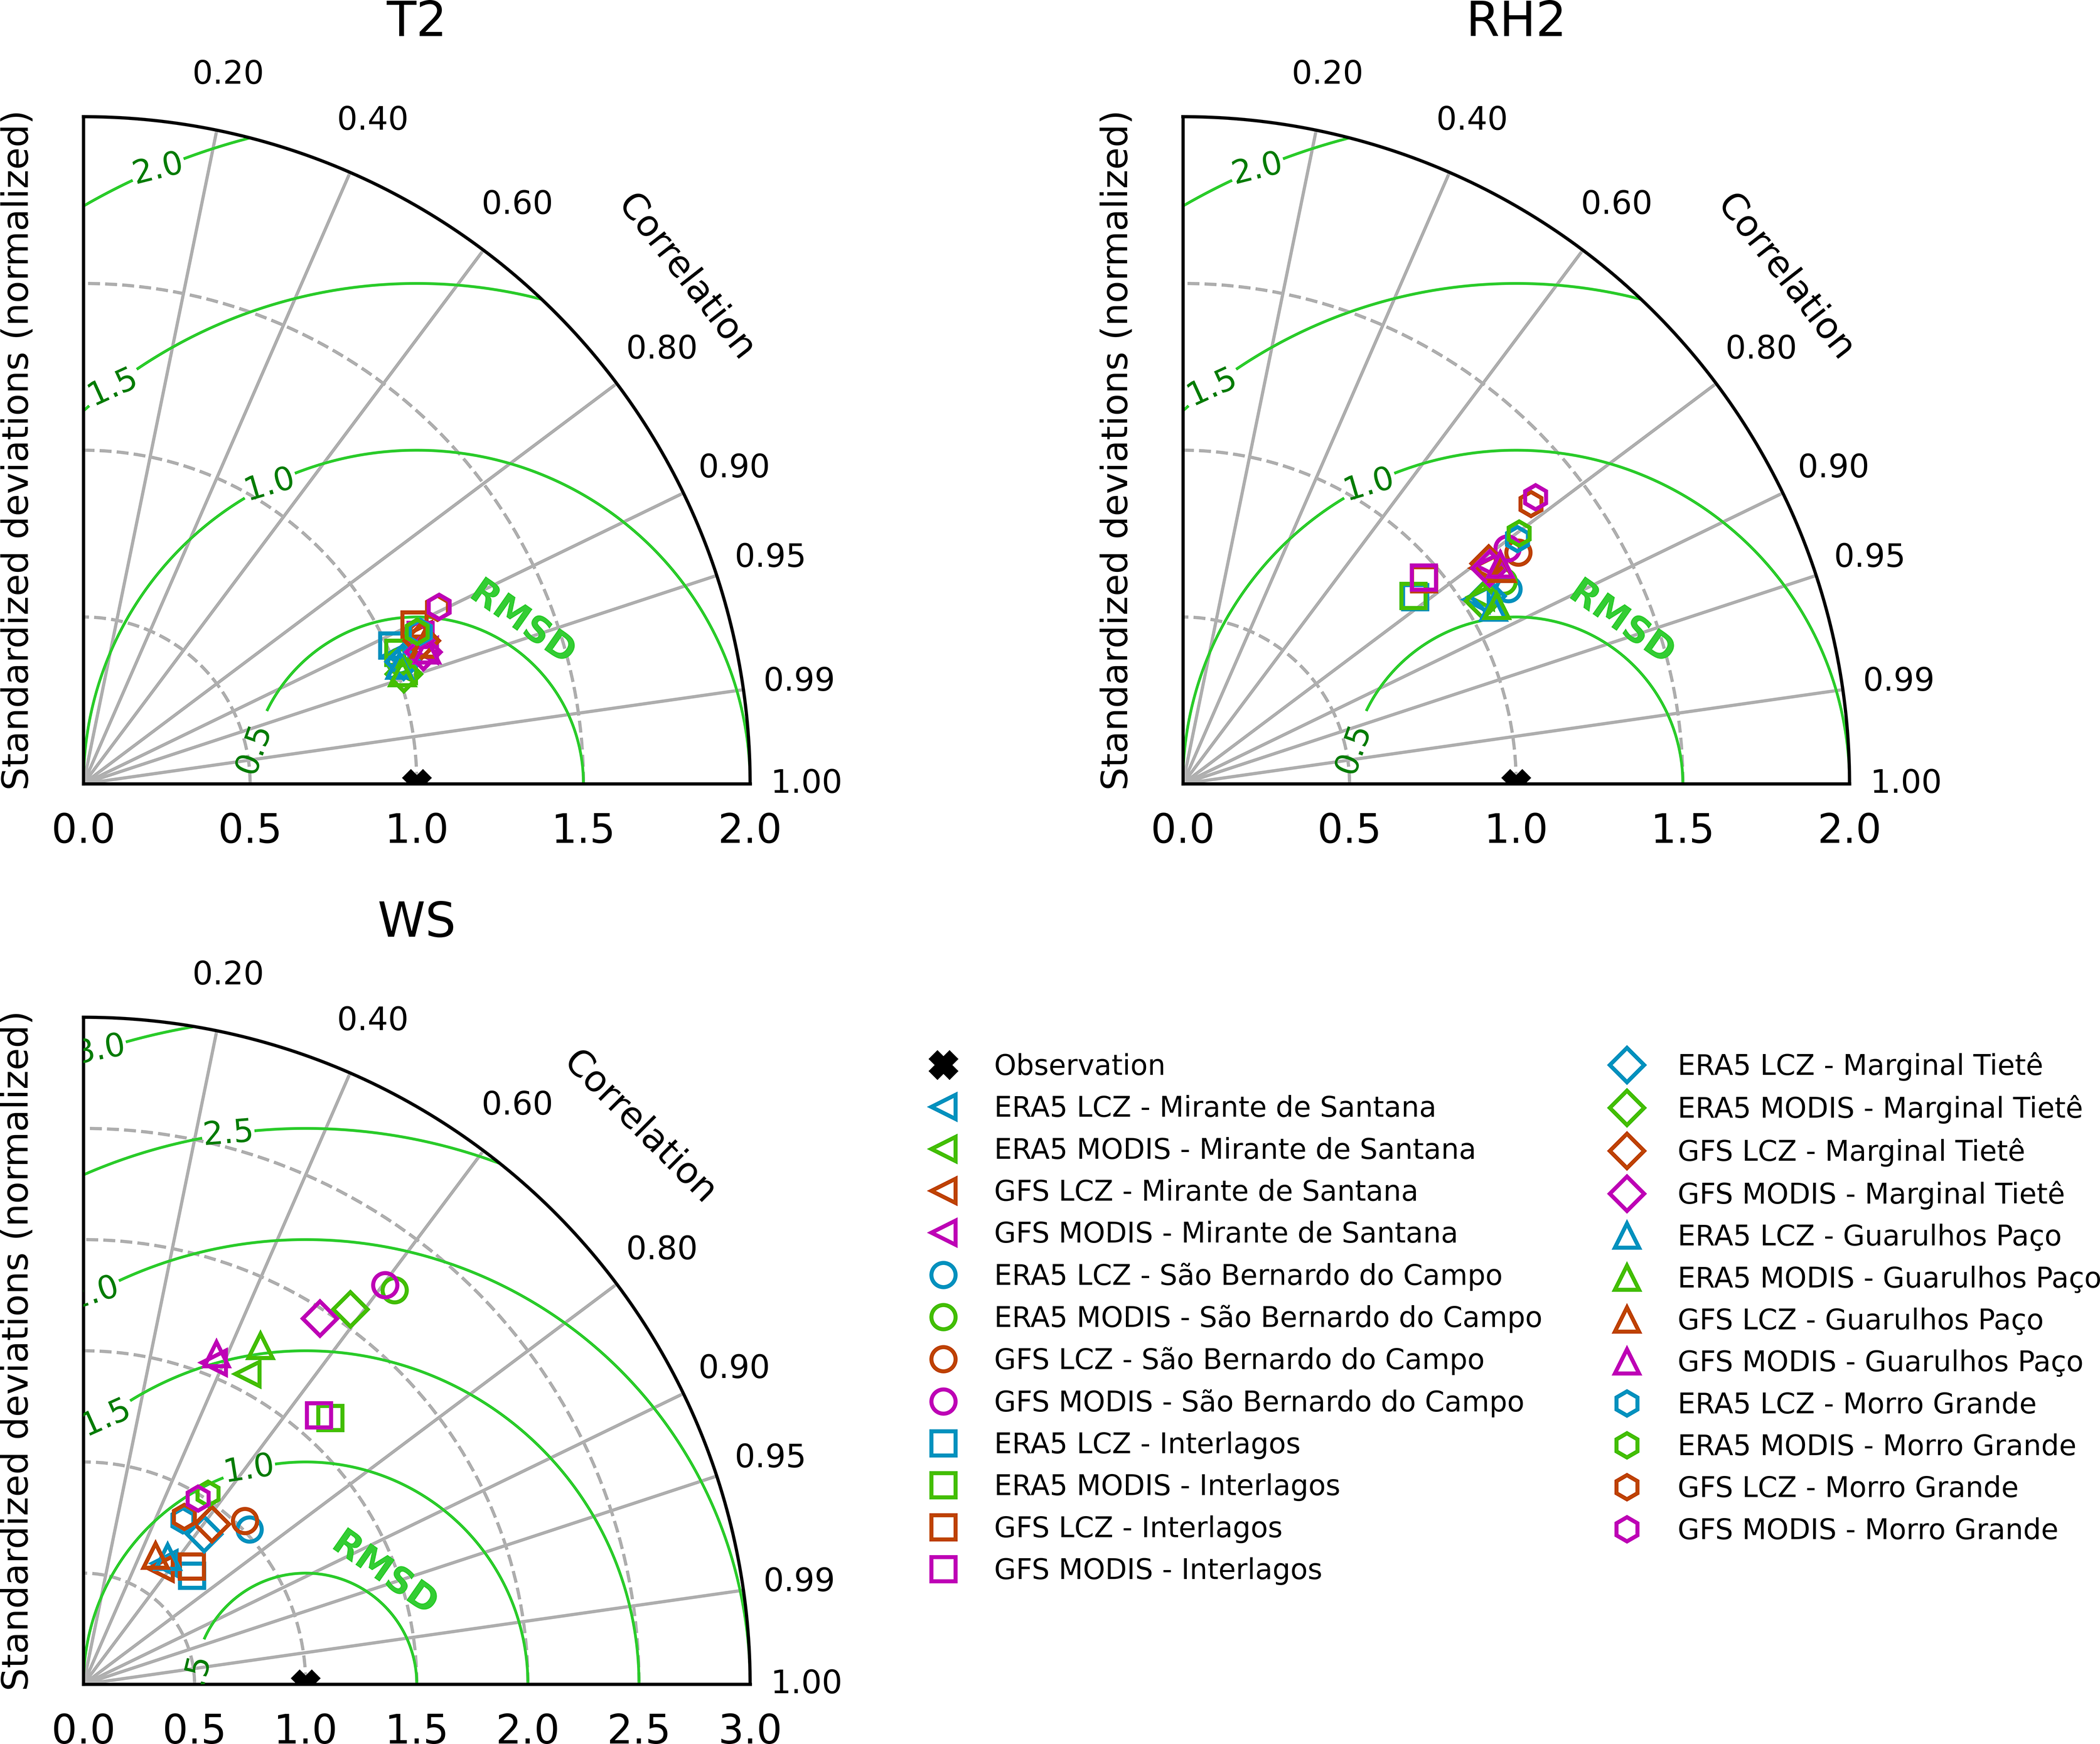
The Taylor diagram shown in Fig. 4 compares the observed and simulated air temperature, relative humidity, and wind speed at five urban stations and one rural station for September 2023, across the four experiments. Moreover, Table 2 shows the statistical results evaluated in the Taylor diagram, using the Mirante de Santana station as an example.
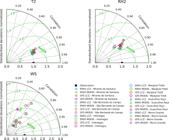
Taylor diagram for air temperature, relative humidity, and wind speed in the simulation experiments.
For air temperature, similar performance was observed across all setups, with ERA5-driven simulations yielding higher correlations, lower RMSD, and standard deviations closer to observations.
Relative humidity followed a similar pattern, with ERA5 and LCZ-based experiments performing the best. The lowest accuracy was at Interlagos, likely due to its proximity to the Billings Reservoir, which increases local humidity that the model does not fully capture.
For wind speed, simulations using LCZ outperformed those using MODIS, likely due to the more detailed representation of urban morphology and its effects on surface roughness, as captured by the combined use of LCZ data and the BEP-BEM urban parameterization. While the present analysis focuses primarily on morphological contrasts represented through the LCZ framework and its associated urban parameterization, we acknowledge that other land-atmosphere interactions - such as vegetation cover and foliage density, soil moisture availability, and the partitioning of latent and sensible heat fluxes - also play an important role in shaping local wind patterns (Stull, 2009; Ferreira et al., 2012; Tabassum et al., 2024).
ERA5 LCZ and GFS LCZ showed the best results, indicating improved performance when detailed surface classification is coupled with a multilayer urban canopy scheme, with ERA5 offering overall superior performance. Similar findings were reported by Franco et al. (2019), who emphasized improvements in wind speed simulations for São Paulo when the LCZ was included. Nevertheless, the difficulty of accurately simulating wind with the WRF model was also evident in this study and Espinosa (2017), which attributes this challenge to complex surface heterogeneity and boundary layer dynamics.
Overall, incorporating LCZ together with a more physically detailed urban parameterization improved model accuracy, and ERA5 provided the most consistent results, as indicated by the statistical metrics summarized in the Taylor diagram (Fig. 4, Table 2). Supplementary Fig. S1 presents a figure showing the air temperature behavior in the four experiments conducted in September 2023 for some stations. Therefore, the improvements discussed here should be interpreted as the combined effect of enhanced surface representation and urban canopy physics, rather than the influence of LCZ data alone. Based on this, ERA5 LCZ was selected for simulations from 2014 to 2022. Previous studies, such as those by Dee et al. (2011) and Ribeiro et al. (2018), have also highlighted the superior performance of ERA5.
Supplementary Table S1 details statistical comparisons across some stations for the entire period. The performance of the WRF meteorological simulations was consistent both temporally and spatially. In summary, the model adequately represented the variables of air temperature (with MAE ranging from 1.4 to 1.7 °C), relative humidity (with MAE ranging from 8 to 16%), and wind speed (with MAE ranging from 0.6 to 2.6 m s-1).
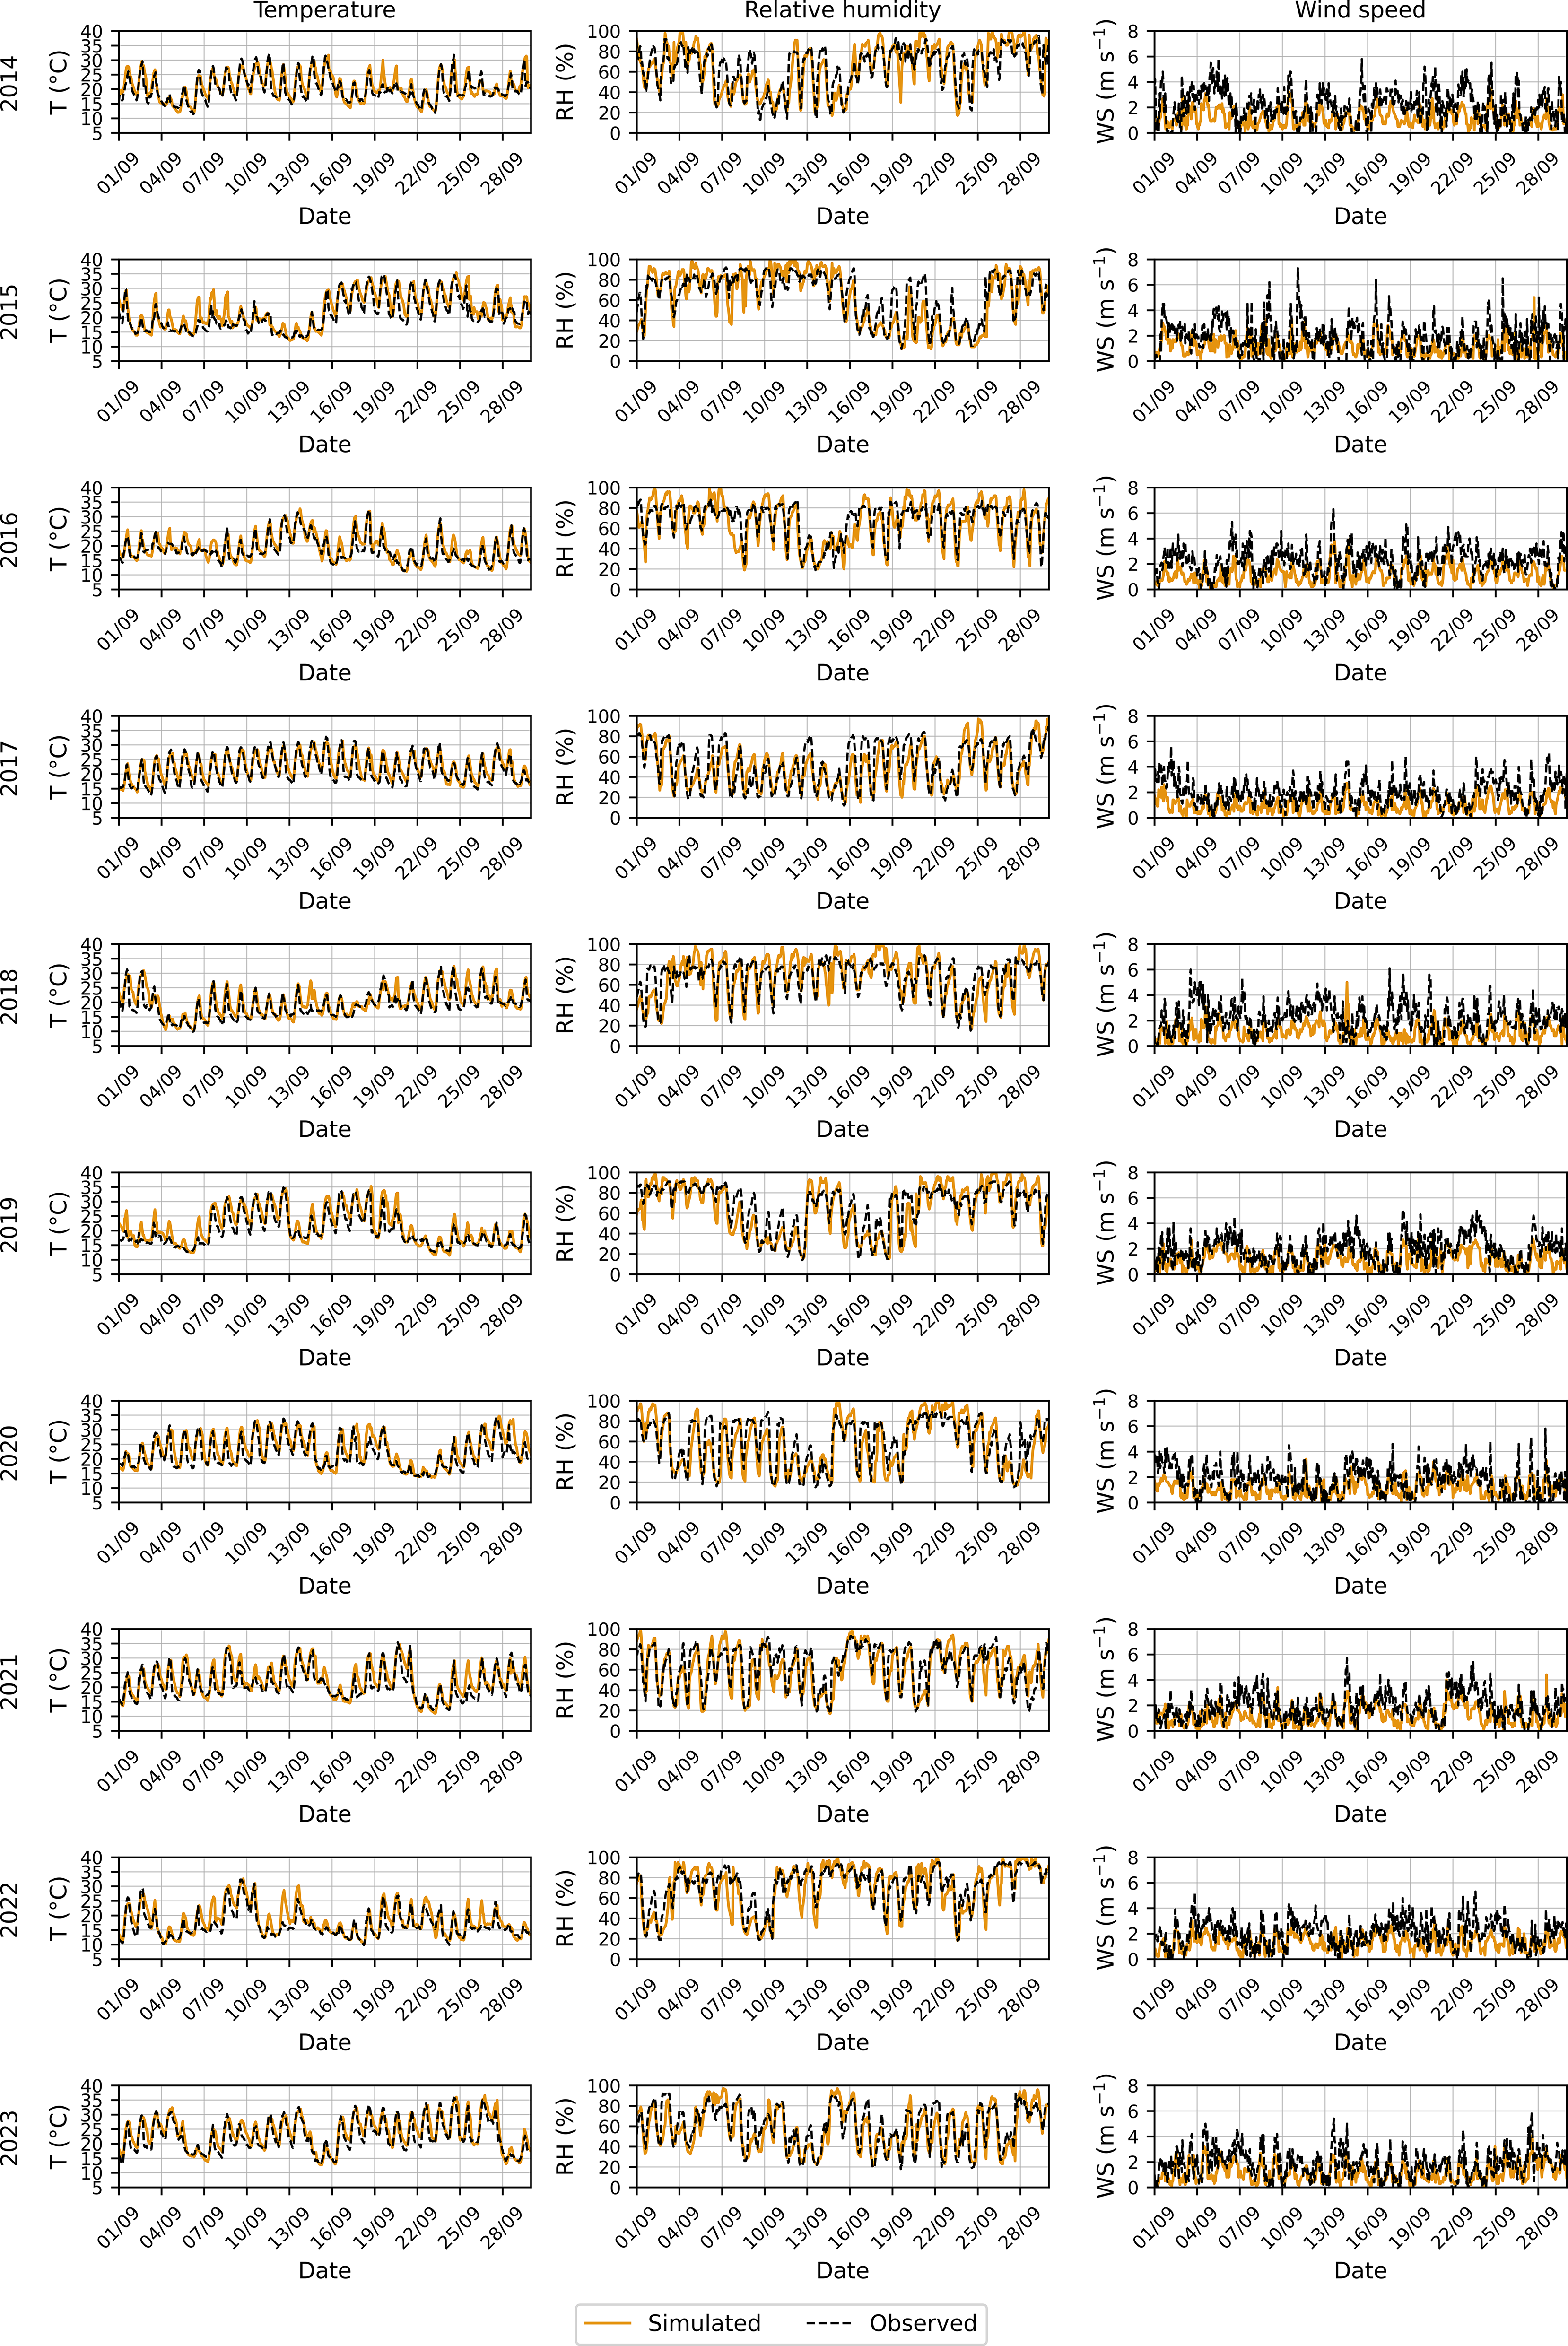
Figure 5 shows observed and simulated fields from the model configuration using LCZ and ERA5, including air temperature, relative humidity, and wind speed at the Mirante de Santana station over selected years. The plots illustrate the model's satisfactory performance for temperature and relative humidity, whereas a general tendency toward underestimation was observed for wind speed.
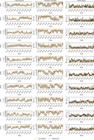
Observed and simulated data from the model configuration using LCZ and ERA5 at the Mirante de Santana station.
Despite this, the model exhibits some limitations in reproducing the full diurnal amplitude of temperature and relative humidity, as well as in capturing the observed variability of wind speed. These differences are partly associated with representativeness issues between station measurements and the model grid, particularly in a heterogeneous urban environment such as the MASP.
Additionally, Section 3.5 presents a comparison between observed and simulated UHI patterns, providing further support for the validation of the model configuration and contributing to the overall understanding of the study.
3.3. Simulated temperature variation
The MASP includes LCZ 1, 2, 3, 4, 5, 6, 8, and 9, with 39% of the area classified as urban. LCZ 3 dominates the urban landscape (39%), followed by LCZ 6 (25%), LCZ 9 (21%), and LCZ 8 (11%). LCZ 1, 2, 4, and 5 together represent less than 4%. This distribution reflects a predominance of low-rise buildings, highlighting socioeconomic contrasts across the region. The two most widespread LCZ - LCZ 3 (compact low-rise with sparse vegetation) and LCZ 6 (open low-rise with vegetation) - exhibit strong contrasts despite both being dominant.
WRF simulations were used to analyze air temperature within each LCZ under three scenarios: all September days (2014-2023), only the days with meteorological conditions conducive to the development of the urban heat island (favorable days), and only the days whose meteorological conditions do not favor the development of the phenomenon (unfavorable days).
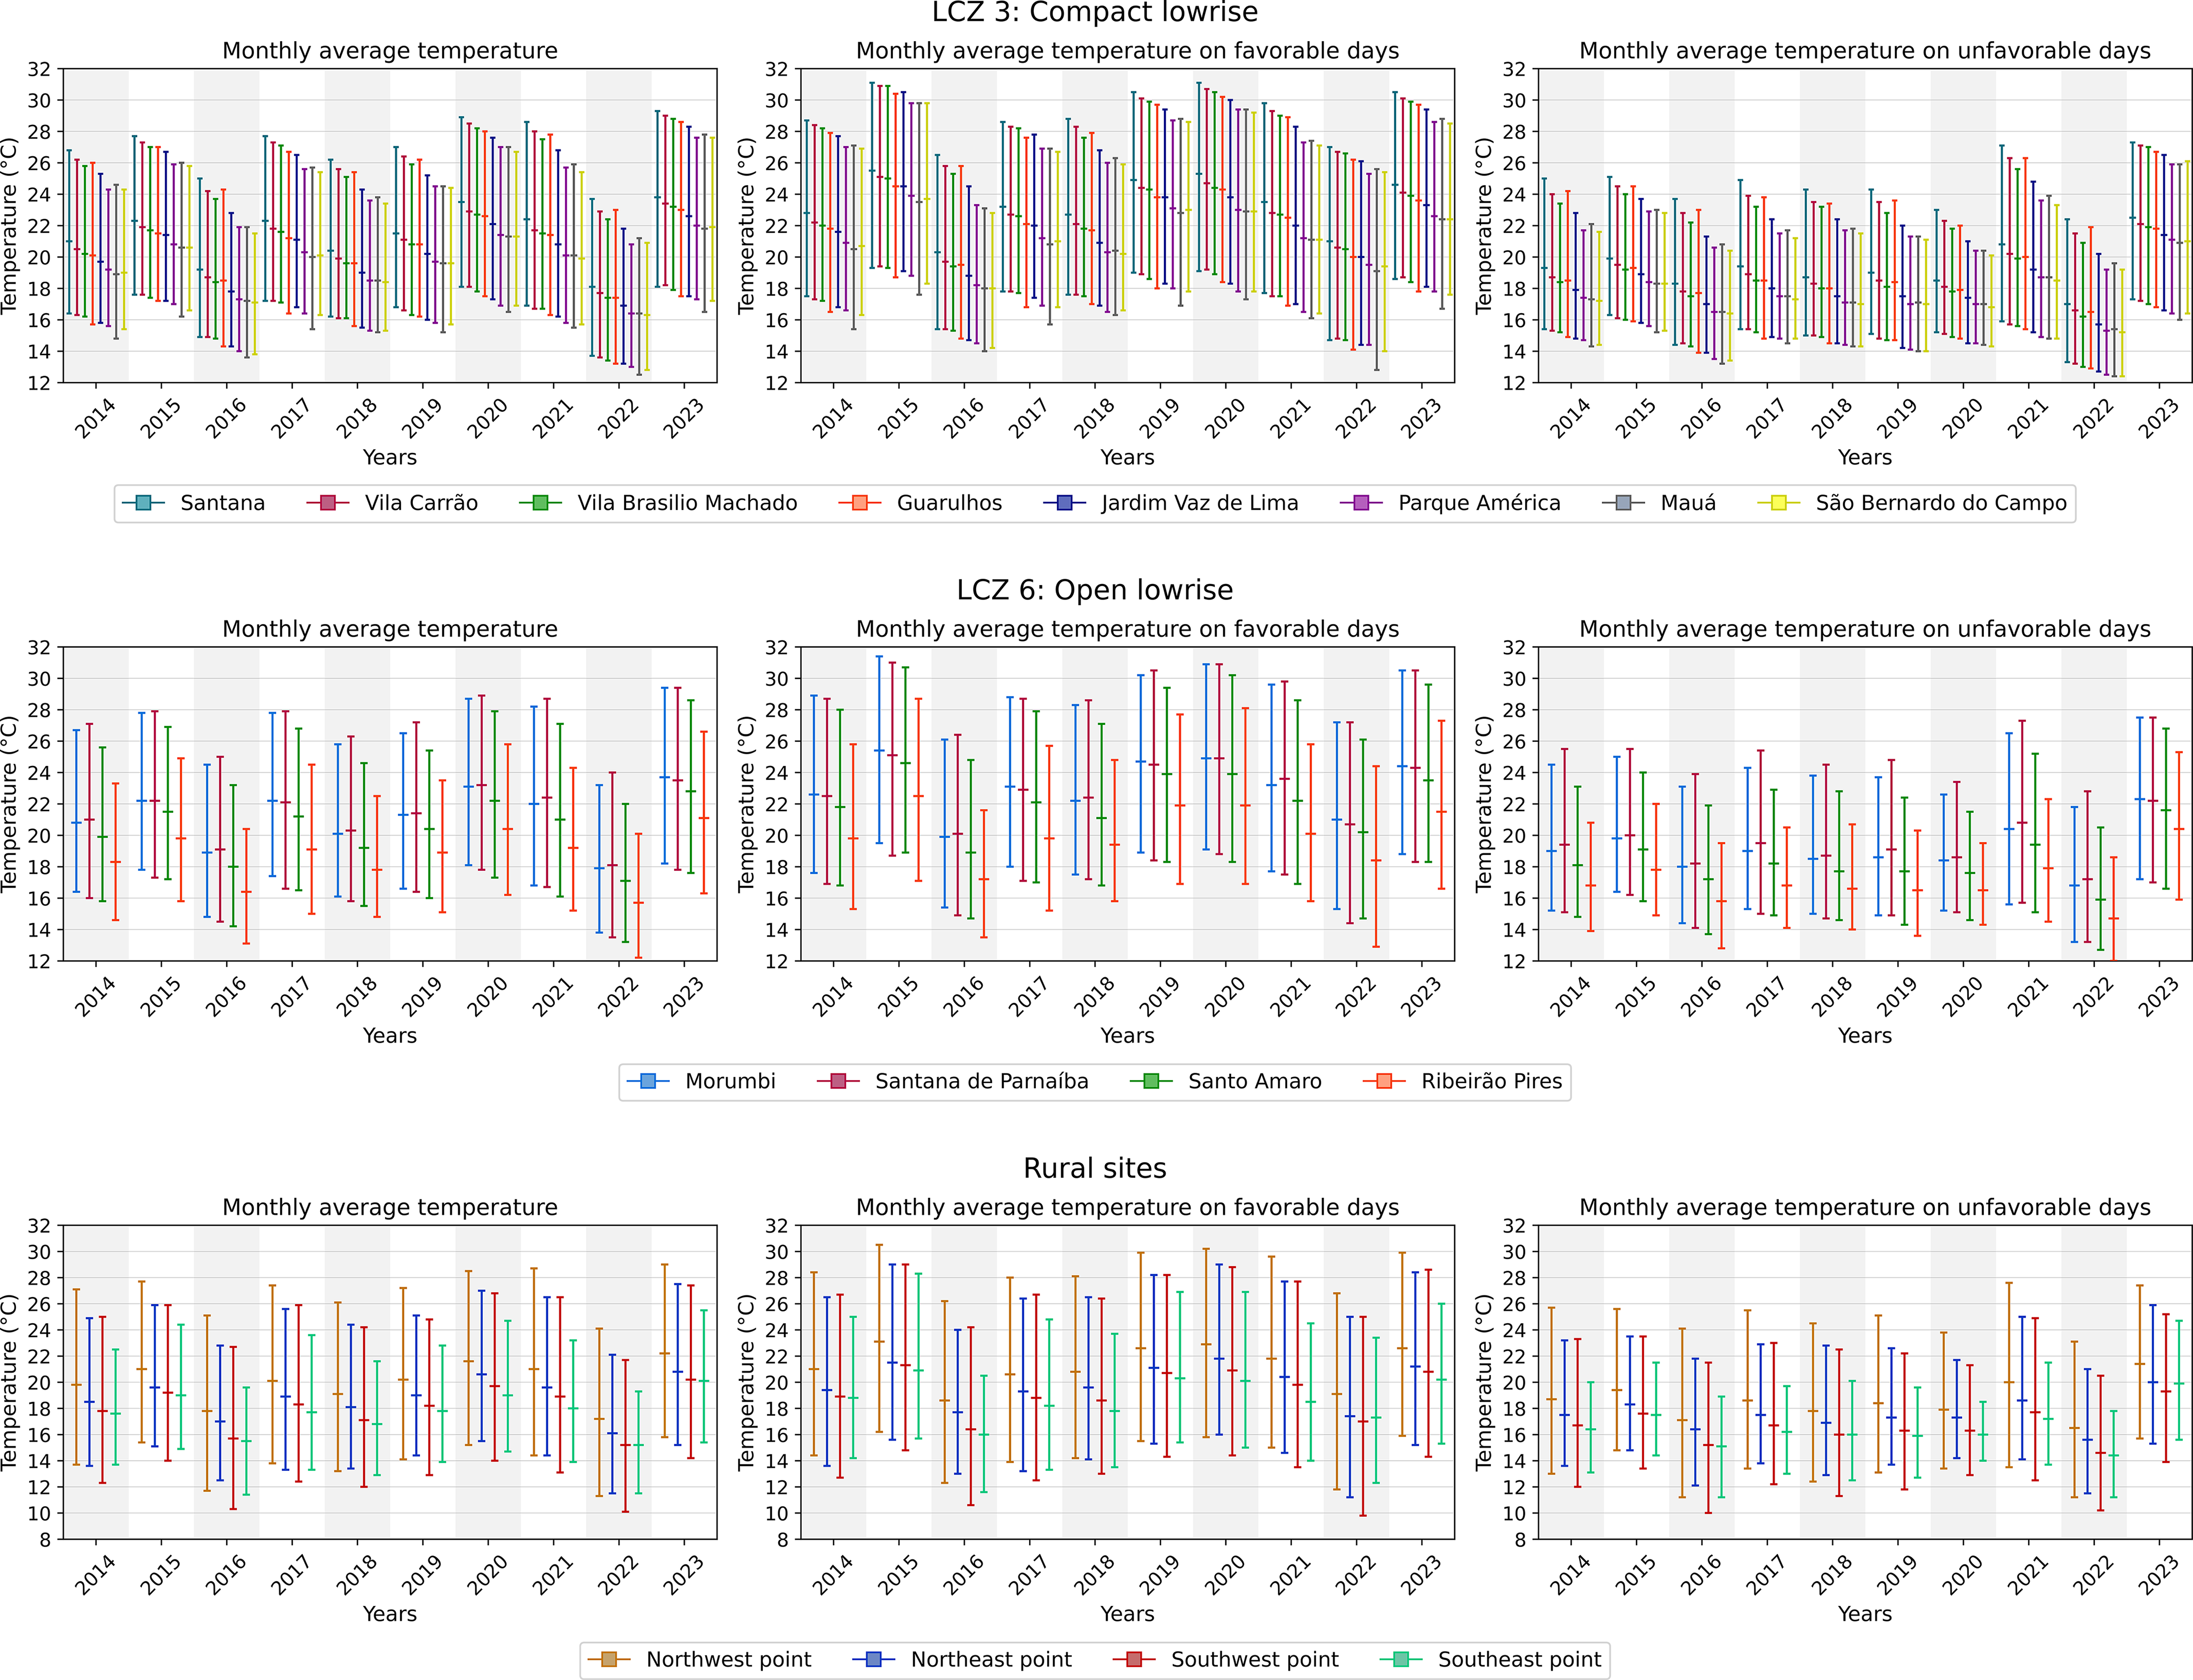
Figure 6 presents annual summaries of air temperature for the most frequent LCZ classes (3 and 6) and rural reference points, using a boxplot-style representation (Note: The boxplot-style representation summarizes minimum, mean, and maximum values and does not depict the underlyting statistical distribution). In this figure, the central line denotes the mean temperature, while the lower and upper limits represent the minimum and maximum values, respectively. This visualization provides a compact and clearer comparison of thermal contrasts among locations. Despite sharing the same morphological classification, LCZs exhibit substantial thermal variability. Overall, higher temperatures were observed on UHI-favorable days, whereas lower values prevailed on unfavorable days.
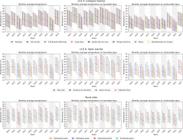
Variation of simulated air temperature (minimum, mean, and maximum) for the full study period, UHI-favorable days, and UHI-unfavorable days at points classified as a) of LCZ 3, b) of LCZ 6 and c) rural.
In LCZ 3 (Fig. 6a), site-level temperature variation was evident, with Santana recording the highest temperatures and São Bernardo do Campo the lowest. In LCZ 6, temperature behavior also varied across locations (Fig. 6b). Morumbi showed the highest averages, while Ribeirão Pires had the lowest, being cooler than all other sites within LCZ.
Regarding the rural reference points (Fig. 6c), the northwest was warmest, followed by the northeast, southwest, and southeast. The coolest sites - São Bernardo (LCZ 3), Ribeirão Pires (LCZ 6), and the southeastern rural point - are likely influenced by coastal proximity and breezy effects, coupled with the valley-mountain breeze.
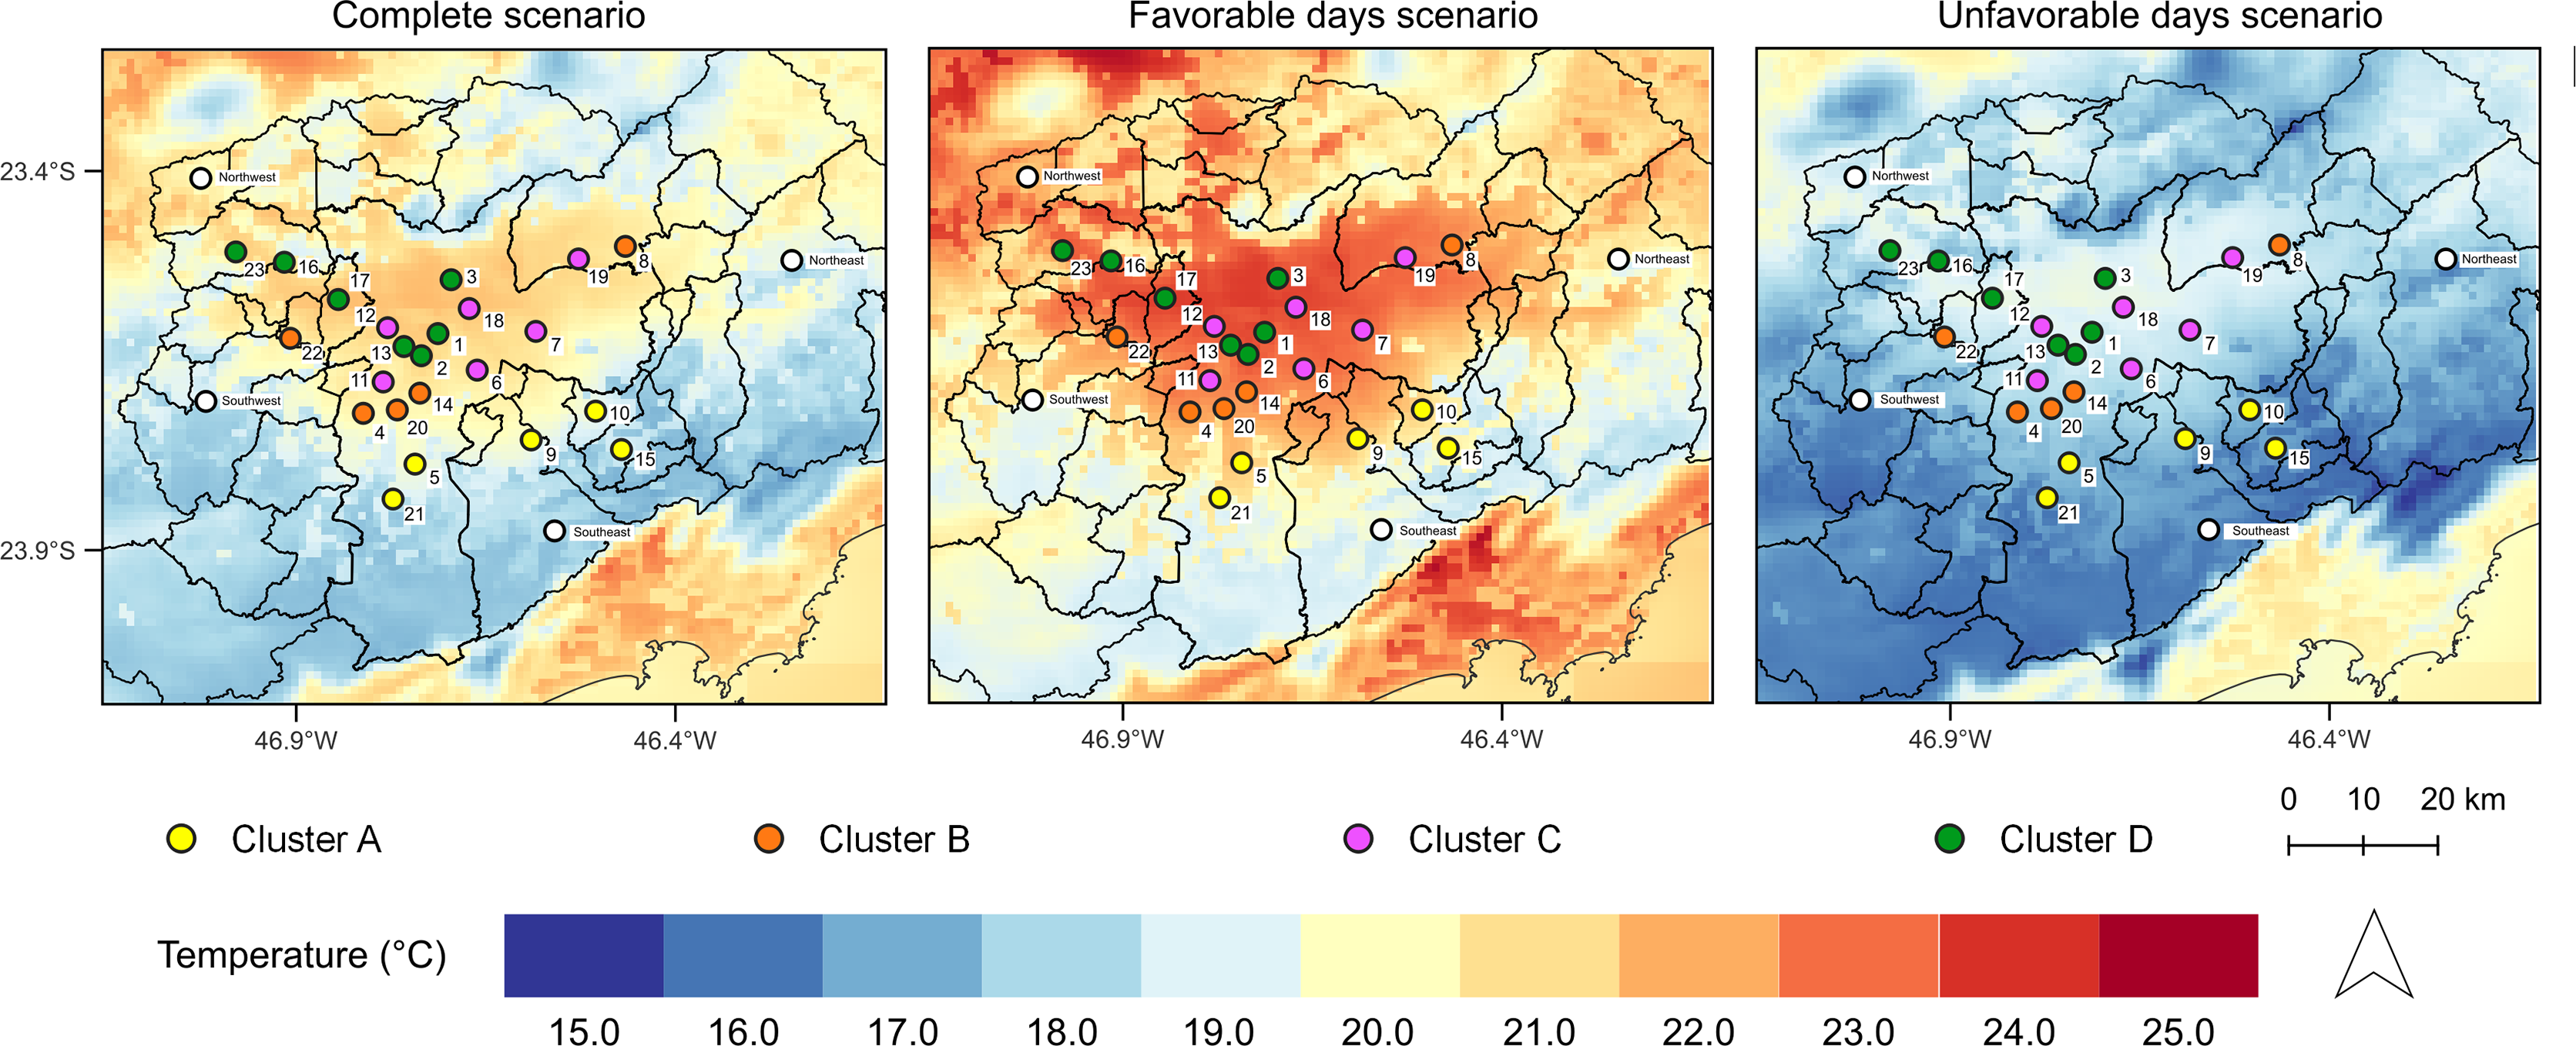
These findings suggest that factors beyond urban morphology, such as location and local circulation, affect temperature variability within the same LCZ. To explore this, K-means clustering was applied to full-period temperature data (2014-2023), yielding four urban groups (Fig. 7). The spatial distribution of clusters indicates a strong locational influence, with coastal-proximal sites cooler than inland ones. This pattern aligns with previous studies that have identified a southeast-to-northwest temperature gradient across São Paulo (Abreu et al., 2022; Ribeiro et al., 2018; Lima and Rueda, 2018). Campelo (2024) also observed this gradient in surface temperature.
Figure 7 also maps temperature differences between UHI-favorable and unfavorable days. The southeastern, southern, and southwestern sectors consistently exhibited lower temperatures, while the central, northern, and northwestern areas were warmer. Rural site variability further underscores the importance of selecting a suitable reference point in UHI analysis, as it influences both the intensity and spatial expression of the phenomenon.
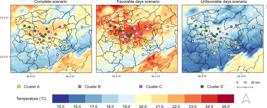
Maps of average air temperature for the complete scenario (left), favorable days scenario (center), and unfavorable days scenario (right) with the points grouped into clusters.
3.4. Simulation of the diurnal evolution of urban heat island intensity
The UHI, characterized by higher urban temperatures than rural temperatures, was identified in the MASP using WRF simulations for the period from September 2014 to 2023. The analysis considered spatial clustering, cluster-averaged values, and hourly means.
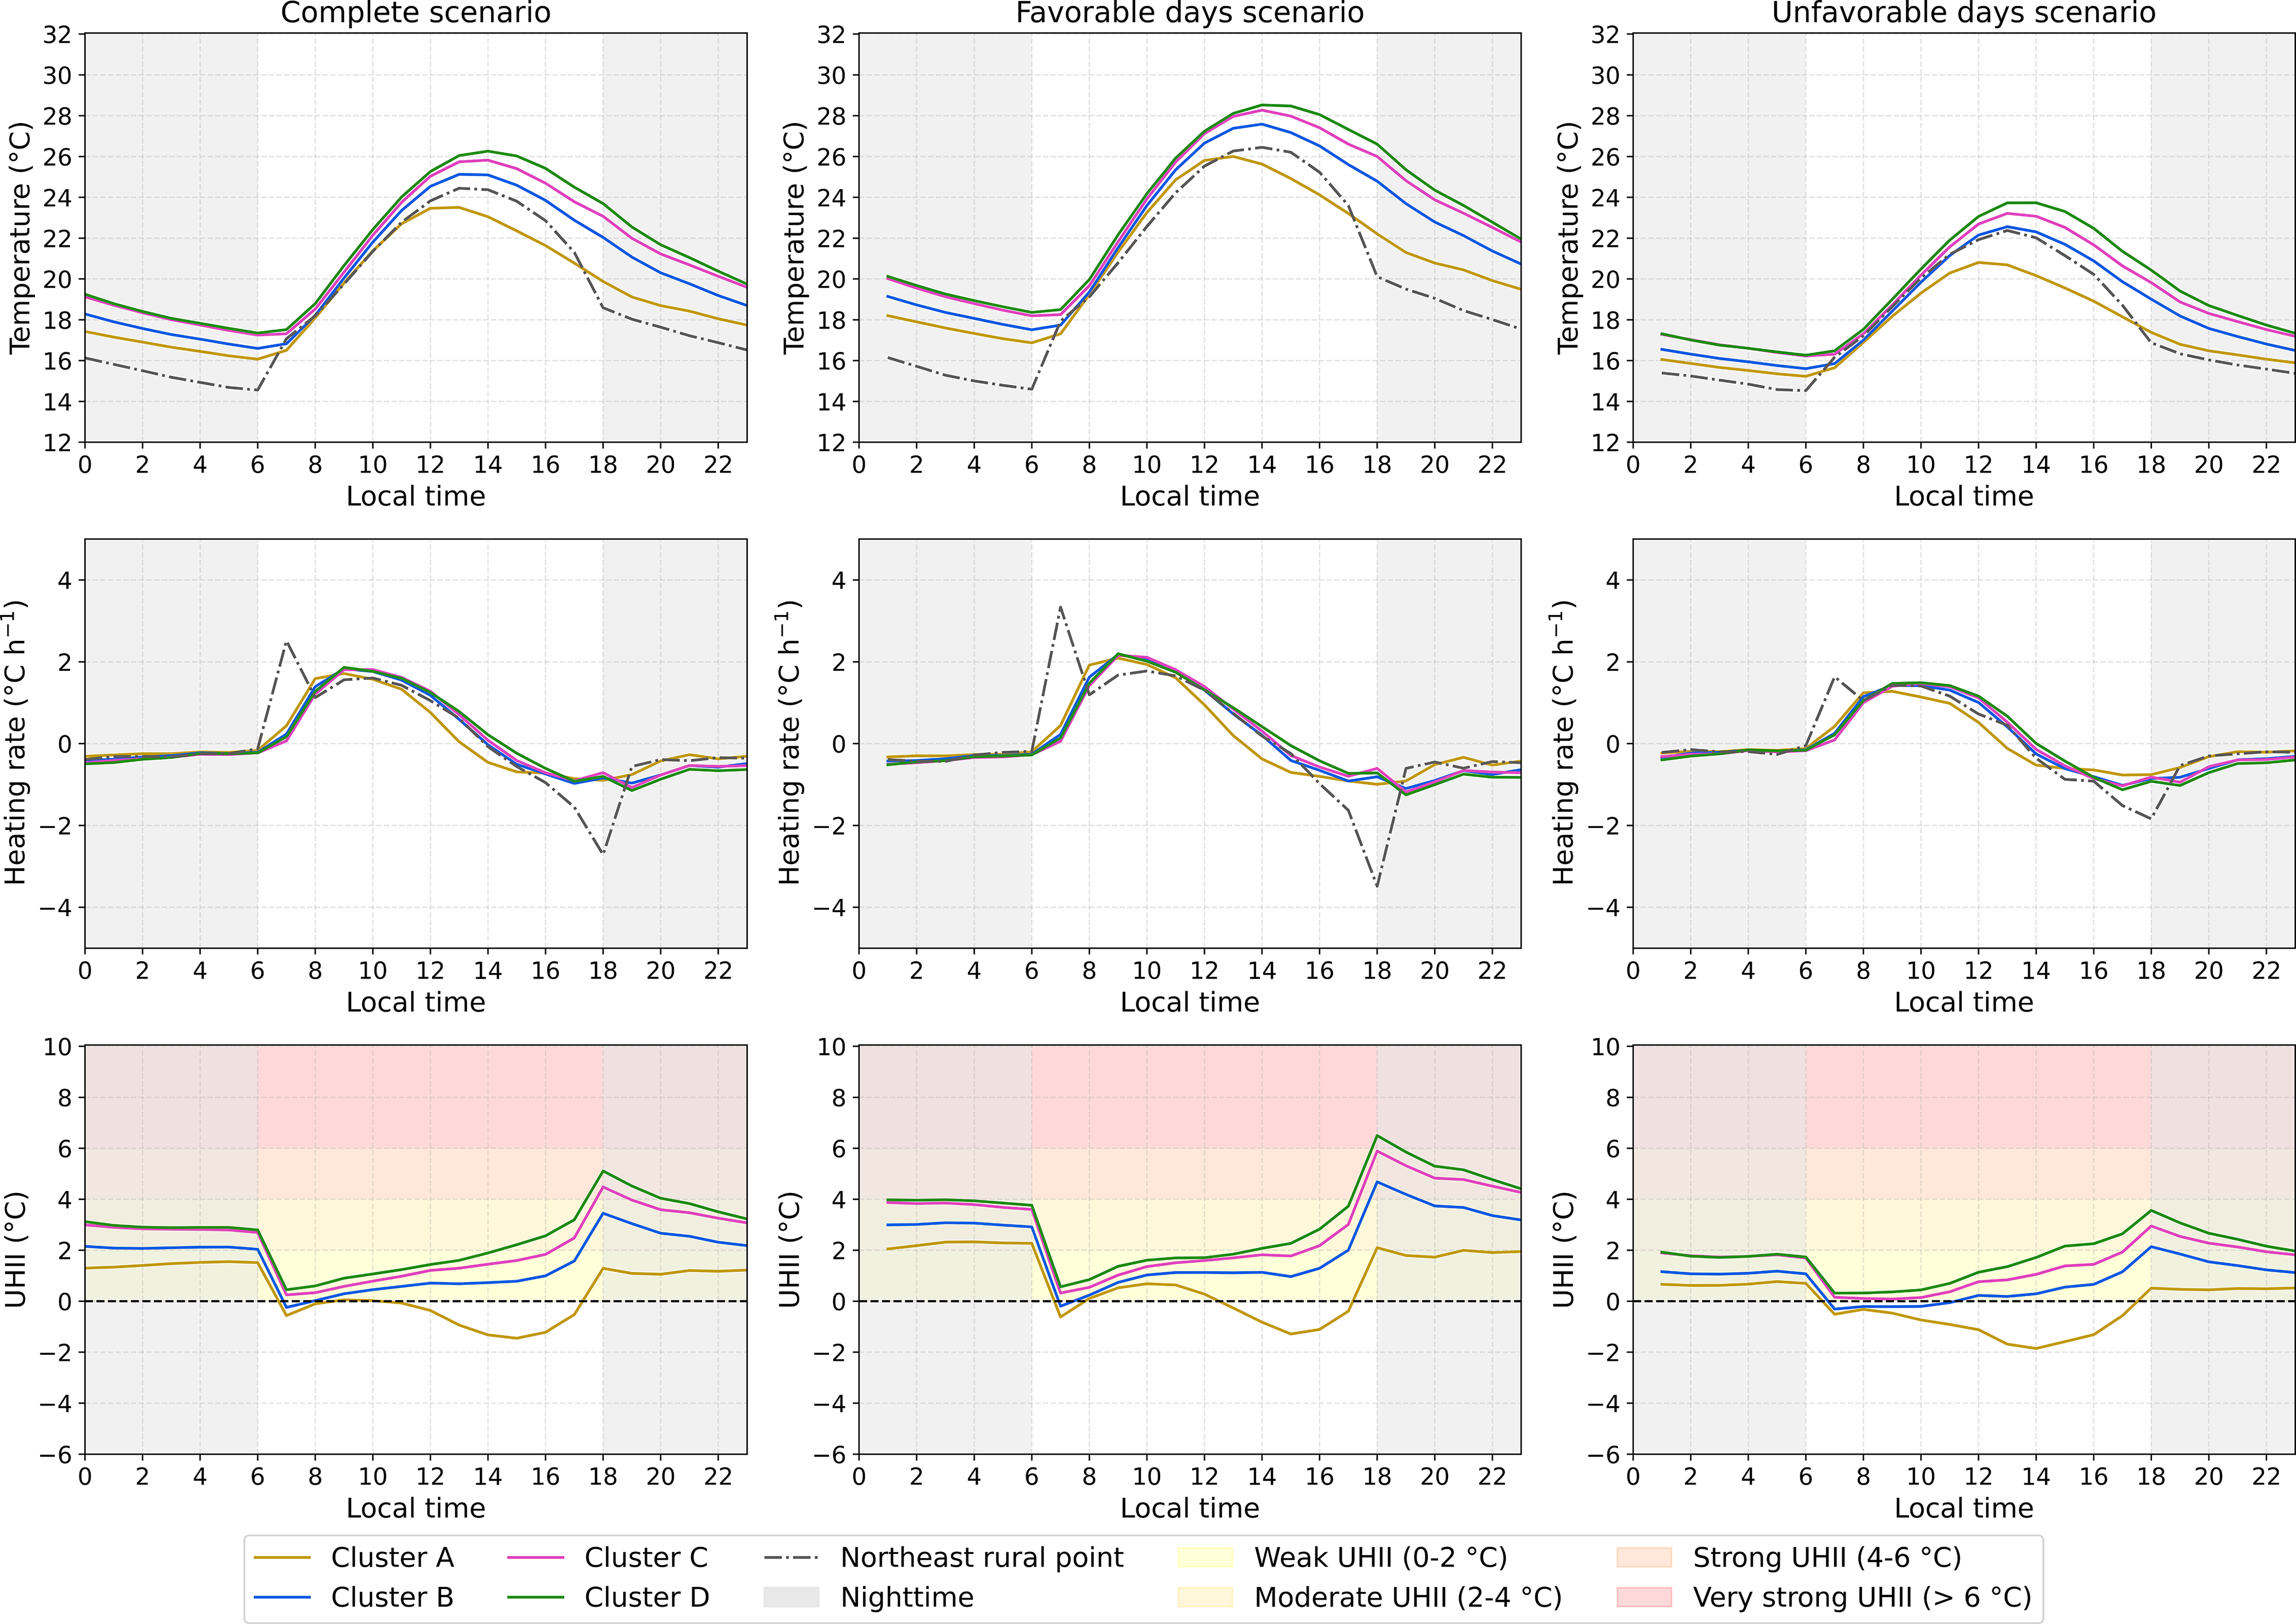
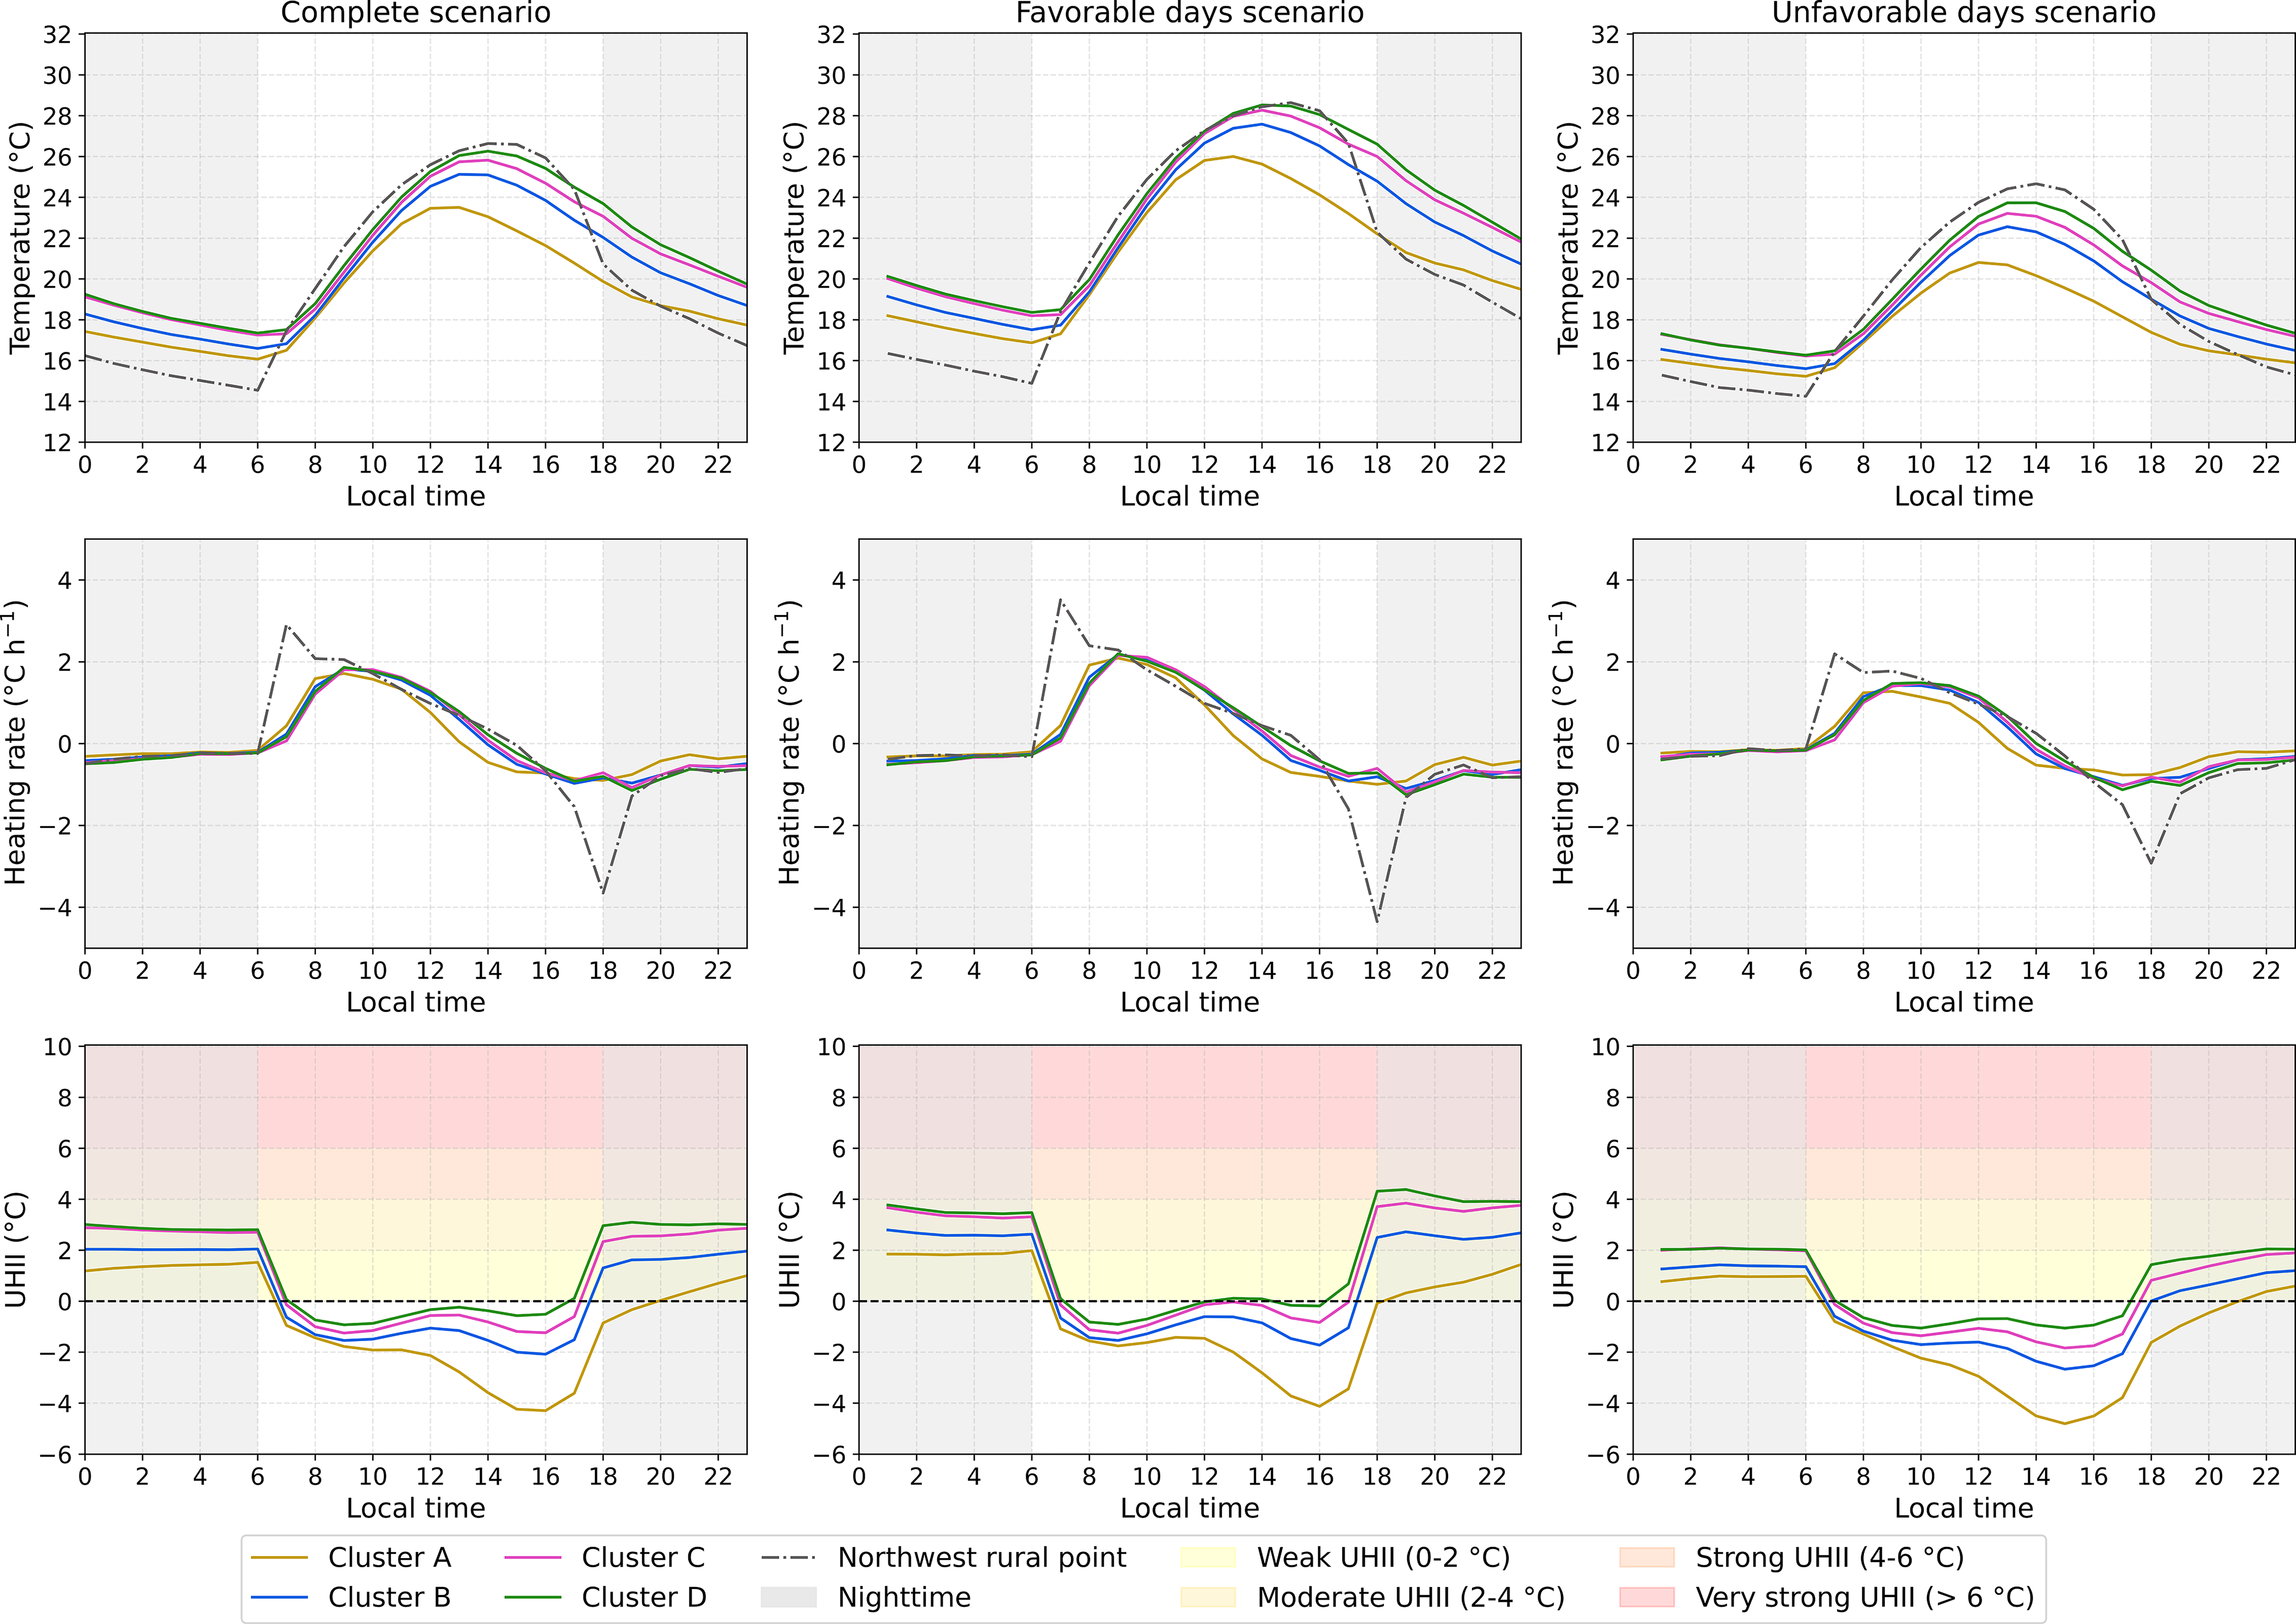
Compared to the northeastern rural reference (Fig. 8), UHI formation was most pronounced during nighttime (18:00-06:00 LT), especially on days with favorable meteorological conditions, consistent with the description by Oke et al. (2017). After sunset, rural areas cooled more rapidly due to higher sky view factors and lower thermal admittance. In contrast, urban areas retained heat due to the presence of built structures and anthropogenic emissions. The sharpest urban-rural contrast occurred around 18:00 LT, when the rural cooling rate exceeded that of urban areas. A similar dynamic occurred at sunrise, with faster rural warming between 06:00 and 07:00 LT, which reduced UHI intensity by 07:00 LT.

Hourly air temperature, heating rate, and UHI intensity in urban clusters for all September days, and for favorable and unfavorable days, relative to the northeastern rural point.
Anomalous relative peaks occur at 00:00 LT in the favorable/unfavorable scenarios, but not in the complete scenario. This behavior is attributed to discontinuities in the time series caused by non-consecutive day selections. At the daily transition, the end of one selected day and the beginning of the following selected day in the time series may be separated by one or more discarded days. These outliers were excluded from the plots to preserve consistency.
Among clusters, D consistently recorded the highest temperatures and A the lowest. Clusters C and D showed similar nighttime intensities (23:00-07:00 LT). Temperature differences among clusters narrowed around 06:00 LT, likely due to shading effects that delayed urban warming.
At 18:00 LT on favorable days, UHI magnitude reached 2.1 ± 1.0 °C in cluster A, 4.7 ± 1.0 °C in B, 5.9 ± 1.0 °C in C, and 6.5 ± 0.8 °C in D. Only cluster A showed weak UHI intensity at night; the others experienced moderate to very strong UHI. A daytime cooling island in cluster A (12:00-17:00 LT) is likely linked to earlier sea breeze arrival in that coastal-influenced sector.
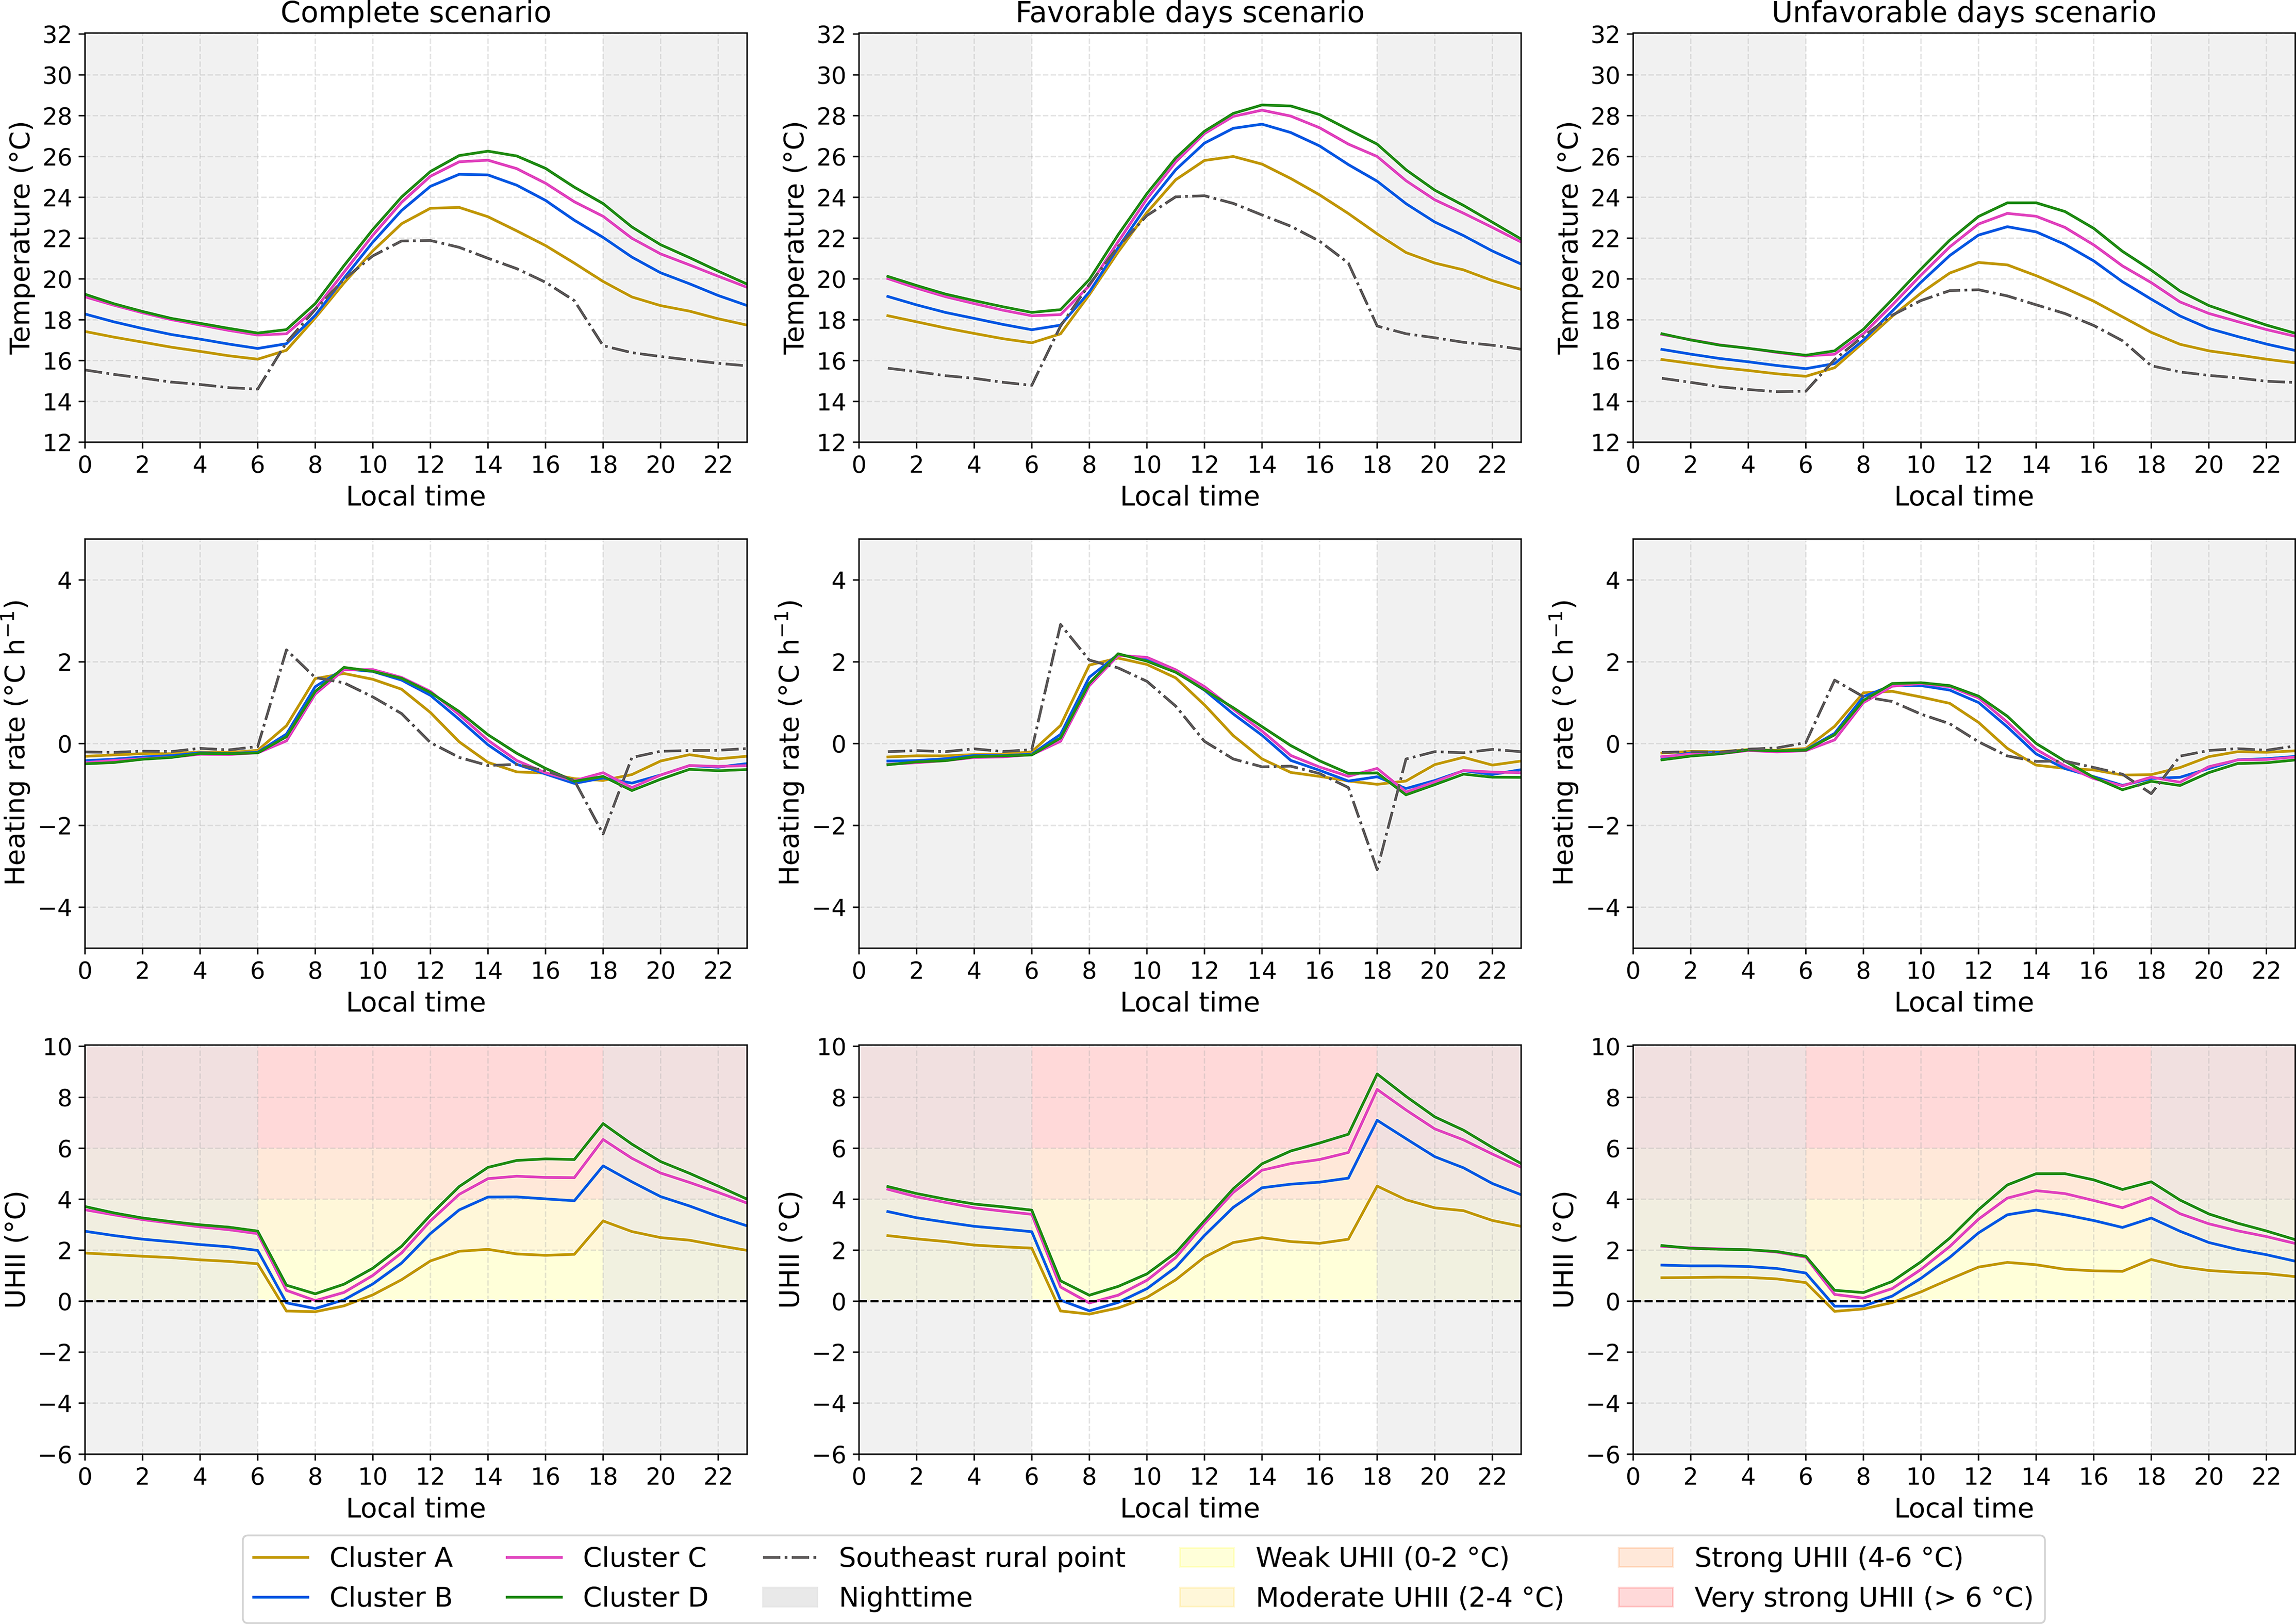
Using the southeastern rural reference (Fig. 9), UHI intensity was more pronounced than with the northeastern reference for both favorable and unfavorable days. On favorable days, the peak occurred at 18:00 LT, reaching 4.5 ± 0.8 °C in cluster A, 7.1 ± 1.0 °C in B, 8.3 ± 1.0 °C in C, and 8.9 ± 1.0 °C in D. Under unfavorable conditions, UHI intensity decreased, with peaks between 13:00 and 15:00 LT. Even then, clusters B, C, and D still showed moderate to strong intensities.
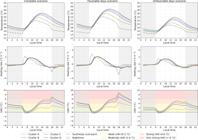
Hourly air temperature, heating rate, and UHI intensity in urban clusters for all September days, and for favorable and unfavorable days, relative to the southeast rural point.
Using the southwestern rural reference (Fig. 10), UHI intensity was highest at night. On favorable days, cluster A peaked at 21:00 LT (3.7 ± 0.6 °C), remaining stable until 06:00 LT. In clusters B, C, and D, the peak occurred at 19:00 LT, reaching 5.6 ± 0.7 °C, 6.8 ± 0.9 °C, and 7.3 ± 0.8 °C, respectively.
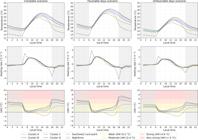
Hourly air temperature, heating rate, and UHI intensity in urban clusters for all September days, and for favorable and unfavorable days, relative to the southwest rural point.
According to the northwestern rural reference (Fig. 11), UHI exhibited a distinct pattern. As the warmest rural site - likely due to local circulation - UHI emerged mainly at night, while daytime conditions favored a cooling island across clusters. On favorable days, cluster A peaked at 06:00 LT (2.0 ± 0.3 °C), while clusters B, C, and D peaked at 19:00 LT with intensities of 2.7 ± 0.9 °C, 3.8 ± 1.1 °C, and 4.4 ± 0.9 °C, respectively.
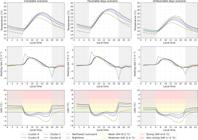
Hourly air temperature, heating rate, and UHI intensity in urban clusters for all September days, and for favorable and unfavorable days, relative to the northwest rural point.
These results confirm that the choice of rural reference point has a significant impact on UHI outcomes. Temperature differences vary by location, underscoring the role of local circulation and the representativeness of each rural site. Ribeiro et al. (2018) also reported differences in UHII timing depending on rural location, highlighting the sea breeze's influence at the southern site. Similarly, Umezaki (2020) found varying UHI magnitudes across rural points.
The predominantly nighttime UHI pattern observed in this study (September 2014-2023) contrasts with findings by Ferreira et al. (2012), Ferreira et al. (2013), and Ribeiro et al. (2018), who identified maximum UHII between 14:00 LT and 16:00 LT. However, under unfavorable conditions and using the southeastern rural point, our results showed peaks between 13:00 LT and 15:00 LT, which is consistent with those of the aforementioned studies. In those works, the rural reference points were in the non-urbanized region of São Bernardo do Campo, the same area as the southeastern rural point used in this study. Notably, this rural site (Itutinga station) is the same one used by Ribeiro et al. (2018).
These differences suggest that meteorological conditions and seasonal variability shape UHI behavior. While Ferreira et al. (2012) analyzed September 2004, the other studies focused on different months, reinforcing the potential for seasonal shifts. As shown here, UHI dynamics are influenced by multiple interacting factors, requiring caution in methodological comparisons.
The study by Lima and Rueda (2018), using 2007-2010 data, observed UHI peaks at 17:00 LT with elevated intensities persisting overnight, which is consistent with the general pattern found in our study Similarly, Umezaki (2020), analyzing January data (2004-2014), reported peak intensities at 18:00 LT and sustained nighttime UHI. These findings highlight how long-term studies can reveal characteristic temporal patterns in UHI behavior.
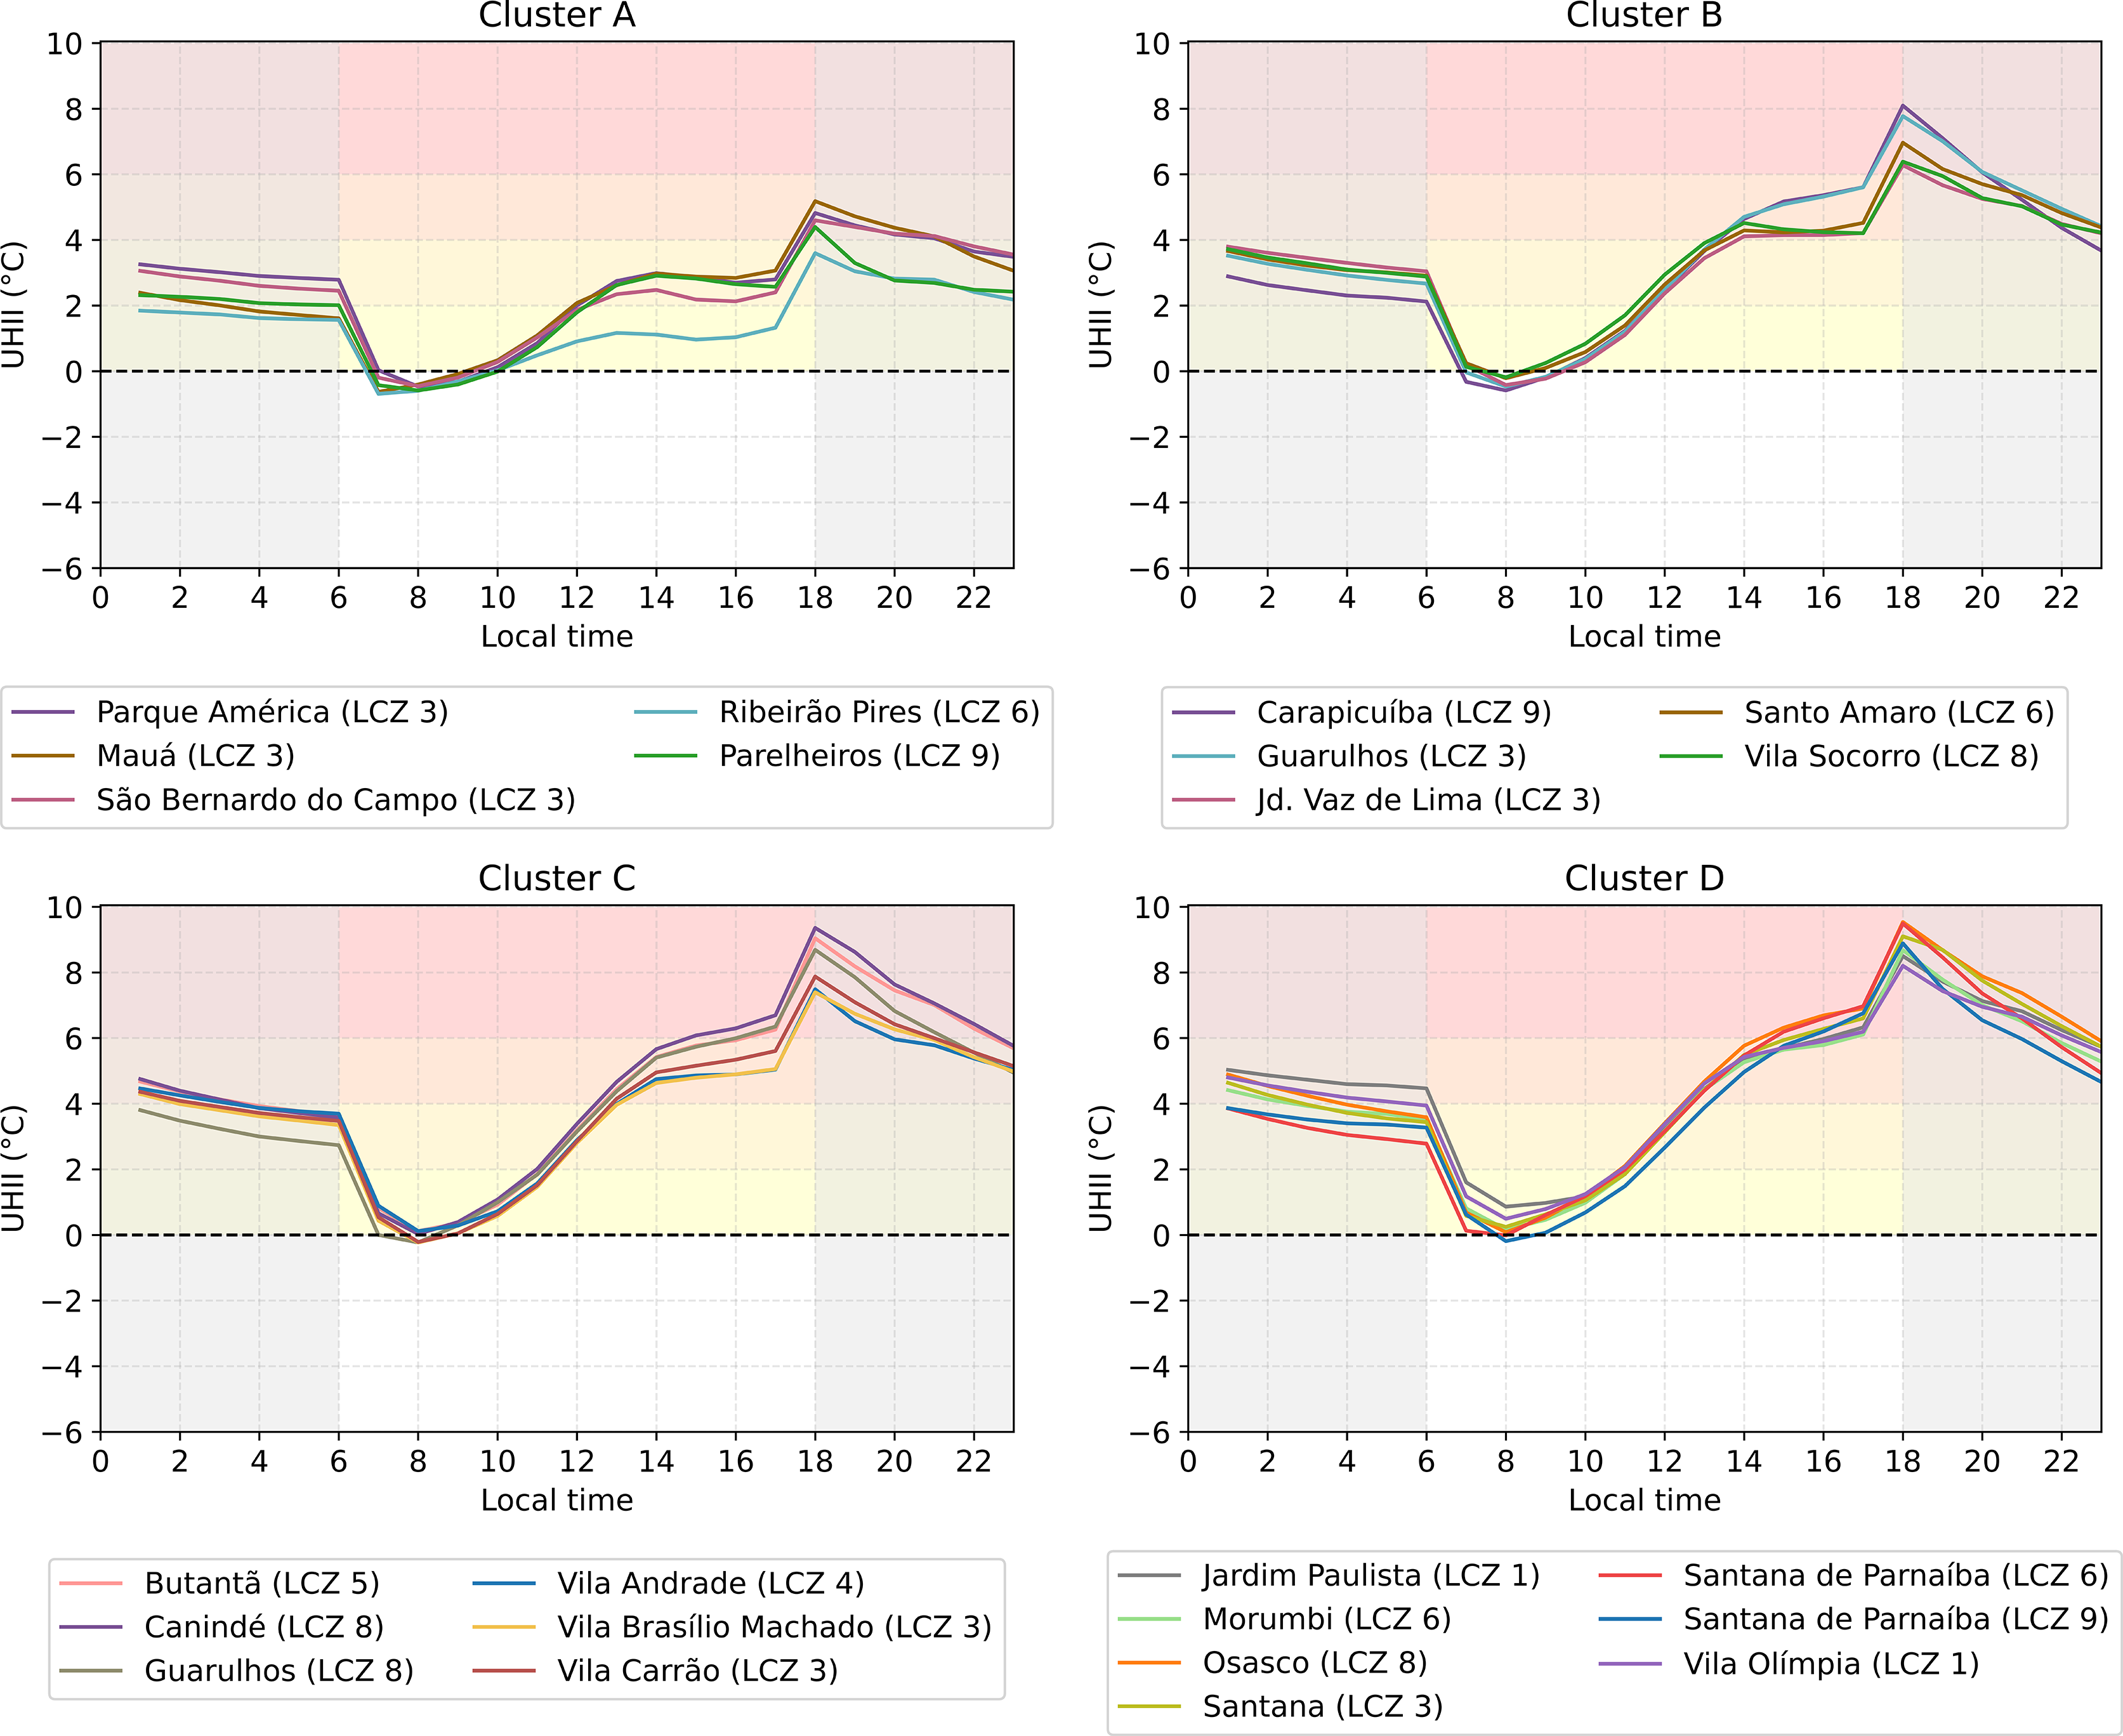
To evaluate UHI behavior by LCZ within each cluster, Fig. 12 shows UHI intensity on favorable days, using the southeastern rural point. Across the clusters, UHI generally peaked at 18:00 LT, with the magnitude varying according to LCZ characteristics and to geographic position.

Cluster A shows evening peaks between 3.6 ± 2.1 °C (LCZ 6 - Open lowrise) and 5.2 ± 2.4 °C (LCZ 3 - Compact lowrise). The higher values in LCZ 3 point are consistent with its greater building density, which favors heat storage and limits radiative cooling. In contrast, LCZ 6 cools more efficiently due to its more open urban form, characterized by a higher sky view factor and lower structural density. Additionally, in this cluster, LCZ 6 point is the closest to the coast and, therefore, more susceptible to the influence of sea breezes.
Cluster B presents a maximum of 8.3 ± 2.5 °C in LCZ 9 (Sparsely built) and around 6.6 ± 2.6 °C in more built-up LCZ. Despite the high evening peak, LCZ 9 point cools more efficiently toward the end of the night, consistent with its lower surface roughness and higher sky view factor.
Cluster C exhibits peaks between 7.5 ± 2.8 °C and 9.5 ± 2.9 °C at 18:00 LT across LCZ 3 and 8, respectively. By 06:00 LT, values range from 2.8 ± 1.8 °C (LCZ 8 - Large lowrise) to 3.7 ± 1.7 °C (LCZ 4 - Open highrise). Taller buildings and reduced sky view in LCZ 4 point support greater nighttime heat retention. Furthermore, differences within LCZ 8 points suggest additional influences from broader urban context (central vs. peripheral).
Cluster D shows intensities of 8.4 ± 2.6 °C to 9.7 ± 2.6 °C, primarily actress LCZ 6 and LCZ 1, respectively. By 06:00 LT, UHII ranges from 2.8 ± 1.7 °C (LCZ 6) to 4.5 ± 1.7 °C (LCZ 1 - Compact highrise). Stronger cooling in LCZ 6 point is consistent with its higher sky view factor and greater vegetation cover, while LCZ 1 maintains higher nighttime temperatures due to its taller buildings, low sky view factor, and greater radiative trapping - patterns consistent with Hope et al. (2022) and Rech et al. (2024).
3.5. Comparison of simulated and observed urban heat island patterns
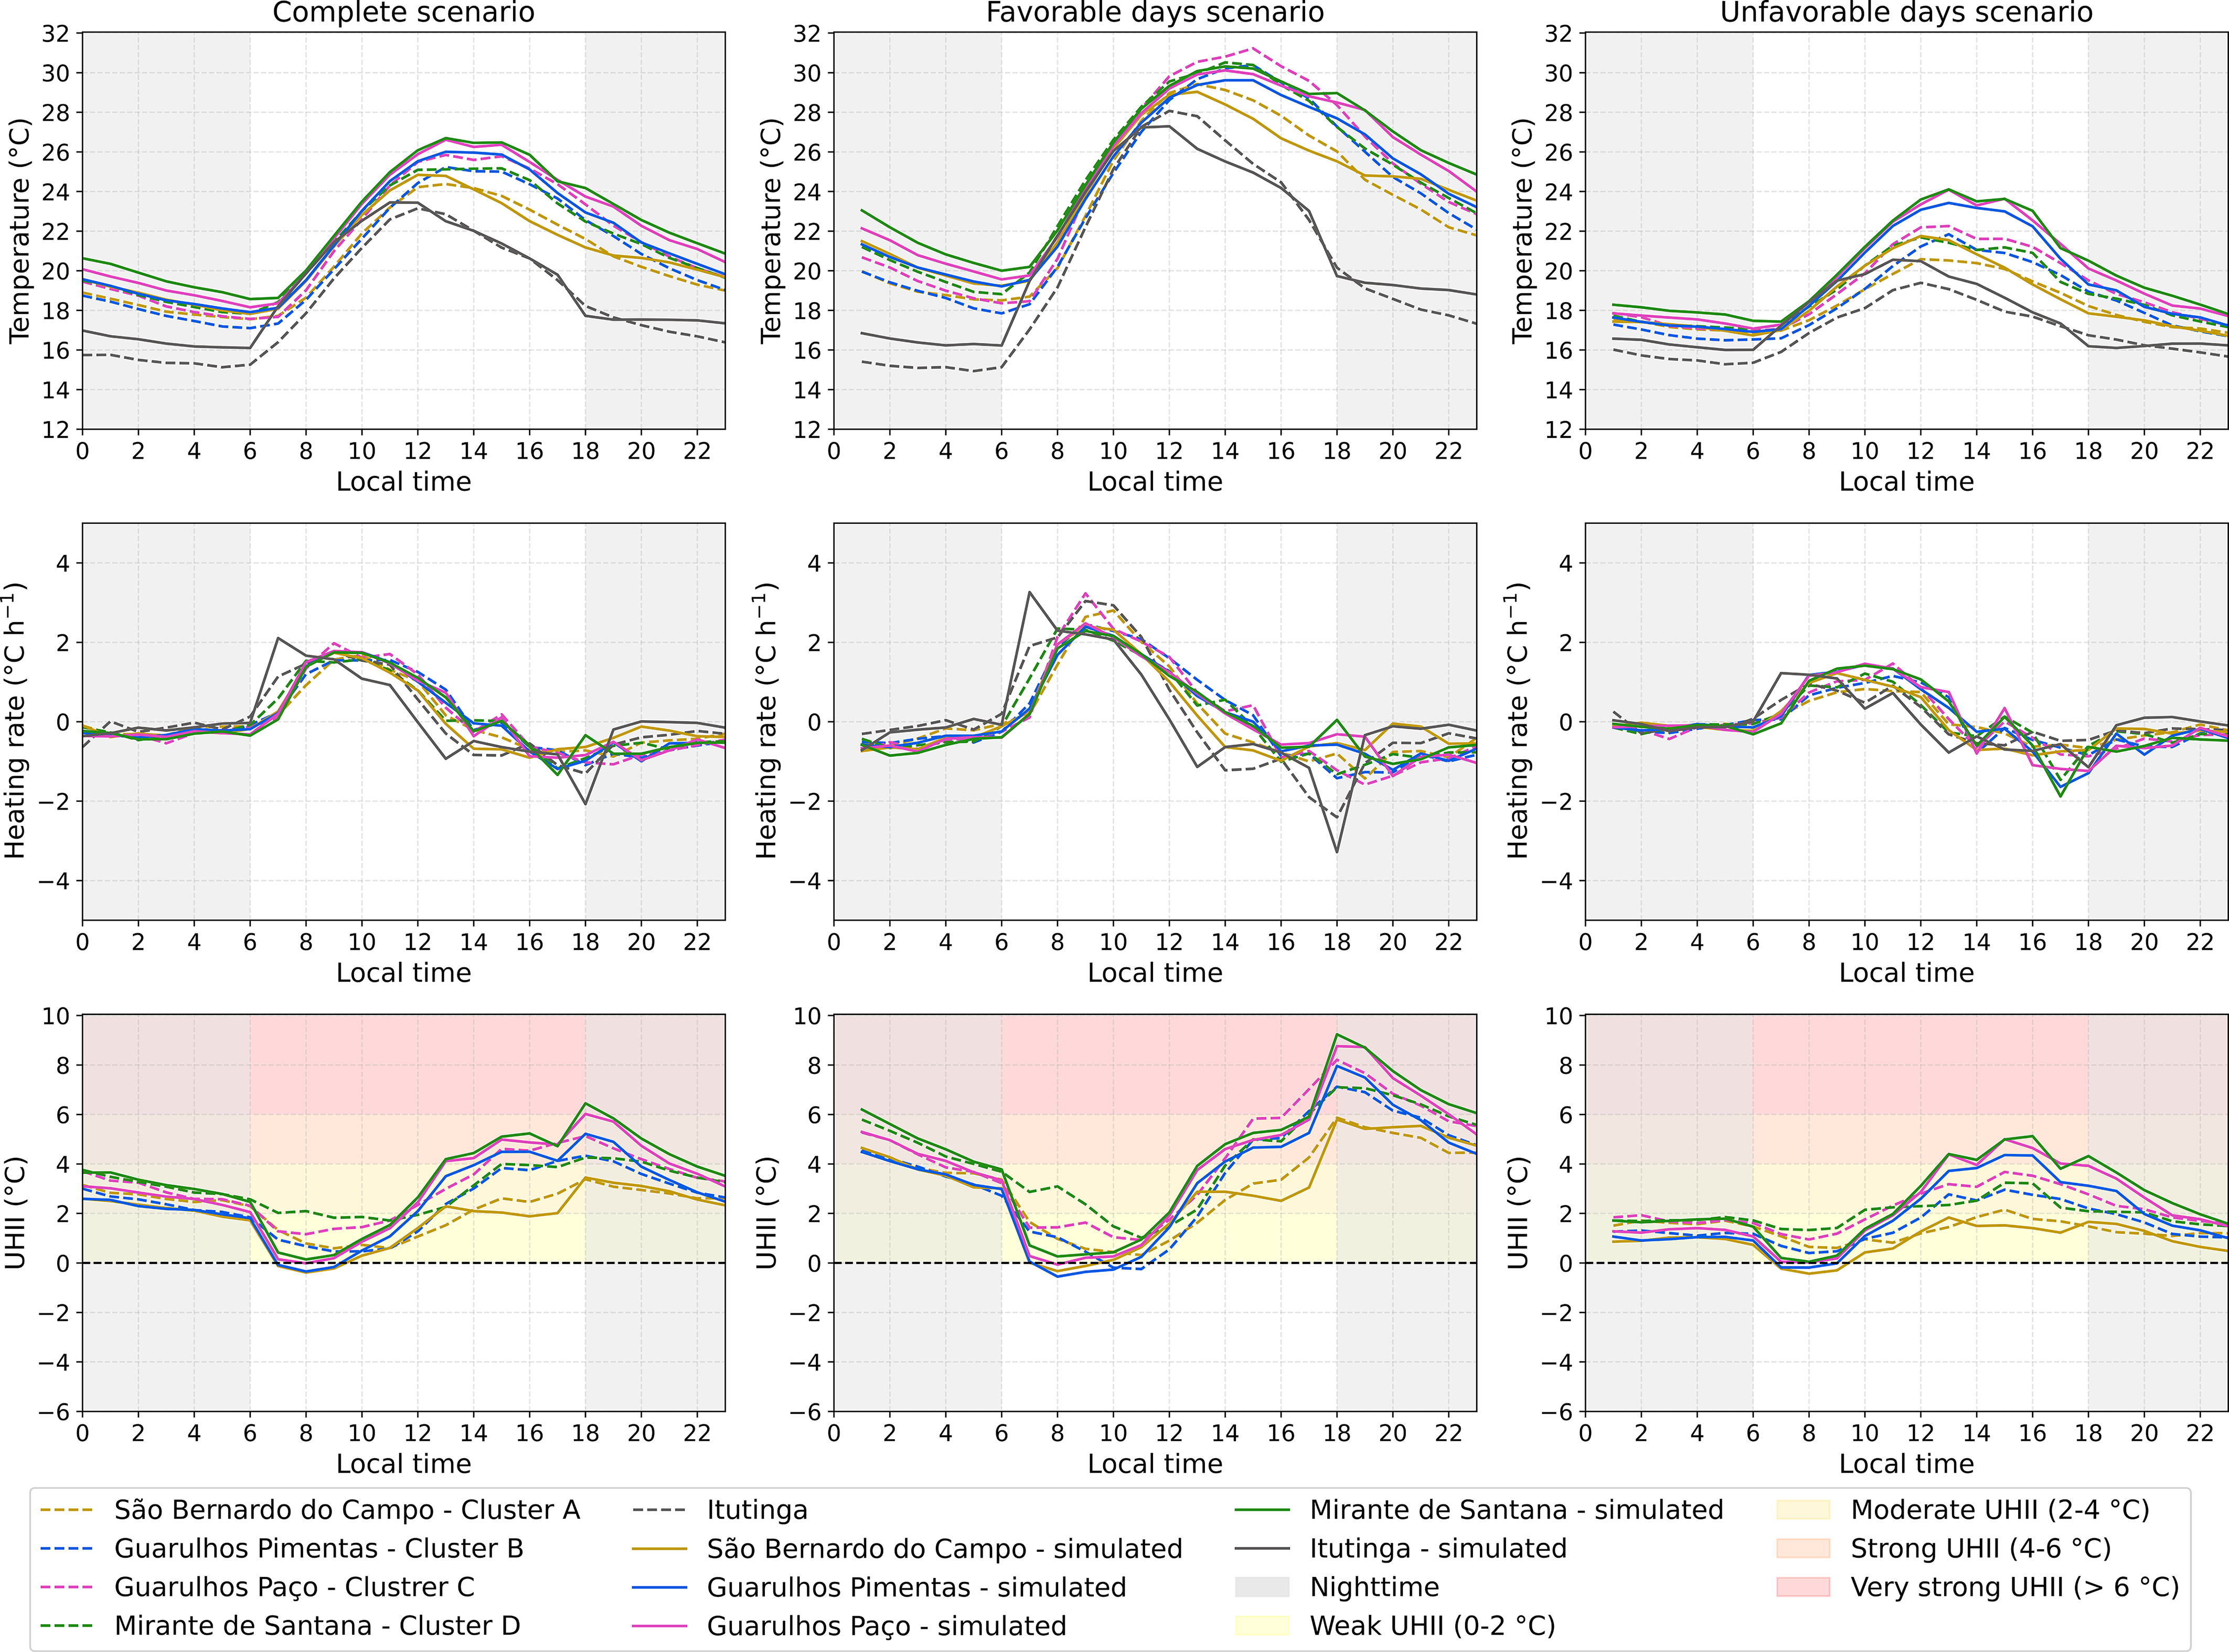
To support the simulation findings, an analysis was conducted using observed meteorological data. The southeastern rural reference was the Itutinga station (data available for September 2015), and the southwestern rural point was Morro Grande (September 2023). For comparison, one urban station from each cluster with data for those years was selected: São Bernardo do Campo (Cluster A, 2015 and 2023), Guarulhos Pimentas (Cluster B, 2015), Guarulhos Paço (Cluster C, 2015 and 2023), and Mirante de Santana (Cluster D, 2015 and 2023). Due to data limitations, Cluster B could not be evaluated for the 2023 period.
The observed UHI in 2015, relative to Itutinga, showed similar behavior to the simulations (Fig. 13), particularly at night. The model captured the peak hour and general pattern, although it underestimated UHII between 06:00 LT and 12:00 LT, likely due to overestimated rural temperatures. Overall, the clusters retained their thermal behavior: Guarulhos Paço and Mirante de Santana registered the highest temperatures, while São Bernardo do Campo was cooler, especially from midday to evening, possibly due to the stronger effects of the sea breeze.
UHII maximum occurred around 18:00 LT on favorable days, with the highest intensities between 14:00 LT and 00:00 LT. On unfavorable days, UHI was weaker, peaking between 12:00 LT and 16:00 LT. This pattern aligns with previous studies that reported maximum UHI intensity in the afternoon when using rural sites in the southeast (Ferreira et al., 2012; Ferreira et al., 2013; Ribeiro et al., 2018).
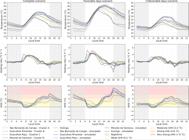
Observed and simulated hourly temperature, heating rate, and UHI intensity for all days, and for favorable and unfavorable days in September 2015.
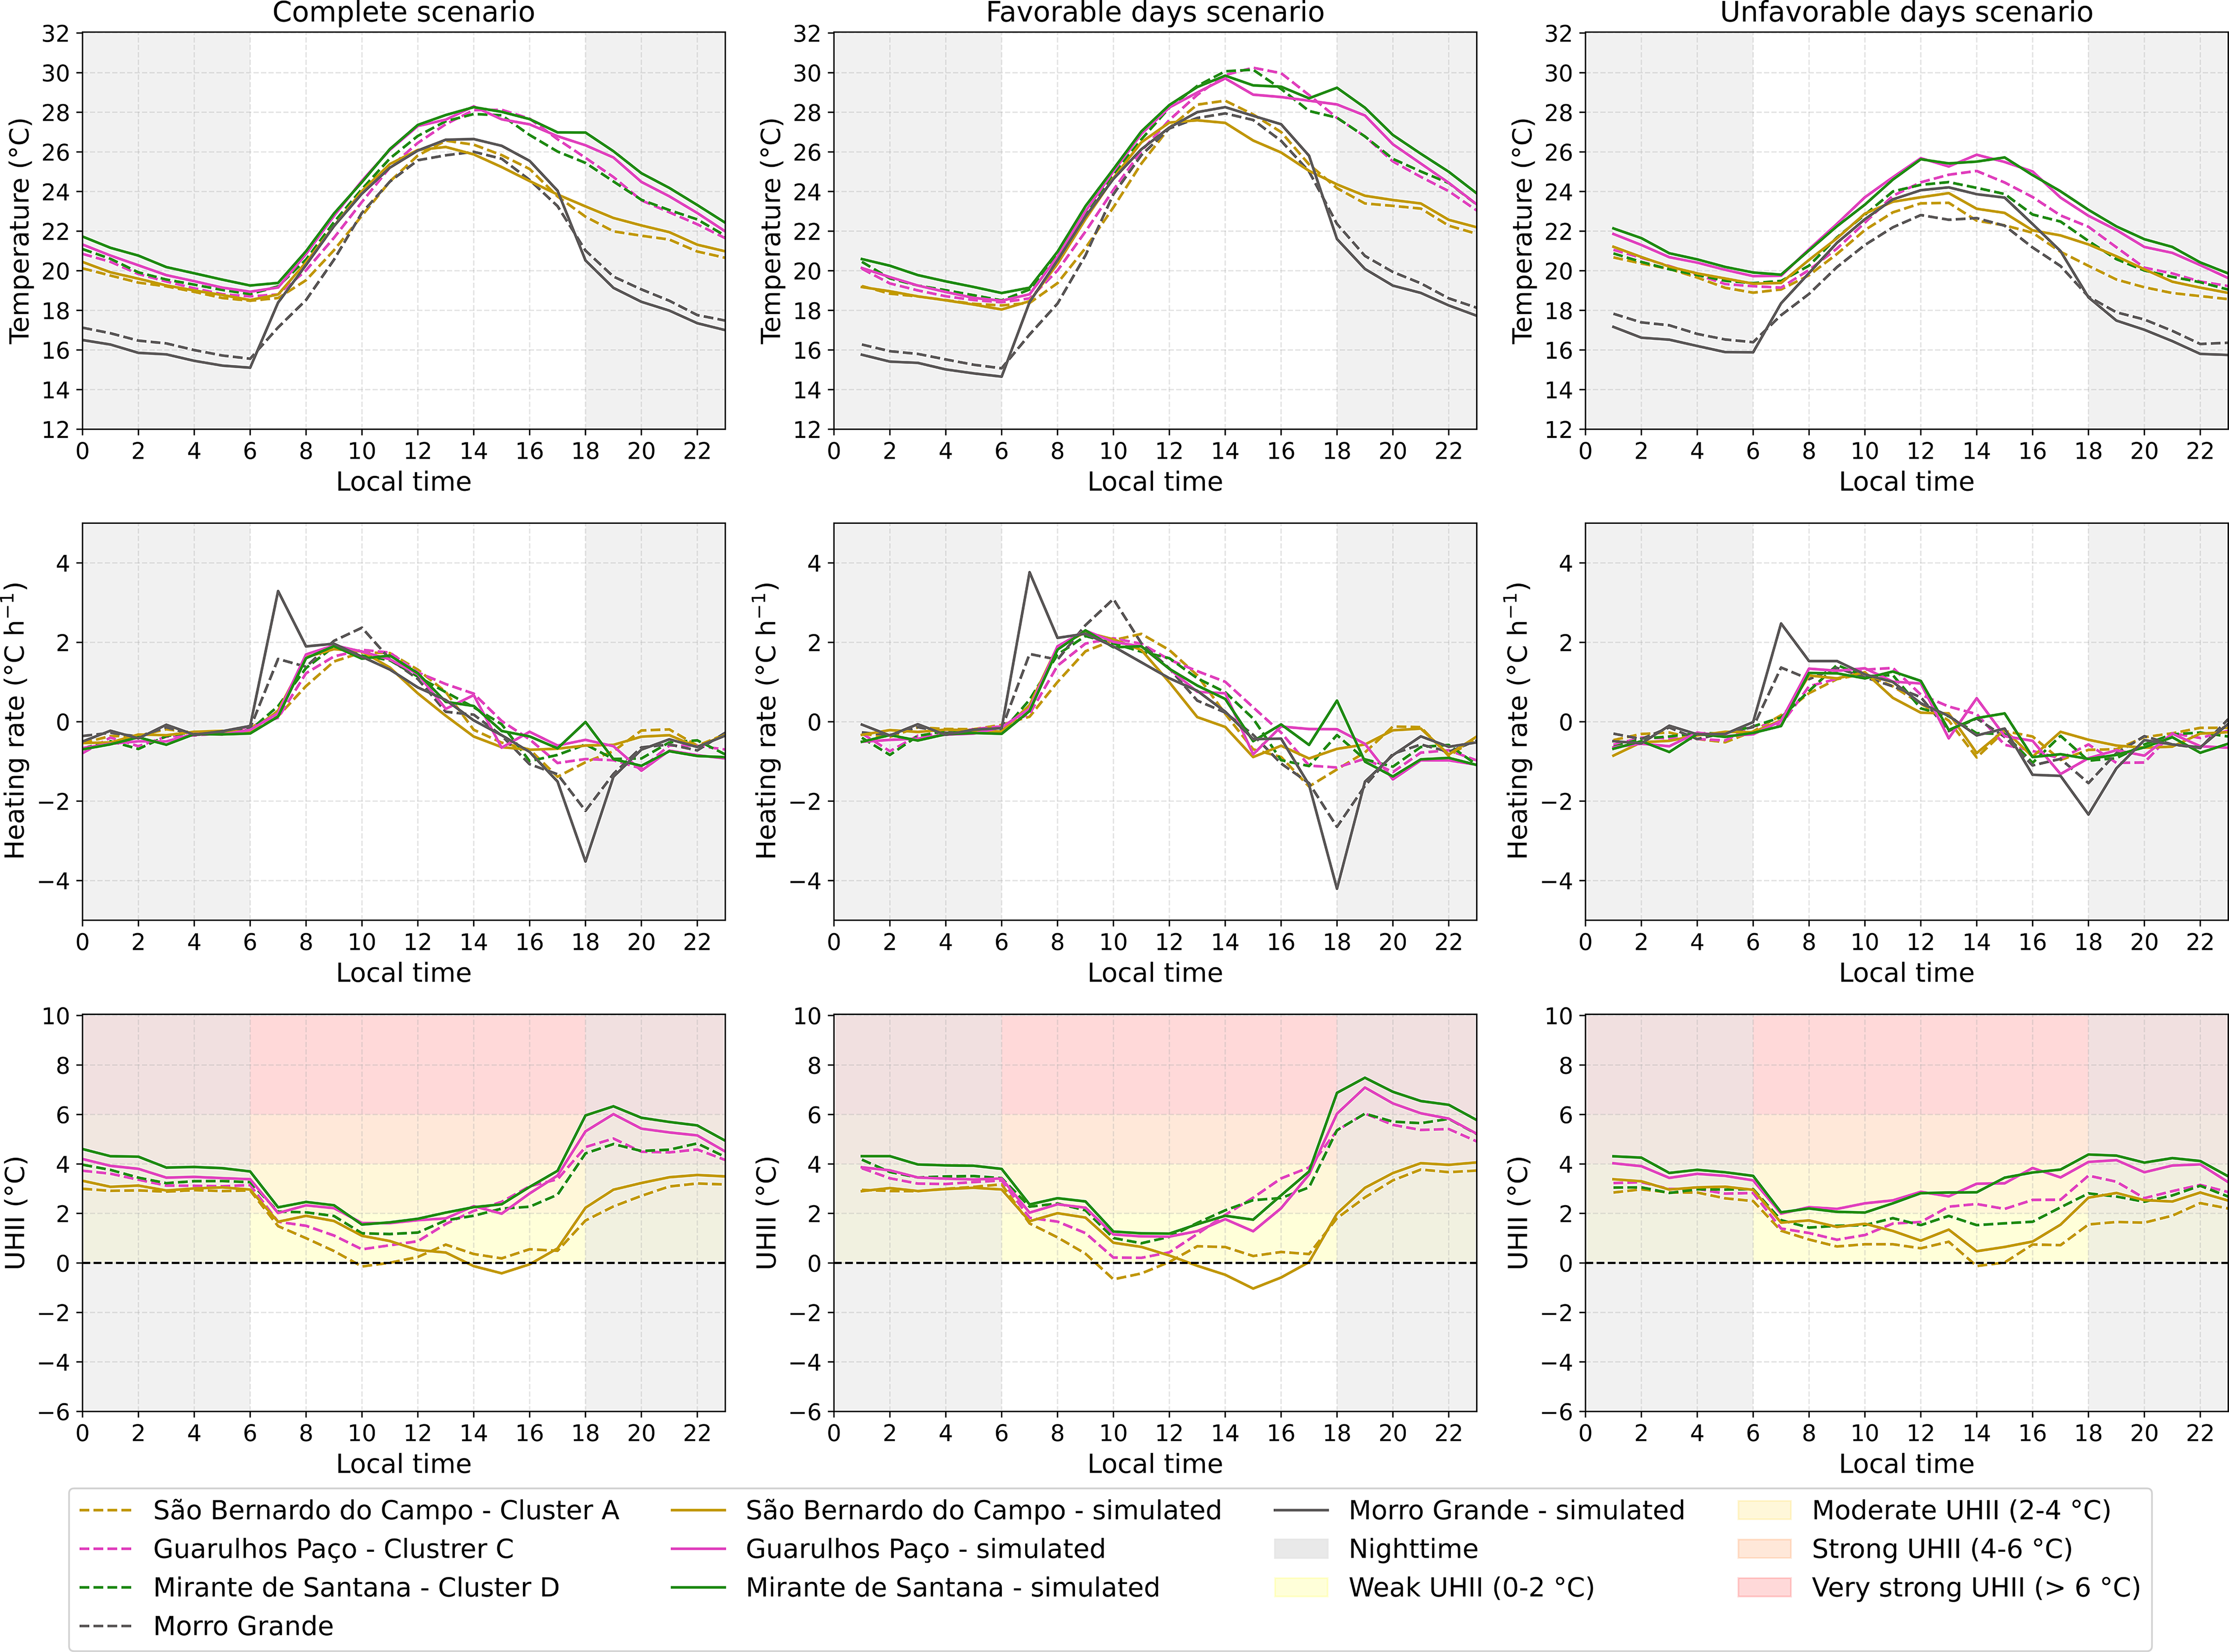
A similar agreement between observations and simulations was found for September 2023 (Fig. 14). The model reproduced the temporal pattern and peak hour but slightly overestimated urban temperatures and rural warmth. As in 2015, the main discrepancies occurred between 06:00 LT and 12:00 LT, when observed UHII values were stronger than simulated values.
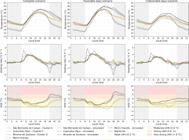
Observed and simulated hourly temperature, heating rate, and UHI intensity for all days, and for favorable and unfavorable days in September 2023.
The UHI defined using Morro Grande (southwestern rural point) was consistent with the multi-year simulation average. Temperature differences among clusters persisted, with São Bernardo do Campo (Cluster A) remaining the coolest. UHI was present most of the day, with higher intensities at night. In Cluster A, UHII dropped to near zero from 12:00 LT to 18:00 LT, matching the simulations. Other clusters maintained UHI throughout the period. On unfavorable days, UHII decreased in all clusters, aligning with simulation results.
Observed data on favorable days showed that Guarulhos Paço, Mirante de Santana, and Guarulhos Pimentas recorded UHII peaks around 18:00 LT, a pattern also captured by the simulations. UHI intensity declined overnight, reaching its lowest point between 10:00 LT and 12:00 LT. However, the simulations anticipated this minimum around 07:00-08:00 LT, indicating a slight timing mismatch and the need for further improvements in model performance.
4. Conclusions
This study characterized the urban morphology of the MASP using the LCZ classification. Eight LCZ types were identified, with LCZ 3 (39%), LCZ 6 (25%), LCZ 9 (21%), and LCZ 8 (11%) being the most prevalent. Incorporating LCZ into WRF simulations improved model performance, especially for wind speed.
Despite shared LCZ classifications, urban points showed varied temperature behavior, indicating that local factors beyond morphology influence temperature. Cluster analysis revealed a spatial temperature gradient, with cooler areas located near the coast (southeast, south, and southwest MASP) and warmer areas in the central, northern, and northwestern regions, resulting in the formation of four urban clusters.
UHI intensity was stronger at night, with a maximum around 18:00 LT, and was more intense on days with favorable meteorological conditions (clear skies, calm winds), identified using 10-year climatological data from the Mirante de Santana station. Conversely, unfavorable conditions weakened the UHI.
The UHI intensity also varied depending on the choice of the rural reference point, highlighting the influence of local circulation. Comparisons using the southeastern rural point produced higher intensities than those using the northwestern point due to the MASP's southeast-to-northwest temperature gradient. On unfavorable days, the southeastern rural reference showed UHI peaks in the afternoon (13:00-15:00 LT), consistent with previous studies in the same region, emphasizing the impact of seasonality and meteorological variability on UHI behavior.
Urban morphology further influenced UHI evolution: denser LCZ with lower sky view factors (e.g., LCZ 1) retained more heat overnight, while less dense areas (e.g., LCZ 6) cooled more effectively. Observational data supported the simulation results, reinforcing the value of atmospheric modeling for urban climate studies.
For future work, it is recommended to explore direct correlations between UHI magnitude and influencing variables to deepen understanding of its drivers. It is also crucial to examine UHI under varying conditions - daily, seasonal, synoptic, and spatial - to support the development of effective mitigation and adaptation strategies for urban climate resilience in the MASP. Additionally, advancing this line of research requires a more detailed investigation of surface processes - such as energy balance, radiation, soil-atmosphere moisture exchange, and urban canopy physics - which play a fundamental role in shaping urban temperature patterns.
-
Data Availability Statement
The data that support the findings of this study are available from the corresponding author, upon reasonable request.
-
Funding
The authors thank CNPq for funding support (Process 130277/2023-1).
Acknowledgments
The authors thank LAPAt and the Master Laboratory for providing computational resources, and LabMicro and the BIOMASP+ project for making meteorological data available. We also thank INCT Klimapolis for its scientific contributions to urban environmental research. This work is a direct contribution to the research themes of the National Institute of Science and Technology - INCT Klimapolis, which is funded by the Brazilian Ministry of Science, Technology, and Innovation (MCTI), and the National Council for Scientific and Technological Development (CNPq) under project number 406728/2022-4.
AI Usage Statement
The authors declare that no AI were used in the preparation of this manuscript.
References
-
ABREU, R.C.; HALLAK, R.; ROCHA, H.R. Effects of local vegetation and regional controls in near-surface air temperature for Southeastern Brazil. Atmosphere, v. 13, n. 11, 1758, 2022. doi
» https://doi.org/10.3390/atmos13111758 -
ALMEIDA, P.L.B.; RIBEIRO, F.N.D. Multivariate analysis of the urban heat island of the Metropolitan Area of São Paulo, Brazil. Revista Brasileira de Meteorologia, v. 39, e39240045, 2024. doi
» https://doi.org/10.1590/0102-77863910045 -
ANJOS, M.; TARGINO, A.C.; KRECL, P.; OUKAWA, G.Y.; BRAGA, R.F. Analysis of the urban heat island under different synoptic patterns using local climate zones. Building And Environment, v. 185, 107268, 2020. doi
» https://doi.org/10.1016/j.buildenv.2020.107268 -
BECHTEL, B.; ALEXANDER, P.J.; BöHNER, J.; CHING, J.; CONRAD, O.; et al Mapping local climate zones for a worldwide database of the form and function of cities. International Journal of Geo-Information, v. 4, n. 1, p. 199-219, 2015. doi
» https://doi.org/10.3390/ijgi4010199 - CAMPELO, A.K.N. Ilhas de Calor Urbanas de Superfície ao Longo de um Gradiente Climático no Estado de São Paulo Dissertação de Mestrado, Programa de Pós-Graduação em Ciência Ambiental, Instituto de Energia e Ambiente, Universidade de São Paulo, São Paulo, 2024.
-
CARDOSO, R.S.; AMORIM, M.C.C. Urban heat island analysis using the ‘local climate zone’ scheme in Presidente Prudente, Brazil. Investigaciones Geográficas, n. 69, p. 107-118, 2018. Available at: https://www.redalyc.org/articulo.oa?id=17656164007
» https://www.redalyc.org/articulo.oa?id=17656164007 -
CHEN, F.; KUSAKA, H.; BORNSTEIN, R.; CHING, J.; GRIMMOND, C.S.B.; et al The integrated WRF/urban modelling system: development, evaluation, and applications to urban environmental problems. International Journal of Climatology, v. 31, n. 2, p. 273-288, 2011. doi
» https://doi.org/10.1002/joc.2158 -
DEE, D.P.; UPPALA, S.M.; SIMMONS, A.J., BERRISFORD, P.; POLI, P.; et al The ERAInterim reanalysis: Configuration and performance of the data assimilation system. Quarterly Journal Of The Royal Meteorological Society, v. 137, n. 656, p. 553-597, 2011. doi
» https://doi.org/10.1002/qj.828 -
DEMUZERE, M.; KITTNER, J.; MARTILLI, A.; MILLS, G.; MOEDE, C.; et al A global map of local climate zones to support earth system modelling and urban-scale environmental science. Earth System Science Data, v. 14, n. 8, p. 3835-3873, 2022a. doi
» https://doi.org/10.5194/essd-14-3835-2022 -
DEMUZERE, M.; ARGüESO, D.; ZONATO, A.; KITTER, J. W2W: a python package that injects WUDAPT'S Local Climate Zone information in WRF. Journal of Open Source Software, v. 7, n. 76, p. 4432-4439, 2022b. doi
» https://doi.org/10.21105/joss.04432 - DODMAN, D.; HAYWARD, B.; PELLING, M.; CASTAN BROTO, V.; CHOW, W.; et al Cities, settlements and key infrastructure. In: Climate Change 2022: Impacts, Adaptation and Vulnerability. Contribution of Working Group II to the Sixth Assessment Report of the Intergovernmental Panel on Climate Change Cambridge: Cambridge University Press, 2022.
- ESPINOSA, S.A.I. Modelagem da Poluição Atmosférica em São Paulo Utilizando Inventários de Emissões Veiculares Bottom-up Tese de Doutorado, Departamento de Ciências Atmosféricas, Universidade de São Paulo, São Paulo, 2017.
- FERREIRA, L.S. Vegetação, Temperatura de Superfície e Morfologia Urbana: Um Retrato da Região Metropolitana de São Paulo Tese de Doutorado, Faculdade de Arquitetura e Urbanismo, Universidade de São Paulo, São Paulo, 2019.
-
FERREIRA, M.J.; OLIVEIRA, A.P.; SOARES, J.; CODATO, G.; BáRBARO, E.W.; et al Radiation balance at the surface in the city of São Paulo, Brazil: Diurnal and seasonal variations. Theoretical and Applied Climatology, v. 107, p. 229-246, 2012. doi
» https://doi.org/10.1007/s00704-011-0480-2 -
FERREIRA, M.J.; OLIVEIRA, A.P.; SOARES, J. Diurnal variation in stored energy flux in São Paulo city, Brazil. Urban Climate, v. 5, p. 36-51, 2013. doi
» https://doi.org/10.1016/j.uclim.2013.06.001 -
FRANCO, D.M.P.; ANDRADE, M.F.; YNOUE, R.Y.; CHING, J. Effect of Local Climate Zone (LCZ) classification on ozone chemical transport model simulations in Sao Paulo, Brazil. Urban Climate, v. 27, p. 293-313, 2019. doi
» https://doi.org/10.1016/j.uclim.2018.12.007 -
FREITAS, E.D.; ROZOFF, C.M.; COTTON, W.R.; DIAS, P.L.S. Interactions of an urban heat island and sea-breeze circulations during winter over the metropolitan area of São Paulo, Brazil. Boundary-Layer Meteorology, v. 122, n. 1, p. 43-65, 2007. doi
» https://doi.org/10.1007/s10546-006-9091-3 - FREITAS, E.D. Modelagem numérica em mesoescala: Desafios sobre áreas urbanas. In: Tavares, J.; Anelli, R. (orgs.). Notas Introdutórias Sobre Infraestruturas e Mudança Climática Curitiba: Editorial Casa, v. 1, p. 29-45, 2023.
-
HALLAK, R.; PEREIRA FILHO, A.J. Metodologia para análise de desempenho de simulações de sistemas convectivos na Região Metropolitana de São Paulo com o modelo ARPS: sensibilidade a variações com os esquemas de advecção e assimilação de dados. Revista Brasileira de Meteorologia, v. 26, n. 4, p. 591-608, 2011. doi
» https://doi.org/10.1590/S0102-77862011000400009 -
HIDALGO, J.; MASSON, V.; GIMENO, L. Scaling the daytime urban heat island. and urban-breeze circulation. Journal of Applied Meteorology and Climatology, v. 49, n. 5, p. 889-901, 2010. doi
» https://doi.org/10.1175/2009JAMC2195.1 -
HONG, S.Y.; NOH, Y.; DUDHIA, J. A new vertical diffusion package with an explicit treatment of entrainment processes. Monthly Weather Review, v. 134, n. 9, p. 2318-2341, 2006. doi
» https://doi.org/10.1175/MWR3199.1 -
HOPPE, I.L.; WOLLMANN, C.A.; BUSS, A.S.; GOBO, J.P.A.; SHOOSHTARIAN, S. Local climate zones, sky view factor and magnitude of daytime/nighttime urban heat islands in Balneário Camboriú, SC, Brazil. Climate, v. 10, n. 12, p. 197-214, 2022. doi
» https://doi.org/10.3390/cli10120197 -
IACONO, M.J.; DELAMERE, J.S.; MLAWER, E.J.; SHEPARD, M.W.; CLOUGH, S.A.; et al Radiative forcing by longlived greenhouse gases: calculations with the AER radiative transfer models. Journal Of Geophysical Research: Atmospheres, v. 113, n. 13, 13103, 2008. doi
» https://doi.org/10.1029/2008jd009944 - IPCC. Climate change 2021: The Physical Science Basis. Contribution of Working Group I to the Sixth Assessment Report of the Intergovernmental Panel on Climate Change Cambridge: Cambridge University Press, 2021.
-
JIMéNEZ, P.A.; DUDHIA, J.; GONZáLEZ-ROUCO, F.; NAVARRO, J.; MONTáVEZ, J.P.; et al A revised scheme for the WRF surface layer formulation. Monthly Weather Review, v. 140, n. 3, p. 898-918, 2012. doi
» https://doi.org/10.1175/mwr-d-11-00056.1 - KODINARIYA, T.M.; MAKWANA, P.R. Review on determining the number of cluster in K-means clustering. International Journal of Advance Research in Computer Science and Management Studies, v. 1, n. 6, p. 90-95, 2013.
-
LIMA, G.N.; RUEDA, V.O.M. The urban growth of the metropolitan area of Sao Paulo and its impact on the climate. Weather And Climate Extremes, v. 21, p. 17-26, 2018. doi
» https://doi.org/10.1016/j.wace.2018.05.002 - MACQUEEN, J. Some methods for classification and analysis of multivariate observations. Proceedings of the 5th Berkeley Symposium on Mathematical Statistics and Probability, v. 1, p. 281-297, 1967.
-
MANCHENO, G.; CASTRO-MOLINARE, J.; JORQUERA, H. Predictive modeling the effect of Local Climate Zones (LCZ) on the urban meteorology in a tropical andean area. Modeling Earth Systems and Environment, v. 10, n. 5, p. 6133-6153, 2024. doi
» https://doi.org/10.1007/s40808-024-02121-0 -
MARTILLI, A.; CLAPPIER, A.; ROTACH, M.W. An urban surface exchange parameterisation for mesoscale models. Boundary-Layer Meteorology, v. 104, n. 2, p. 261-304, 2002. doi
» https://doi.org/10.1023/a:1016099921195 -
MORRISON, H.; THOMPSON, G.; TATARSKII, V. Impact of cloud microphysics on the development of trailing stratiform precipitation in a simulated squall line: Comparison of one- and two-moment schemes. Monthly Weather Review, v. 137, n. 3, p. 991-1007, 2009. doi
» https://doi.org/10.1175/2008mwr2556.1 - OKE, T.R. Boundary Layer Climates 2nd ed. London: Taylor & Francis Group, 1987.
-
OKE, T.R. The energetic basis of the urban heat island. Quarterly Journal of the Royal Meteorologycal Society, v. 108, n. 455, p. 1-24, 1982. doi
» https://doi.org/10.1002/qj.49710845502 - OKE, T.R.; MILLS, G.; CHRISTEN, A.; VOOGT, A. Urban Climate Cambridge: Cambridge University Press, 2017.
-
OLIVEIRA, A.P.; MACHADO, A.J.; ESCOBEDO, J.F.; SOARES, J. Diurnal evolution of solar radiation at the surface in the city of São Paulo: seasonal variation and modeling. Theoretical And Applied Climatology, v. 71, n. 3-4, p. 231-249, 2002. doi
» https://doi.org/10.1007/s007040200007 -
OLIVEIRA, A.P.; BORNSTEIN, R.D.; SOARES, J. Annual and diurnal wind patterns in the city of São Paulo. Water, Air and Soil Pollution: Focus, v. 3, n. 5/6, p. 3-15, 2003. doi
» https://doi.org/10.1023/a:1026090103764 - PIELKE, R.A. Mesoscale Meteorological Modeling International Geophysics Series. 2nd. ed. Cambridge: Academic Press, v. 78, 676 p., 2002.
-
POWERS, J.G.; KLEMP, J.B.; SKAMAROCK, W.C.; DAVIS, C.A.; DUDHIA, J.; et al The Weather Research and Forecasting (WRF) model: overview, system efforts, and future directions. Bulletin of the American Meteorological Society, v. 98, n. 8, p. 1717-1737, 2017. doi
» https://doi.org/10.1175/BAMS-D-15-00308.1 -
RECH, B.; MOREIRA, R. N.; MELLO, T. A. G.; KLOUCEK, T.; KAMÁREK, J. Assessment of daytime and nighttime surface urban heat islands across local climate zones - A case study in Florianópolis, Brazil. Urban Climate, v. 55, 101954, 2024. doi
» https://doi.org/10.3390/ijgi4010199 -
RIBEIRO, F.N.D. OLIVEIRA, A.P.; SOARES, J.; MIRANDA, R.M.; BARLAGE, M.; et al Effect of sea breeze propagation on the urban boundary layer of the metropolitan region of Sao Paulo, Brazil. Atmospheric Research, v. 214, p. 174-188, 2018. doi
» https://doi.org/10.1016/j.atmosres.2018.07.015 -
RIBEIRO, I.; MARTILLI, A.; FALLS, M.; ZONATO, A.; VILLALBA, G. Highly resolved WRF-BEP/BEM simulations over Barcelona urban area with LCZ. Atmospheric Research, v. 248, 105220, 2021. doi
» https://doi.org/10.1016/j.atmosres.2020.105220 -
ROTH, M. Review of atmospheric turbulence over cities. Quarterly Journal of The Royal Meteorological Society, v. 126, n. 564, p. 941-990, 2000. doi
» https://doi.org/10.1002/qj.49712656409 -
SALAMANCA, F.; MARTILLI, A. A new building energy model coupled with an urban canopy parameterization for urban climate simulations - Part II. Validation with one-dimension off-line simulations. Theoretical And Applied Climatology, v. 99, n. 3-4, p. 345-356, 2009. doi
» https://doi.org/10.1007/s00704-009-0143-8 -
SILVA, F.B.; LONGO, K.M.; ANDRADE, F.M. Spatial and temporal variability patterns of the urban heat island in São Paulo. Environments, v. 4, n. 2, 27, 2017. doi
» https://doi.org/10.3390/environments4020027 - SKAMAROCK, W.C.; KLEMP, J.B.; DUDHIA, J.; GILL, D.O.; LIU, Z.; et al A Description of the Advanced Research WRF Model Version 4 NCAR Technical Notes. NCAR/TN-556+STR. Boulder, 2021.
-
SOUCH, C.; GRIMMOND, S. Applied climatology: urban climate. Progress In Physical Geography: Earth and Environment, v. 30, n. 2, p. 270-279, 2006. doi
» https://doi.org/10.1191/0309133306pp484pr -
STEWART, I.D.; OKE, T.R. Local climate zones for urban temperature studies. Bulletin of the American Meteorological Society, v. 93, n. 12, p. 1879-1900, 2012. doi
» https://doi.org/10.1175/BAMS-D-11-00019.1 - STULL, R.B. An Introduction to Boundary Layer Meteorology Dordrecht: Springer, 2009.
-
TABASSUM, A.; HONG, S.; PARK, K.; BAIK, J. Impacts of changes in soil moisture on urban heat islands and urban breeze circulations: idealized ensemble simulations. Asia-Pacific Journal of Atmospheric Sciences, v. 60, n. 4, p. 541-553, 2024. doi
» https://doi.org/10.1007/s13143-024-00369-1 -
TAYLOR, K.E. Summarizing multiple aspects of model performance in a single diagram. Journal of Geophysical Research: Atmospheres, v. 106, n. 7, p. 7183-7192, 2001. doi
» https://doi.org/10.1029/2000jd900719 - TEWARI, M.F.; CHEN, F.; WANG, W.; DUDHIA, J. Implementation and verification of the unified NOAH land surface model in the WRF model. 20th Conference on Weather Analysis and Forecasting/16th Conference on Numerical Weather Prediction, p. 11-15, 2004.
- UMEZAKI, A.S. Estudo Numérico das Características da Ilha de Calor Urbana da Região Metropolitana de São Paulo: O Caso de 2014 Dissertação de Mestrado, Escola de Artes, Ciências e Humanidades, Universidade de São Paulo, São Paulo, 2020.
-
UN-Habitat - United Nations Human Settlements Programme. Envisioning Future Cities: World Cities Report 2022 United Nations: New York, 2022. Available at: https://unhabitat.org/world-cities-report-2022-envisaging-the-future-of-cities Acess in: 21 jan. 2025.
» https://unhabitat.org/world-cities-report-2022-envisaging-the-future-of-cities - WILKS, D.S. Statistical Methods in the Atmospheric Sciences International Geophysics Series, v. 91. 2nd. ed. Cambridge: Academic Press, 2006.
- WMO. Guidance on Measuring, Modelling and Monitoring the Canopy Layer Urban Heat Island (CL‑UHI) - WMO-No. 1292 Geneva: World Meteorological Organization, 2023.
Edited by
-
Editor-in-Chief:
Carlos Frederico Raupp. https://orcid.org/0000-0001-7225-864X
The data that support the findings of this study are available from the corresponding author, upon reasonable request.